Article

Effects of Atmospheric CO2 and Temperature on Wheat and Corn Susceptibility to Fusarium graminearum and Deoxynivalenol Contamination

USDA, Agricultural Research Service, National Center for Agricultural Utilization Research, Mycotoxin Prevention and Applied Microbiology Research Unit, 1815 N. University Street, Peoria, IL 61604, USA
*
Author to whom correspondence should be addressed.
Plants 2021, 10(12), 2582; https://doi.org/10.3390/plants10122582
Submission received: 7 November 2021 / Revised: 20 November 2021 / Accepted: 22 November 2021 / Published: 25 November 2021
(This article belongs to the Special Issue Effects of Abiotic Stress on Crop-Fungal Pathogen Interactions)

Abstract

:
This work details the impact of atmospheric CO2 and temperature conditions on two strains of Fusarium graminearum, their disease damage, pathogen growth, mycotoxin accumulation, and production per unit fungal biomass in wheat and corn. An elevated atmospheric CO2 concentration, 1000 ppm CO2, significantly increased the accumulation of deoxynivalenol in infected plants. Furthermore, growth in cool growing conditions, 20 °C/18 °C, day and night, respectively, resulted in the highest amounts of pathogen biomass and toxin accumulation in both inoculated wheat and corn. Warm temperatures, 25 °C/23 °C, day and night, respectively, suppressed pathogen growth and toxin accumulation, with reductions as great as 99% in corn. In wheat, despite reduced pathogen biomass and toxin accumulation at warm temperatures, the fungal pathogen was more aggressive with greater disease damage and toxin production per unit biomass. Disease outcomes were also pathogen strain specific, with complex interactions between host, strain, and growth conditions. However, we found that atmospheric CO2 and temperature had essentially no significant interactions, except for greatly increased deoxynivalenol accumulation in corn at cool temperatures and elevated CO2. Plants were most susceptible to disease damage at warm and cold temperatures for wheat and corn, respectively. This work helps elucidate the complex interaction between the abiotic stresses and biotic susceptibility of wheat and corn to Fusarium graminearum infection to better understand the potential impact global climate change poses to future food security.

1. Introduction

Fusarium graminearum (F. graminearum) is a devastating mycotoxigenic fungal pathogen that can cause disease in cereal crops such as wheat and corn [1]. The pathogen is particularly destructive due to its production of trichothecene mycotoxins [2]. The trichothecene deoxynivalenol (DON) not only causes plant cell death but is also toxic to animals/humans and can cause vomiting, feed refusal, immunosuppression, and organ damage [3]. DON is a serious food safety concern because it remains stable in harvested grains, and is not destroyed during typical food processing, including cooking, baking, or brewing [4,5]. Thus, heavily contaminated grain must be removed from the food chain resulting in approximately 2 billion dollars in annual agroeconomic losses [6,7].
The severity of Fusarium epidemics and the accumulation of DON in cereal grains are strongly associated with weather, and climate change is predicted to increase the risk of disease in many grain growing regions of the world [8,9]. Infection typically occurs when conditions are warm and wet during flowering and seed fill [10]. However, the impact of weather conditions is also dependent on the F. graminearum isolate causing disease in the crop host.
The optimal temperature for DON production is on average approximately 25 °C, but can vary among different DON producing Fusarium species or F. graminearum isolates which are capable of producing DON at a wide range of temperatures from 15–30 °C [11,12]. In North America there are distinct populations of F. graminearum [13,14]. North American 1 (NA1) represents an endemic genetically diverse population that predominantly produces the trichothecene toxin analog 15-acetyldeoxynivalenol (15ADON). A more homogeneous invasive population, referred to as the North American 2 (NA2) population that produces 3-acetyldeoxynivalenol (3ADON), is thought to be displacing NA1 in certain regions [15]. While relatively few studies have compared the effects of abiotic variables on the different F. graminearum populations, in response to heat or cold treatments NA2 isolates exhibited increased DON production in comparison to NA1 isolates [16]. Additionally, F. graminearum isolates acclimated to elevated carbon dioxide (CO2) became more aggressive to wheat and caused more severe Fusarium head blight (FHB) and DON contamination in comparison to ambient CO2-acclimated isolates [16].
The effects of abiotic variable treatments on disease and mycotoxin accumulation are likely influenced by the medium/host. Changes in wheat nutritional content, due to growth at elevated [CO2], reduced F. graminearum growth but caused strain specific increases in mycotoxin production [17]. At elevated CO2, F. graminearum radial growth was inhibited on artificial media [18], but conversely fungal biomass accumulation increased in infected wheat heads [19]. Additionally, the influence of elevated CO2 on F. graminearum aggressiveness, disease severity, and mycotoxin accumulation was shown to be dependent on both the interacting F. graminearum strain and wheat host variety [16,19,20]. Furthermore, it is well established that wheat and corn plants respond differently to temperature and elevated atmospheric CO2 because they have different photosynthetic systems. Warmer temperatures and elevated CO2 have a greater effect on C3 photosynthetic crops, such as wheat, than C4 photosynthetic crops, such as corn [21]. Unlike C3 crops which have lower photosynthetic efficiency at warmer temperatures or low intracellular concentrations of CO2 due to photorespiration [22], C4 plants have a unique anatomy (Kranz anatomy) which concentrates CO2 within the bundle sheath at the primary site of C4 photosynthesis, effectively eliminating photorespiration regardless of atmospheric temperature and CO2 concentration [23,24]. Thus, due to changes in photosynthetic efficiency, wheat plants typically experience changes in primary metabolism at warmer temperatures and elevated CO2, while corn does not. Thus, altering the pathogen host/growth medium.
Therefore, we hypothesized that it would be essential to include diverse interacting organisms and abiotic factors to fully understand the combined effects on the outcome of F. graminearum disease and mycotoxin contamination potential. To test this hypothesis, we compared disease development and DON contamination in a full-factorial experimental design using two F. graminearum strains (13MN1-6, 12SD6-2 representing an NA1 and NA2 strain, respectively: Table 1), two CO2 concentrations (400 ppm (ambient) and 1000 ppm (elevated)), and two temperature treatments (20 °C/18 °C (cool) and 25 °C/23 °C (warm)) temperature conditions.
Furthermore, we independently conducted these comparisons in two different hosts (wheat and corn). To accommodate the size of the experiment and utilize the same temperature treatments for both crops, we used two model varieties. Apogee is a full-dwarf hard red spring wheat (Triticum aestivum) cultivar developed in collaboration with the National Aeronautics and Space Administration (NASA) for growth in space, but has since also been established as a model wheat cultivar for FHB studies [27,28]. Gaspe Flint is a short season corn (Zea mays) variety originating from Canadian landrace which is adapted to cooler temperatures and has been used experimentally to evaluated Fusarium ear rot [29]. Characterizing the complex interaction between abiotic stress and biotic susceptibility to F. graminearum infection in wheat and corn will help elucidate the potential impact global climate change poses to future food security.

2. Results

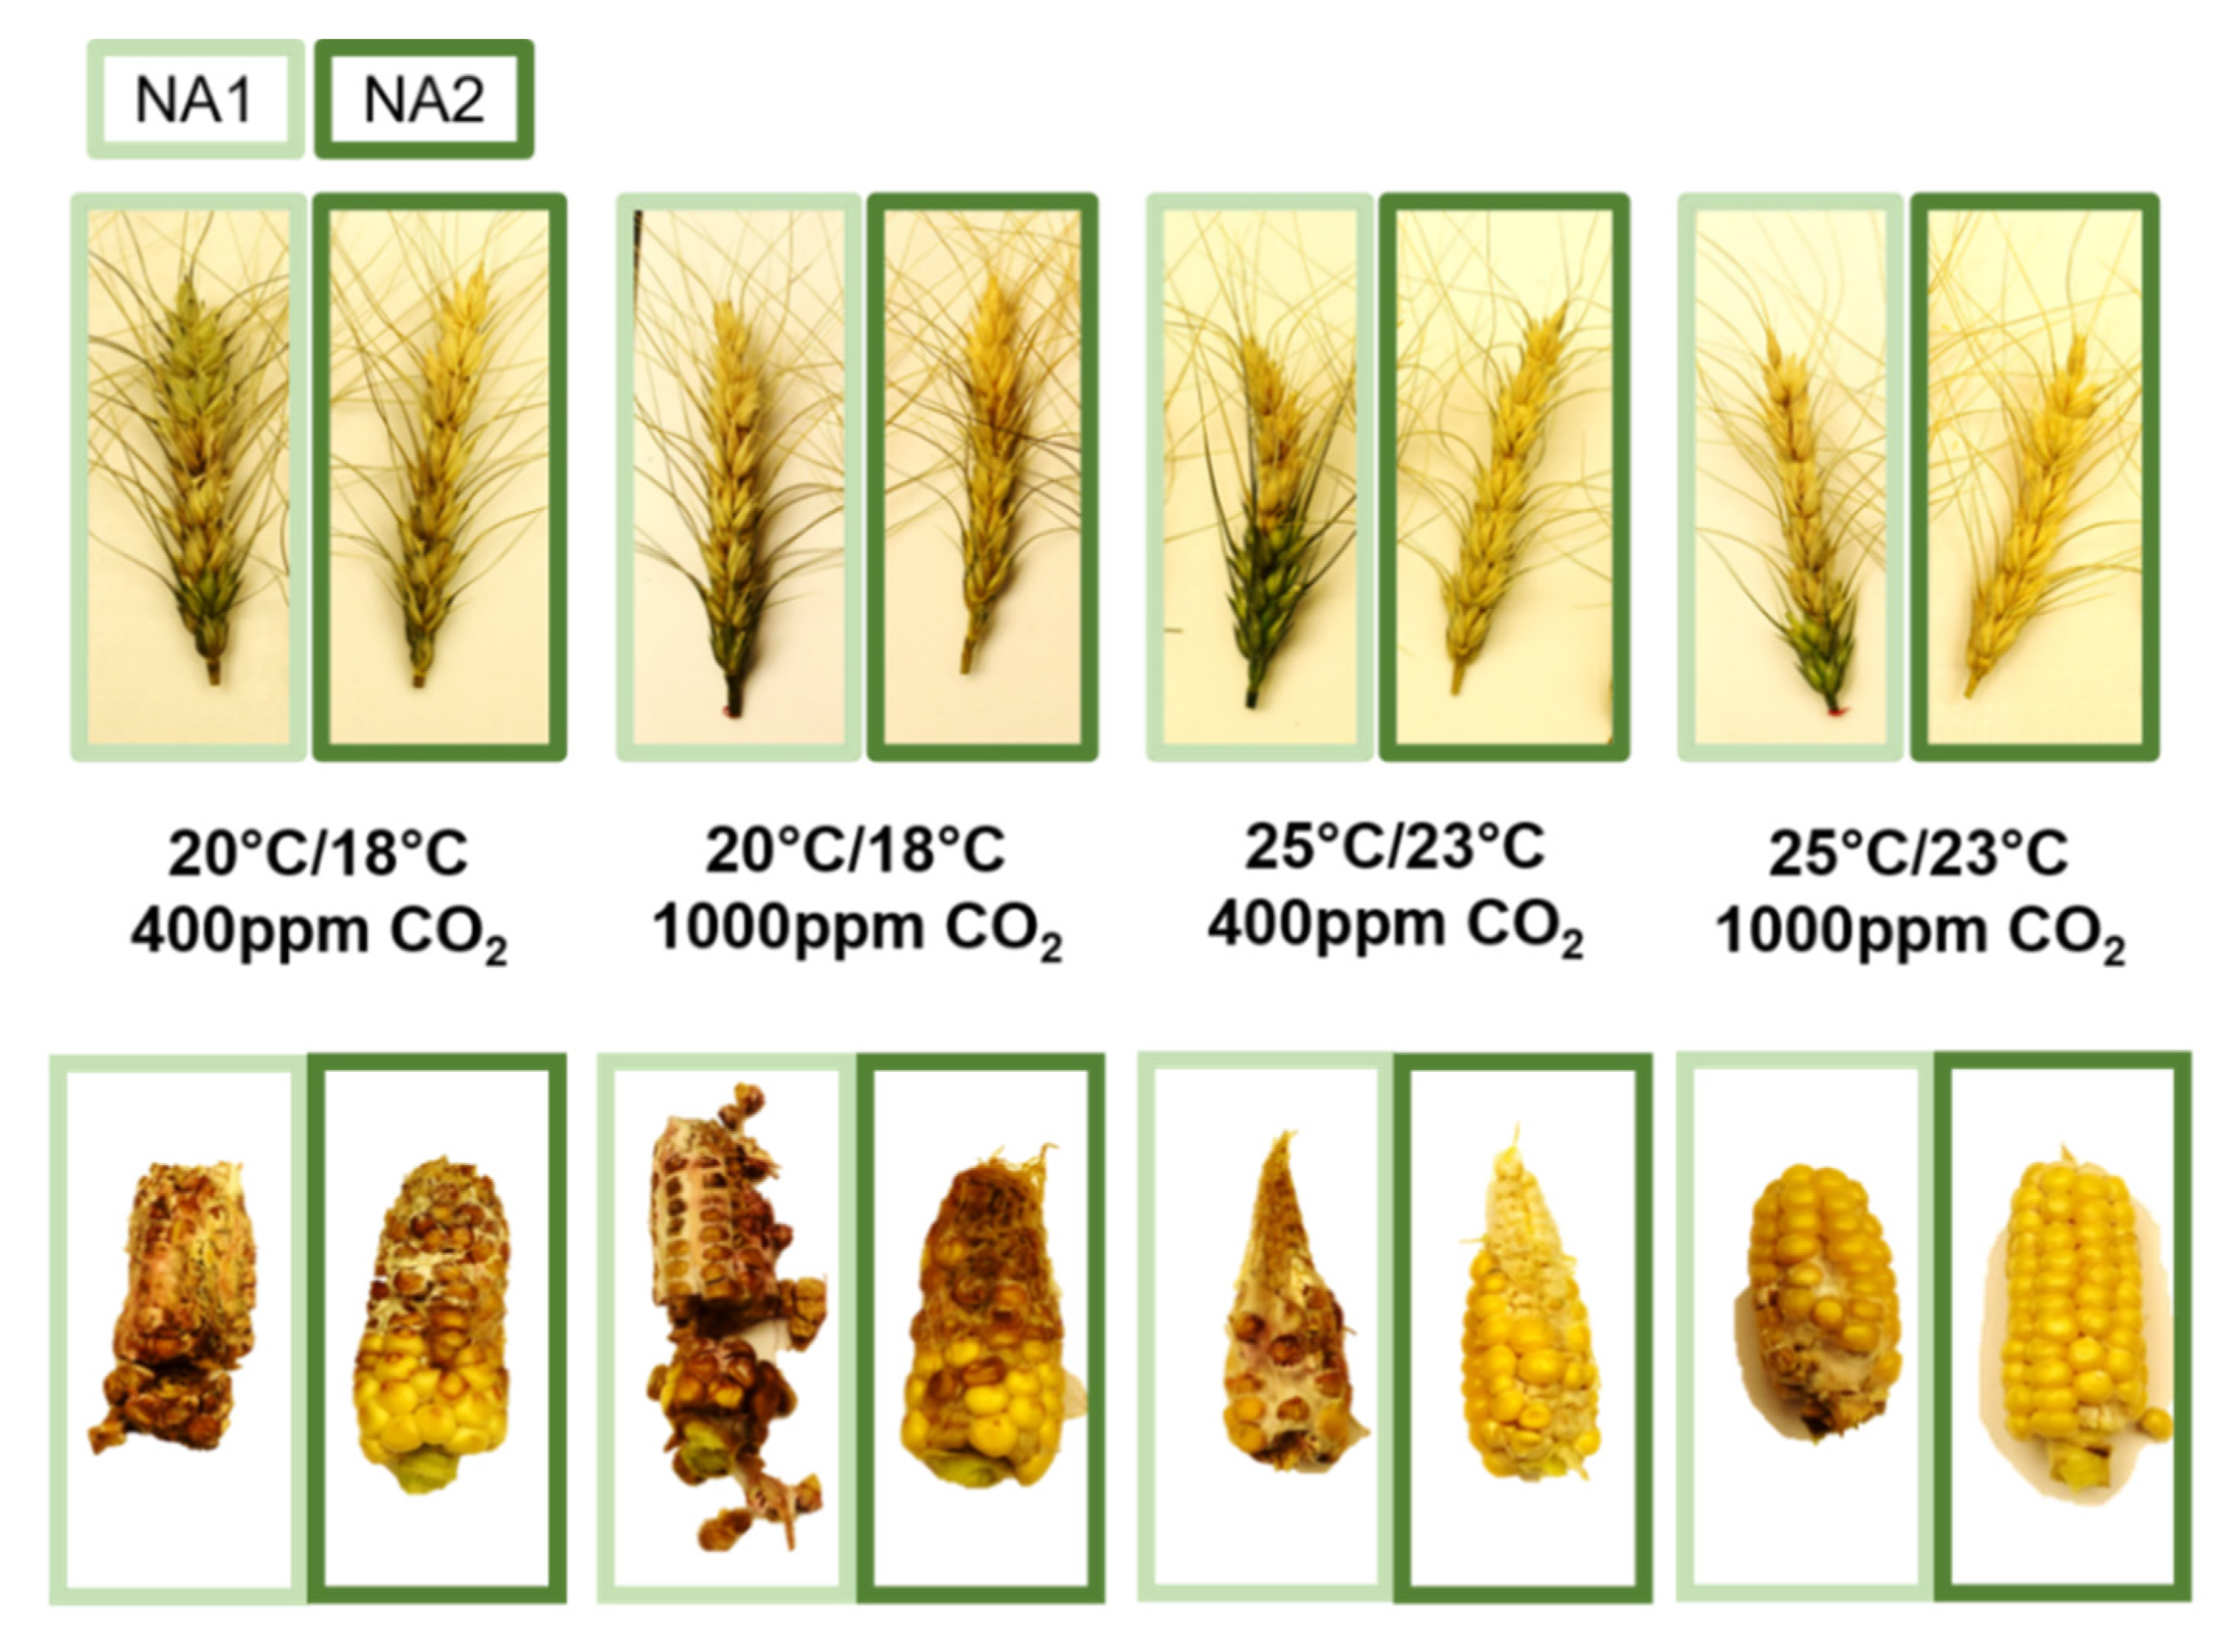
The impact of elevated CO2 and temperature on disease severity was found to be host and pathogen dependent (Figure 1). Additionally, multiple factor interactions were found to influence disease, fungal biomass, mycotoxin accumulation, and toxin production per unit biomass.

2.1. Effects of Elevated CO2 and Temperature on F. graminearum Disease Severity in Wheat

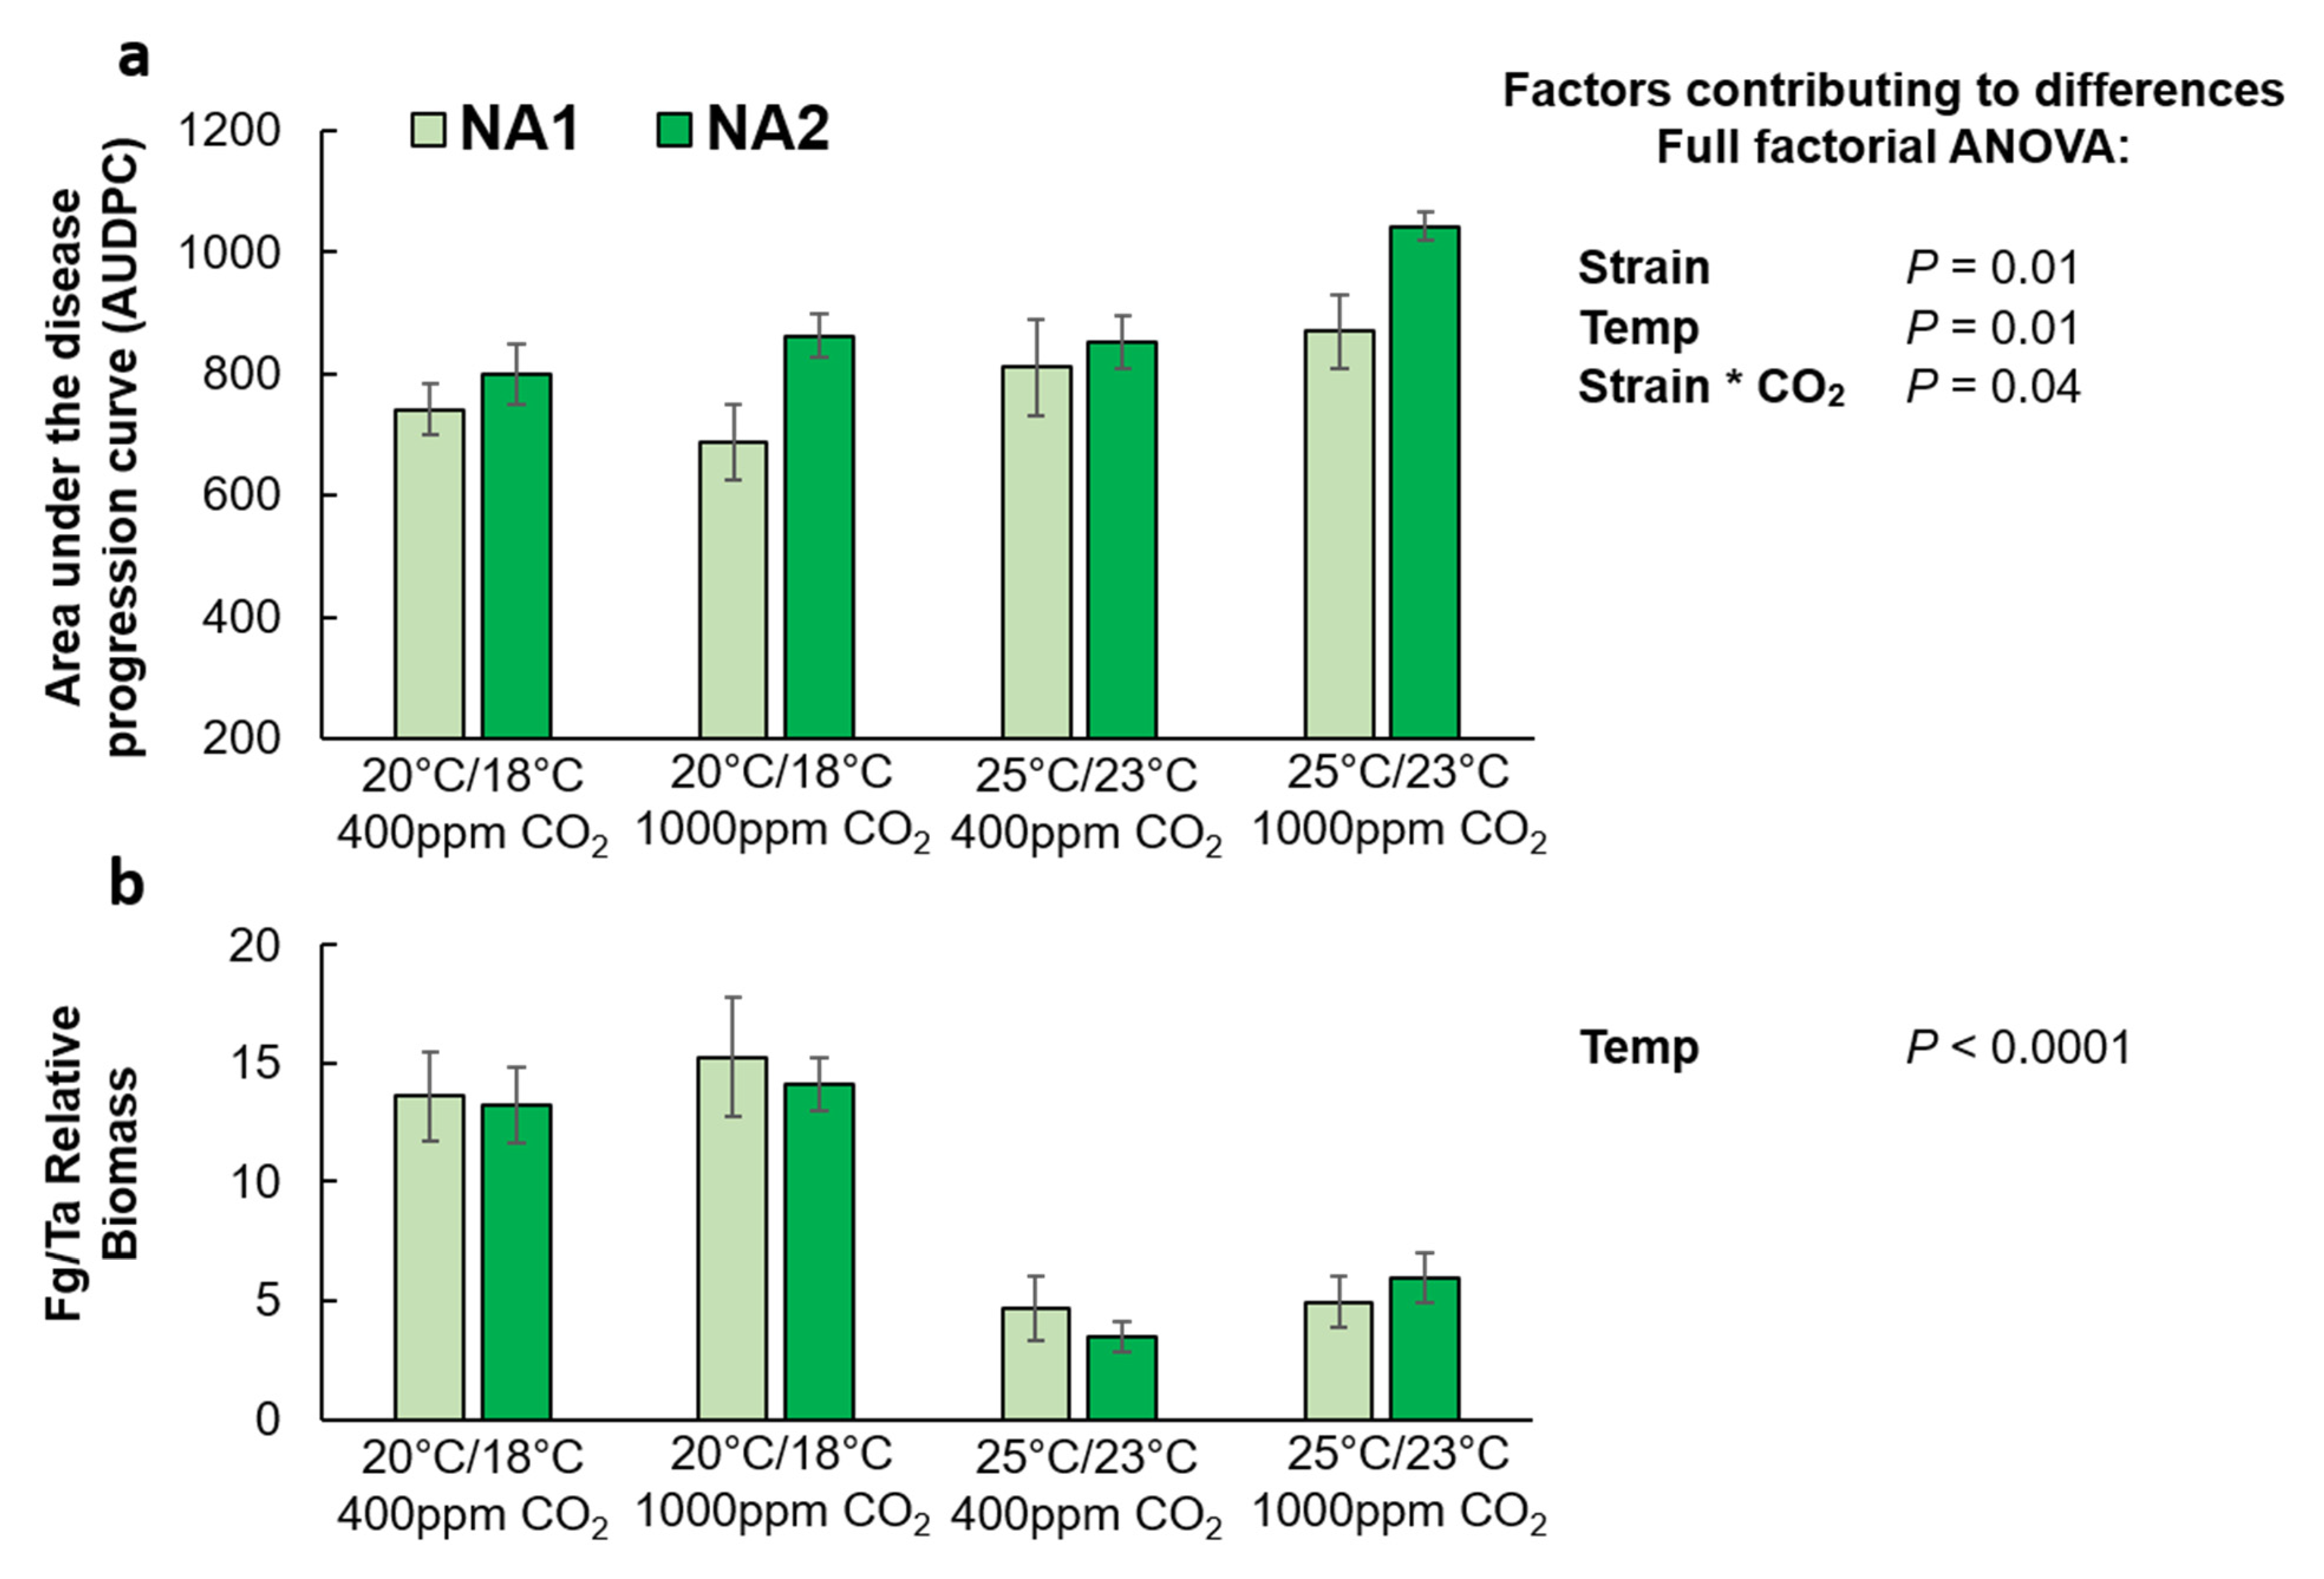
According to the 2 (temperature: 20 °C/18 °C and 25 °C/23 °C) × 2 (CO2:400 ppm and 1000 ppm) × 2 (strain: 13MN1-6 and 12SD6-2) full-factorial analysis of variance (ANOVA), significant contributing factors to differences in the area under the disease progression curve (AUDPC) in wheat included strain, temperature, and the interaction between strain and CO2. Visual disease progression was greater for the NA2 (12SD6-2) strain than the NA1 (13MN1-6) strain (p = 0.01; Figure 2a), and the warmer temperature treatment (25 °C/23 °C) resulted in significantly more visual disease symptoms (p = 0.01). Additionally, elevated CO2 significantly increased disease progression for the NA2 strain, but not the NA1 strain (p = 0.04). Interestingly, quantitative polymerase chain reaction (PCR) estimates of relative F. graminearum DNA to wheat DNA (designated as Fg/Ta relative biomass or Fg biomass) did not correspond with visual disease. Only temperature was a significant contributing factor, and F. graminearum biomass was 2 to 3.5-fold higher at the cool temperature treatment (20 °C/18 °C) in comparison to the warm treatment (p < 0.0001) (Figure 2b). Elevated CO2 did not affect F. graminearum biomass accumulation in wheat.
Differences in wheat DON contamination levels were significantly affected by strain, temperature, CO2, and the interaction between strain and temperature (Figure 2a). Overall, NA2 inoculated wheat had more DON (p < 0.0001). However, this strain-specific difference was temperature dependent and although on average the NA2 strain resulted in more DON contamination, the difference was only significantly different at the cool temperature treatment (p = 0.03). The warm temperature treatment resulted in significantly less DON contamination (p < 0.0001), and elevated CO2 caused significantly greater DON contamination in inoculated wheat (27%; p = 0.007). Consistent with DON contamination levels, the amount of DON produced per unit fungal biomass for the NA2 strain was 40% more than the NA1 strain (Figure 3b; p = 0.0092). However, both strains had greater DON per unit biomass at the warm temperature treatment (p = 0.0002). There was no significant impact of elevated CO2 on DON production per unit biomass for either of the strains in infected wheat.

2.2. Effects of Elevated CO2 and Temperature on F. graminearum Disease Severity in Corn

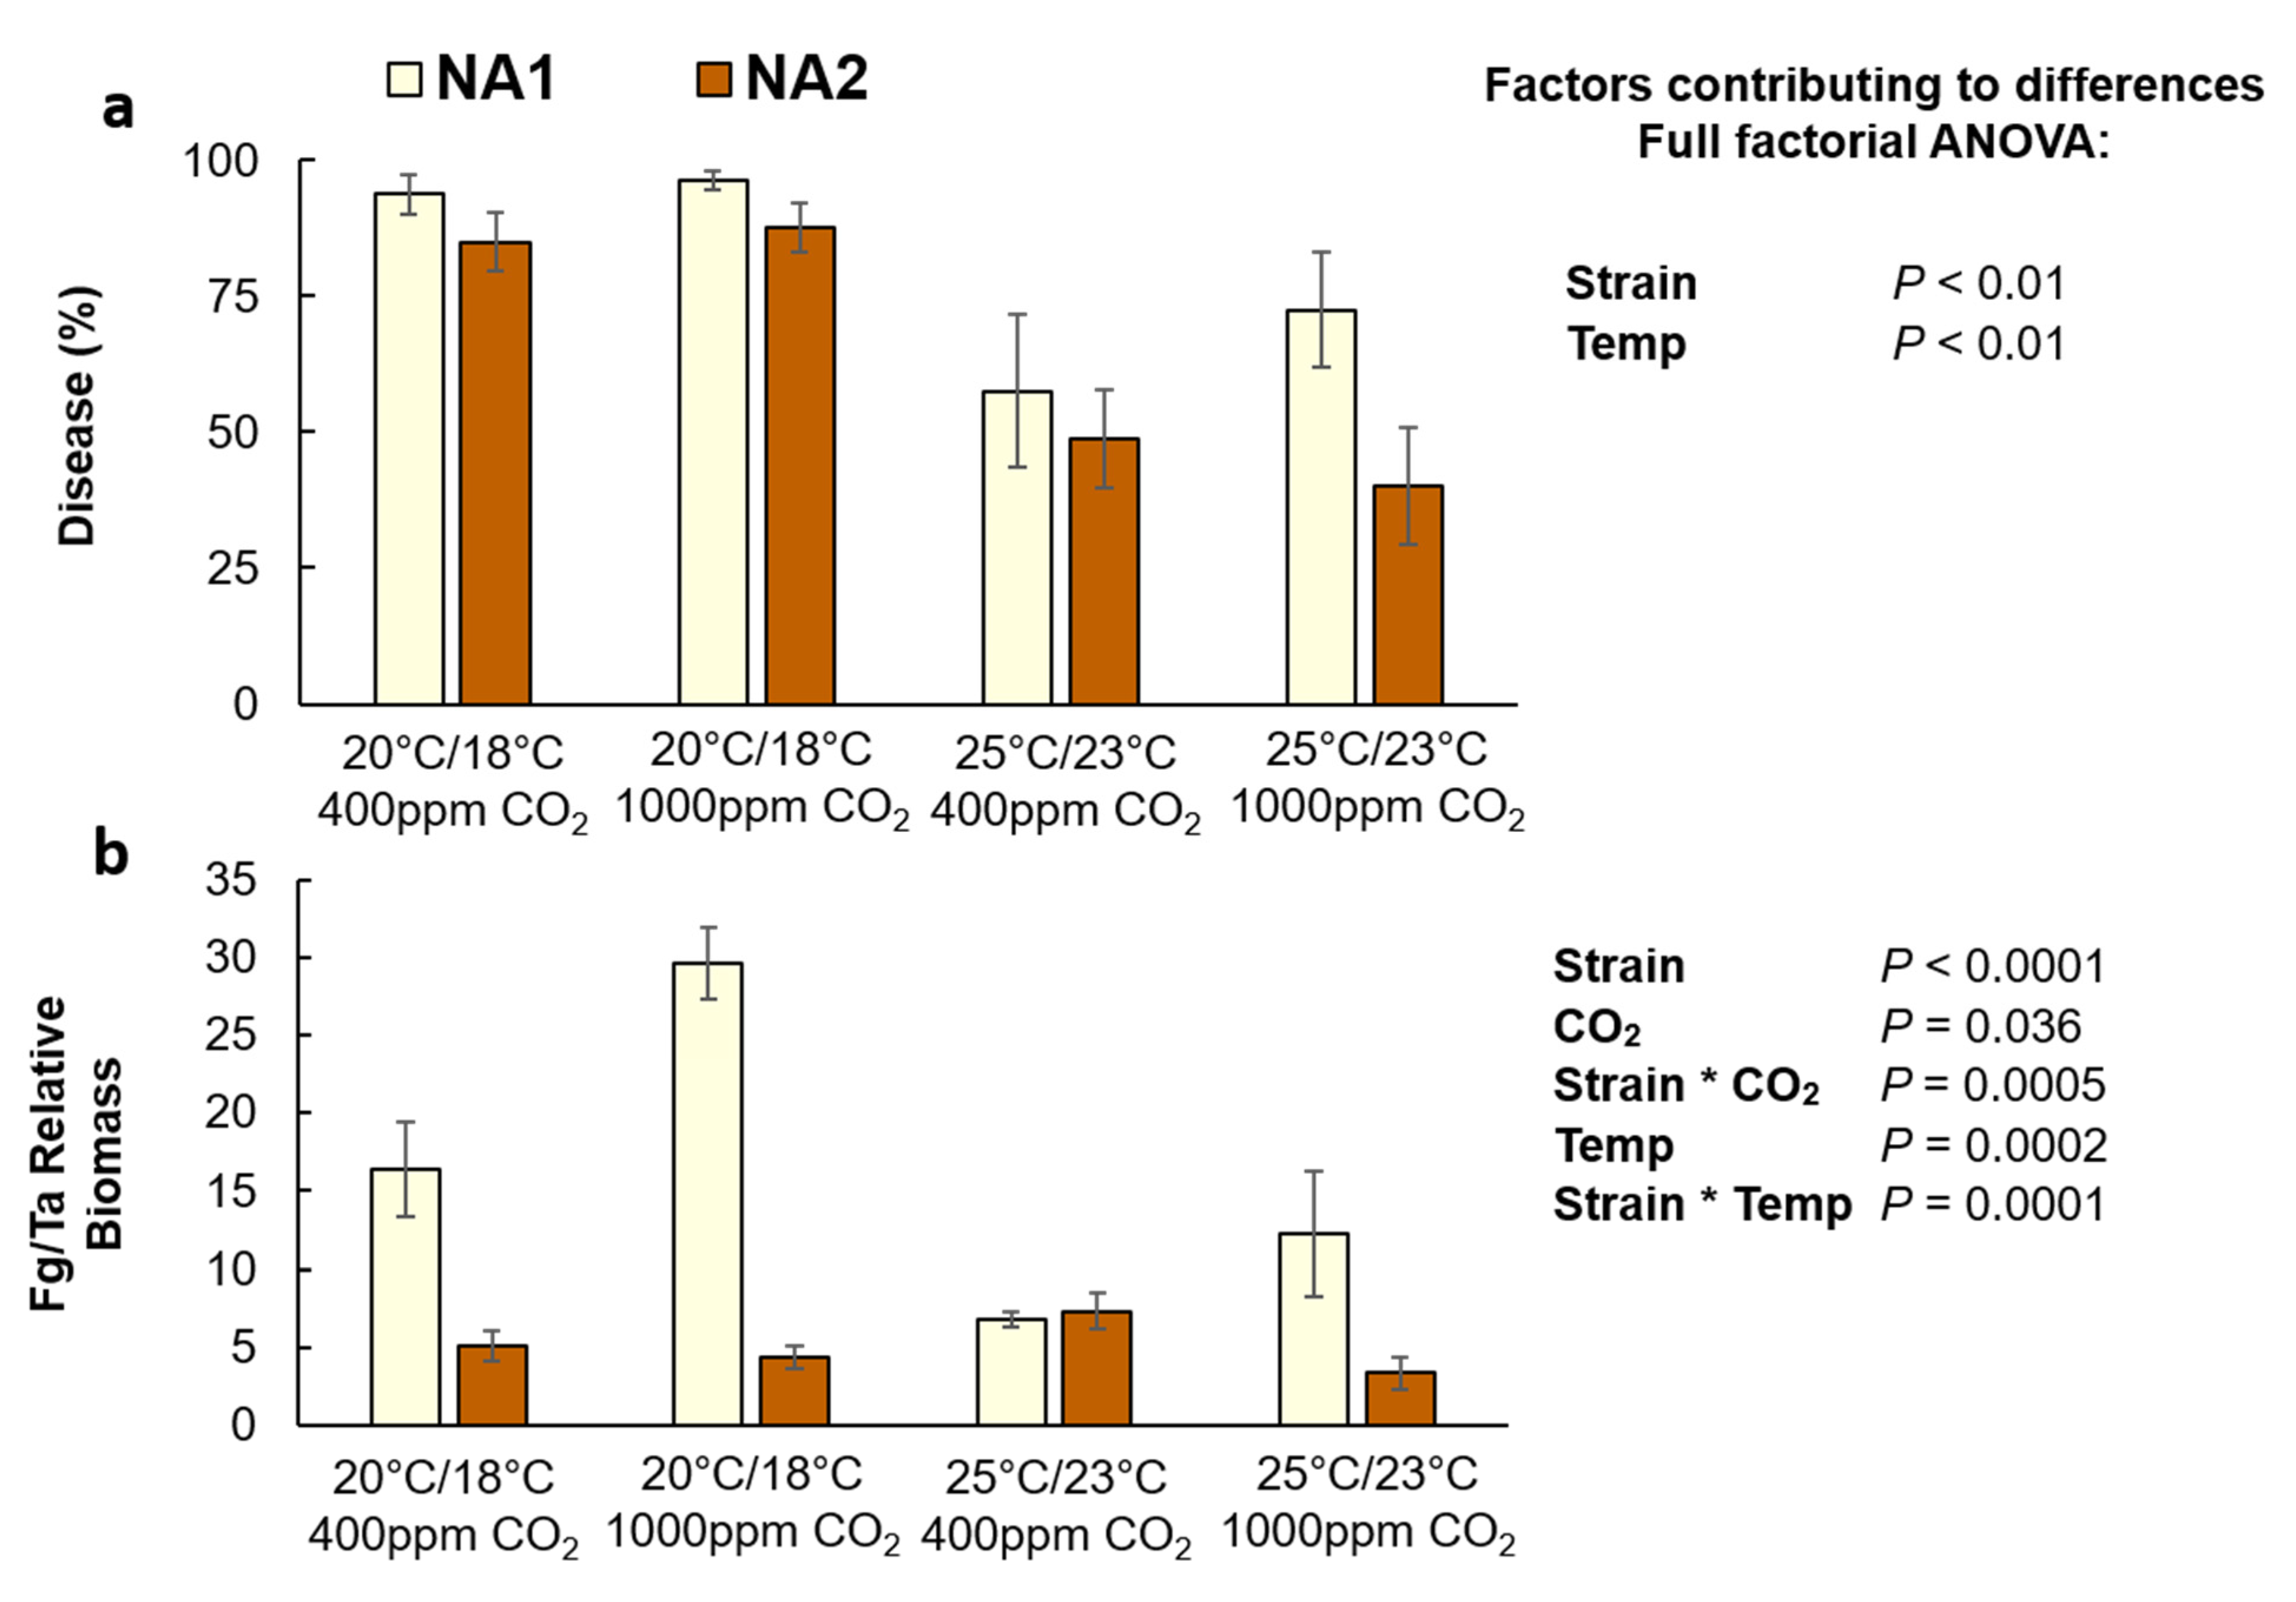
Strain and temperature significantly contributed to visual disease symptoms in corn according to the full-factorial ANOVA (Figure 4a). Unlike in wheat, disease symptoms in corn were 40% less at the warm temperature treatment in comparison to the cool treatment (Figure 4a; p < 0.01). Furthermore, the NA1 strain caused 22% more disease compared to the NA2 strain (p < 0.01), which was the inverse of observations in wheat.
Overall, the relative NA1 biomass was also significantly greater than the NA2 biomass (Figure 4b, p = 0.0001). F. graminearum biomass was also greater at elevated CO2 (p = 0.036), but the effect was dependent on the strain. While the biomass of the NA2 strain was unaffected by elevated CO2, the NA1 fungal biomass nearly doubled at elevated CO2 (p = 0.0005), regardless of temperature treatment. As with disease symptoms, the amount of F. graminearum biomass was 46% less in corn at the warm temperature treatment in comparison to the cool temperature, and the effect of temperature was significantly more severe for the NA1 strain (p = 0.0001).
Factors contributing to a significant difference in corn DON contamination included strain, temperature, CO2, and the interaction between strain and temperature and temperature and CO2 (Figure 5a). DON contamination was significantly higher in corn inoculated with NA1 (p < 0.0001), at the cooler temperature treatment (p < 0.0001), and at elevated CO2 (p = 0.02). The highest amount of DON was in corn at the cool temperature treatment, particularly with the NA1 strain, which produced significantly more DON than the NA2 strain (p < 0.0001). The difference in DON contamination of corn between the temperature treatments was the most dramatic, with DON content being 99% and 94% less at the warmer treatment for the NA1 and NA2 strain, respectively. At elevated CO2, DON contamination was not significantly impacted at the warm temperature treatment but was approximately 1.4 and 23 times greater in cool temperature treated corn inoculated with the NA1 and NA2 strain, respectively (p = 0.03).
Furthermore, DON production per unit F. graminearum biomass was significantly less in corn at the warm temperature treatment (Figure 5b; p = 0.0019). However, neither F. graminearum strain nor CO2 concentration affected DON production per unit biomass in corn.

3. Discussion

Our findings, that elevated CO2 exacerbated Fusarium disease outcomes, are consistent with previous reports. Elevated CO2 was shown to increase disease susceptibility in wheat, resulting in increased disease damage and DON contamination in a host cultivar and pathogen strain dependent manner [8,16,19,20]. Furthermore, elevated CO2 can also significantly alter plant nutritional content, particularly in C3 photosynthetic crops [21,30,31]. Changes in the host nutrient profile may have reduced F. graminearum growth but increased DON per unit biomass, as previously observed in F. graminearum infected grain from wheat grown at elevated CO2 [17]. Our current study found a significant increase of DON contamination in infected wheat that was grown at elevated CO2 (Figure 3). Furthermore, the NA2 strain caused more disease damage at elevated CO2 in wheat, compared with the NA1 strain. The increased aggressiveness of the NA2 strain to elevated CO2 was only observed in inoculated wheat, whereas in corn the NA1 strain had significantly greater fungal biomass in response to elevated CO2 (Figure 4). Differences in corn and wheat disease outcomes are not likely due to F. graminearum strain host origin, as previous studies have shown that F. graminearum strains which were isolated from either wheat or corn had no observable host preference in terms of disease aggressiveness and DON accumulation [13].
Though there was no change in observable disease damage in corn grown at elevated CO2, the amount of DON was greater, particularly at the cool temperature with elevated CO2. While C4 photosynthesis and plant growth benefit little from elevated atmospheric CO2, higher CO2 concentrations have been observed to increase the disease severity of Fusarium verticillioides in corn due to changes in secondary metabolite responses [32]. Interestingly, F. verticillioides increased fungal biomass at elevated CO2 without a corresponding increase in mycotoxin accumulation or production. Herein we show that F. graminearum similarly accumulated greater amounts of fungal biomass in corn at elevated CO2, but this was also accompanied by increased DON contamination (Figure 4 and Figure 5). While elevated CO2 altered DON contamination levels in both wheat and corn, the largest factor in disease outcome and mycotoxin contamination was temperature.
Temperature and humidity are key factors in the likelihood, and severity, of FHB outbreaks and mycotoxin contamination in cereal crops [10]. We consistently found that the warmer temperature treatment suppressed F. graminearum biomass and DON contamination in both wheat and corn. However, at the warmer temperature there was greater visual disease symptoms in wheat. Previous research has shown that visual disease is often poorly correlated with fungal biomass and yield loss in wheat [33]. We further observed strain specific differences in response to temperature, as the NA2 strain was more aggressive and caused more disease symptoms compared to NA1 at warm temperatures (Figure 2a). However, despite greater observable disease severity, the NA2 strain produced less toxins at the warm temperature treatment than in the cool treatment (Figure 3a). In vitro, the optimum temperature for F. graminearum growth has been reported to be 25 °C, with optimal pathogenicity between 20–25 °C; though F. graminearum temperature response was significantly impacted by the geographic origin of the isolate [34]. Interestingly, our current results show that in planta the warmer temperature treatment of 25 °C/23 °C was less optimal than the cool treatment 20 °C/18 °C with respect to F. graminearum biomass accumulation and DON contamination (Figure 2b or Figure 3b). However, despite the reduced pathogen biomass, the overall DON production per unit F. graminearum biomass significantly increased at warmer temperatures in wheat (Figure 3b). This was not the case in corn (Figure 5b), where DON production by F. graminearum was suppressed by 97% in warmer growing conditions, contrary to what was observed in vitro, where the optimal production of DON by F. graminearum on sterilized corn grain was found to be approximately 25 °C [11].
The incongruity between the in vitro and in planta pathogen temperature response suggests a complex host × pathogen interaction. Our results demonstrate that growing temperature has a substantial impact on all aspects of F. graminearum infection in both wheat and corn, as it was the only factor which was significant in every comparison.
The reduction of fungal biomass in corn at elevated temperatures may ultimately be quite beneficial in reducing FHB incidence in wheat. Corn/wheat crop rotations typically result in significant FHB disease incidence, as field corn residues greatly increase the fungal inoculum present during the following wheat growing season [35,36]. Warm temperature not only reduced F. graminearum biomass in corn (Figure 4a), but could further reduce the rate of infection, as the optimal temperature for perithecia formation is 21.7 °C, and formation decreases with increasing temperatures until complete failure above 30 °C [37]. However, changes in climate and temperature can rapidly shift pathogen populations, in corn, F. verticillioides and Aspergillus flavus will outcompete F. graminearum under drier, warmer, growing conditions [38,39]. Therefore, while the reduction in disease, fungal biomass, and DON accumulation at elevated temperatures is promising news, increased growing temperatures could also promote infection by far more dangerous mycotoxigenic fungal pathogens like Aspergillus flavus, which produces carcinogenic aflatoxins [40,41].

4. Materials and Methods

4.1. Wheat and Corn Cultivars and Growth Conditions

Two short-stature, rapidly developing cultivars of wheat and corn were selected for analysis. Apogee seed was kindly provided by Bruce Bugbee at Utah State University [28]. The Gaspe Flint seed [29] was provided by Mark Busman with the USDA ARS Mycotoxin Prevention and Applied Microbiology Unit in Peoria IL. Both cultivars were propagated in a temperature-controlled greenhouse prior to growth chamber experiments.
To evaluate the effects of elevated CO2 and temperature on F. graminearum infection and mycotoxin contamination a 2 × 2 × 2 full factorial experiment was designed with the factors of two temperature treatments (20 °C/18 °C and 25 °C/23 °C), two CO2 concentrations (400 ppm and 1000 ppm), and two F. graminearum strains (13MN1-6 and 12SD6-2). The wheat cultivar Apogee, and the corn cultivar Gaspe Flint, were grown in Conviron PGR15 environmentally controlled growth chambers (Controlled Environments Inc., Winnipeg, MB, Canada). Apogee and Gaspe Flint both grow well under similar control conditions (between 18–25 °C) allowing for simultaneous growth, and the short stature of the Gaspe Flint cultivar was ideal for the limited vertical space within the growth chamber. Eight wheat seeds, or four corn seeds, were sown in a 20 × 15 cm plastic pot, filled with approximately 4 L of SunGrow Horticulture potting mix (Agawam, MA, USA). After one week the plants were culled to 5 plants per pot for wheat, and 2 plants per pot for corn. Growth chamber conditions were set to either ambient CO2 (approximately 400 ppm, a[CO2]) or elevated CO2 (1000 ± 10 ppm, e[CO2]), with 50 ± 10% relative humidity and a 14 h photoperiod (550 μmol m−2 s−1 photosynthetic photon flux density). Chamber temperatures were set to either 20 °C/18 °C, day and night, or 25 °C/23 °C, day and night, respectively. Plants were watered daily, and pot positions were randomized weekly within the growth chamber. Additionally, a biweekly fertilization supplement, using soluble Peters 20-20-20 (The Scotts Company, Marysville, OH, USA) was applied until anthesis, or pollination, for wheat and corn, respectively.

4.2. Inoculations and Disease Evaluation

Two F. graminearum isolates, 13MN1-6 and 12SD6-2, representing an NA1 and NA2 strain [42], respectively, were used to inoculate wheat and corn (Table 1). NA1 isolates produce 15-acetyl-deoxynivalenol (15-ADON) and NA2 isolates produce 3-acetyl-deoxynivalenol (3-ADON) [43], but both of these metabolites are converted into DON within the plant [13,14]. Media preparation and inoculations were performed according to previously reported methodology [19]. In brief, fungal isolates from glycerol stock were grown on V8 agar plates for 7 d before an agar plug was transferred into 20 mL of mung bean broth to promote conidia formation. Cultures were grown for 48 h, at 28 °C, under dark conditions in a New Brunswick Innova 44 incubator shaker (Eppendorf, Hauppauge, NY, USA). The cultures were briefly centrifuged, and the supernatant discarded. Afterwards, a 1 × 10⁵ mL−1 microconidia suspension was produced by the addition of 0.04% Tween 20 in sterile water (Thermo Fisher Scientific, Waltham, MA, USA), and subsequently used for inoculations.
Apogee was inoculated at flowering, anthesis, with 10 µL of the conidial suspension into single florets (biological replicates: n = 12) following previously reported methodology [44]. Immediately afterwards, a plastic bag was placed onto the inoculated wheat heads to maintain a high humidity environment for 3 d. Disease progression and the AUDPC in Apogee was determined by visually assessing the number of diseased florets, bleached or necrotic plant tissue, 7, 10, 14, and 17 days after inoculation [45]. Disease severity in wheat was determined by the ratio of diseased florets to the total florets on the inoculated wheat head. At day 17, the infected wheat heads were collected and stored at −80 °C for further analysis.
Gaspe Flint corn was inoculated 5 d after manual pollination with 1 mL of the conidial suspension into each cob (biological replicates: n = 8) injecting the inoculum into the side of the ear following previously reported methodology [29,32]. Disease severity was visually scored in Gaspe Flint 17 days post inoculation following previously reported protocols [46]. Afterwards, cobs were collected and stored at −80 °C for further analysis. All inoculations and disease evaluations were experimentally replicated.

4.3. Mycotoxin Analyses

Mycotoxins, were extracted from 1 g of ground infected plant tissues, derivatized, and analyzed via GC-MS, on an Agilent 7890 gas chromatograph (Agilent Technologies, Wilmington, DE) fitted with a HP-5MS column (30 m, 0.25 mm, 0.25 μm) and a 5977 mass detector following previously reported methodology [47]. Though the two F. graminearum strains produced two distinct acetylated forms of deoxynivalenol (3-ADON and 15-ADON) in liquid media, in planta the mycotoxin deoxynivalenol (DON) was the overwhelmingly predominant form [26]. Therefore, only the accumulation of the mycotoxin DON in infected plant tissues was evaluated for this manuscript.

4.4. Estimation of Host and Pathogen Biomass

The relative amount of fungal biomass in the inoculated tissues was assessed using the ratio of F. graminearum DNA to plant host DNA via a quantitative polymerase chain reaction (qPCR), following the previously reported protocols [32,45]. Four technical replications were performed per assay; primers and probes can be found in Table 2. The relative amount of F. graminearum DNA to host DNA was determined by dividing the geometric mean of initial DNA concentration (N0) from the Fusarium probes by the geometric mean of N0 from the host probes. The amount of DON relative to F. graminearum DNA was estimated by dividing the µg g−1 DON by the relative pathogen biomass, as quantified by qPCR.

4.5. Statistical Analyses

Results were evaluated by a 2 × 2 × 2 full factorial analysis of variance (α = 0.05; JMP V15.0), to determine the significant differences in the disease and mycotoxin contamination of hosts due to the effects of temperature and elevated CO2. Data from the wheat and corn hosts were analyzed separately. Details of factor combinations and significant interactions can be found within the figures.

5. Conclusions

Elevated CO2 was determined to significantly increase the accumulation of the mycotoxin deoxynivalenol in infected plants. Furthermore, infected plants in cool growing conditions had the highest amounts of pathogen biomass and toxin accumulation in both wheat and corn. Warm temperatures suppressed pathogen growth and toxin accumulation, with reductions as great as 99% in corn. In wheat, despite reduced pathogen biomass and toxin accumulation at warm temperatures, F. graminearum was more aggressive with greater disease damage and toxin production per unit biomass. However, we found that atmospheric CO2 and temperature had essentially no significant interactions, except for greatly increased deoxynivalenol accumulation in corn at cool temperatures and elevated CO2. This work helps elucidate the complex interaction between abiotic stresses and biotic susceptibility to Fusarium graminearum infection in wheat and corn to better understand the potential impact global climate change poses to future food security.

Supplementary Materials

The following are available online at https://www.mdpi.com/article/10.3390/plants10122582/s1, Figure S1: Interaction plots generated in JMP demonstrating correlations of variables, Figure S2: Interaction plots generated in JMP demonstrating correlations of variables, Figure S3: Interaction plots generated in JMP demonstrating correlations of variables, Figure S4: Interaction plots generated in JMP demonstrating correlations of variables.

Author Contributions

W.T.H. was the primary manuscript author and assisted in the statistical analysis. M.M.V. planned, designed, coordinated the research efforts of the study, and performed the statistical analysis. S.P.M. performed the mycotoxin analysis and assisted in writing and editing the manuscript. All authors have read and agreed to the published version of the manuscript.

Funding

This research received no external funding.

Institutional Review Board Statement

Not applicable.

Informed Consent Statement

Not applicable.

Data Availability Statement

Data presented in this study is available from the corresponding author on reasonable request.

Acknowledgments

We would like to thank Jennifer Teresi and Keegan McConnel for plant care, growth chamber monitoring, FHB inoculations and disease assessment, and Stephanie Folmar for technical assistance with DON analysis. This work was supported by the U.S. Department of Agriculture, Agricultural Research Service.

Conflicts of Interest

This work was funded by the United States Department of Agriculture. Mention of trade names or commercial products in this publication is solely for the purpose of providing specific information and does not imply recommendation or endorsement by the U.S. Department of Agriculture. Authors have no conflicts of interest to declare. USDA is an equal opportunity provider and employer.

References

  1. O’Donnell, K.; Ward, T.J.; Geiser, D.M.; Kistler, H.; Aoki, T. Genealogical concordance between the mating type locus and seven other nuclear genes supports formal recognition of nine phylogenetically distinct species within the Fusarium graminearum clade. Fungal Genet. Biol. 2004, 41, 600–623. [Google Scholar] [CrossRef] [PubMed]
  2. Goswami, R.S.; Kistler, H. Heading for disaster: Fusarium graminearum on cereal crops. Mol. Plant Pathol. 2004, 5, 515–525. [Google Scholar] [CrossRef] [PubMed]
  3. Awad, W.A.; Ghareeb, K.; Dadak, A.; Hess, M.; Böhm, J. Single and Combined Effects of Deoxynivalenol Mycotoxin and a Microbial Feed Additive on Lymphocyte DNA Damage and Oxidative Stress in Broiler Chickens. PLoS ONE 2014, 9, e88028. [Google Scholar] [CrossRef] [PubMed]
  4. Bullerman, L.B.; Bianchini, A. Stability of mycotoxins during food processing. Int. J. Food Microbiol. 2007, 119, 140–146. [Google Scholar] [CrossRef]
  5. Mastanjević, K.; Lukinac, J.; Jukić, M.; Šarkanj, B.; Krstanović, V.; Mastanjević, K. Multi-(myco) toxins in malting and brewing by-products. Toxins 2019, 11, 30. [Google Scholar] [CrossRef] [Green Version]
  6. Wilson, W.; Dahl, B.; Nganje, W. Economic costs of Fusarium Head Blight, scab and deoxynivalenol. World Mycotoxin J. 2018, 11, 291–302. [Google Scholar] [CrossRef]
  7. Mueller, D.S.; Wise, K.A.; Sisson, A.J.; Allen, T.W.; Bergstrom, G.C.; Bosley, D.B.; Bradley, C.A.; Broders, K.D.; Byamukama, E.; Chilvers, M.I.; et al. Corn Yield Loss Estimates Due to Diseases in the United States and Ontario, Canada from 2012 to 2015. Plant Health Prog. 2016, 17, 211–222. [Google Scholar] [CrossRef] [Green Version]
  8. Vaughan, M.; Backhouse, D.; Del Ponte, E. Climate change impacts on the ecology of Fusarium graminearum species complex and susceptibility of wheat to Fusarium head blight: A review. World Mycotoxin J. 2016, 9, 685–700. [Google Scholar] [CrossRef] [Green Version]
  9. Chakraborty, S. Migrate or evolve: Options for plant pathogens under climate change. Glob. Chang. Biol. 2013, 19, 1985–2000. [Google Scholar] [CrossRef]
  10. Brown, N.A.; Urban, M.; van de Meene, A.M.L.; Hammond-Kosack, K.E. The infection biology of Fusarium graminearum: Defining the pathways of spikelet to spikelet colonisation in wheat ears. Fungal Biol. 2010, 114, 555–571. [Google Scholar] [CrossRef]
  11. Martins, M.L.G.; Martins, H.M. Influence of water activity, temperature and incubation time on the simultaneous production of deoxynivalenol and zearalenone in corn (Zea mays) by Fusarium graminearum. Food Chem. 2002, 79, 315–318. [Google Scholar] [CrossRef]
  12. Ramirez, M.L.; Chulze, S.; Magan, N. Temperature and water activity effects on growth and temporal deoxynivalenol production by two Argentinean strains of Fusarium graminearum on irradiated wheat grain. Int. J. Food Microbiol. 2006, 106, 291–296. [Google Scholar] [CrossRef] [PubMed]
  13. Kuhnem, P.R.; Del Ponte, E.M.; Dong, Y.; Bergstrom, G.C. Fusarium graminearum isolates from wheat and maize in New York show similar range of aggressiveness and toxigenicity in cross-species pathogenicity tests. Phytopathology 2015, 105, 441–448. [Google Scholar] [CrossRef] [Green Version]
  14. Guo, H.; Ji, J.; Wang, J.; Sun, X. Deoxynivalenol: Masked forms, fate during food processing, and potential biological remedies. Compr. Rev. Food Sci. Food Saf. 2020, 19, 895–926. [Google Scholar] [CrossRef] [Green Version]
  15. Ward, T.J.; Clear, R.M.; Rooney, A.; O’Donnell, K.; Gaba, D.; Patrick, S.; Starkey, D.E.; Gilbert, J.; Geiser, D.M.; Nowicki, T.W. An adaptive evolutionary shift in Fusarium head blight pathogen populations is driving the rapid spread of more toxigenic Fusarium graminearum in North America. Fungal Genet. Biol. 2008, 45, 473–484. [Google Scholar] [CrossRef] [PubMed]
  16. Váry, Z.; Mullins, E.; McElwain, G.C.; Doohan, F.M. The severity of wheat diseases increases when plants and pathogens are acclimatized to elevated carbon dioxide. Glob. Chang. Biol. 2015, 21, 2661–2669. [Google Scholar] [CrossRef]
  17. Hay, W.T.; McCormick, S.P.; Hojilla-Evangelista, M.P.; Bowman, M.J.; Dunn, R.O.; Teresi, J.M.; Berhow, M.A.; Vaughan, M.M. Changes in wheat nutritional content at elevated [CO2] alter Fusarium graminearum growth and mycotoxin production on grain. J. Agric. Food Chem. 2020, 68, 6297–6307. [Google Scholar] [CrossRef]
  18. Medina, Á.; Rodríguez, A.; Magan, N. Climate change and mycotoxigenic fungi: Impacts on mycotoxin production. Curr. Opin. Food Sci. 2015, 5, 99–104. [Google Scholar] [CrossRef]
  19. Cuperlovic-Culf, M.; Vaughan, M.M.; Vermillion, K.; Surendra, A.; Teresi, J.; McCormick, S. Effects of Atmospheric CO2 Level on the Metabolic Response of Resistant and Susceptible Wheat to Fusarium graminearum Infection. Mol. Plant-Microbe Interactions 2019, 32, 379–391. [Google Scholar] [CrossRef] [Green Version]
  20. Bencze, S.; Puskás, K.; Vida, G.; Karsai, I.; Balla, K.; Komáromi, J.; Veisz, O. Rising atmospheric CO2 concentration may imply higher risk of Fusarium mycotoxin contamination of wheat grains. Mycotoxin Res. 2017, 33, 229–236. [Google Scholar] [CrossRef]
  21. Ainsworth, E.A.; Long, S.P. 30 years of free-air carbon dioxide enrichment (FACE): What have we learned about future crop productivity and its potential for adaptation? Glob. Chang. Biol. 2020, 27, 27–49. [Google Scholar] [CrossRef]
  22. Farquhar, G.D.; Von Caemmerer, S.; Berry, J.A. A biochemical model of photosynthetic CO2 assimilation in leaves of C3 species. Planta 1980, 149, 78–90. [Google Scholar] [CrossRef] [Green Version]
  23. Ehleringer, J.R.; Cerling, T.E.; Helliker, B.R. C 4 photosynthesis, atmospheric CO2, and climate. Oecologia 1997, 112, 285–299. [Google Scholar] [CrossRef] [PubMed]
  24. Sage, R.F.; Sage, T.L.; Kocacinar, F. Photorespiration and the Evolution of C4 Photosynthesis. Annu. Rev. Plant Biol. 2012, 63, 19–47. [Google Scholar] [CrossRef]
  25. Liang, J.M.; Xayamongkhon, H.; Broz, K.; Dong, Y.; McCormick, S.P.; Abramova, S.; Ward, T.J.; Ma, Z.H.; Kistler, H.C. Temporal dynamics and population genetic structure of Fusarium graminearum in the upper Midwestern United States. Fungal Genet. Biol. 2014, 73, 83–92. [Google Scholar] [CrossRef] [PubMed]
  26. Alexander, N.J.; McCormick, S.P.; Waalwijk, C.; van der Lee, T.; Proctor, R.H. The genetic basis for 3-ADON and 15-ADON trichothecene chemotypes in Fusarium. Fungal Genet. Biol. 2011, 48, 485–495. [Google Scholar] [CrossRef] [Green Version]
  27. Mackintosh, C.A.; Garvin, D.F.; Radmer, L.E.; Heinen, S.J.; Muehlbauer, G.J. A model wheat cultivar for transformation to improve resistance to Fusarium Head Blight. Plant Cell Rep. 2006, 25, 313–319. [Google Scholar] [CrossRef]
  28. Bugbee, B.; Koerner, G.; Albrechtsen, R.; Dewey, W.; Clawson, S. Registration of ‘USU-Apogee’ wheat. Crop. Sci. 1997, 37, 626. [Google Scholar] [CrossRef]
  29. Desjardins, A.E.; Busman, M.; Manandhar, G.; Jarosz, A.M.; Manandhar, H.K.; Proctor, R.H. Gibberella ear rot of maize (Zea mays) in Nepal: Distribution of the mycotoxins nivalenol and deoxynivalenol in naturally and experimentally infected maize. J. Agric. Food Chem. 2008, 56, 5428–5436. [Google Scholar] [CrossRef]
  30. Asseng, S.; Martre, P.; Maiorano, A.; Rötter, R.P.; O’Leary, G.J.; Fitzgerald, G.J.; Girousse, C.; Motzo, R.; Giunta, F.; Babar, M.A.; et al. Climate change impact and adaptation for wheat protein. Glob. Chang. Biol. 2018, 25, 155–173. [Google Scholar] [CrossRef] [PubMed] [Green Version]
  31. Högy, P.; Wieser, H.; Köhler, P.; Schwadorf, K.; Breuer, J.; Franzaring, J.; Muntifering, R.; Fangmeier, A. Effects of elevated CO2 on grain yield and quality of wheat: Results from a 3-year free-air CO2 enrichment experiment. Plant Biol. 2009, 11, 60–69. [Google Scholar] [CrossRef] [PubMed]
  32. Vaughan, M.M.; Huffaker, A.; Schmelz, E.; Dafoe, N.J.; Christensen, S.; Sims, J.; Martins, V.F.; Swerbilow, J.; Romero, M.; Alborn, H.T.; et al. Effects of elevated [CO2] on maize defence against mycotoxigenic Fusarium verticillioides. Plant Cell Environ. 2014, 37, 2691–2706. [Google Scholar] [CrossRef]
  33. Brennan, J.M.; Egan, D.; Cooke, B.M.; Doohan, F.M. Effect of temperature on head blight of wheat caused by Fusarium culmorum and F. graminearum. Plant Pathol. 2005, 54, 156–160. [Google Scholar] [CrossRef]
  34. Brennan, J.M.; Fagan, B.; Van Maanen, A.; Cooke, B.M.; Doohan, F. Studies on in vitro Growth and Pathogenicity of European Fusarium Fungi. Eur. J. Plant Pathol. 2003, 109, 577–587. [Google Scholar] [CrossRef]
  35. Schaafsma, A.W.; Tamburic-Ilincic, L.; Hooker, D. Effect of previous crop, tillage, field size, adjacent crop, and sampling direction on airborne propagules of Gibberella zeae/Fusarium graminearum, fusarium head blight severity, and deoxynivalenol accumulation in winter wheat. Can. J. Plant Pathol. 2005, 27, 217–224. [Google Scholar] [CrossRef]
  36. Maiorano, A.; Blandino, M.; Reyneri, A.; Vanara, F. Effects of maize residues on the Fusarium spp. infection and deoxynivalenol (DON) contamination of wheat grain. Crop. Prot. 2008, 27, 182–188. [Google Scholar] [CrossRef]
  37. Manstretta, V.; Rossi, V. Effects of Temperature and Moisture on Development of Fusarium graminearum Perithecia in Maize Stalk Residues. Appl. Environ. Microbiol. 2016, 82, 184–191. [Google Scholar] [CrossRef] [PubMed] [Green Version]
  38. Reid, L.M.; Nicol, R.W.; Ouellet, T.; Savard, M.; Miller, J.D.; Young, J.C.; Stewart, D.W.; Schaafsma, A.W. Interaction of Fusarium graminearum and F. moniliforme in Maize Ears: Disease Progress, Fungal Biomass, and Mycotoxin Accumulation. Phytopathology 1999, 89, 1028–1037. [Google Scholar] [CrossRef] [Green Version]
  39. Szabo, B.; Toth, B.; Toldine, E.T.; Varga, M.; Kovacs, N.; Varga, J.; Kocsube, S.; Palagyi, A.; Bagi, F.; Budakov, D.; et al. A New Concept to Secure Food Safety Standards against Fusarium Species and Aspergillus Flavus and Their Toxins in Maize. Toxins 2018, 10, 372. [Google Scholar] [CrossRef] [Green Version]
  40. Dövényi-Nagy, T.; Rácz, C.; Molnár, K.; Bakó, K.; Szláma, Z.; Jóźwiak, Á.; Farkas, Z.; Pócsi, I.; Dobos, A.C. Pre-Harvest Modelling and Mitigation of Aflatoxins in Maize in a Changing Climatic Environment—A Review. Toxins 2020, 12, 768. [Google Scholar] [CrossRef]
  41. Damianidis, D.; Ortiz, B.V.; Bowen, K.L.; Windham, G.L.; Hoogenboom, G.; Hagan, A.; Knappenberger, T.; Abbas, H.K.; Scully, B.T.; Mourtzinis, S. Minimum temperature, rainfall, and agronomic management impacts on corn grain aflatoxin contamination. Agron. J. 2018, 110, 1697–1708. [Google Scholar] [CrossRef] [Green Version]
  42. Liang, J.; Lofgren, L.; Ma, Z.; Ward, T.J.; Kistler, H. Population Subdivision of Fusarium graminearum from Barley and Wheat in the Upper Midwestern United States at the Turn of the Century. Phytopathology 2015, 105, 1466–1474. [Google Scholar] [CrossRef] [PubMed] [Green Version]
  43. Kelly, A.C.; Clear, R.M.; O’Donnell, K.; McCormick, S.; Turkington, T.K.; Tekauz, A.; Gilbert, J.; Kistler, H.C.; Busman, M.; Ward, T.J. Diversity of Fusarium head blight populations and trichothecene toxin types reveals regional differences in pathogen composition and temporal dynamics. Fungal Genet. Biol. 2015, 82, 22–31. [Google Scholar] [CrossRef]
  44. Vaughan, M.M.; Ward, T.J.; McCormick, S.P.; Orwig, N.; Hay, W.; Proctor, R.; Palmquist, D. Intrapopulation Antagonism Can Reduce the Growth and Aggressiveness of the Wheat Head Blight Pathogen Fusarium graminearum. Phytopathology 2020, 110, 916–926. [Google Scholar] [CrossRef]
  45. Kemp, N.D.; Vaughan, M.M.; McCormick, S.P.; Brown, J.A.; Bakker, M.G. Sarocladium zeae is a systemic endophyte of wheat and an effective biocontrol agent against Fusarium head blight. Biol. Control. 2020, 149, 104329. [Google Scholar] [CrossRef]
  46. Reid, L.M.; Hamilton, R.; Mather, D.E. Screening Maize for Resistance to Gibberella Ear Rot; Agriculture and Agri-Food Canada, Research Branch, Eastern Cereal and Oilseed: Ottawa, ON, Canada, 1996. [Google Scholar]
  47. Bakker, M.G.; McCormick, S.P. Microbial Correlates of Fusarium Load and Deoxynivalenol Content in Individual Wheat Kernels. Phytopathology 2019, 109, 993–1002. [Google Scholar] [CrossRef] [PubMed]
Figure 1. Representative Fusarium graminearum disease severity at elevated carbon dioxide and temperature on Apogee wheat and Gaspe Flint corn 21 and 17 days after inoculation, respectively. Wheat and corn inoculated with the NA1 Plants 10 02582 i003 strain 13MN1-6, and the NA2 Plants 10 02582 i004 strain 12SD6-2.
Plants 10 02582 g001
Figure 2. Disease progression (a) and relative fungal biomass (Fg/Ta) (b) in Fusarium graminearum inoculated Apogee wheat grown at ambient and elevated carbon dioxide and temperatures. Wheat inoculated with the NA1 Plants 10 02582 i003 strain 13MN1-6, and the NA2 Plants 10 02582 i004 strain 12SD6-2 (n = 12). Interaction plots were generation in JMP demonstrating correlations (Supplemental Figure S1).
Plants 10 02582 g002
Figure 3. DON contamination level (a) and DON per unit fungal biomass (Fg) (b) in Fusarium graminearum inoculated Apogee wheat grown at ambient and elevated carbon dioxide and temperature. Wheat inoculated with the NA1 Plants 10 02582 i003 strain 13MN1-6, and the NA2 Plants 10 02582 i004 strain 12SD6-2 (n = 12). Interaction plots were generated in JMP demonstrating correlations (Supplemental Figure S2).
Plants 10 02582 g003
Figure 4. Disease severity (a) and relative fungal biomass (Fg/Ta) (b) in Fusarium graminearum inoculated Gaspe Flint corn grown at ambient and elevated carbon dioxide and temperature. Corn inoculated with the NA1 Plants 10 02582 i005 strain 13MN1-6, and the NA2 Plants 10 02582 i006 strain 12SD6-2 (n = 8). Interaction plots were generated in JMP demonstrating correlations (Supplemental Figure S3).
Plants 10 02582 g004
Figure 5. DON accumulation (a) and DON per unit fungal biomass (Fg) (b) in Fusarium graminearum inoculated Gaspe Flint corn grown at ambient and elevated carbon dioxide and temperature. Corn inoculated with the NA1 Plants 10 02582 i005 strain 13MN1-6, and the NA2 Plants 10 02582 i006 strain 12SD6-2 (n = 8). Interaction plots were generated in JMP demonstrating correlations (Supplemental Figure S4).
Plants 10 02582 g005
Table 1. Fusarium graminearum strains used for inoculations and disease assays. Strains are distinguished from one another by North American population group [25] and mycotoxin chemotype [26].
F. graminearum Strains13MN1-612SD6-2
North American F. graminearum population [25]NA1NA2
Mycotoxin Chemotype [26]15-acetyl-deoxynivalenol
(15-ADON)
3-acetyl-deoxynivalenol
(3-ADON)
Plants 10 02582 i001 Plants 10 02582 i002
Table 2. Primer and probe sequences used for qPCR amplification. Three sets of primers and corresponding probes were used for quantification of relative F. graminearum to wheat, or corn, biomass. Asterisks (*) indicate primer sequences specifically developed for this study.
Primer NameOrganismGene ProductPrimer SequenceReference
Zm.GAPDH ForwardZ. maysGlyceraldehyde-3-phosphate dehydrogenaseCGAGAATAAATGTGGATGGCG*
Zm.GAPDH ReverseZ. maysGlyceraldehyde-3-phosphate dehydrogenaseGCAGGAAGGGAAACAAAAGTG*
Zm.TUB ForwardZ. maysTubulinTCCACATTCATCGGCAACTC*
Zm.TUB ReverseZ. maysTubulinAACTCCATCTCATCCATGCC*
Zm.CYP ForwardZ. maysPeptidyl-prolyl cis-trans isomeraseCGTCCGTTCCTTTGGATCTG*
Zm.CYP ReverseZ. maysPeptidyl-prolyl cis-trans isomeraseGAAACACGAATCAAGCAGAGG*
Fg.Tri101 ForwardF. graminearumTrichothecene 3-O-acetyltransferaseGGACTCTGGGATTACGACTTTG[17]
Fg.Tri101 ReverseF. graminearumTrichothecene 3-O-acetyltransferaseATCAGGCTTCTTGGGCATAAA[17]
Fg.TEF ForwardF. graminearumTranslation elongation factorCAGTCACTAACCACCTGTCAAT[17]
Fg.TEF ReverseF. graminearumTranslation elongation factorAATGGTGATACCACGCTCAC[17]
Fg.RED ForwardF. graminearumReductaseTGACAGCTTTGGTTGTGTTTG[17]
Fg.RED ReverseF. graminearumReductaseCTTGGCTGGAATGAGTCTGT[17]
Ta.Ef1 ForwardT. aestivumElongation factorGATTGACAGGCGATCTGGTAAG[17]
Ta.Ef1 ReverseT. aestivumElongation factorGGCTTGGTGGGAATCATCTT[17]
Ta.Actin ForwardT. aestivumActinCCAAGGCCAACAGAGAGAAA[17]
Ta.Actin ReverseT. aestivumActinGCTGGCATACAAGGACAGAA[17]
Ta.PAL ForwardT. aestivumPhenylalanine ammonia-lyaseGTGTTCTGCGAGGTGATGAA[17]
Ta.PAL ReverseT. aestivumPhenylalanine ammonia-lyaseGTATGAGCTTCCCTCCAAGATG[17]
Publisher’s Note: MDPI stays neutral with regard to jurisdictional claims in published maps and institutional affiliations.