
The Antifungal Activity of Ag/CHI NPs against Rhizoctonia solani Linked with Tomato Plant Health


 , ,
, ,  ,
,  , and
, and 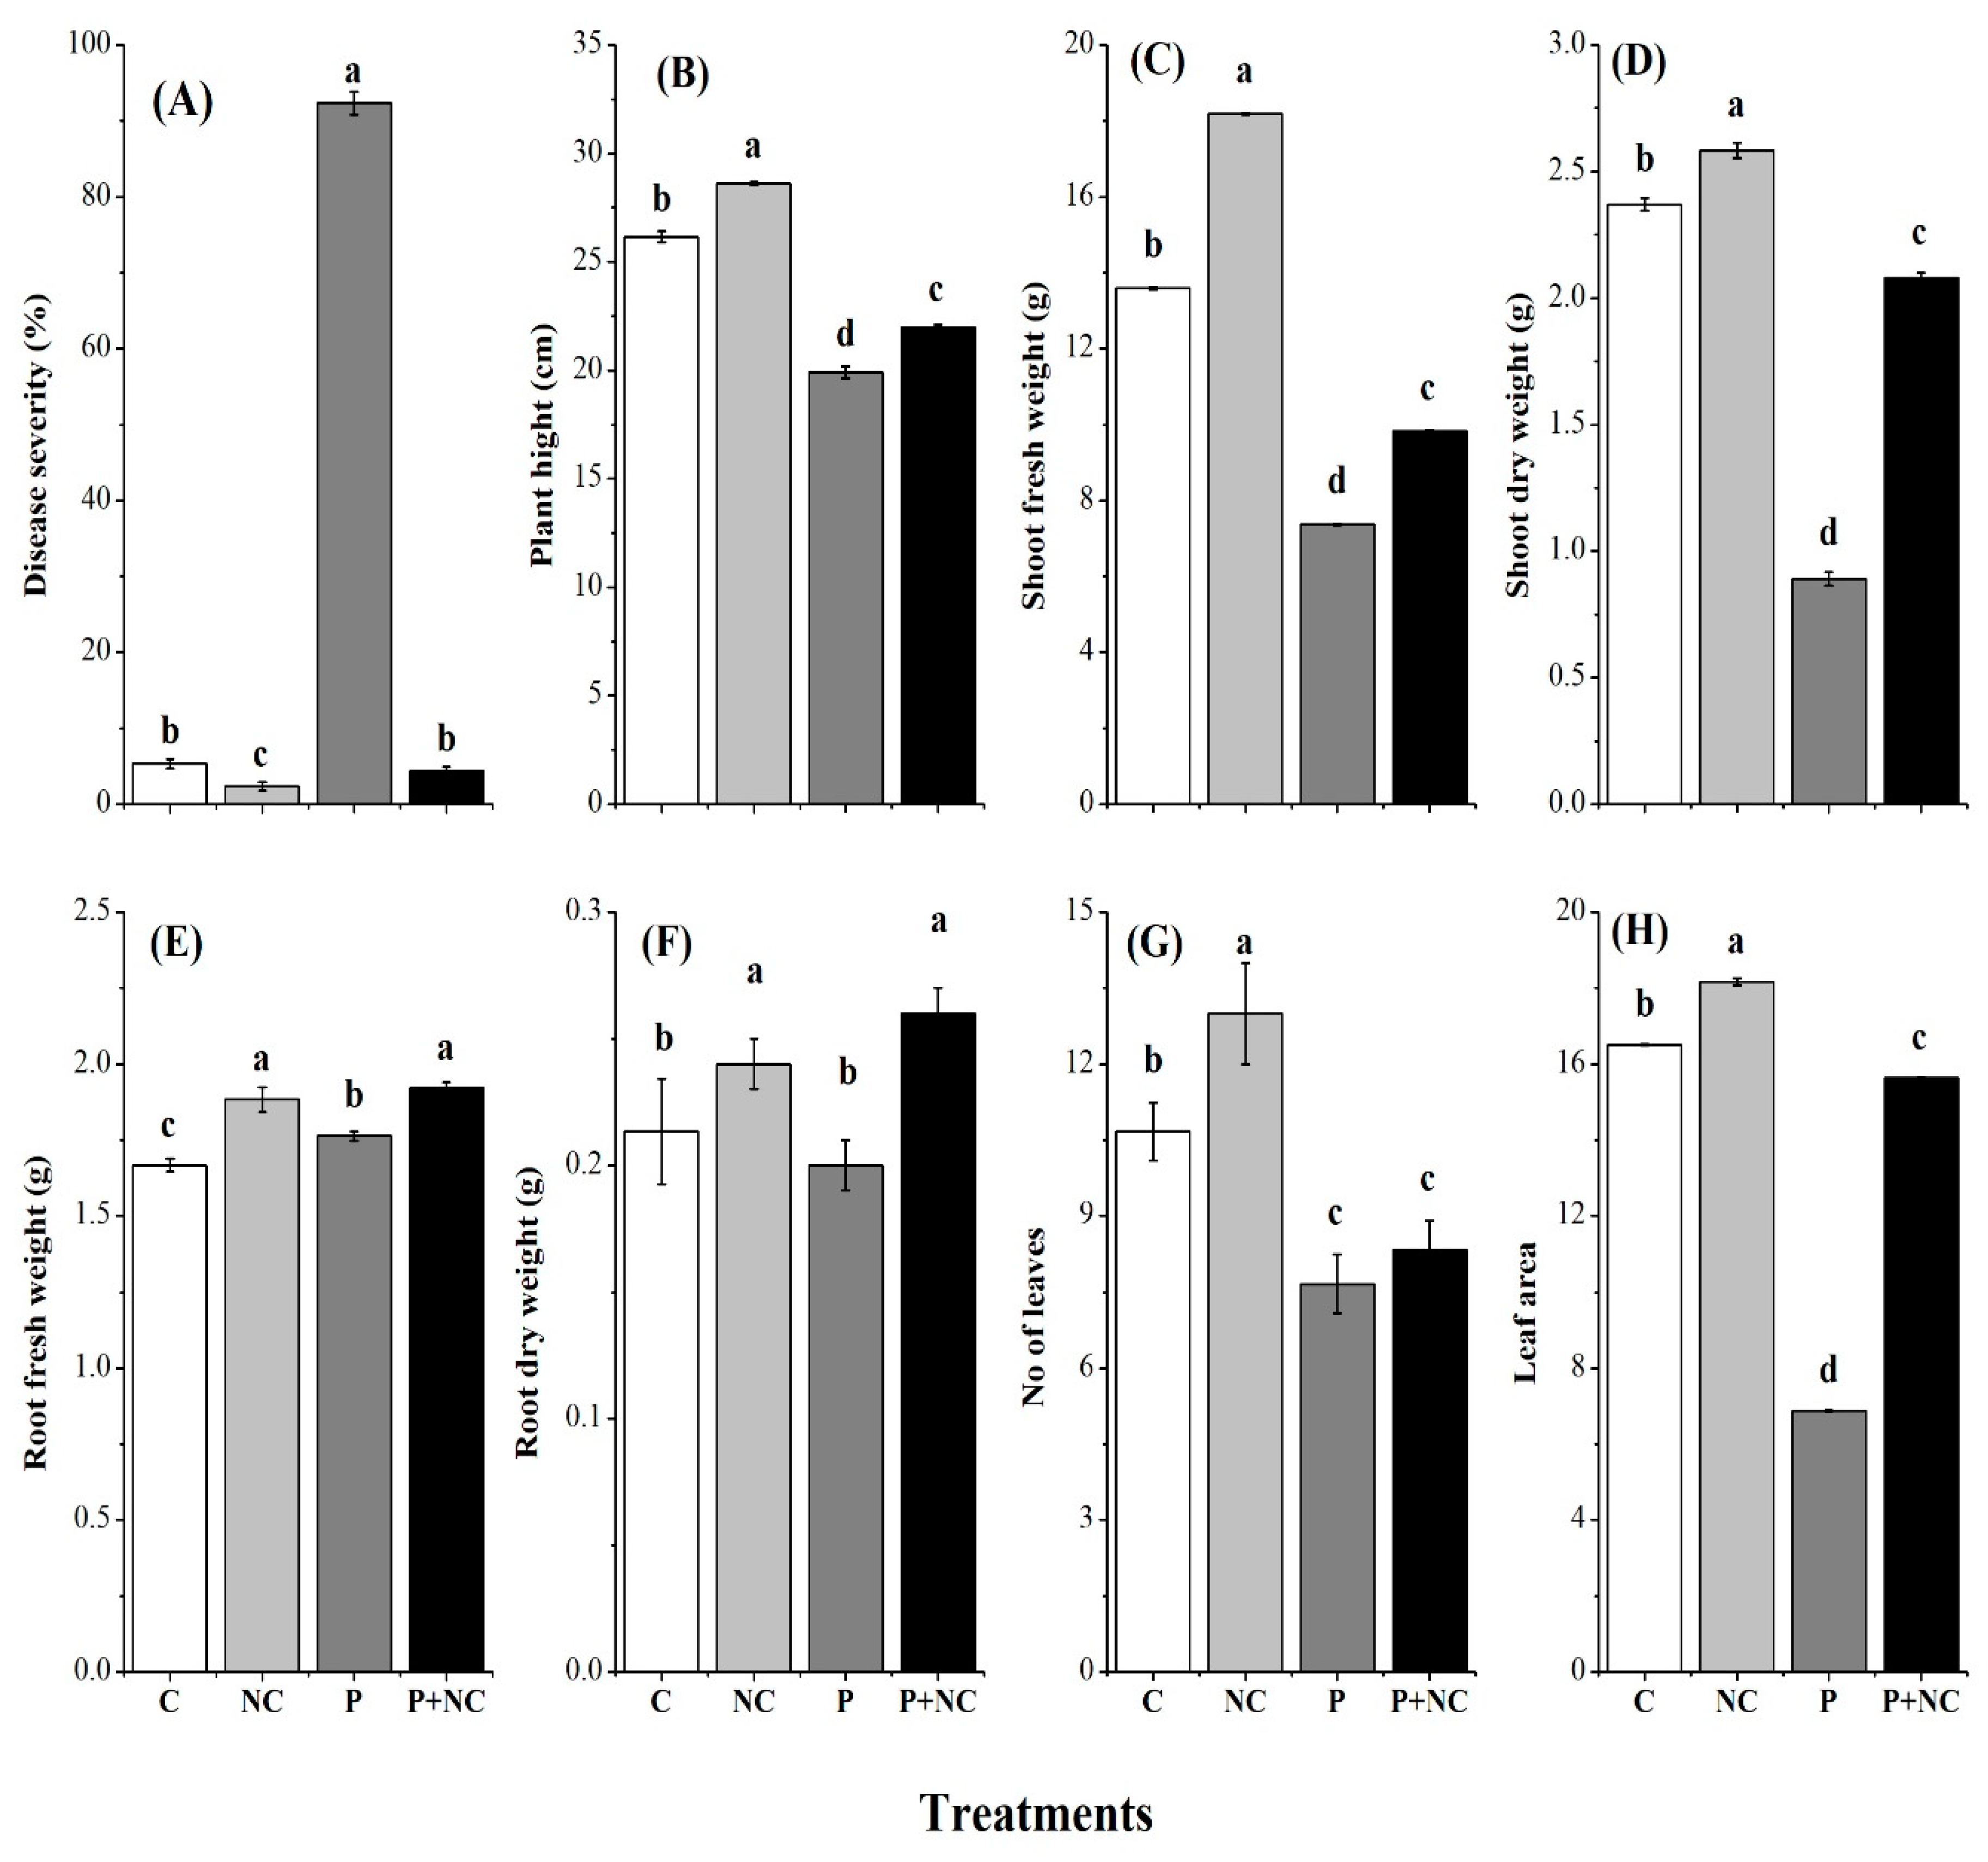
Abstract
1. Introduction
2. Results
2.1. R. solani Is the Cause of Root and Crown Rot Diseases in Tomato Plants
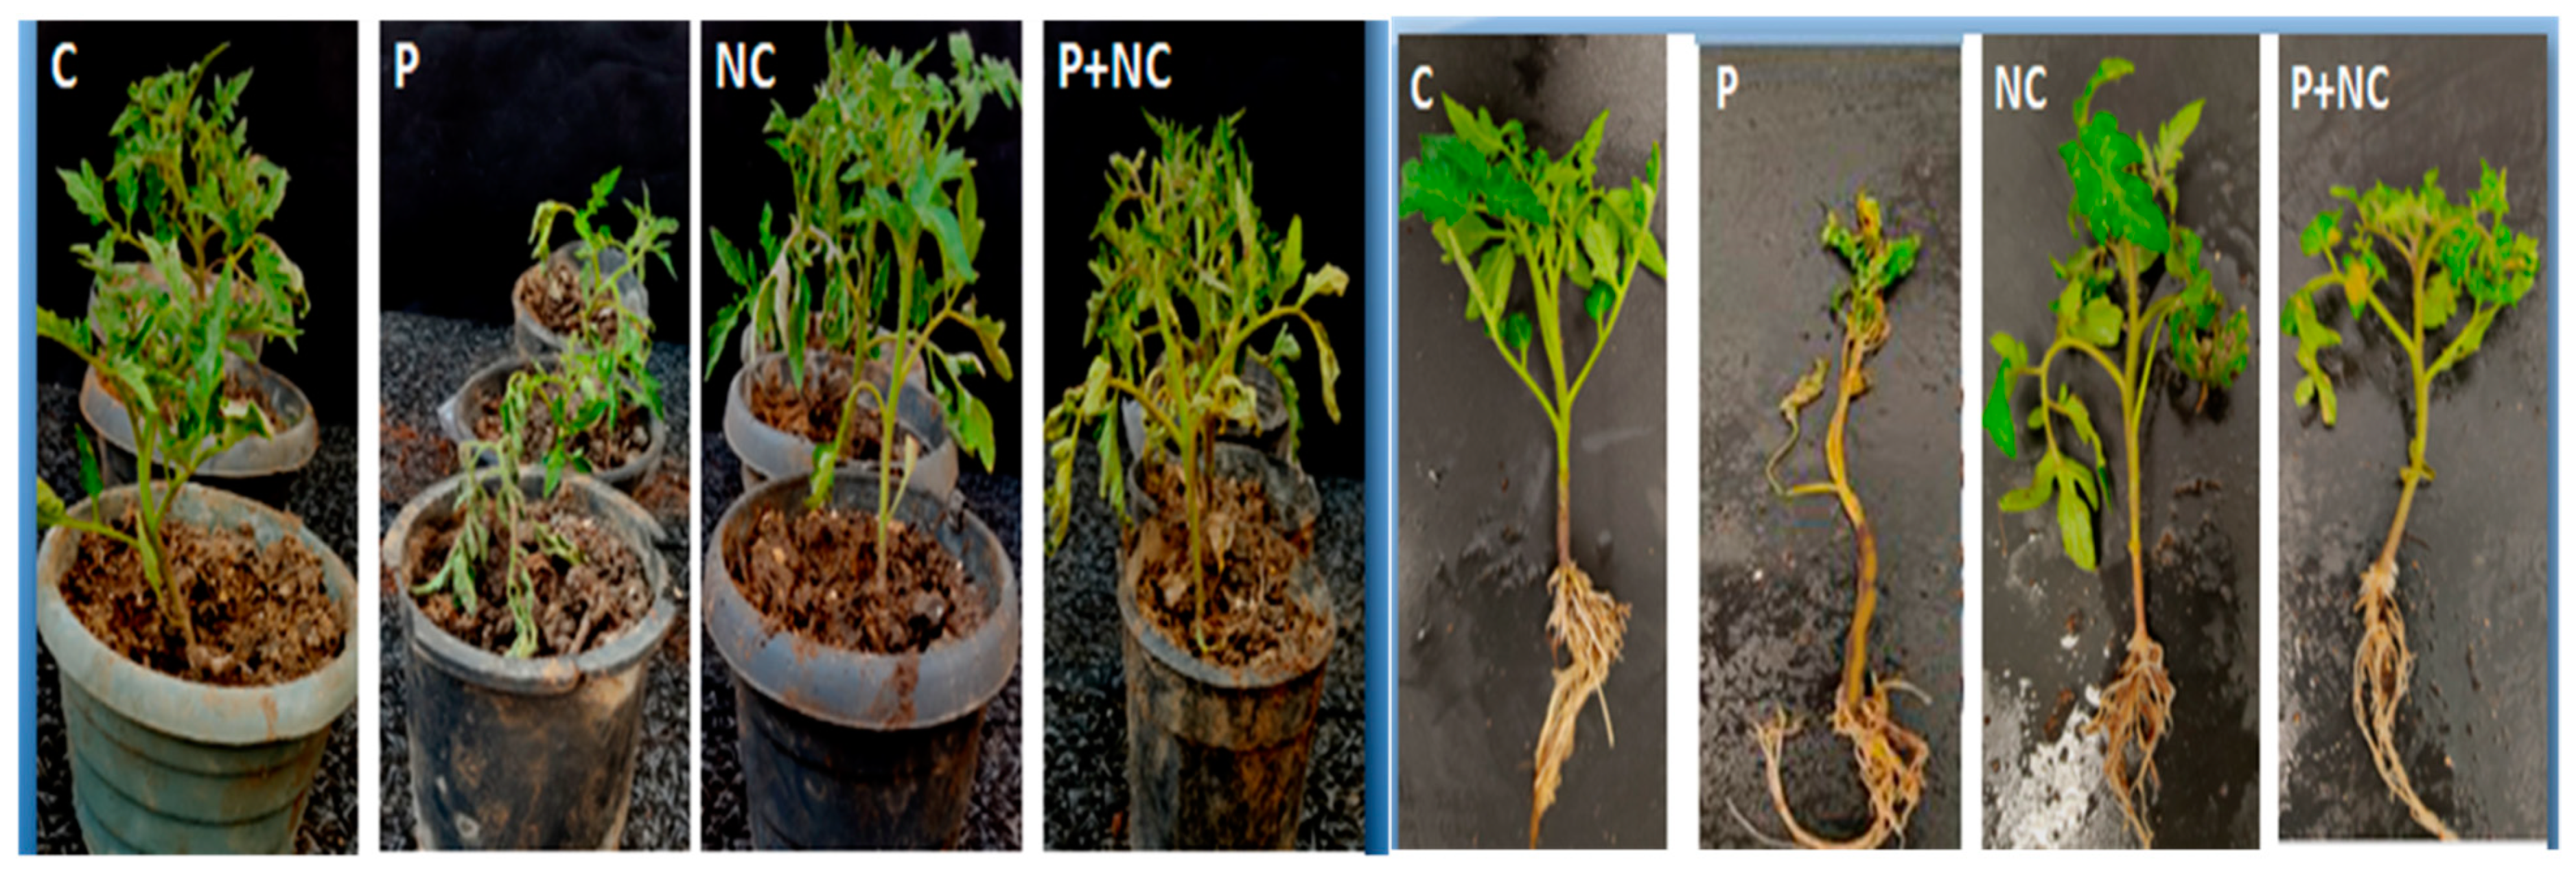
2.2. Physiological Characterizations of Tomato Plants
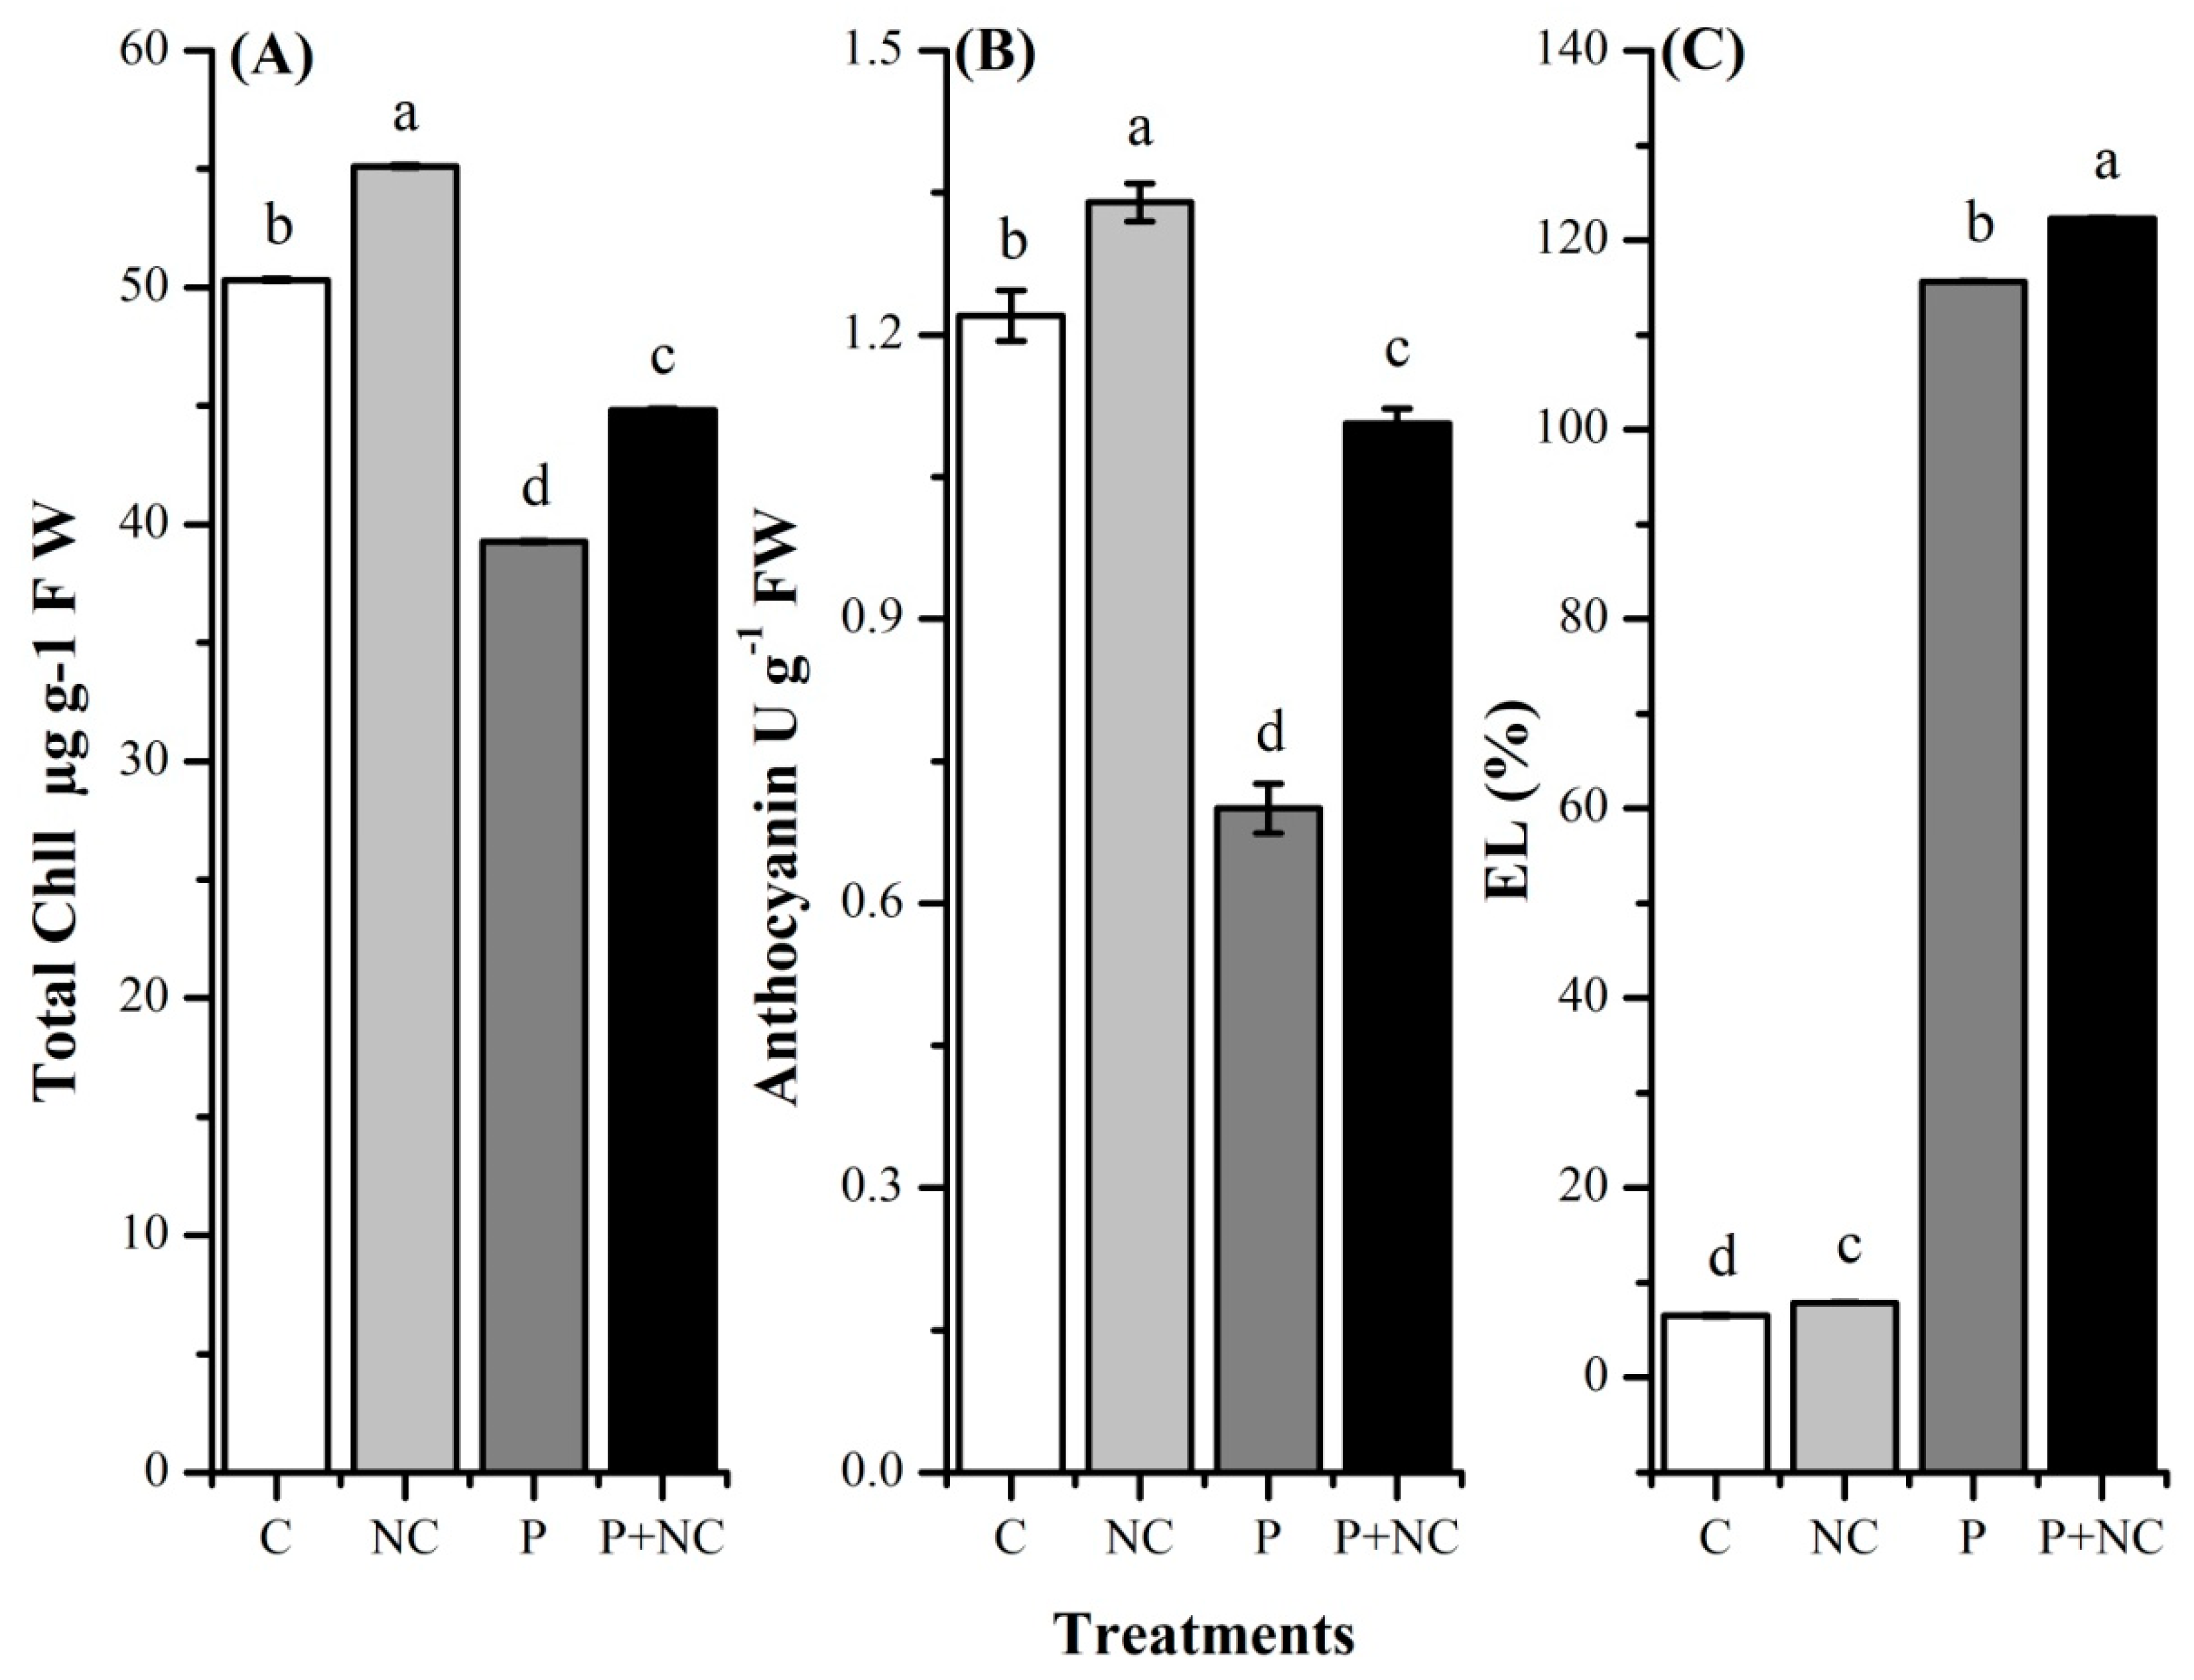
2.3. R. solani Significantly Impacted Plant Photosynthetic Pigments
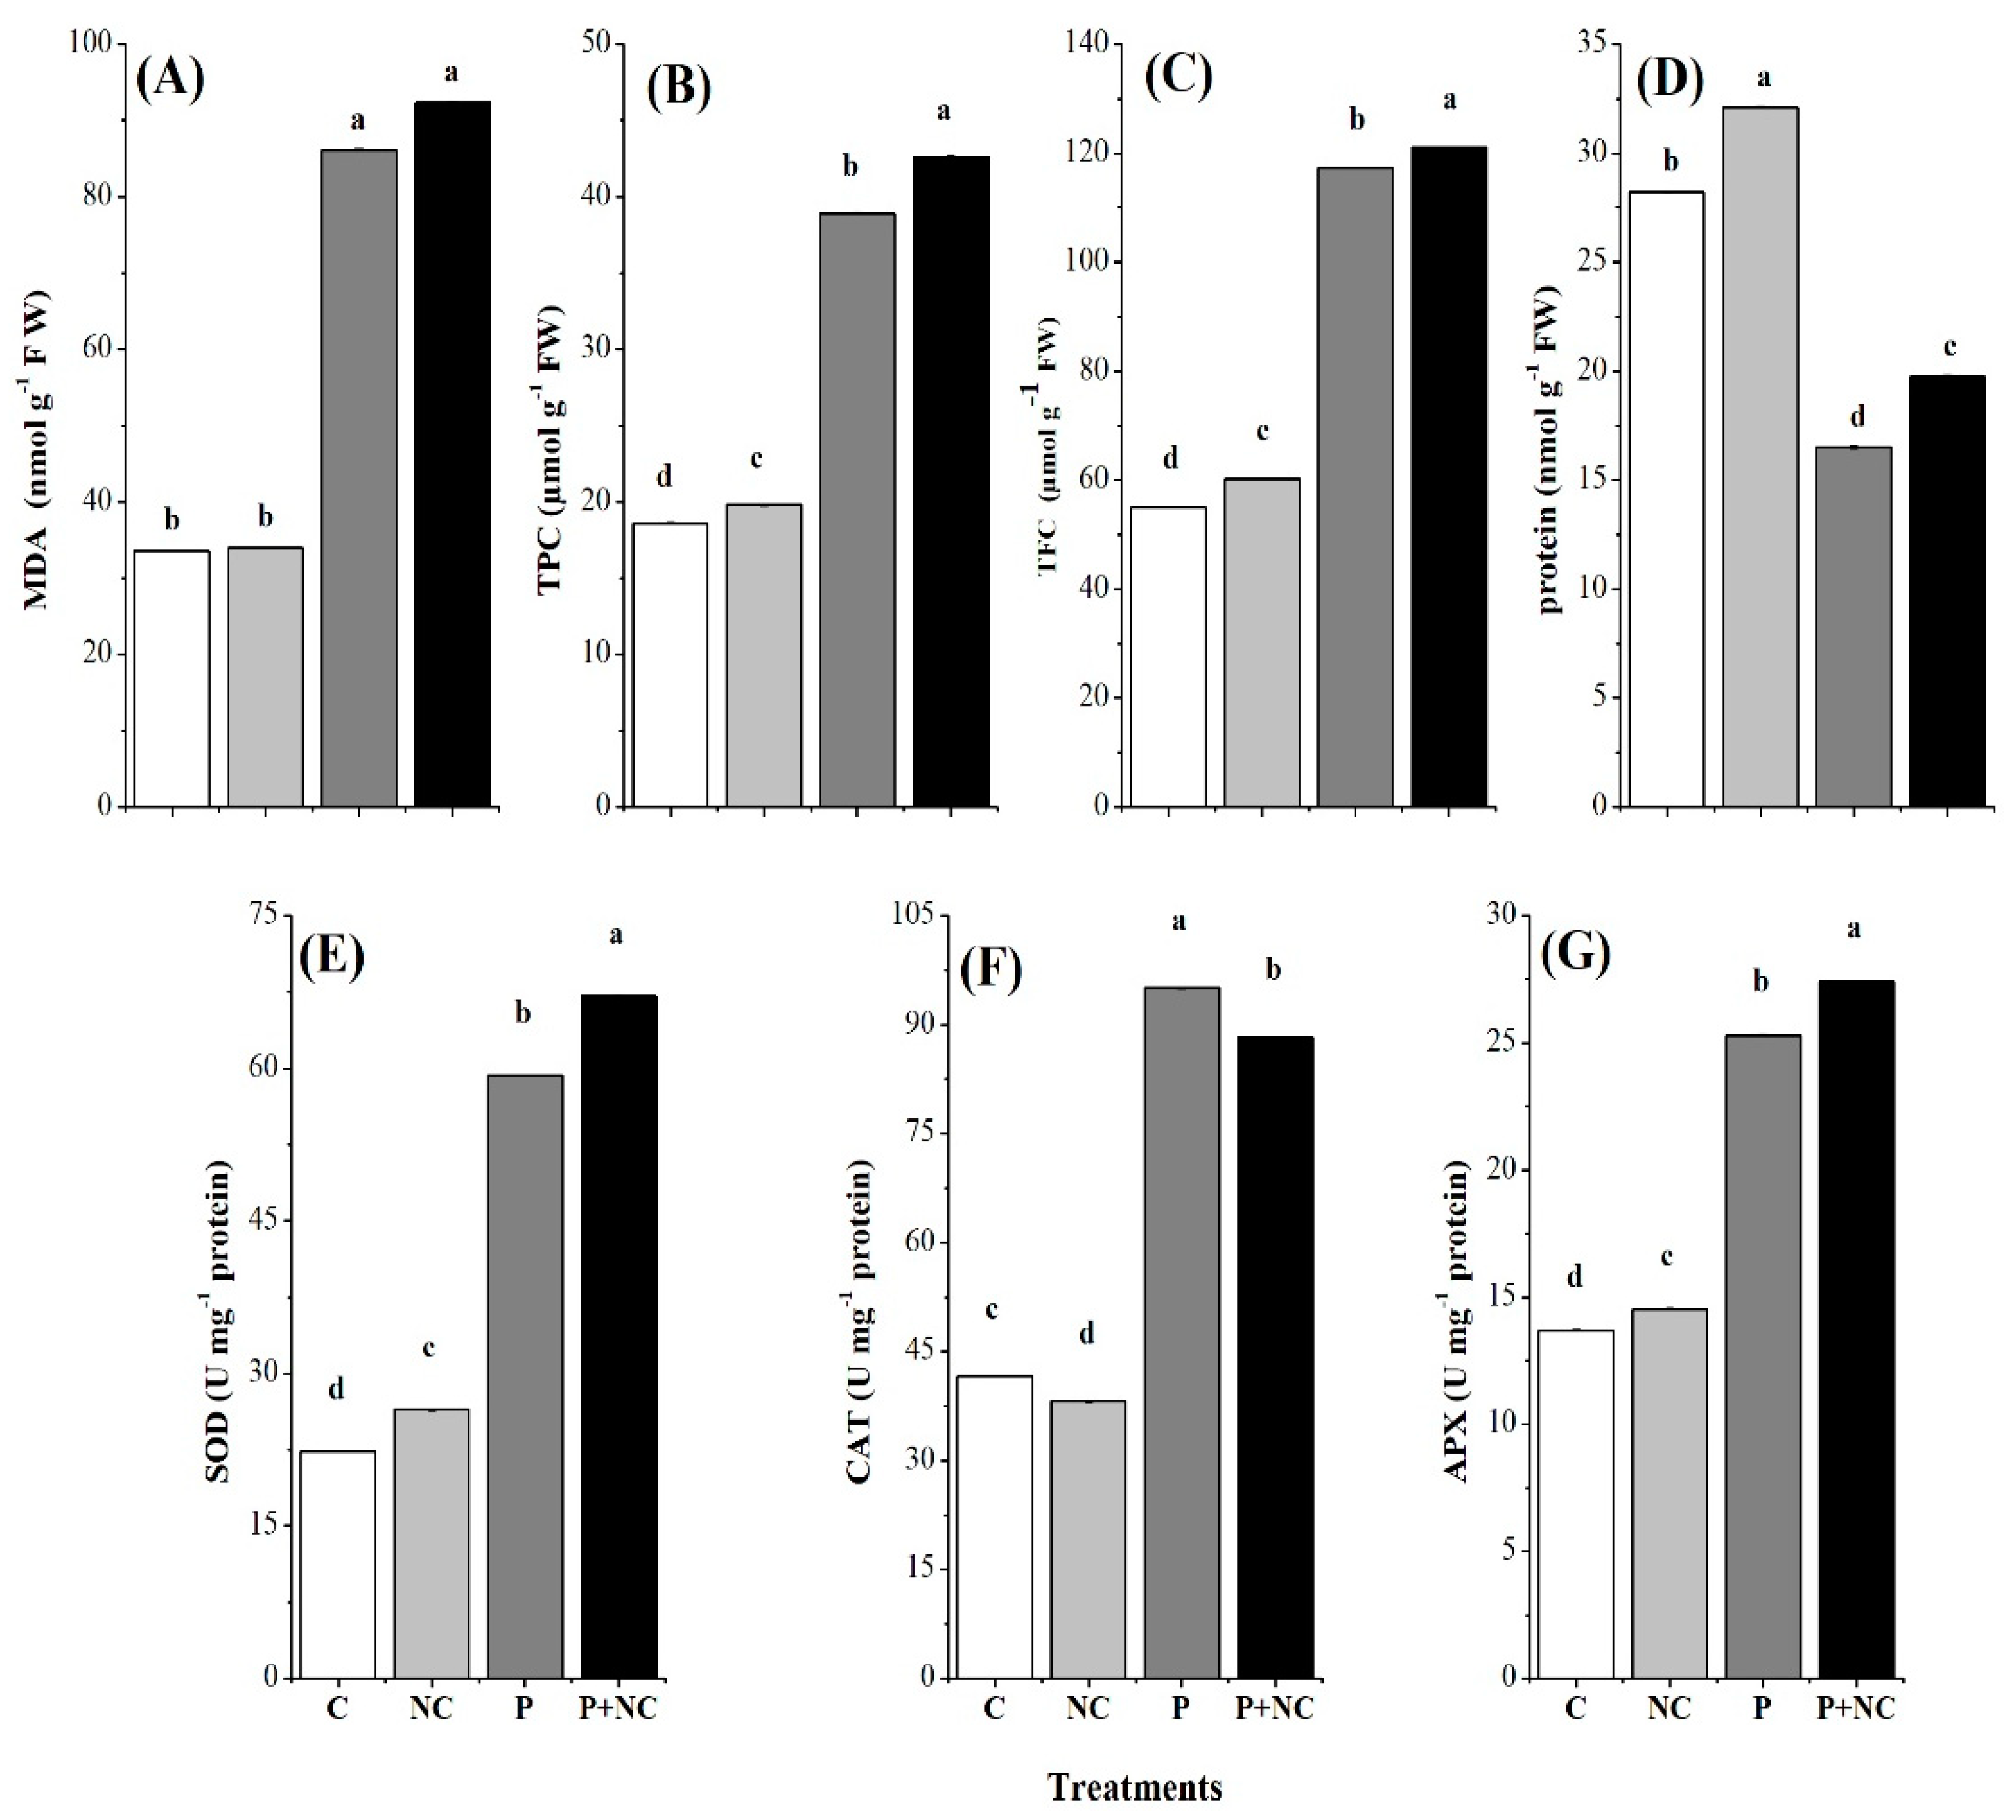
2.4. Influence of the Fungus on Different Biochemicals
2.5. Influencing Antioxidants
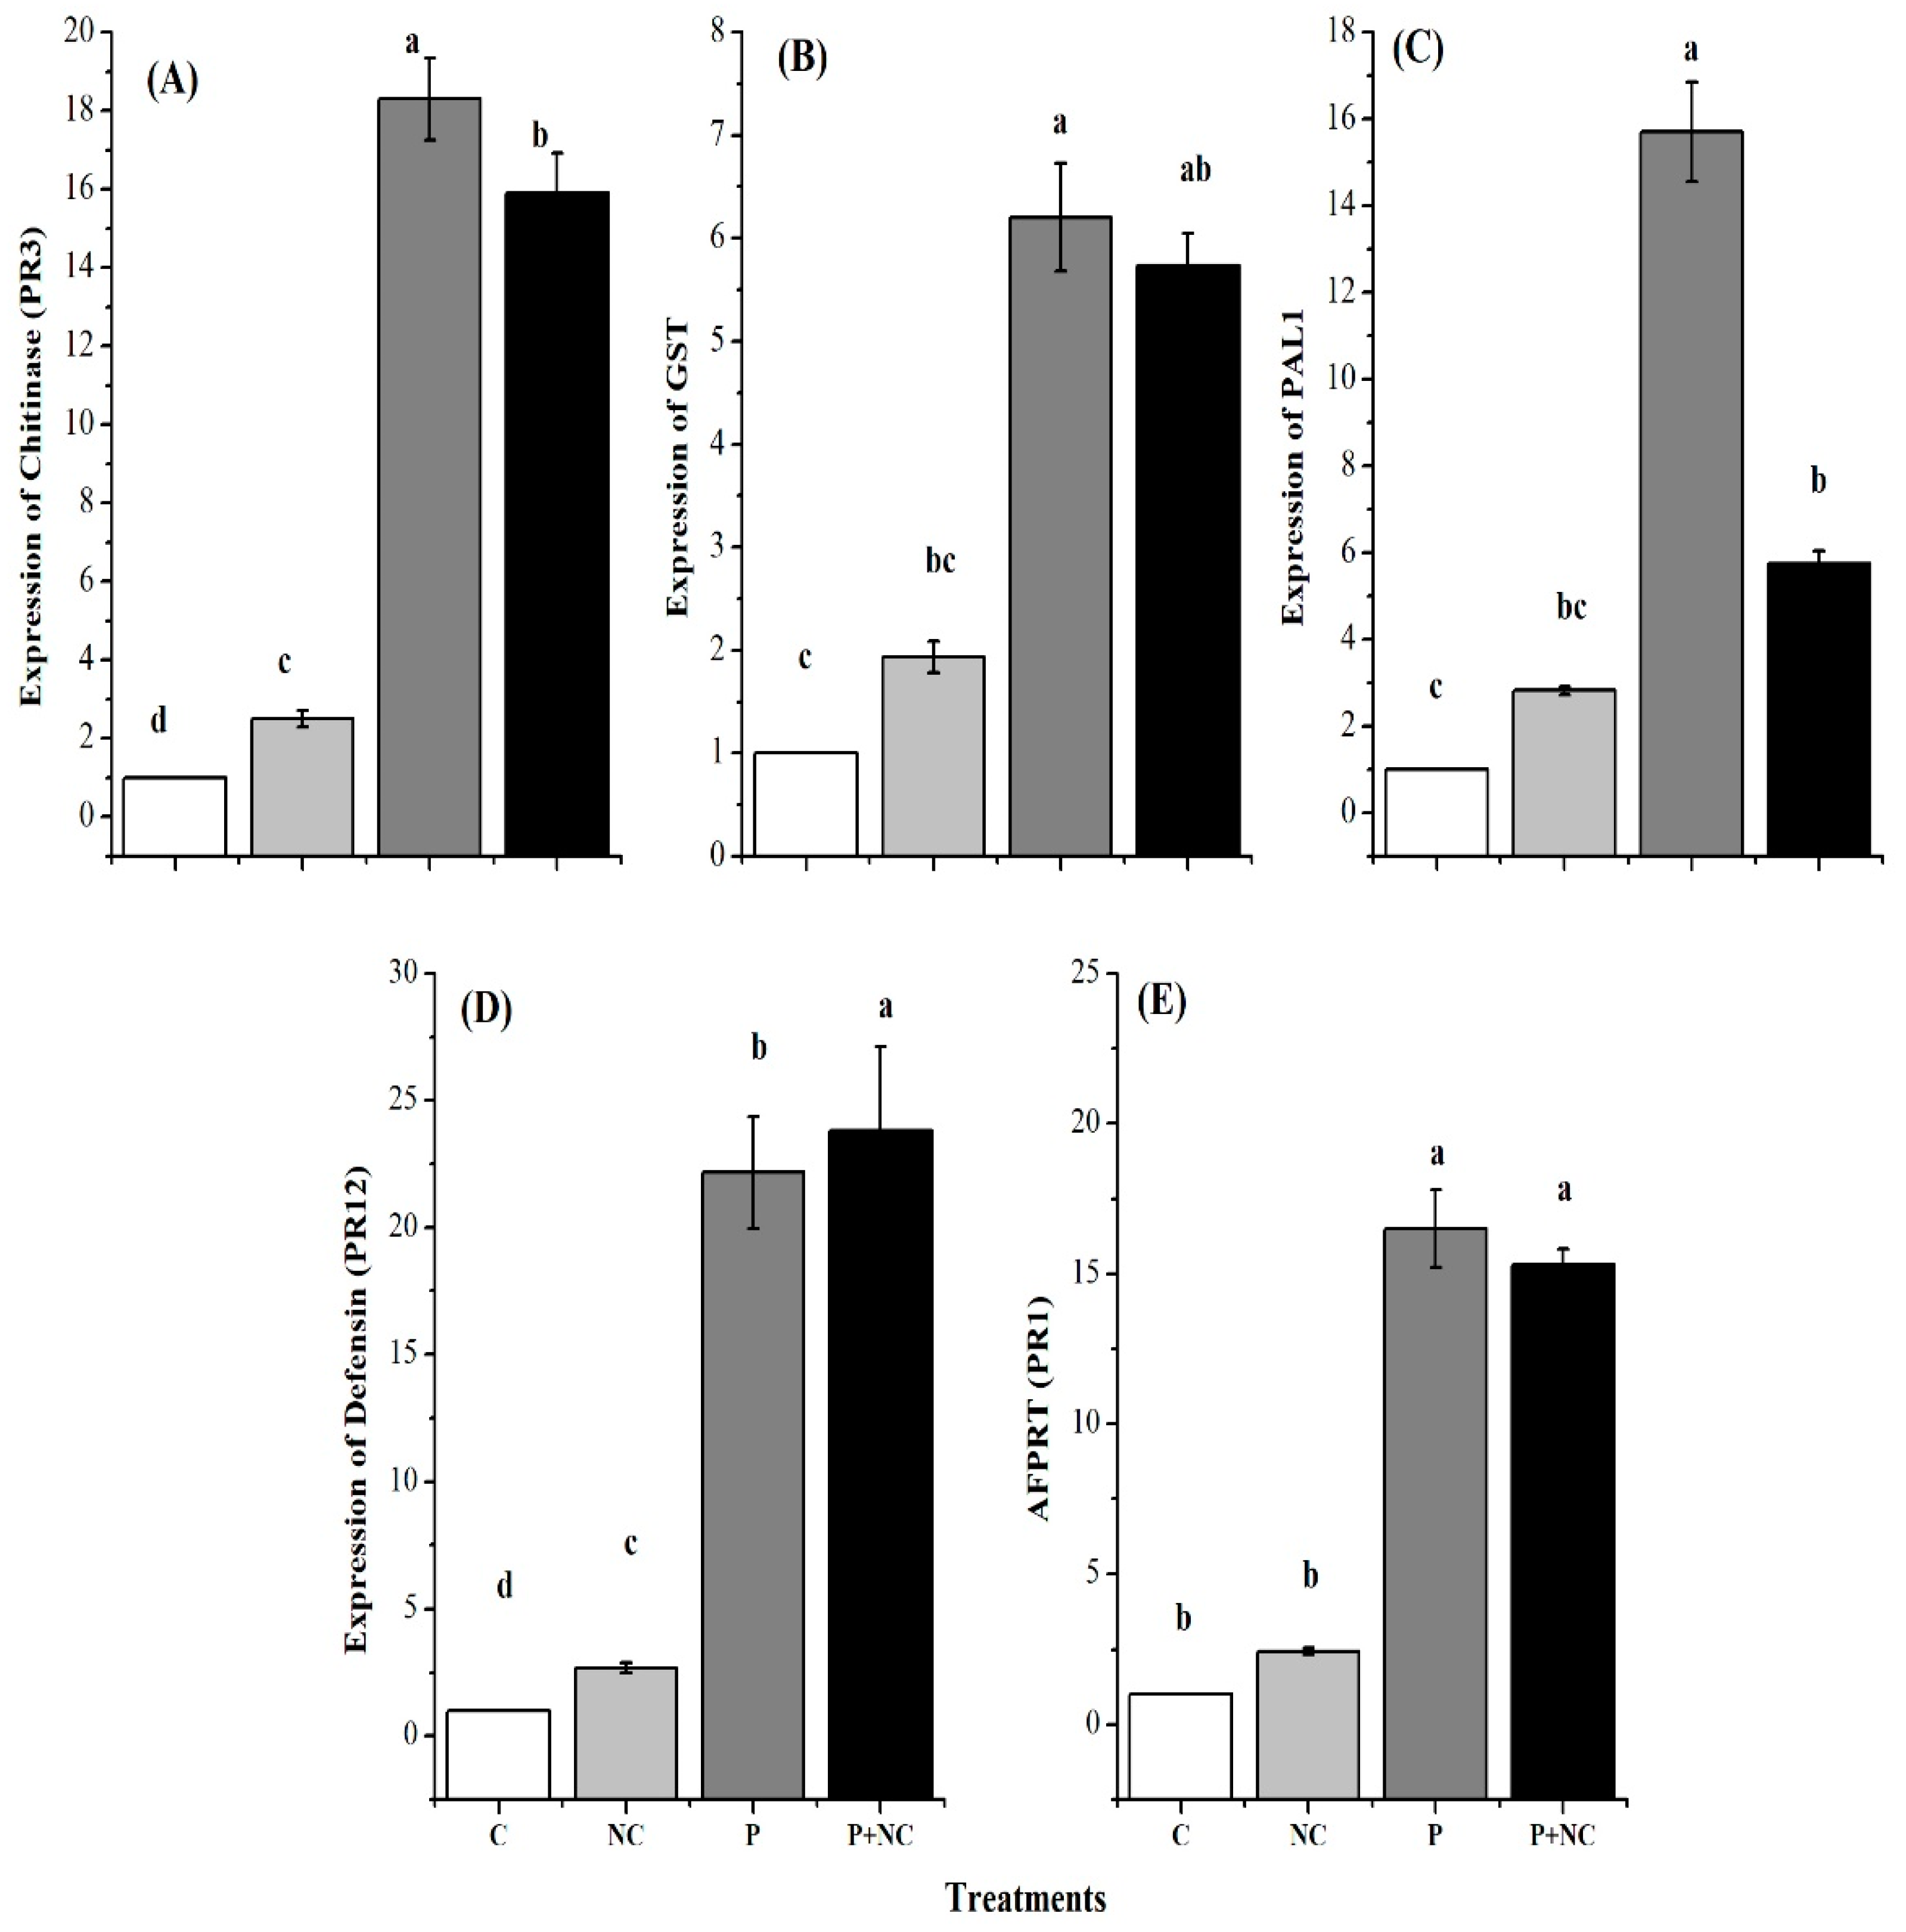
2.6. Expression Levels of Defense-Related Genes
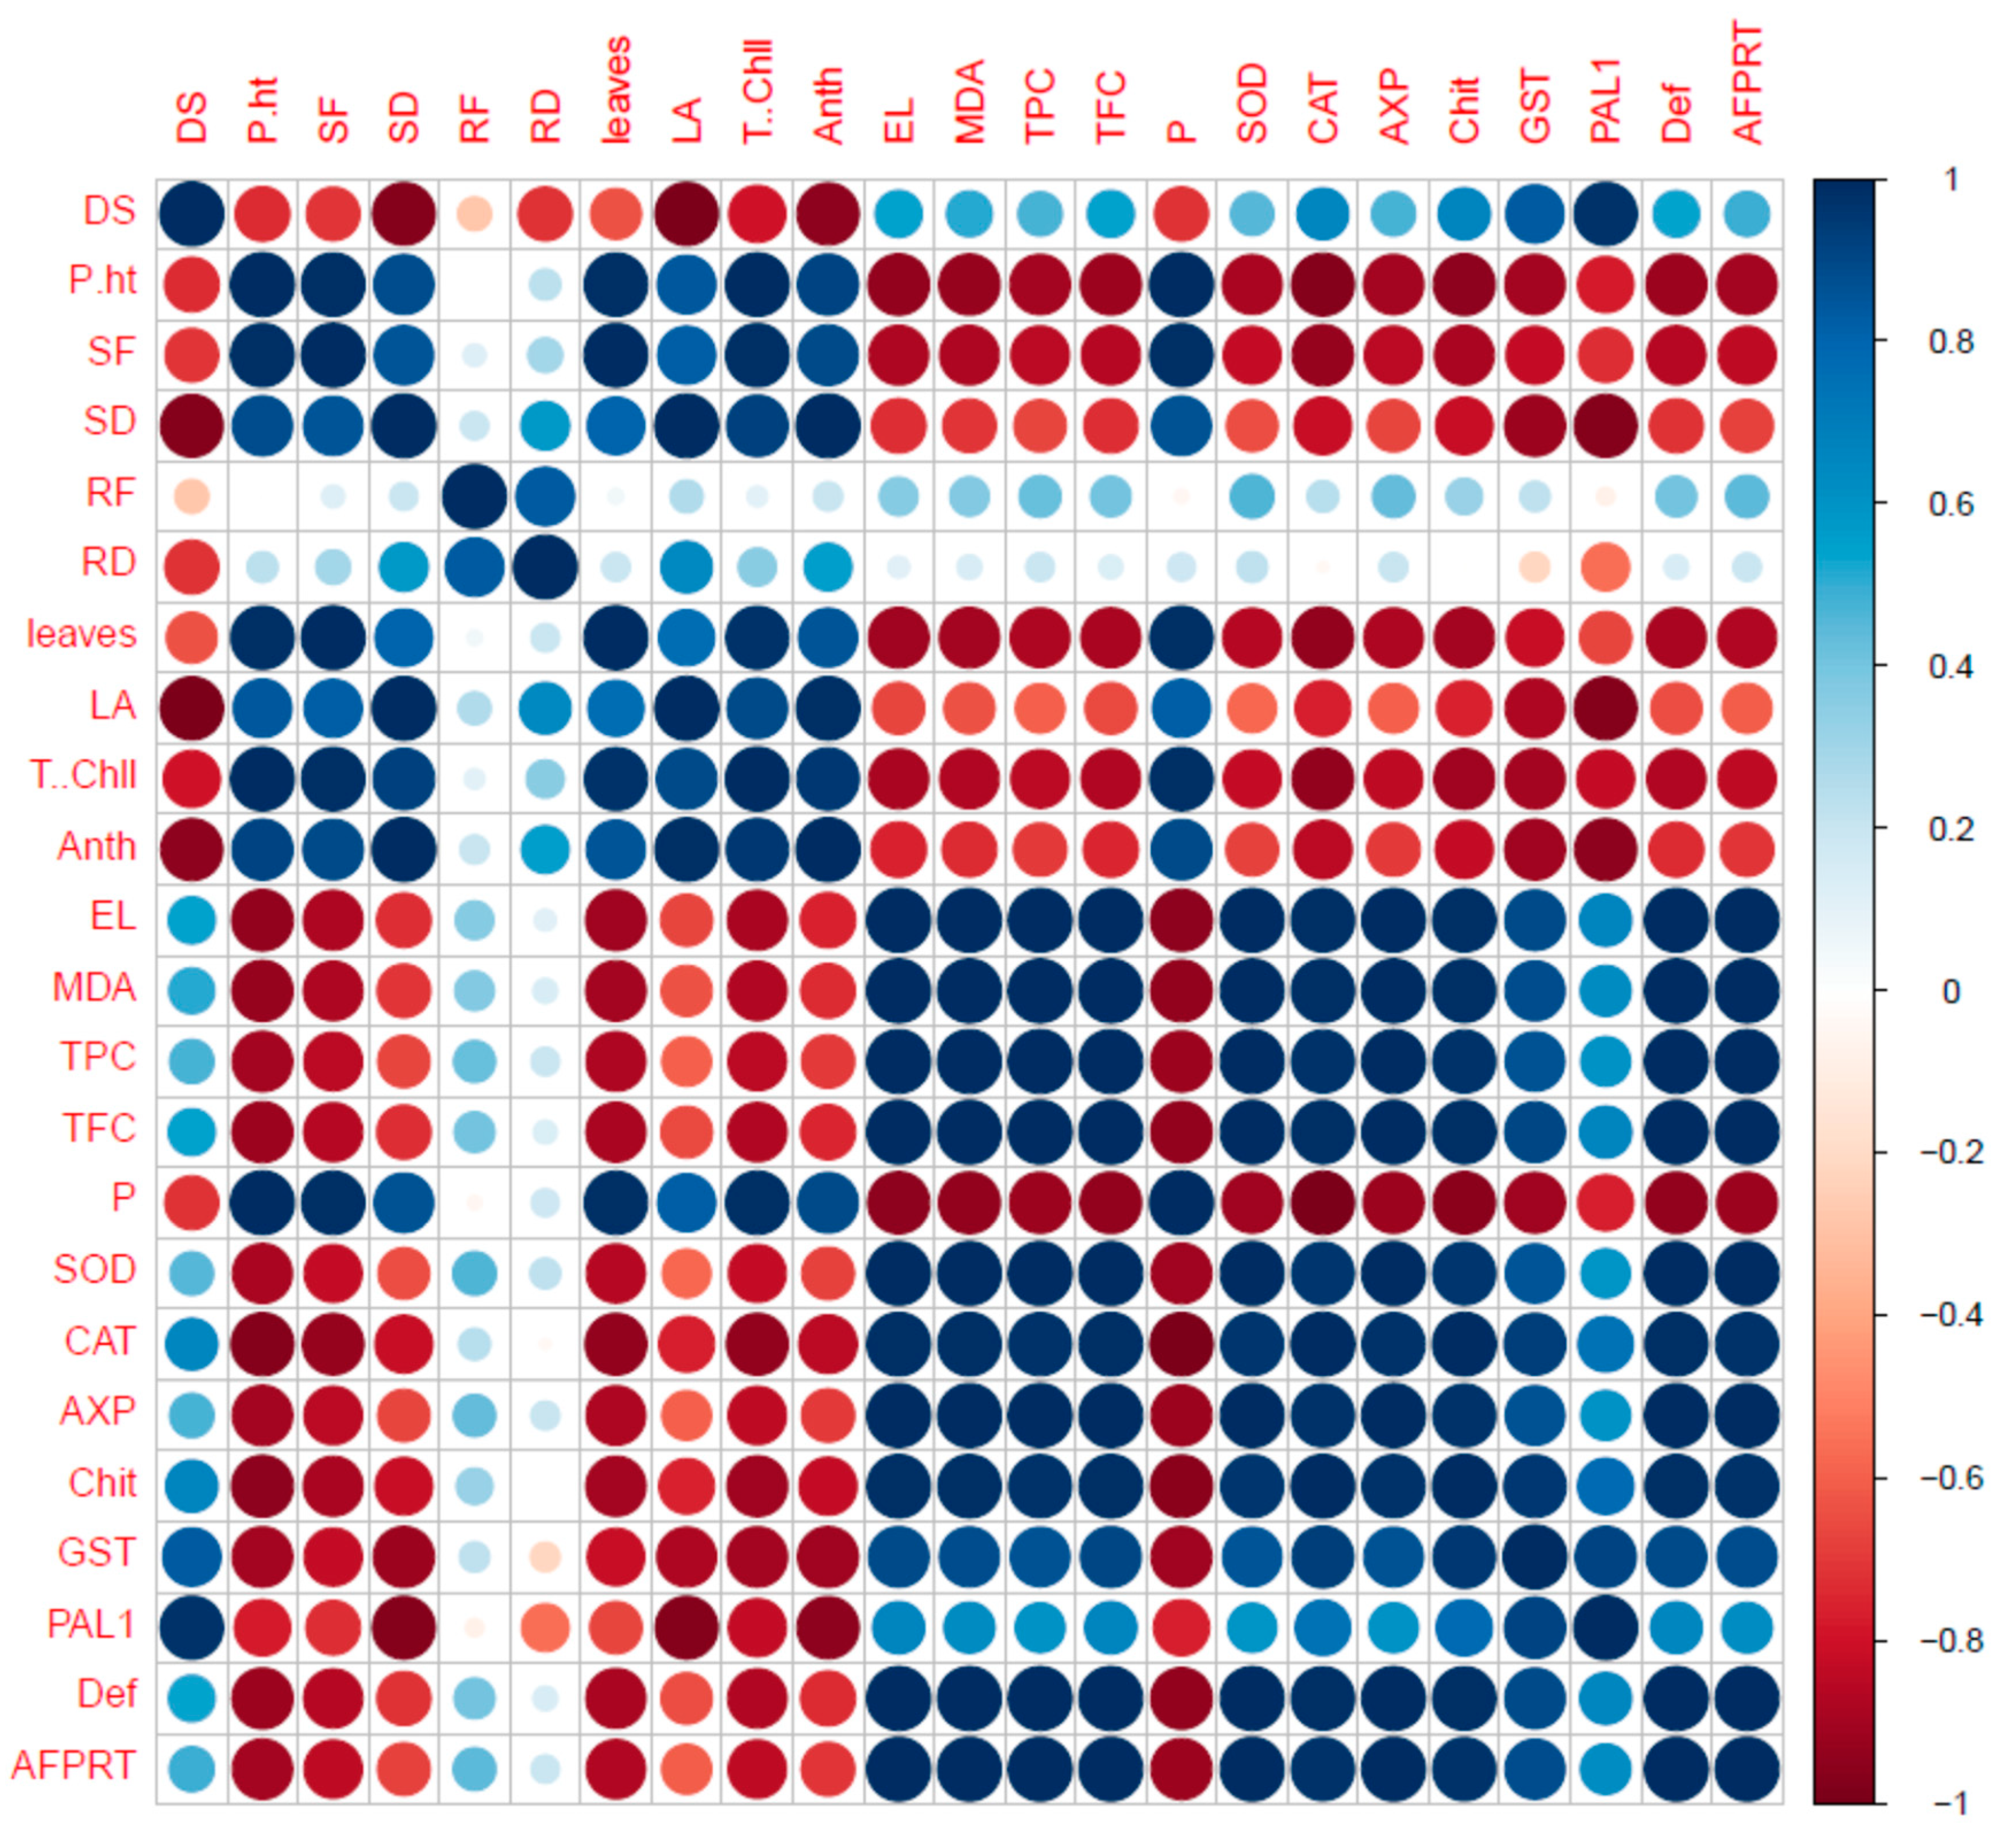
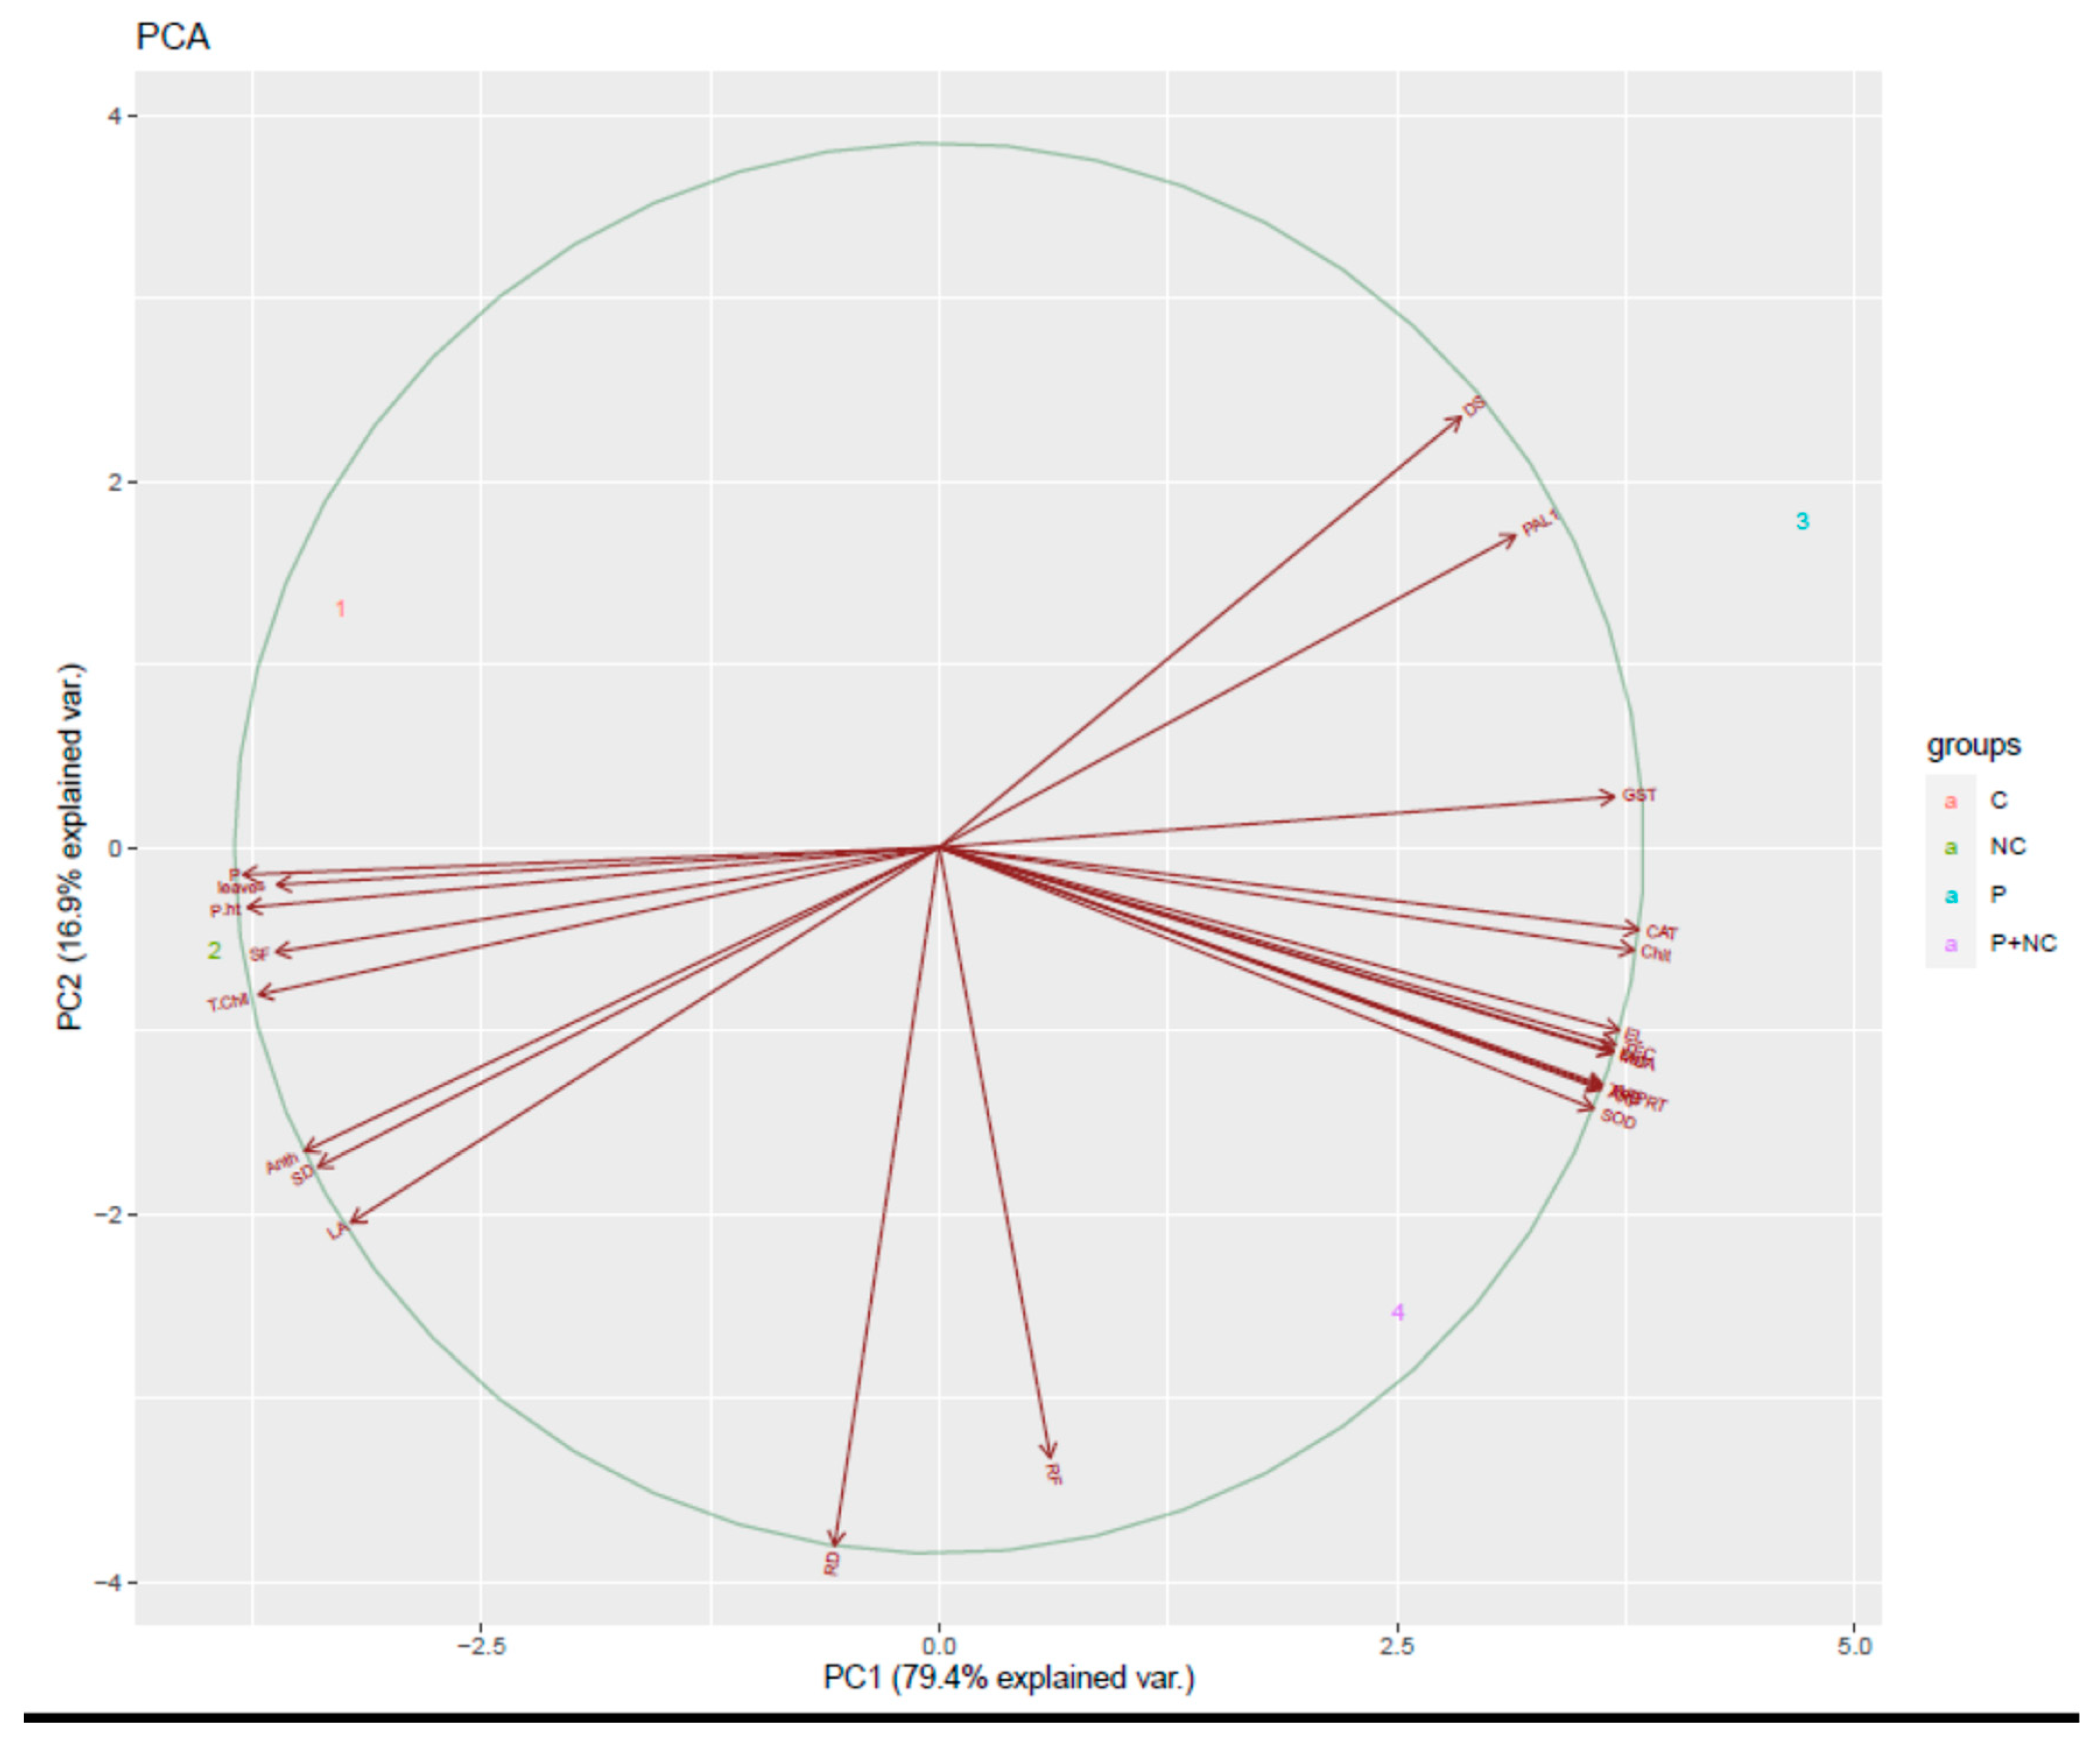
2.7. Correlation of Fungal Disease with Physiological Characters
2.8. Evaluation of the Antifungal Properties of Ag and CHI through FTIR Spectroscopy
3. Discussion
3.1. Estimation of Antioxidants
3.2. Differential Responses of Microorganisms toward Different Tissues
3.3. Induction of Defense Related Genes
3.4. Antifungal Activities of Nanoparticles
4. Materials and Methods
4.1. Isolation and Molecular Identification of R. solani and Tomato Variety Used in the Study
4.2. Preparation and Characterization of Ag/CHI Nanocomposites
4.3. In vitro Antifungal Activity of Ag/CHI NC
4.4. Preparation of R. solani Fungal Suspension and Soil Infestation
4.5. Greenhouse Experiments
4.6. Disease Assessments
4.7. Measurement of Plant Growth Parameters and Chlorophyll Contents
4.8. Determination of TPC, TFC, and MDA Contents
4.9. Assay of Antioxidant Enzymes
4.10. Gene Expression
4.11. Statistical Analysis
5. Conclusions
Supplementary Materials
Author Contributions
Funding
Conflicts of Interest
References
- Yang, G.; Li, C. General description of Rhizoctonia species complex. In Plant Pathology; Citeseer: Princeton, NJ, USA, 2012. [Google Scholar]
- Rashad, Y.; Abdel-Fattah, G.; Hafez, E.; El-Haddad, S. Diversity among some Egyptian isolates of Rhizoctonia solani based on anastomosis grouping, molecular identification and virulence on common bean. Afr. J. Microbiol. Res. 2012, 6, 6661–6667. [Google Scholar]
- Ithurrart, M.E.F.; Büttner, G.; Petersen, J. Rhizoctonia root rot in sugar beet (Beta vulgaris ssp. altissima)-Epidemiological aspects in relation to maize (Zea mays) as a host plant/Rhizoctonia-Rübenfäule in Zuckerrüben (Beta vulgaris ssp. altissima)-Epidemiologische Aspekte in Zusammenhang mit Mais (Zea mays) als Wirtspflanze. Z. Pflanzenkrankh. Pflanzenschutz/J. Plant Dis. Prot. 2004, 302–312. [Google Scholar]
- Georgé, S.; Tourniaire, F.; Gautier, H.; Goupy, P.; Rock, E.; Caris-Veyrat, C. Changes in the contents of carotenoids, phenolic compounds and vitamin C during technical processing and lyophilisation of red and yellow tomatoes. Food Chem. 2011, 124, 1603–1611. [Google Scholar] [CrossRef]
- Mickelbart, M.V.; Hasegawa, P.M.; Bailey-Serres, J. Genetic mechanisms of abiotic stress tolerance that translate to crop yield stability. Nat. Rev. Genet. 2015, 16, 237–251. [Google Scholar] [CrossRef]
- Heflish, A.A.; Abdelkhalek, A.; Al-Askar, A.A.; Behiry, S.I. Protective and Curative Effects of Trichoderma asperelloides Ta41 on Tomato Root Rot Caused by Rhizoctonia solani Rs33. Agronomy 2021, 11, 1162. [Google Scholar] [CrossRef]
- Hu, M.; Chen, S. Non-Target Site Mechanisms of Fungicide Resistance in Crop Pathogens: A Review. Microorganisms 2021, 9, 502. [Google Scholar] [CrossRef]
- Lu, Y.; Chen, C.; Chen, H.; Zhang, J.; Chen, W. Isolation and identification of endophytic fungi from Actinidia macrosperma and investigation of their bioactivities. Evid.-Based Complement. Altern. Med. 2012, 2012, 382742. [Google Scholar] [CrossRef][Green Version]
- Van Wees, S.C.; Van der Ent, S.; Pieterse, C.M. Plant immune responses triggered by beneficial microbes. Curr. Opin. Plant Biol. 2008, 11, 443–448. [Google Scholar] [CrossRef]
- Chandrasekaran, M.; Chun, S.C. Expression of PR-protein genes and induction of defense-related enzymes by Bacillus subtilis CBR05 in tomato (Solanum lycopersicum) plants challenged with Erwinia carotovora subsp. carotovora. Biosci. Biotechnol. Biochem. 2016, 80, 2277–2283. [Google Scholar] [CrossRef]
- Kurabachew, H.; Wydra, K. Induction of systemic resistance and defense-related enzymes after elicitation of resistance by rhizobacteria and silicon application against Ralstonia solanacearum in tomato (Solanum lycopersicum). Crop Prot. 2014, 57, 1–7. [Google Scholar] [CrossRef]
- Jain, S.; Vaishnav, A.; Kumari, S.; Varma, A.; Tuteja, N.; Choudhary, D.K. Chitinolytic Bacillus-mediated induction of jasmonic acid and defense-related proteins in soybean (Glycine max L. Merrill) plant against Rhizoctonia solani and Fusarium oxysporum. J. Plant Growth Regul. 2017, 36, 200–214. [Google Scholar] [CrossRef]
- Niu, D.-D.; Liu, H.-X.; Jiang, C.-H.; Wang, Y.-P.; Wang, Q.-Y.; Jin, H.-L.; Guo, J.-H. The plant growth–promoting rhizobacterium Bacilluscereus AR156 induces systemic resistance in Arabidopsisthaliana by simultaneously activating salicylate-and jasmonate/ethylene-dependent signaling pathways. Mol. Plant Microbe Interact. 2011, 24, 533–542. [Google Scholar] [CrossRef]
- Jo, Y.-K.; Kim, B.H.; Jung, G. Antifungal activity of silver ions and nanoparticles on phytopathogenic fungi. Plant Dis. 2009, 93, 1037–1043. [Google Scholar] [CrossRef]
- Williamson-Benavides, B.A.; Dhingra, A. Understanding Root Rot Disease in Agricultural Crops. Horticulturae 2021, 7, 33. [Google Scholar] [CrossRef]
- Liu, Z.; Stout, J.E.; Tedesco, L.; Boldin, M.; Hwang, C.; Diven, W.F.; Yu, V.L. Controlled evaluation of copper-silver ionization in eradicating Legionellapneumophila from a hospital water distribution system. J. Infect. Dis. 1994, 169, 919–922. [Google Scholar] [CrossRef]
- Jo, Y.-K.; Cromwell, W.; Jeong, H.-K.; Thorkelson, J.; Roh, J.-H.; Shin, D.-B. Use of silver nanoparticles for managing Gibberellafujikuroi on rice seedlings. Crop Prot. 2015, 74, 65–69. [Google Scholar] [CrossRef]
- Sneh, B.; Burpee, L.; Ogoshi, A. Methods for Isolation, Identification and Preservation of Rhizoctonia spp. Identification of Rhizoctonia Species; The American Phytopathological Society Press: St. Paul, MN, USA, 1991; pp. 7–29. [Google Scholar]
- Woodhall, J.W.; Adams, I.P.; Peters, J.C.; Harper, G.; Boonham, N. A new quantitative real-time PCR assay for Rhizoctonia solani AG3-PT and the detection of AGs of Rhizoctonia solani associated with potato in soil and tuber samples in Great Britain. Eur. J. Plant Pathol. 2013, 136, 273–280. [Google Scholar] [CrossRef]
- Goudjal, Y.; Toumatia, O.; Yekkour, A.; Sabaou, N.; Mathieu, F.; Zitouni, A. Biocontrol of Rhizoctonia solani damping-off and promotion of tomato plant growth by endophytic actinomycetes isolated from native plants of Algerian Sahara. Microbiol. Res. 2014, 169, 59–65. [Google Scholar] [CrossRef]
- Sturrock, C.J.; Woodhall, J.; Brown, M.; Walker, C.; Mooney, S.J.; Ray, R.V. Effects of damping-off caused by Rhizoctonia solani anastomosis group 2-1 on roots of wheat and oil seed rape quantified using X-ray Computed Tomography and real-time PCR. Front. Plant Sci. 2015, 6, 461. [Google Scholar] [CrossRef]
- Wu, Z.; Huang, Y.; Li, Y.; Dong, J.; Liu, X.; Li, C. Biocontrol of Rhizoctonia solani via induction of the defense mechanism and antimicrobial compounds produced by Bacillussubtilis SL-44 on Pepper (Capsicum annuum L.). Front. Microbiol. 2019, 10, 2676. [Google Scholar] [CrossRef]
- Li, Y.; Gu, Y.; Li, J.; Xu, M.; Wei, Q.; Wang, Y. Biocontrol agent Bacillusamyloliquefaciens LJ02 induces systemic resistance against cucurbits powdery mildew. Front. Microbiol. 2015, 6, 883. [Google Scholar] [CrossRef] [PubMed]
- Barlow, P.W. Cell divisions in meristems and their contribution to organogenesis and plant form. Shape Plants Fungi 1994, 1, 169. [Google Scholar]
- Panche, A.; Diwan, A.; Chandra, S. Flavonoids: An overview. J. Nutr. Sci. 2016, 5, e47. [Google Scholar] [CrossRef] [PubMed]
- Mandal, S.; Mallick, N.; Mitra, A. Salicylic acid-induced resistance to Fusariumoxysporum f. sp. lycopersici in tomato. Plant Physiol. Biochem. 2009, 47, 642–649. [Google Scholar] [CrossRef] [PubMed]
- Abdelkhalek, A.; Al-Askar, A.A.; Hafez, E. Differential induction and suppression of the potato innate immune system in response to Alfalfamosaicvirus infection. Physiol. Mol. Plant Pathol. 2020, 110, 101485. [Google Scholar] [CrossRef]
- Manganiello, G.; Sacco, A.; Ercolano, M.R.; Vinale, F.; Lanzuise, S.; Pascale, A.; Napolitano, M.; Lombardi, N.; Lorito, M.; Woo, S.L. Modulation of tomato response to Rhizoctonia solani by Trichodermaharzianum and its secondary metabolite harzianic acid. Front. Microbiol. 2018, 9, 1966. [Google Scholar] [CrossRef] [PubMed]
- Eslahi, N.; Kowsari, M.; reza Zamani, M.; Motallebi, M. The profile change of defense pathways in Phaseouls vulgaris L. by biochemical and molecular interactions of Trichodermaharzianum transformants overexpressing a chimeric chitinase. Biol. Control 2021, 152, 104304. [Google Scholar] [CrossRef]
- Hermosa, R.; Viterbo, A.; Chet, I.; Monte, E. Plant-beneficial effects of Trichoderma and of its genes. Microbiology 2012, 158, 17–25. [Google Scholar] [CrossRef]
- Genzel, F.; Franken, P.; Witzel, K.; Grosch, R. Systemic induction of salicylic acid-related plant defences in potato in response to Rhizoctonia solani AG 3 PT. Plant Pathol. 2018, 67, 337–348. [Google Scholar] [CrossRef]
- Derksen, H.; Badawi, M.; Henriquez, M.A.; Yao, Z.; El-Bebany, A.F.; Daayf, F. Differential expression of potato defence genes associated with the salicylic acid defence signalling pathway in response to weakly and highly aggressive isolates of Verticillium dahliae. J. Phytopathol. 2013, 161, 142–153. [Google Scholar] [CrossRef]
- Kim, J.S.; Kuk, E.; Yu, K.N.; Kim, J.-H.; Park, S.J.; Lee, H.J.; Kim, S.H.; Park, Y.K.; Park, Y.H.; Hwang, C.-Y. Antimicrobial effects of silver nanoparticles. Nanomed. Nanotechnol. Biol. Med. 2007, 3, 95–101. [Google Scholar] [CrossRef]
- Raffi, M.; Hussain, F.; Bhatti, T.; Akhter, J.; Hameed, A.; Hasan, M. Antibacterial characterization of silver nanoparticles against E. coli ATCC-15224. J. Mater. Sci. Technol. 2008, 24, 192–196. [Google Scholar]
- Li, M.; Chen, C.; Xia, X.; Garba, B.; Shang, L.; Wang, Y. Proteomic analysis of the inhibitory effect of chitosan on Penicillium expansum. Food Sci. Technol. 2019, 40, 250–257. [Google Scholar] [CrossRef]
- Márquez, I.G.; Akuaku, J.; Cruz, I.; Cheetham, J.; Golshani, A.; Smith, M.L. Disruption of protein synthesis as antifungal mode of action by chitosan. Int. J. Food Microbiol. 2013, 164, 108–112. [Google Scholar] [CrossRef]
- Toussoun, T.A.; Nelson, P.E. A Pictorial Guide to the Identification of Fusarium Species According to the Taxonomic System of Snyder and Hansen; Pennsylvania State University Press: University Park, PA, USA, 1968. [Google Scholar]
- Afzal, M.; Yu, M.; Tang, C.; Zhang, L.; Muhammad, N.; Zhao, H.; Feng, J.; Yu, L.; Xu, J. The negative impact of cadmium on nitrogen transformation processes in a paddy soil is greater under non-flooding than flooding conditions. Environ. Int. 2019, 129, 451–460. [Google Scholar] [CrossRef]
- Qi, L.; Xu, Z.; Jiang, X.; Hu, C.; Zou, X. Preparation and antibacterial activity of chitosan nanoparticles. Carbohydr. Res. 2004, 339, 2693–2700. [Google Scholar] [CrossRef]
- Awad, M.A.G.; Hendi, A.A.; Wagealla, M.A.E.; Virk, P.; Ortashi, K.M.O. Method of Treating Diabetic Wounds Using Biosynthesized Nanoparticles. U.S. Patent No. 9,974,749, 22 May 2018. [Google Scholar]
- Tatsadjieu, N.; Dongmo, P.J.; Ngassoum, M.; Etoa, F.; Mbofung, C. Investigations on the essential oil of Lippiarugosa from Cameroon for its potential use as antifungal agent against Aspergillusflavus Link ex. Fries. Food Control 2009, 20, 161–166. [Google Scholar] [CrossRef]
- Moity, T.A. Effect of single and mixture of Trichodermaharzianum isolates on controlling three different soil-borne pathogens. Egypt. J. Microbiol. 1985, 20, 111–120. [Google Scholar]
- Filion, M.; St-Arnaud, M.; Jabaji-Hare, S. Quantification of Fusariumsolani f. sp. phaseoli in mycorrhizal bean plants and surrounding mycorrhizosphere soil using real-time polymerase chain reaction and direct isolations on selective media. Phytopathology 2003, 93, 229–235. [Google Scholar] [CrossRef] [PubMed]
- Bahador, E.; Einali, A.; Azizian-Shermeh, O.; Sangtarash, M.H. Metabolic responses of the green microalga Dunaliellasalina to silver nanoparticles-induced oxidative stress in the presence of salicylic acid treatment. Aquat. Toxicol. 2019, 217, 105356. [Google Scholar] [CrossRef] [PubMed]
- Senthilkumar, M.; Amaresan, N.; Sankaranarayanan, A. Measurement of Electrolyte Leakage. In Plant-Microbe Interactions; Springer: Ney York, NY, USA, 2021; pp. 155–156. [Google Scholar]
- Slinkard, K.; Singleton, V.L. Total phenol analysis: Automation and comparison with manual methods. Am. J. Enol. Vitic. 1977, 28, 49–55. [Google Scholar]
- Chavan, J.J.; Gaikwad, N.B.; Kshirsagar, P.R.; Dixit, G.B. Total phenolics, flavonoids and antioxidant properties of three Ceropegia species from Western Ghats of India. S. Afr. J. Bot. 2013, 88, 273–277. [Google Scholar] [CrossRef]
- Bradford, M.M. A rapid and sensitive method for the quantitation of microgram quantities of protein utilizing the principle of protein-dye binding. Anal. Biochem. 1976, 72, 248–254. [Google Scholar] [CrossRef]
- Heath, R.L.; Packer, L. Photoperoxidation in isolated chloroplasts: I. Kinetics and stoichiometry of fatty acid peroxidation. Arch. Biochem. Biophys. 1968, 125, 189–198. [Google Scholar] [CrossRef]
- Beyer, W.F.; Fridovich, I. Assaying for superoxide dismutase activity: Some large consequences of minor changes in conditions. Anal. Biochem. 1987, 161, 559–566. [Google Scholar] [CrossRef]
- Lück, H. Catalase. In Methods of Enzymatic Analysis; Elsevier: New York, NY, USA, 1965; pp. 885–894. [Google Scholar]
- Nakano, Y.; Asada, K. Hydrogen peroxide is scavenged by ascorbate-specific peroxidase in spinach chloroplasts. Plant Cell Physiol. 1981, 22, 867–880. [Google Scholar]
- Muhammad, S.; Tan, J.; Deng, P.; Li, T.; He, H.; Bian, J.; Wu, L. Pesticide application has little influence on coding and non-coding gene expressions in rice. BMC Genom. 2019, 20, 1009. [Google Scholar] [CrossRef]
- Løvdal, T.; Lillo, C. Reference gene selection for quantitative real-time PCR normalization in tomato subjected to nitrogen, cold, and light stress. Anal. Biochem. 2009, 387, 238–242. [Google Scholar] [CrossRef]


Publisher’s Note: MDPI stays neutral with regard to jurisdictional claims in published maps and institutional affiliations. |
© 2021 by the authors. Licensee MDPI, Basel, Switzerland. This article is an open access article distributed under the terms and conditions of the Creative Commons Attribution (CC BY) license (https://creativecommons.org/licenses/by/4.0/).
Share and Cite
Al-Surhanee, A.A.; Afzal, M.; Bouqellah, N.A.; Ouf, S.A.; Muhammad, S.; Jan, M.; Kaleem, S.; Hashem, M.; Alamri, S.; Abdel Latef, A.A.H.; et al. The Antifungal Activity of Ag/CHI NPs against Rhizoctonia solani Linked with Tomato Plant Health. Plants 2021, 10, 2283. https://doi.org/10.3390/plants10112283
Al-Surhanee AA, Afzal M, Bouqellah NA, Ouf SA, Muhammad S, Jan M, Kaleem S, Hashem M, Alamri S, Abdel Latef AAH, et al. The Antifungal Activity of Ag/CHI NPs against Rhizoctonia solani Linked with Tomato Plant Health. Plants. 2021; 10(11):2283. https://doi.org/10.3390/plants10112283
Chicago/Turabian StyleAl-Surhanee, Ameena A., Muhammad Afzal, Nahla Alsayed Bouqellah, Salama A. Ouf, Sajid Muhammad, Mehmood Jan, Sidra Kaleem, Mohamed Hashem, Saad Alamri, Arafat Abdel Hamed Abdel Latef, and et al. 2021. "The Antifungal Activity of Ag/CHI NPs against Rhizoctonia solani Linked with Tomato Plant Health" Plants 10, no. 11: 2283. https://doi.org/10.3390/plants10112283
APA StyleAl-Surhanee, A. A., Afzal, M., Bouqellah, N. A., Ouf, S. A., Muhammad, S., Jan, M., Kaleem, S., Hashem, M., Alamri, S., Abdel Latef, A. A. H., Ali, O. M., & Soliman, M. H. (2021). The Antifungal Activity of Ag/CHI NPs against Rhizoctonia solani Linked with Tomato Plant Health. Plants, 10(11), 2283. https://doi.org/10.3390/plants10112283