Article

Electrical Capacitance versus Minirhizotron Technique: A Study of Root Dynamics in Wheat–Pea Intercrops

1
Centre for Agricultural Research, Institute for Soil Sciences, ELKH, Herman Ottó út 15, H-1022 Budapest, Hungary
2
Centre for Agricultural Research, Agricultural Institute, ELKH, Brunszvik u. 2, H-2462 Martonvásár, Hungary
3
Department Plant Physiology and Molecular Plant Biology, Eötvös Loránd University, Pázmány Péter Stny. 1A, H-1117 Budapest, Hungary
*
Authors to whom correspondence should be addressed.
Plants 2021, 10(10), 1991; https://doi.org/10.3390/plants10101991
Submission received: 1 September 2021 / Revised: 20 September 2021 / Accepted: 22 September 2021 / Published: 23 September 2021

Abstract

:
This study evaluated the concurrent application and the results of the root electrical capacitance (CR) and minirhizotron (MR) methods in the same plant populations. The container experiment involved three winter wheat cultivars, grown as sole crops or intercropped with winter pea under well-watered or drought-stressed conditions. The wheat root activity (characterized by CR) and the MR-based root length (RL) and root surface area (RSA) were monitored during the vegetation period, the flag leaf chlorophyll content was measured at flowering, and the wheat shoot dry mass (SDM) and grain yield (GY) were determined at maturity. CR, RL and RSA exhibited similar seasonal patterns with peaks around the flowering. The presence of pea reduced the maximum CR, RL and RSA. Drought significantly decreased CR, but increased the MR-based root size. Both intercropping and drought reduced wheat chlorophyll content, SDM and GY. The relative decrease caused by pea or drought in the maximum CR was proportional to the rate of change in SDM or GY. Significant linear correlations (R2: 0.77–0.97) were found between CR and RSA, with significantly smaller specific root capacitance (per unit RSA) for the drought-stress treatments. CR measurements tend to predict root function and the accompanying effect on above-ground production and grain yield. The parallel application of the two in situ methods improves the evaluation of root dynamics and plant responses.

1. Introduction

Owing to methodological difficulties in assessing the growth and activity of intact root systems in the soil [1,2], the application and development of indirect, non-destructive techniques, including electrical methods, have received increasing attention in recent years [3,4].
The electrical capacitance of the root–soil system (CR), measured using a low-frequency alternating current (1 kHz AC) between one electrode fixed to the plant stem base and another inserted into the surrounding soil, was reported to correlate with the root system size (RSS) [5]. The first, generally accepted conceptual model, hypothesizes that roots are equivalent to leaky cylindrical capacitors, in which the electrically conductive root sap is separated from the conductive soil solution by polarizable membrane dielectrics [6]. Membranes store electric charges proportional to their surface area, modifying the phase and amplitude of the AC signal.
Nevertheless, some studies revealed the inconsistencies with Dalton’s proposals, and questioned the feasibility of the CR method [7]. Dietrich et al. [8,9] suggested a revised model, and explored that CR was dominated by the stem base between the plant electrode and the substrate surface (with a negligible contribution of the roots), and was correlated with a stem cross-sectional area. According to their explanation, the CR–RSS correlations are merely due to the allometric relationship between root and shoot traits. Another recent study also suggested that current leakage chiefly occurred in the root neck and proximal roots and much less in the distal segments [10]. In contrast, progressive root cutting and root immersion experiments in hydroponically grown plants supported that CR is highly influenced by the roots located in the media [11]. There is a consensus that the current pathway inside the plant organs is influenced by tissue properties, e.g., suberization [4,6,12,13]. Therefore, one advantage of the capacitance method is that CR is a reflection of root size and physiological status, i.e., water content, membrane integrity and permeability, and endodermal maturation, driven by ontogenic changes and environmental (stress) factors [13]. Due to the allometry between the proximal root regions that mostly contribute to current flow and the distal fine roots responsible for solute absorption [8,9,10], CR is related to the water uptake activity of the root system (referred to as “root activity”) as a whole [6,14,15].
The rapid CR method is appropriate for monitoring the same plant over time, and for screening large plant populations [16]. As the neighboring plants (with intermingling roots) are not connected electrically, CR provides plant-scale information [13]. An evident drawback to using the technique is the complete lack of root visualization. It is difficult to quantify root traits from capacitance data, which are more suitable for the relative comparison of RSS for the same species, grown in the same substrate and measured under the same conditions [16]. Although CR is strongly affected by the soil water content (SWC), this can be taken into account with species-specific functions [15]. The soil dielectric response tends to reduce the efficiency of the method, particularly in the case of complex soils abounding in surface-charged colloidal particles [3]. Nevertheless, despite the uncertainties about the underlying biophysical mechanisms, the method has proven useful in several studies to evaluate RSS in herbaceous native and crop species and in tree saplings grown in pots [14,17,18,19] or in the field [13,15,16,20].
The minirhizotron (MR), a more widely used non-destructive visualization technique, allows the dynamic study of root traits at particular locations in the soil profile, including root architecture, branching, depth distribution, length density, production, longevity, mortality, turnover and decomposition [2,21]. However, MR represents only part of the root system, with limited resolution for the fine roots that are responsible for water uptake [22]. The main biases are attributed to the artificial MR tube surface and the poor soil-tube wall contact (including soil gaps), which may result in modified temperature conditions, altered water flow and decreased soil penetration resistance, potentially changing the observed root density and traits [7,23]. The critical points in the MR technique are the assessment of root physiological status (activity) by visual evaluation (e.g., color, shrinking, contour smoothing, blotting), and the differentiation between the roots of individual plants [21]. The available data are often limited due to the time-consuming image analysis, and to the lack of automatic image processing methods that give satisfactory results for MR pictures [2,24].
We surmised that the use of the entirely different CR and MR methods in the same root study would be beneficial. In the framework of an EU H2020 project, the aim was to use the two techniques concurrently (which has not previously been reported) in intercropping systems, which are increasingly important in sustainable agriculture [25,26]. The more efficient resource utilization in species mixtures compared to sole crops may result in benefits such as higher yield equivalent ratios and yield stability, improved grain quality, enhanced lodging resistance, improved soil conservation and better control of pests and weeds [27,28]. Cereal–legume, including wheat–pea mixtures, are the dominant intercrops in organic farming in Europe [26,29]. Symbiotic N2 fixation in pea more or less satisfies the high N demand of the cereal [25,30]. The complementary resource use and, therefore, growth and yield components, highly depend on the root dynamics, and the root architectural modifications of the mixed species [1,31]. The wheat root response to intercropping under altered conditions is often highly variable and is hardly predictable [32]. Therefore, in situ root investigation methods were deemed appropriate to track root development over time in mixed crop culture, and to evaluate the responsiveness of the selected wheat cultivars to intercropping under different irrigation conditions. Winter wheat and pea mixtures, grown in containers in the greenhouse, were used for the present methodological study. Although this controlled environment was likely not representative of field conditions, it allowed us to standardize experimental parameters, to adjust contrasting soil moisture regimes, and to eliminate weather anomalies.
In this study, CR and MR measurements were performed in the same intercrop system, aiming specifically (i) to analyze and compare the results provided by the methods during monitoring the response of root dynamics of various wheat genotypes to intercropping and drought, and (ii) to evaluate the potential benefits of the simultaneous application of the two approaches.

2. Results

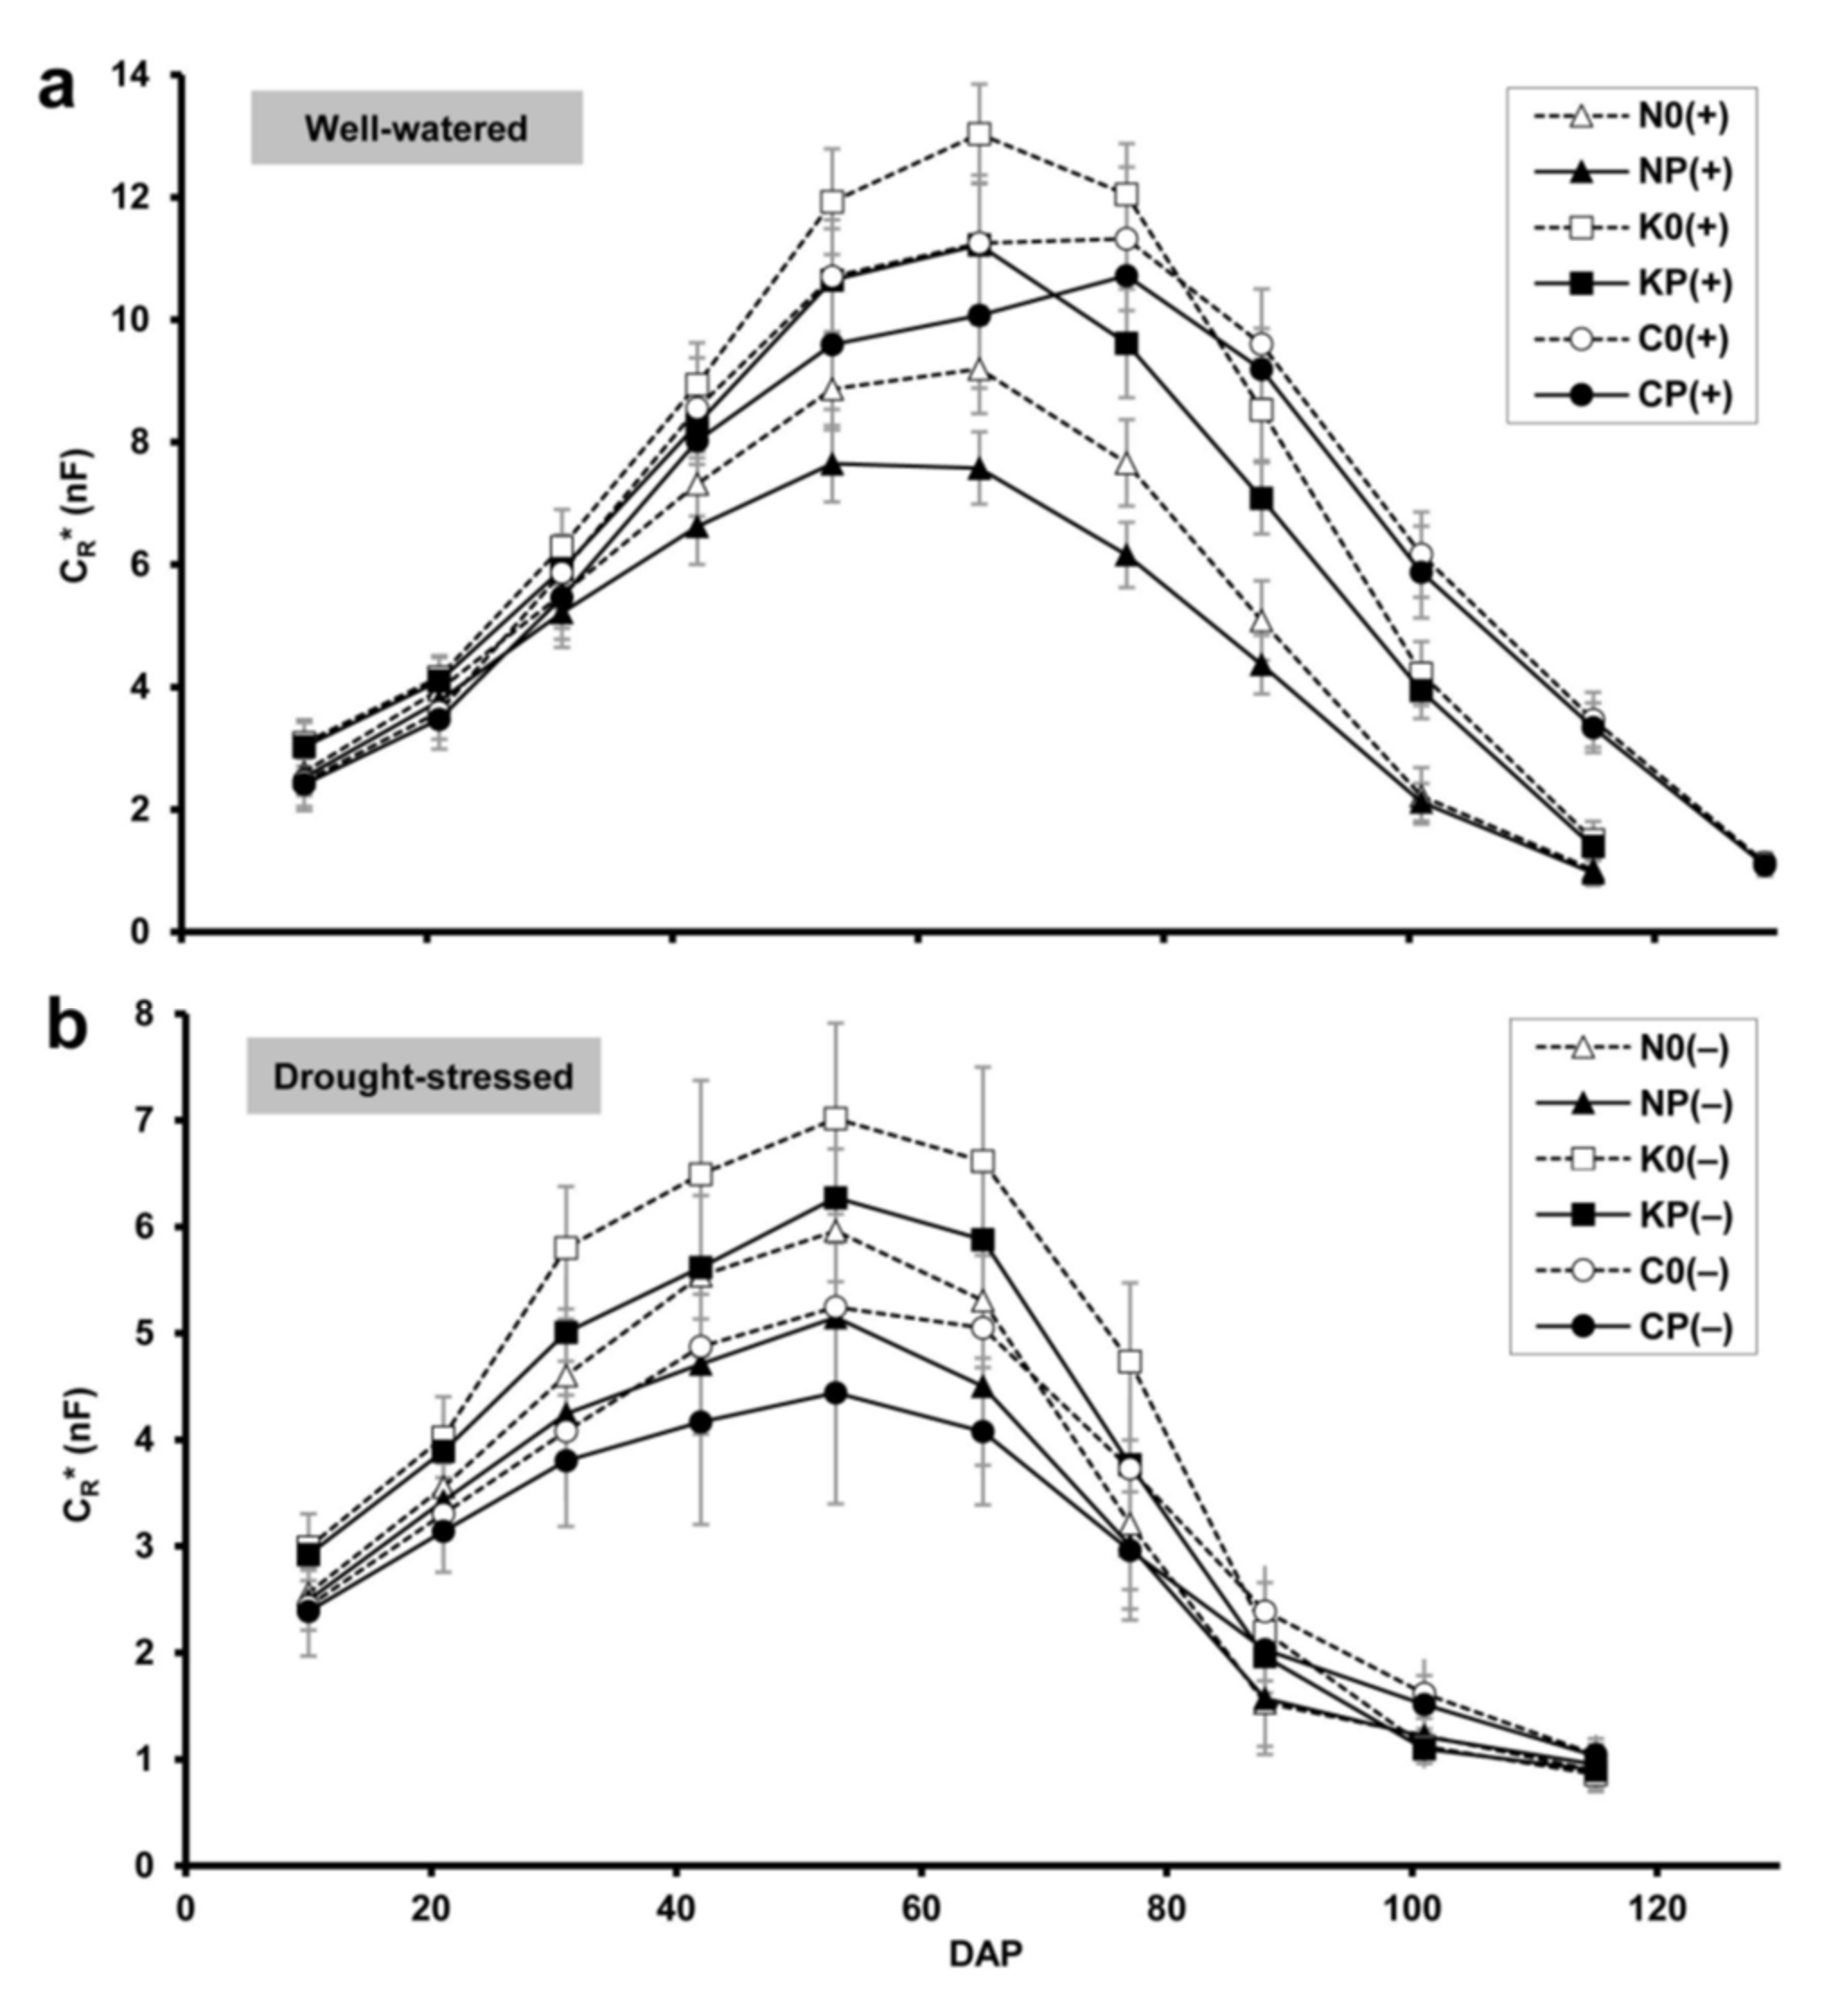
2.1. Root Electrical Capacitance

The apparent root capacitance (CR*) obtained for the well-watered sole wheat crops increased rapidly over time until DAP 65 for cultivars ‘Mv Nádor’ (9.2 nF) and ‘Mv Kolompos’ (13.0 nF), and until DAP 77 for YQCCP (11.3 nF; Figure 1a). The peak of CR* coincided with the early or full flowering stage (BBCH 61–65) in each case. The intercropped wheats showed similar phenology and temporal CR* patterns. The presence of pea caused a decrease in wheat root capacitance (with maxima of 7.6, 11.2 and 10.7 nF for ‘Mv Nádor’, ‘Mv Kolompos’ and YQCCP, respectively); in general, this effect was significant from DAP 31 (stem elongation) to DAP 88 (milky or early dough) (Table S1).
Under drought, both sole and intercropped wheat exhibited a moderate increase in CR* over time, with peak values ranging from 4.4 to 7.0 nF on DAP 53 (boot stage; BBCH 41–49) for the various cultivars (Figure 1b). Wheat phenology was accelerated by drought, especially for YQCCP, which flowered two weeks earlier. Drought provoked a sudden decrease in CR* after flowering (between DAP 65 and 88) in all treatments. As in the case of the well-watered treatment, the pea intercrop significantly reduced wheat root capacitance under drought during the greater part of the growing season (Table S1). In each treatment, drought resulted in a significant decrease in CR* from DAP 21 (leaf development stage; BBCH 14–15) onwards (Table S2).

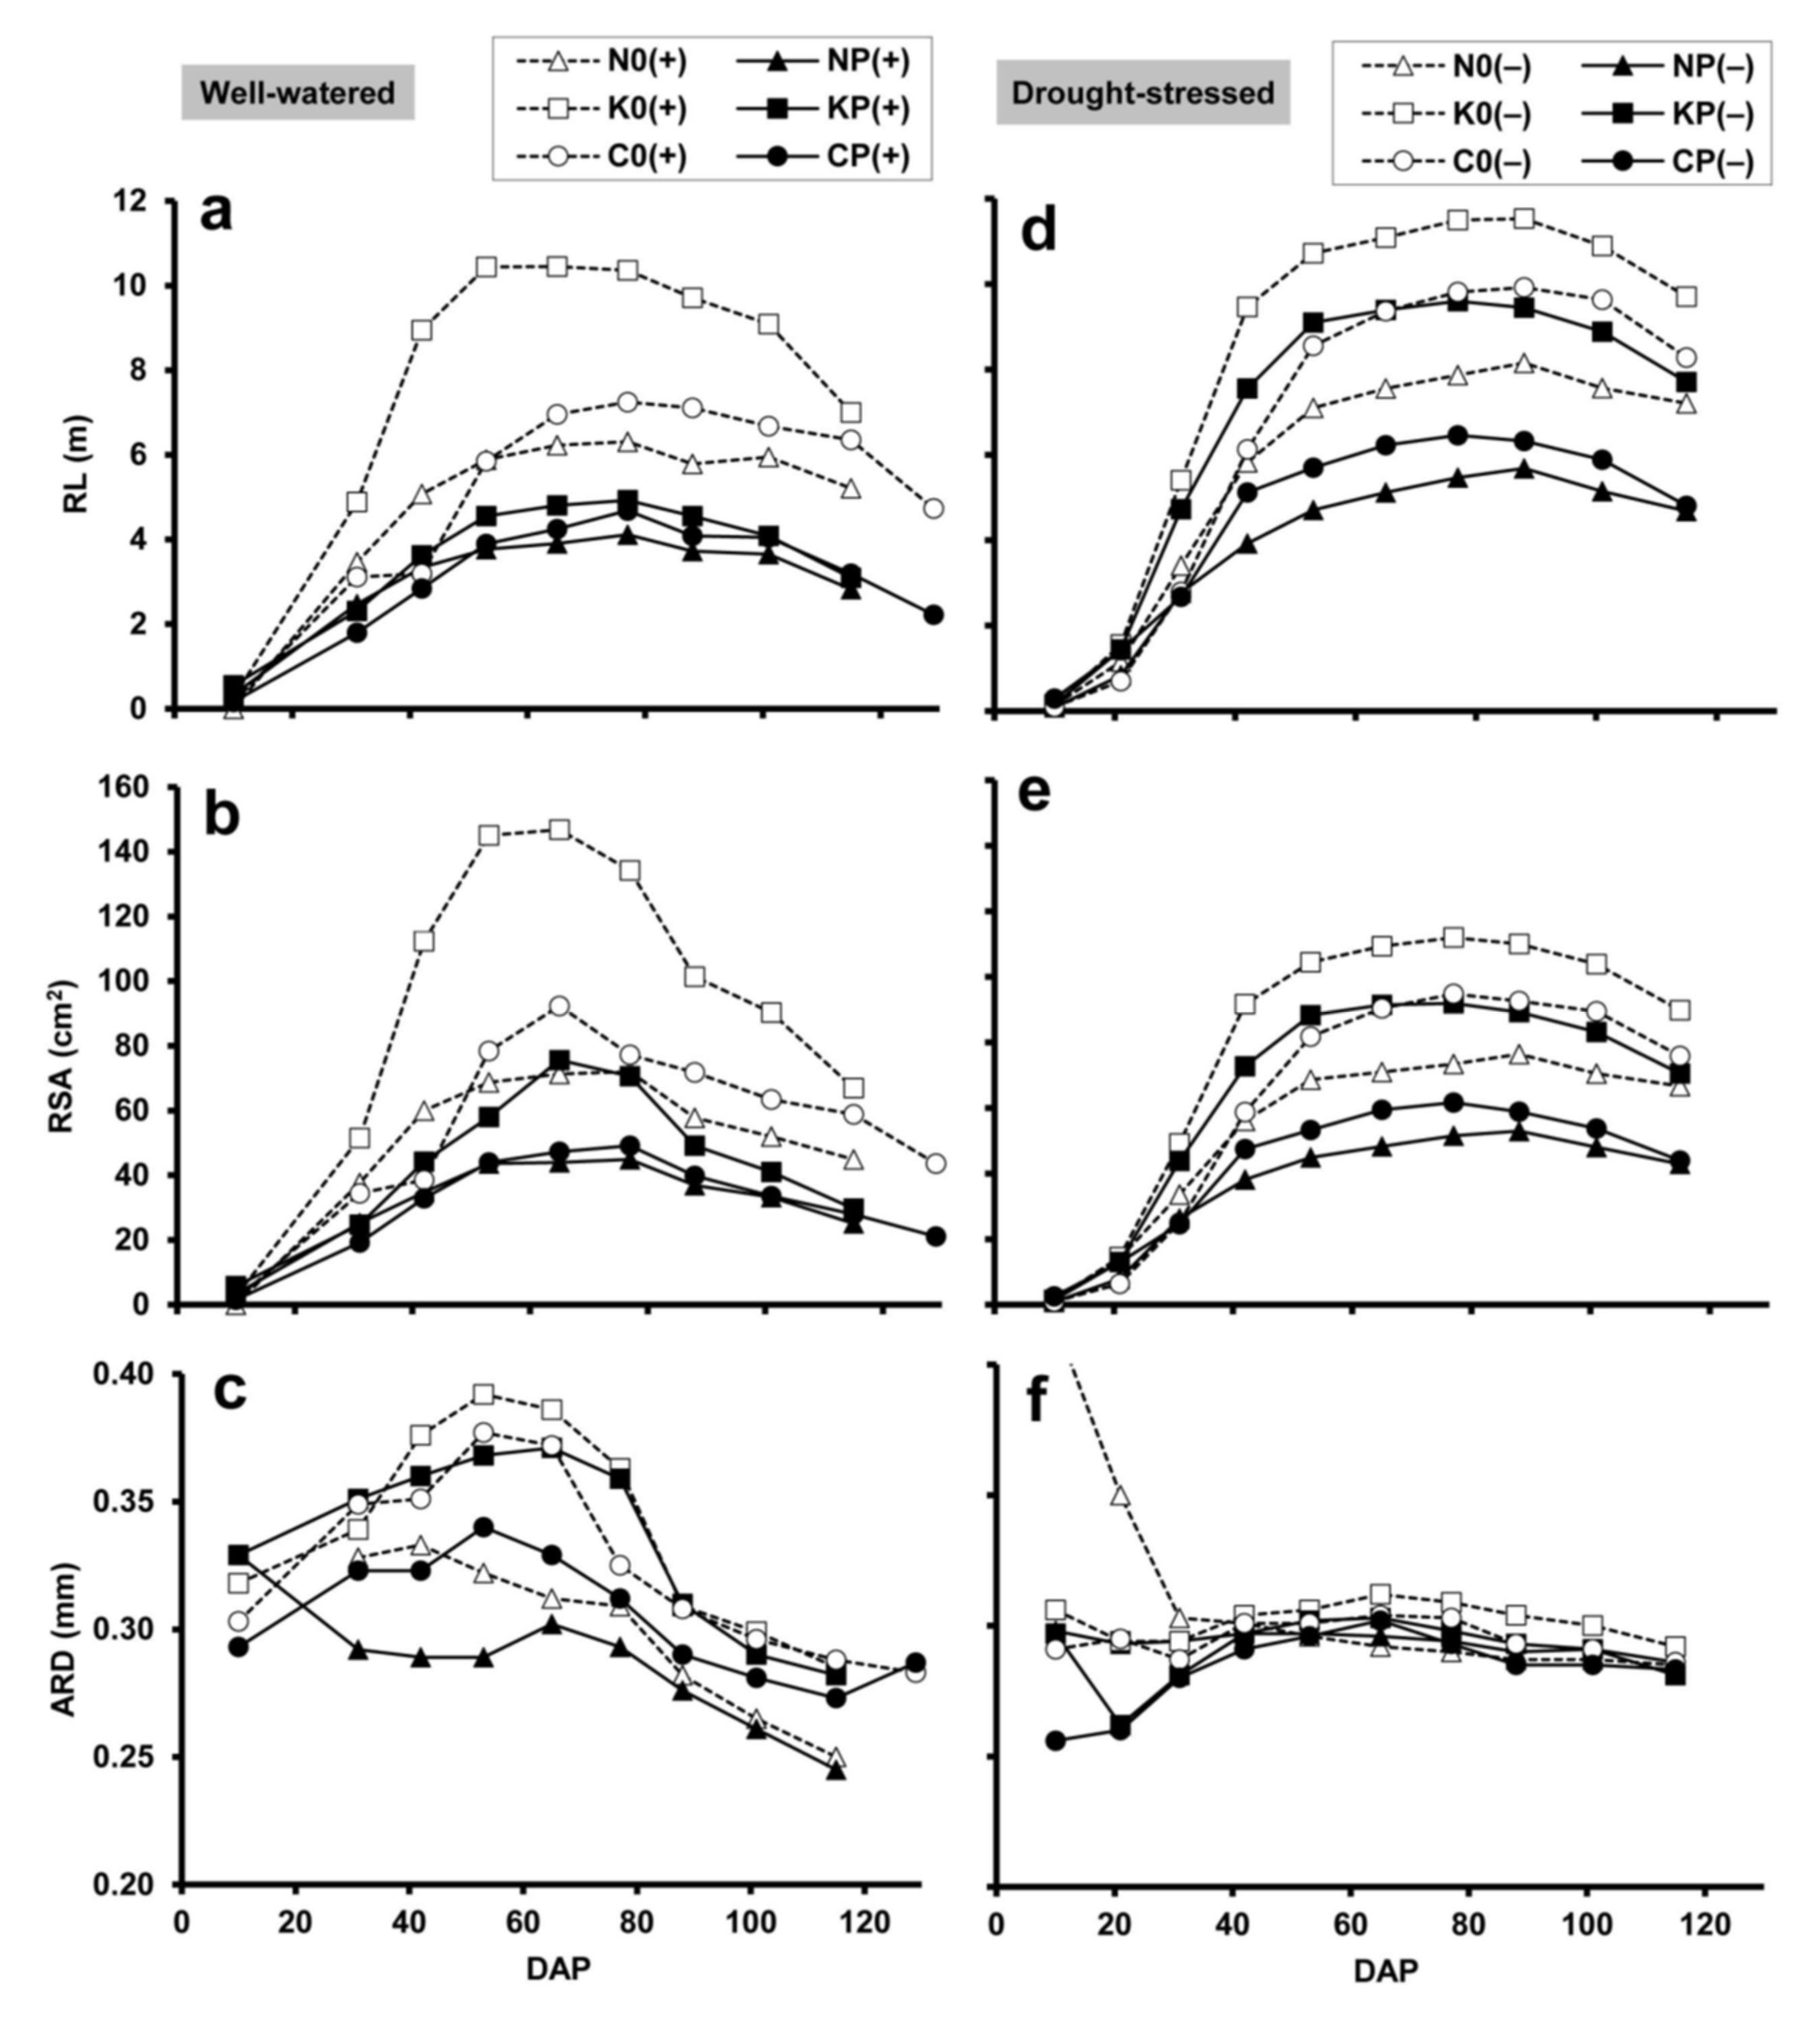
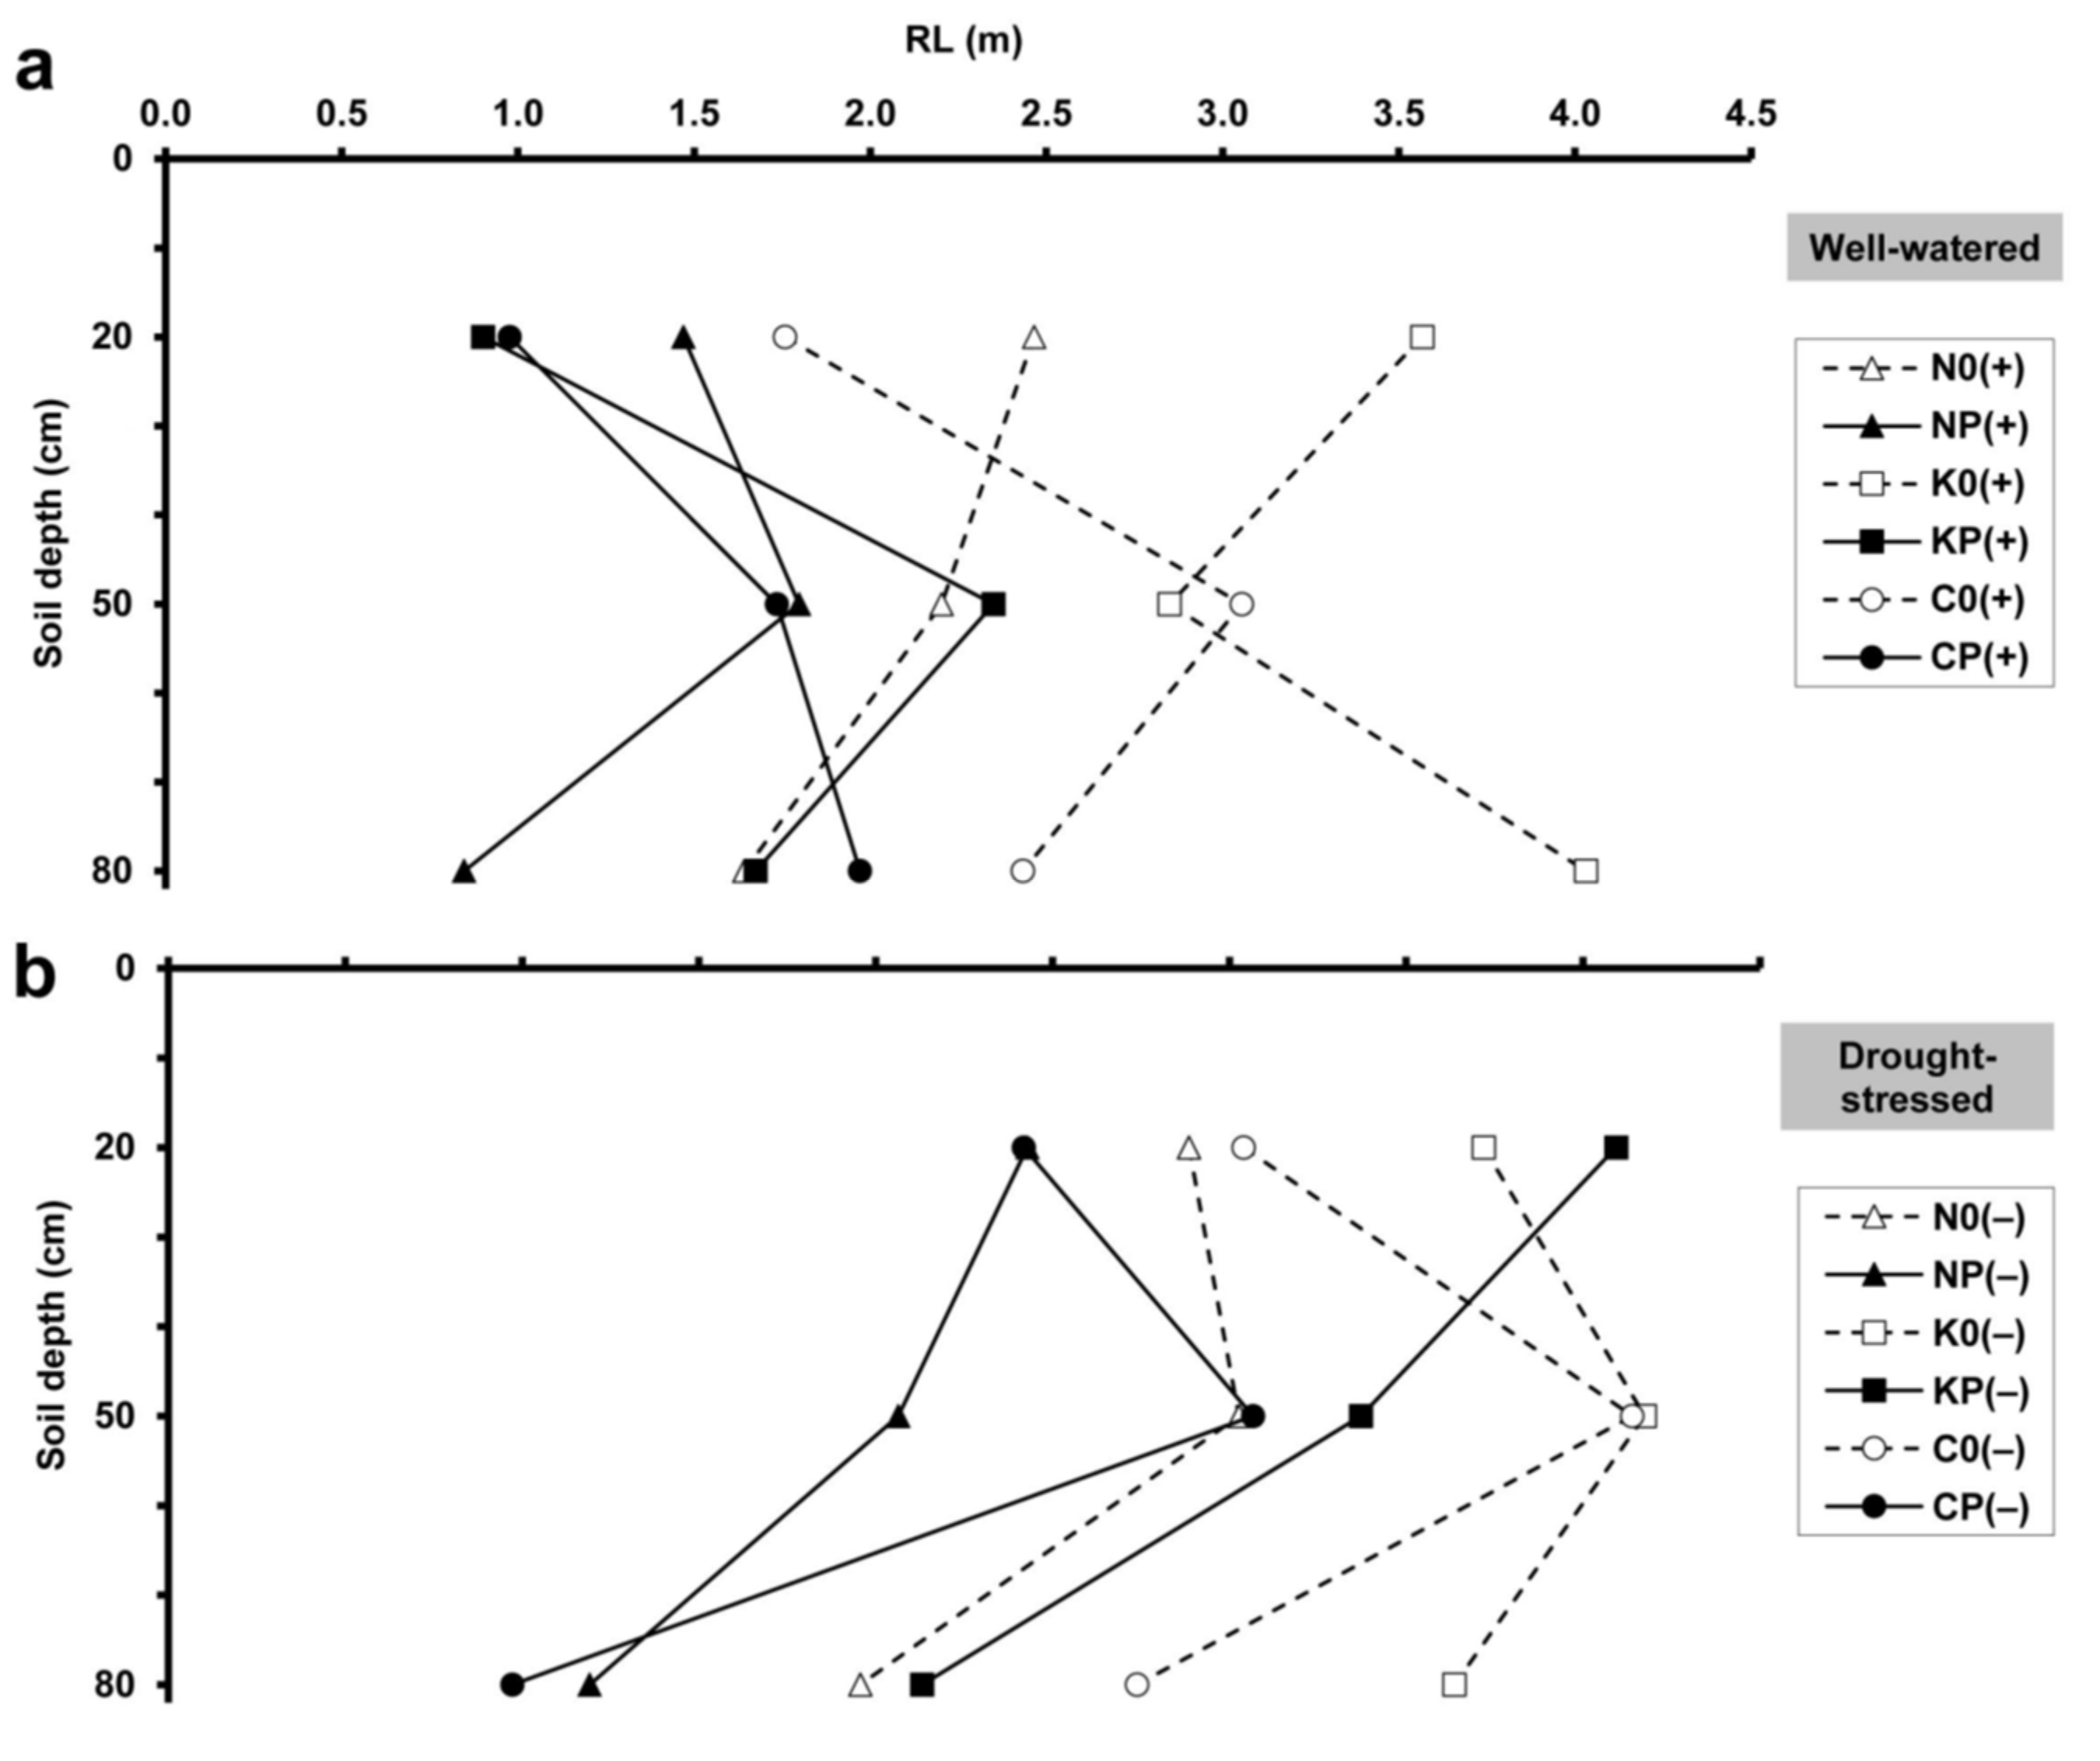
2.2. Minirhizotron Image Analysis

MR image analysis demonstrated that the total RL and RSA (at 20–80 cm depths) of the well-watered crops increased rapidly until the flowering period (DAP 65–77), and subsequently declined to maturity (Figure 2a,b). In both the sole and mixed crops, the root system proved to be relatively small, medium and large, respectively for ‘Mv Nádor’, YQCCP and ‘Mv Kolompos’. According to the paired t test, maxima of RL and RSA were significantly (p < 0.01) higher in the sole wheat culture compared to the corresponding mixture. ARD showed similar temporal patterns, reaching a maximum between DAP 42 (late stem elongation; BBCH 34–36) and DAP 65 (early flowering), and gradually decreased thereafter (Figure 2c). Wheat genotypes ‘Mv Nádor’, YQCCP and ‘Mv Kolompos’ were characterized by thin, medium and thick root systems, respectively. In the pure wheat stands ARD significantly (p < 0.01) exceeded that of the intercrop counterparts.
Under drought conditions, there was a prolonged increment in total RL and RSA until DAP 77 or 88 (milky or dough stages; BBCH 75–85), followed by a slight decline during maturity (Figure 2d,e). Apart from this, the differences observed in these root traits between the wheat types and between the sole and intercrops were similar to those obtained for the corresponding well-watered treatments. In most cases, water deficit increased the maximum RL and RSA, the only exception being the ‘Mv Kolompos’ sole crop, in which RSA was reduced by drought (however, this could be due to the relatively high basis of comparison with the well-watered plants). The paired t test showed that the maximum of RL was significantly (p < 0.01) increased by drought. The peak value of ARD was significantly (p < 0.05) reduced both due to intercropping and due to drought, and was found to be less variable between the treatments and over time under drought conditions (Figure 2f).
The well-watered wheat cultivars showed different RL distributions in the soil profile (Figure 3a), while in dry soil all three wheats exhibited the highest RL at the 50 cm depth (Figure 3b). RL was usually reduced by intercropping with pea and was increased by drought at each depth.

2.3. Chlorophyll Content and Yield Components

The SPAD values measured for wheat leaves ranged from 45.2 ± 0.5 to 54.1 ± 2.5 (mean ± SD; n = 15; Figure 4a). The presence of pea led to an overall decrease in chlorophyll content, but the change was only significant in the case of well-watered ‘Mv Nádor’ (p < 0.01), drought-stressed ‘Mv Kolompos’ (p < 0.05) and YQCCP (p < 0.001). Water deficit significantly (p < 0.01) reduced the SPAD value in each treatment.
Total wheat SDM per treatment was found to be between 138 and 508 g (Figure 4b). When wheat genotypes grown under the same experimental conditions were compared, SDM was always relatively low, medium and high for ‘Mv Nádor’, ‘Mv Kolompos’ and YQCCP, respectively. According to the paired t test, SDM was reduced both by intercropping (p < 0.05) and particularly by drought stress (p < 0.01).
Total wheat GY varied between 36 and 167 g in the treatments (Figure 4c). Unlike SDM, sole-cropped ‘Mv Kolompos’ had the highest GY under well-watered conditions, and in the case of drought, ‘Mv Nádor’ exhibited the highest and YQCCP the lowest GY in both sole and mixed stands. The effect of pea intercropping and drought on GY was significant at the p < 0.05 and p < 0.01 levels, respectively.

2.4. Relative Changes in Plant Parameters

The percentage changes in maximum CR*, SDM, GY and maximum RSA in response to pea intercropping and drought were calculated for each wheat genotype. In the case of well-watered plants, the relative decrease in CR*, SDM and GY caused by pea intercropping was the lowest (5%, 7% and 17%, respectively) for YQCCP, and the highest (18%, 23% and 54%) for ‘Mv Nádor’ (Figure 5a). Conversely, RSA showed a considerable reduction for ‘Mv Kolompos’ (49%) and the composite population (47%), and a relatively moderate decrease for ‘Mv Nádor’ (38%).
The presence of pea resulted in a similar decrease (11–15%) in CR* for all the cultivars when grown under drought conditions (Figure 5a). SDM, GY and RSA dropped by 7–21%, 23–36% and 18–35%, respectively, compared to the sole crops. Pea caused the highest relative changes in CR*, SDM and RSA in the YQCCP population, whereas the greatest loss in GY was observed for the cultivar ‘Mv Kolompos’.
Drought stress reduced CR* by 32–59%, SDM by 41–68% and GY by 29–73% (Figure 5b). In both sole and intercrops, the relative changes in all three parameters were comparatively low, medium and high for genotypes ‘Mv Nádor’, ‘Mv Kolompos’ and YQCCP, respectively. Except for the ‘Mv Kolompos’ sole crop, RSA was increased by drought in all cases (by 3–25%), but more intensely in the intercrops.

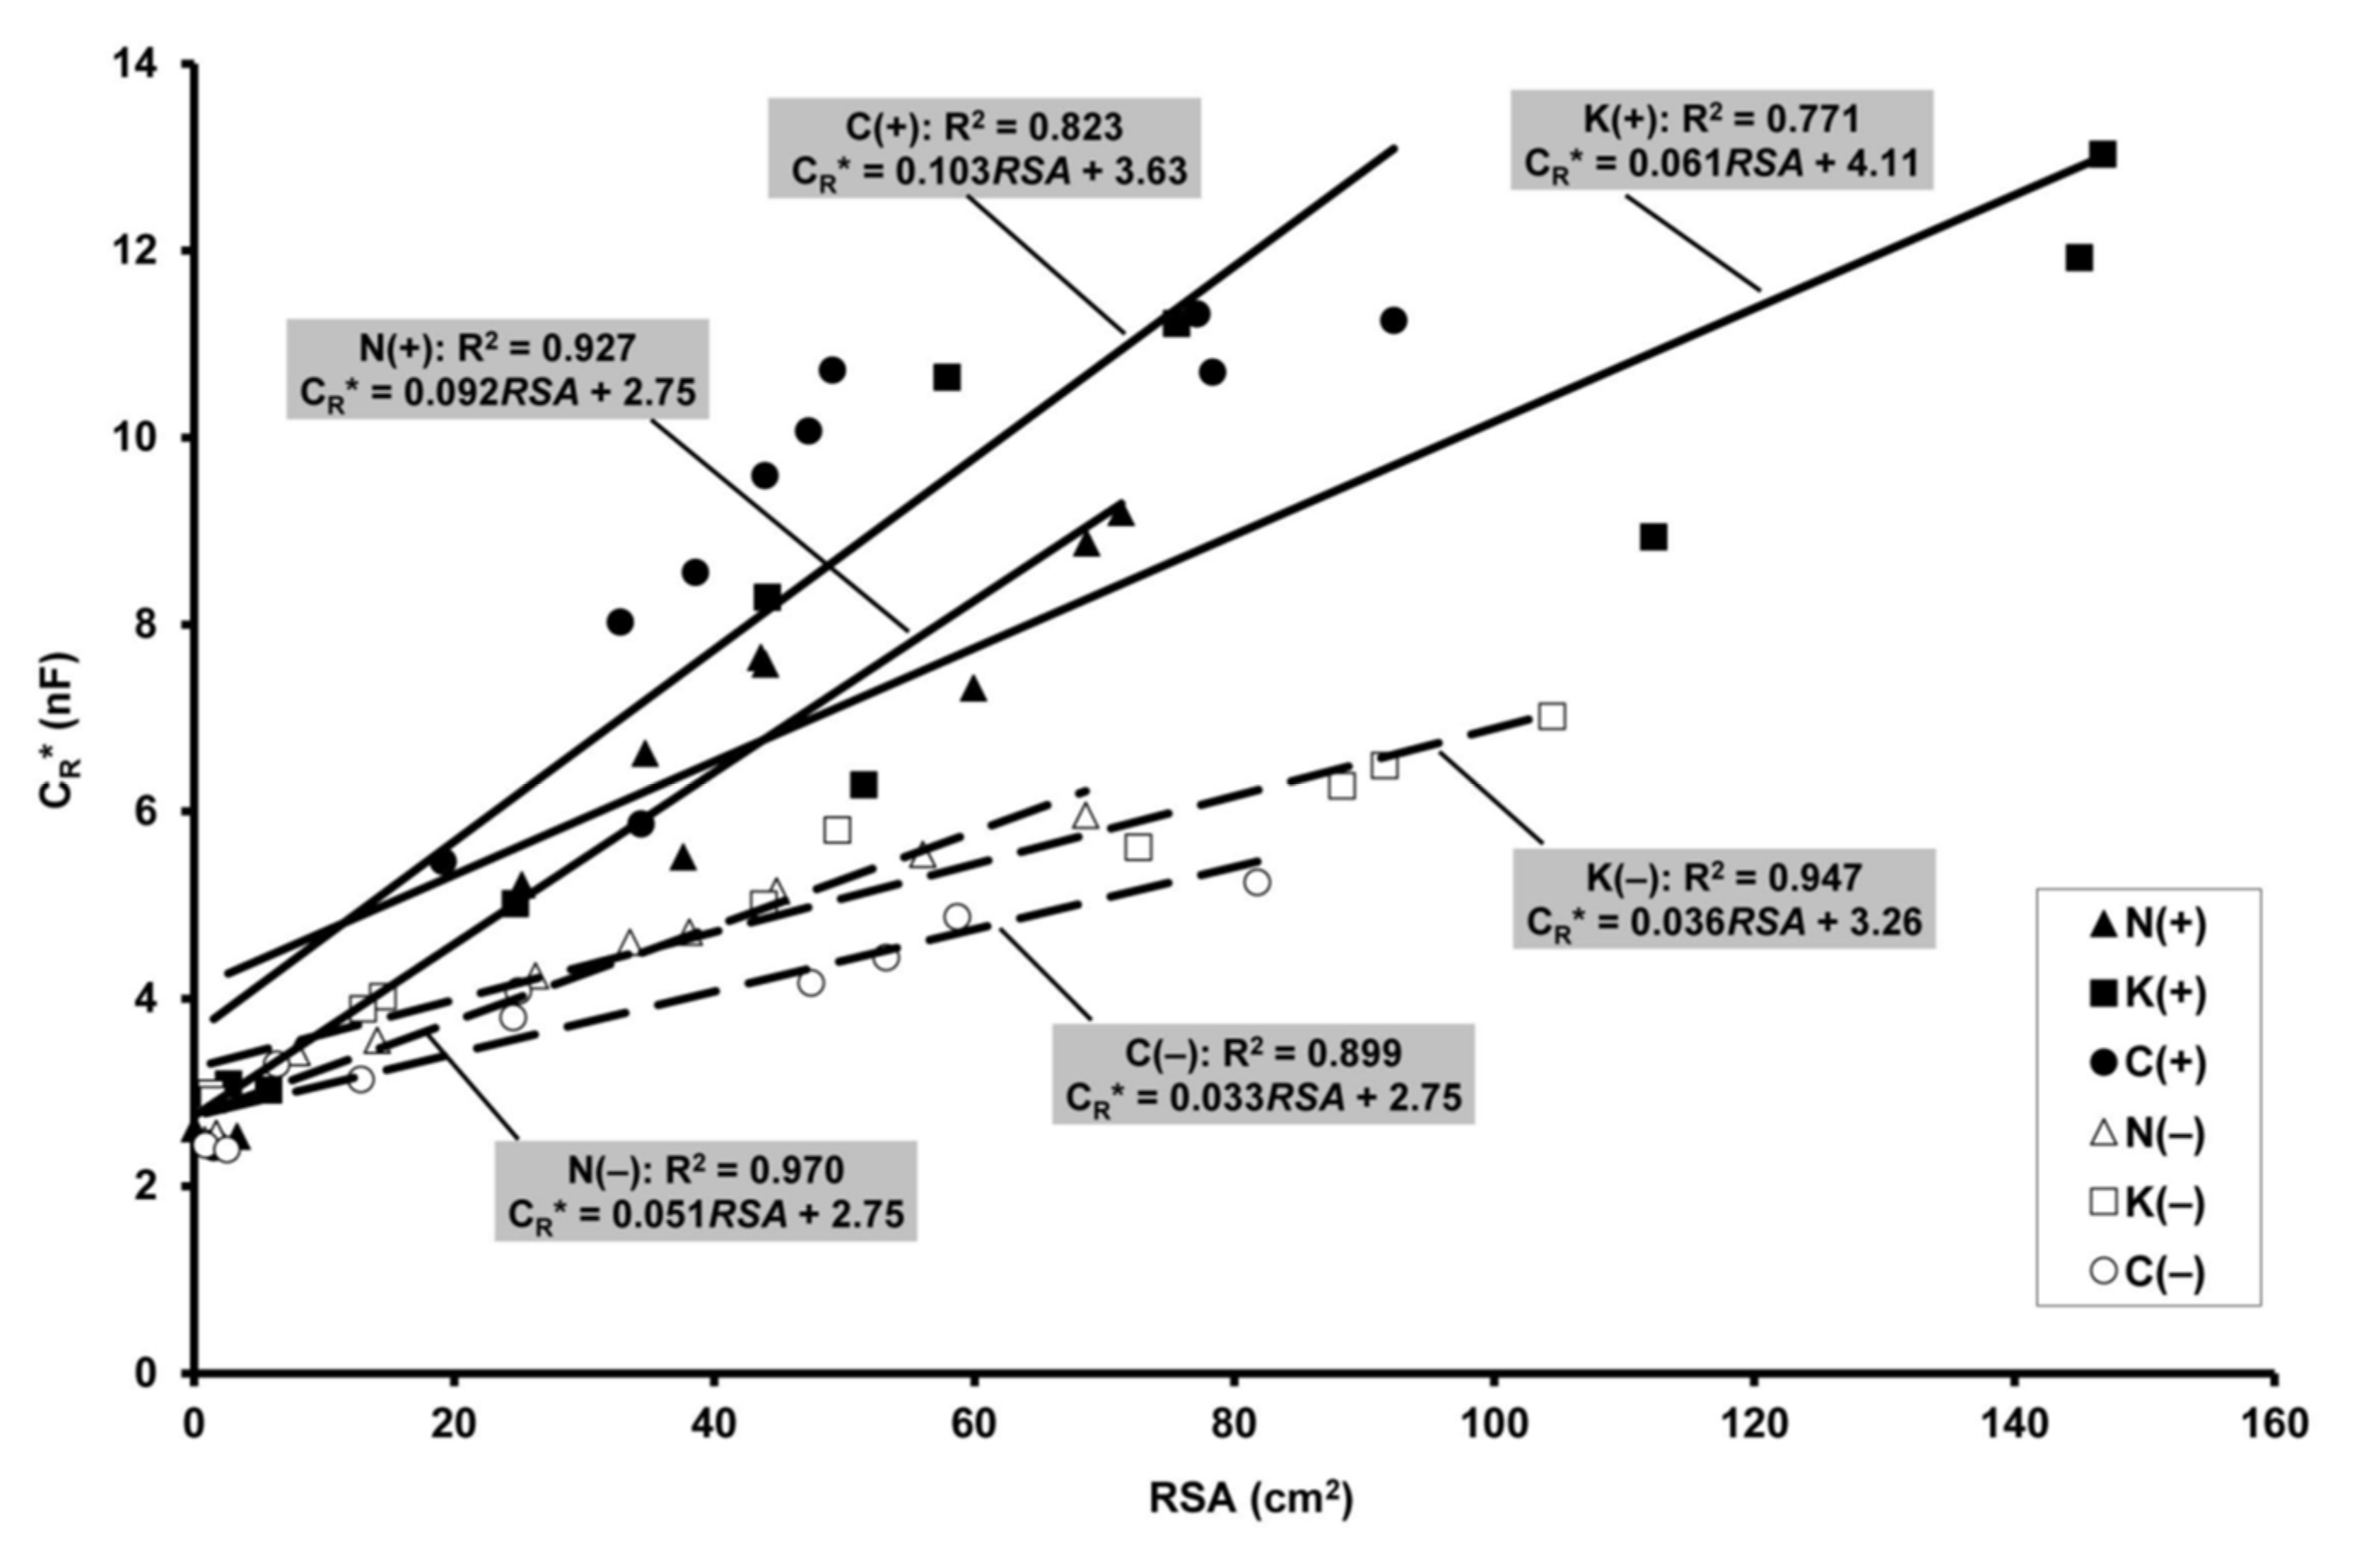
2.5. Relationship of Electrical Capacitance to Root Surface Area

Highly significant positive linear correlations (F: 26.9–255; R2: 0.771–0.970; p < 0.001) were found between CR* and RSA for each wheat genotype and water supply (Figure 6). Analysis of covariance showed significant differences in regression slope between the genotypes under both well-watered (F2,26 = 6.46; p < 0.01) and drought-stressed conditions (F2,24 = 5.08; p < 0.05). Drought decreased the slope significantly for ‘Mv Nádor’ (F1,16 = 25.3; p < 0.01) and YQCCP (F1,18 = 15.8; p < 0.01), but non-significantly for ‘Mv Kolompos’ (F1,16 = 3.00; p > 0.05).

3. Discussion

3.1. Root Dynamics

Both CR* and the MR-based root properties were found to exhibit strong patterns depending on growth status, peaking at wheat flowering for the well-watered treatments. In the case of water deficit, CR* had already started to decrease at booting, whereas the peaks of RL and RSA were postponed to the milky or dough stages. These findings are consistent with data in the literature obtained using various root methods. Annuals translocate and assimilate preferentially to the aboveground parts after flowering, and RSS increases slightly or even declines as the roots decay [33]. Previous studies reported maximum wheat root biomass, root length and root activity (water use) at about anthesis [34,35], with strong links to the concurrent peaks of green leaf area and whole-plant transpiration [36]. However, the patterns of wheat root growth may be less determinate [37], as was indicated in the present experiment by the CR* and RL data obtained for the composite cross population YQCCP, which was genetically and phenologically heterogeneous [38]. Wheat ARD was reported to peak during the flowering stages, and was found to be smaller in dry soil [22].

3.2. Effect of Drought and Intercropping

Drought stress shortened the wheat vegetation period. Root activity (CR*) began to decline before flowering, and showed a sudden decrease thereafter, due to enhanced lignification and accelerated root senescence [13,39]. Nevertheless, the decreasing trend in RL and RSA was observed later under drought. This was reported due to the delayed disappearance of dead roots (the visual determination of when roots reach the dead stage is subjective), especially in dry soil, where decomposition is slower [40].
The CR and MR methods indicated that the presence of pea had a negative effect on root growth parameters. Although intercropping systems generally give a higher total yield compared to sole crops (higher land equivalent ratio), the single component species often responds to intercropping with a reduction in biomass and grain yield [41]. The high plant density in additive intercrops often leads to strong interspecific competition between wheat and legumes below ground for soil nutrients and water (principally under drought), and above ground for light [41,42]. It was reported that pea cultivars with vigorous early development and climbing growth habit tended to overgrow the wheat (which provided mechanical support), limiting light interception for the cereal canopy [43]. This was clearly observed in the present study: pea overtopped the wheat, and tied up the wheat leaves with tendrils during the vegetative phase. Pea significantly reduced the SPAD chlorophyll content in well-watered ‘Mv Nádor’ and in drought-stressed ‘Mv Kolompos’ and YQCCP, in which greater aboveground biomass loss was detected under the given experimental conditions. The decreased chlorophyll content of flag leaf (the major source leaf) by drought indicated an enhanced senescence and nutrient remobilization, leading to reduced shoot and root productivity and grain yield [44,45]. ‘Mv Nádor’ and YQCCP were the least and the most tolerant to intercropping, respectively, under well-watered conditions, in contrast with the tolerance under drought. The reduction in cereal yield by the competitive interactions may be overcome by reducing the intercrop density.

3.3. Benefits and Drawbacks of the Combined Approach of CR and MR

The two different root methods provided apparently conflicting results, in that drought stress substantially decreased maximum CR* (by 32–59%), but increased RL and RSA. Increase in root mass is a common response to limited water supply, but plant responses to drought depend greatly on timing, duration and severity [39]. In the present case, the drought was relatively moderate during the early growth stages, but became severe during flowering and grain filling, which are the most sensitive periods of wheat growth [33]. Mild drought in early growth stages have been reported not to inhibit or even to stimulate wheat root production [46], as was indicated by the present MR investigation. In accordance with the current CR* data, severe drought was observed to reduce root activity by reducing the uptake of water and promoting tissue maturation [39]. Nevertheless, another possible explanation for the decreased CR* is the smaller shoot growth and stem diameter, altering the allometry between root and shoot [8,9]. This should be taken into account as well, considering the distinct depths of MR and CR measurements, and the uncertainties about the relative influence of deep vs. shallow roots on CR* [2,10].
An enhanced root/shoot ratio under drought is considered a typical response of plants, including wheat [46], to water deficit. In relative terms, the restricted aboveground growth (associated with reduced leaf area and total plant transpiration) decreased the water uptake of the whole root system, indicated by the decline in CR*. Comparing the wheat cultivars studied, the relative change in maximum CR* induced by drought (like the effect of pea intercropping) was proportional to that in SDM and GY. ‘Mv Nádor’ was found to be the most tolerant to drought both in the sole crop and the intercrop, while the YQCCP was the most sensitive. Drought-stressed plants exhibited lower specific root capacitance (per unit RSA), manifested in the smaller slopes of the CR*–RSA regression lines. On the one hand, this finding may support the functional aspect of the CR method, pointing out that CR represents not only the geometrical size but also the physiological status (e.g., tissue maturity, root decay) of the root system. On the other hand, however, it demonstrates the limited comparison ability of capacitance data collected under contrasting growth conditions due to their different relationships with real RSS values. It is notable that the MR data indicated a larger RSS under drought, while the CR measurements did not show such a trend at all.
Many previous studies demonstrated that MR-based RL and RSA data measured at anthesis in winter wheat (mainly in deeper soil layers) were positively correlated with plant water use and grain yield [24,33,47]. However, this was not the case in the present experiment, where well-watered and severely drought-stressed plants were compared. CR* proved to be a more sensitive indicator of SDM and GY losses. Nevertheless, if the capacitance method is applied alone, it remains unclear to what extent the change in root size or root activity, or even only the altered root to shoot ratio (reduced stem cross-sectional area), affects CR*. Transformation of measured CR into CR* using predetermined specific calibrations is only required to monitor root dynamics in field-grown plants under variable SWC, but is unnecessary for single measurements (which should be made around anthesis) performed under spatially homogeneous moisture conditions [16]. However, caution is required when applying the capacitance technique to compare cultivars, considering that, as verified in the current study, the relationship between CR* and RSS may differ markedly. Furthermore, drought-induced changes in root membrane thickness and root depth distribution (including the death of shallow fine roots and the proliferation of deep roots) can be expected to weaken the capacitance response [10,13].

3.4. Conclusions

The current research confirmed that the CR and MR measurements reveal different characteristics of the root system. The parallel use of the two methods in the same plant–soil system is able to give more information about the seasonal pattern of root growth and function, and principally about the influence of experimental conditions on root traits. Root capacitance predicts the accompanying effects on aboveground biomass production and grain yield in a comparative study, whereas the MR method is more suitable for quantifying relevant RSS variables. The concurrent application of the two non-destructive techniques could provide a better understanding of how various crop genotypes respond to different cultivation practices (e.g., tillage, sowing density, fertilization) or environmental conditions (e.g., drought, elevated CO2, nutrient deficiencies). The dual methodology could be particularly beneficial under contrasting growing conditions (when root and shoot development is often asynchronous), and in plant mixtures, in which the roots of the component species are difficult to distinguish with the MR method. Nevertheless, considering the lack of treatment replications in the present model system, more extensive studies are needed for better evaluation of the benefits and drawbacks of using both techniques combined, and to fill the gap of knowledge about the disparity of changes in CR and MR data under stress.

4. Materials and Methods

4.1. Plant Material and Growth Conditions

The experimental design was factorial with (1) three winter wheat (Triticum aestivum L.) genotypes: the cultivars ‘Mv Nádor’ (“N”) and ‘Mv Kolompos’ (“K”) and the YQCCP composite cross population (“C”); (2) two cropping systems: wheat as sole crop (“0”) and a wheat–pea (Pisum sativum L., cv. Aviron) intercrop (“P”); and (3) two water treatments: well-watered (“+”) and drought-stressed (“–“). ‘Mv Nádor’ is an intensive, short (60–80 cm), early maturing variety, whereas ‘Mv Kolompos’ is a robust, less intensive, medium-tall (85–95 cm), medium-early cultivar. The late maturing composite cross population was created by crossing 20 parental lines in the Organic Research Centre, UK [38]. The wheat cultivars selected for the experiment were examined as a model genotypes of conventional (‘Mv Nádor’) and organic (‘Mv Kolompos’) farming systems, while the population (YQCCP) was used as a model to examine the effects of an organic heterogeneous material compared to the homogeneous varieties. The winter pea ‘Aviron’ is a determinate, semi-leaflet, medium-early, medium-tall (70–85 cm) cultivar with rapid early growth.
Six 1000 L cubic plastic containers were used, two (a well-watered and a drought-stressed) for each wheat genotype (Figure S1). Each container was divided into two parts (with 0.5 m2 surface area) by placing a 2 cm thick plastic sheet vertically, to separate the sole crop of a given genotype from the corresponding intercrop. Perpendicular to the sheet, three clear polycarbonate MR tubes (110 cm long, 70 mm outer diameter, 4 mm wall thickness) with end caps were installed horizontally through each container at depths of 20, 50 and 80 cm below the soil surface [21]. The containers were filled with topsoil (0–30 cm) taken from the nearby certified organic field (N 47°18′41″, E 18°46′48″). The soil was a haplic chernozem according to the FAO-WRB [48] classification, which consisted of 36.2% sand, 40.7% silt and 23.1% clay, with a pHH2O of 7.61, 16.3 mmol 100 g–1 cation exchange capacity, 1.70% CaCO3, 3.36% humus content, 1822/364/459 mg kg–1 N/P/K content, and 1.42 g cm–3 bulk density. The SWC values at saturation, field capacity and wilting point were 47.9%, 28.9% and 8.7%, respectively (the soil water retention curve was determined with a pressure membrane apparatus). The soil packed into the three well-watered containers was at around field capacity, but for the three drought-stressed containers the soil was first spread out to dry to approx. half of field capacity. The bottom of the containers was filled with fist-size stones covered with agro-textile to ensure drainage. Large clods were broken up, organic debris was removed, and the soil was compacted carefully during filling (to avoid injuring the MR tubes). SWC at 20 and 50 cm soil depths was recorded every 2 h in each experimental unit with Decagon EC-5 sensors (Decagon Devices Inc., Pullman, WA, USA) connected to Em5b dataloggers.
Wheat seeds were germinated in moistened 30 mm Jiffy peat pellets (Jiffy Int. AS, Kristiansand, Norway) at 22 °C for 10 days, after which the seedlings were vernalized for 6 weeks at +4 °C, 10/14 h (light/dark). Ten days before the end of vernalization, pea seeds were germinated in the same way and were planted in the containers concurrently with the wheat. Each container held a sole crop of a genotype on the one side, and the intercrop of the same genotype on the other side. Each treatment (occupied a half container) consisted of 4 rows of 38 wheat plants with 12.5 cm row spacing (0.5 × 1 m; ~300 plants m–2), perpendicular to the MR tubes. Intercropping was additive, with 25 pea plants (50 plants m–2), five in each wheat interrow and longitudinal edge. The containers were maintained in a tempered greenhouse, initially at 15/10 °C for 12/12 h (light/dark), changing gradually to 23/18 °C for 16/8 h during the plant growth period. The containers were arranged in two rows according to the irrigation regime, with different orders for the genotypes within a row. The orientation ensured the uniform light and ventilation conditions for each container. The SWC in the three well-watered containers was reduced to 60–70% field capacity (17–20 v/v%), and then kept at this level by weekly irrigation. The three drought-stressed containers were given a little water (5 mm) at planting, after which the soil was allowed to dry to near wilting point (~9 v/v%), which was maintained by slight (6–10 mm) irrigations thereafter.
In the well-watered containers, the SWC at 20 and 50 cm depths decreased from field capacity to 17–20 v/v% by approx. DAP (days after planting) 70 (Figure S2), and varied between 18 and 25 v/v% in the 0–12 cm layer on the days when CR measurements were made. In the case of drought stress, the soil moisture approached the wilting point at 20 and 50 cm by DAP 50 (wheat booting stage) and DAP 70 (end of flowering), respectively. A range from 9 to 12 v/v% SWC values were detected at 0–12 cm during the CR measurements.

4.2. Electrical Capacitance Measurements

Electrical measurements were performed on ten occasions throughout the growing season, between DAP 10 and 115, and an eleventh measurement was made on DAP 129 for the well-watered composite wheat owing to its longer growth period. Thirty wheat plants were randomly selected from the inner rows of each treatment. The SWC at 0–12 cm (equal to the insertion depth of the CR ground electrode) was recorded in the root zone of each individual plant with a pre-calibrated Campbell CS620 handheld TDR meter (Campbell Sci. Ltd., Loughborough, UK). Volumetric SWC values were converted to relative water saturation (θrel) on the basis of the predefined saturation water content. Thereafter, parallel CR was measured for each selected plant with an Agilent U1733C portable LCR instrument (Agilent Co. Ltd., Penang, Malaysia) at 1 kHz, 1 V AC. The ground electrode was a stainless steel rod, 15 cm long and 6 mm in diameter (303S31; RS Pro GmbH, Gmünd, Austria), pushed vertically into the soil 5 cm from the stem to a depths of 12 cm. The plant electrode was clamped to a 4 mm wide strip cut from a 25 µm thick aluminum foil. The strip was smeared with conductivity gel, and was tied around all the basal parts of the plant 15 mm above the soil surface [20].
In order to take the spatial and temporal variability in SWC into account, all the CR data were converted into an apparent (saturation) capacitance, CR*, according to the species-specific function: CR* = CR·5.807e–1.775θrel, using the θrel values associated with the relevant CR. A detailed description of how the empirical equations were calculated can be found in Cseresnyés et al. [15] CR*, which is equivalent in practice to the capacitance measured in a water-saturated soil (θrel = 1), was considered as a proxy of the functional root extent (root activity). The wheat growth stage was determined on each measurement day using the BBCH scale [49].

4.3. Minirhizotron Technique

Only one MR tube per soil depth was installed in each treatment because of the relatively small container volume. MR was primarily used to track the root seasonal patterns and to evaluate the effect of intercropping and drought. On the same days when CR was detected, root images (21.6 × 19.6 cm; 300 dpi) were recorded for each treatment and depth using a CI-600 rotary scanner (CID Bio-Science Inc., Camas, WA, USA) set to the same position in the MR tube throughout the experiment. No images were taken in the well-watered containers on DAP 21 due to a technical problem.
The images were processed with RootSnap! software (ver. 1.3.2.25), which provided root length (RL), root surface area (RSA) and average root diameter (ARD). As it was impossible to distinguish between wheat and pea roots, the total root pool of the component species was evaluated. Nevertheless, wheat roots were considered to be dominant due to the much higher planting density and the dense adventitious root system [50]. Only active roots, identified by their white to pale brown color, were considered, whereas dark brown, blurry roots were disregarded [21].

4.4. Leaf Chlorophyll Content and Post-Harvest Measurements

The flag leaf chlorophyll content was estimated in situ at anthesis to characterize the physiological status of wheat grown under different conditions. Fifteen plants from the central rows of each treatment were investigated using a Minolta SPAD-502 m (Konica Minolta Inc., Osaka, Japan). Three measurements taken on the same plant were averaged.
At wheat maturity (on DAP 130 and 119 for the well-watered and drought-stressed treatments, respectively), the two crops were hand harvested separately just above the soil surface. The wheat biomass was oven-dried at 70 °C to constant weight to determine the total shoot dry mass (SDM), after which the ears were threshed manually to obtain the total grain yield (GY).

4.5. Data Analysis

The data were analyzed using Statistica software (ver. 13; StatSoft Inc., Tulsa, OK, USA). The effect of pea intercropping and drought on the CR* and SPAD values was evaluated with an unpaired t test (p < 0.05). Welch’s correction was applied when the F test indicated significant differences between the variances. A paired t test was used to analyze the influence of intercropping and drought on the maxima of RL, RSA and ARD, and on SDM and GY (in this case, treatments differing only in cropping design or in water regime were paired). Simple linear regression was performed to relate CR* to RSA. In this case, only the data collected until the wheat flowering stage (when CR* and RSA peaked) were used, and pooled over cultivar sole and intercrop. The reason for this is that the correlation between capacitance and root size properties is much stronger during the most active (vegetative to flowering) plant growth stages characterized by intensive root growth, and becomes weaker during maturity stages, when root suberization, reduced activity and death can result in a sudden decrease in capacitance [6,10]. The regression slopes were compared with analysis of covariance.

Supplementary Materials

The following are available online at www.mdpi.com/article/10.3390/plants10101991/s1. Table S1. Effect of pea intercropping on the apparent root electrical capacitance (CR*) of wheat at different plant ages (DAP: days after planting). Unpaired t test (n = 30) or Welch’s test [superscript (W) in the table] was used, based on the homogeneity of variances. NS: non-significant; * p < 0.05; ** p < 0.01; *** p < 0.001. Treatment codes: N: wheat cv. Mv Nádor; K: cv. Mv Kolompos; C: YQCCP population; 0: wheat sole crop; P: wheat–pea intercrop; (+): well-watered; (–): drought-stressed. Table S2. Effect of drought stress on the apparent root electrical capacitance (CR*) of wheat at different plant ages (DAP: days after planting). Unpaired t test (n = 30) or Welch’s test [superscript (W) in the table] was used, based on the homogeneity of variances. NS: non-significant; * p < 0.05; ** p < 0.01; *** p < 0.001. For treatments codes, see Table S1. Figure S1: Schematic for the experimental design. Treatment codes: N: wheat cv. Mv Nádor; K: cv. Mv Kolompos; C: YQCCP population; 0: wheat sole crop; P: wheat–pea intercrop; (+): well-watered; (–): drought-stressed. Figure S2: Changes in volumetric soil water content (SWC) with plant age (DAP: days after planting) in well-watered [(+)] and drought-stressed [(–)] treatments at different soil depths. SWC was recorded continuously at 20 and 50 cm depths using automatic data loggers, but only concurrently with root electrical capacitance measurements in the 0–12 cm layer with a handheld TDR meter. Data were averaged across the three wheat cultivars and two pea treatments. Horizontal dashed lines indicate water content at field capacity (FC; 0.02 MPa) and wilting point (WP; 1.5 MPa).

Author Contributions

I.C. conceptualized the methodological research, carried out capacitance measurements, read the relevant literature and drafted the paper. B.K. and T.T. provided expertise in minirhizotron method, analyzed root images and evaluated the data. A.F. performed the statistical analysis. R.K. and I.P. gave valuable help in plant measurements and data interpretation. M.M. participated in the setup and maintenance of the experiment. P.M. was responsible for funding acquisition and supervision of the H2020 project and reviewed the paper. All the authors improved the manuscript critically and approved the submission. All authors have read and agreed to the published version of the manuscript.

Funding

This research was funded by the European Union’s Horizon 2020 Research and Innovation Program under grant agreement No. 727217 (ReMIX (2017–2021); www.remix-intercrops.eu, accessed on 14 September 2021) and a János Bolyai Research Scholarship from the Hungarian Academy of Sciences.

Institutional Review Board Statement

Not applicable.

Informed Consent Statement

Not applicable.

Data Availability Statement

Not applicable.

Conflicts of Interest

The authors declare no conflict of interest.

Abbreviations

ACAlternating current
ARDAverage root diameter
CRRoot electrical capacitance
CR*Apparent (saturation) root electrical capacitance
DAPDays after planting
GYGrain yield
MRMinirhizotron
RLRoot length
RSARoot surface area
RSSRoot system size
SDMShoot dry mass
SWCSoil water content

References

  1. Faget, M.; Nagel, K.A.; Walter, A.; Herrera, J.M.; Jahnke, S.; Schurr, U.; Temperton, V.M. Root–root interactions: Extending our perspective to be more inclusive of the range of theories in ecology and agriculture using in-vivo analyses. Ann. Bot. 2013, 112, 253–266. [Google Scholar] [CrossRef] [Green Version]
  2. Maeght, J.-L.; Rewald, B.; Pierret, A. How to study deep roots–and why it matters. Front. Plant Sci. 2013, 4, 299. [Google Scholar] [CrossRef] [Green Version]
  3. Postic, F.; Doussan, C. Benchmarking electrical methods for rapid estimation of root biomass. Plant Methods 2016, 12, 33. [Google Scholar] [CrossRef] [PubMed] [Green Version]
  4. Ehosioke, S.; Nguyen, F.; Rao, S.; Kremer, T.; Placencia-Gomez, E.; Huisman, J.A.; Kemna, A.; Javaux, M.; Garré, S. Sensing the electrical properties of roots: A review. Vadose Zone J. 2020, 19, e20082. [Google Scholar] [CrossRef]
  5. Chloupek, O. The relationship between electric capacitance and some other parameters of plant roots. Biol. Plant. 1972, 14, 227–230. [Google Scholar] [CrossRef]
  6. Dalton, F.N. In-situ root extent measurements by electrical capacitance methods. Plant Soil 1995, 173, 157–165. [Google Scholar] [CrossRef]
  7. Cabal, C.; de Deurwaerder, H.P.T.; Matesanz, S. Field methods to study the spatial root density distribution of individual plants. Plant Soil 2021, 462, 25–43. [Google Scholar] [CrossRef]
  8. Dietrich, R.C.; Bengough, A.G.; Jones, H.G.; White, P.J. A new physical interpretation of plant root capacitance. J. Exp. Bot. 2012, 63, 6149–6159. [Google Scholar] [CrossRef] [PubMed] [Green Version]
  9. Dietrich, R.C.; Bengough, A.G.; Jones, H.G.; White, P.J. Can root electrical capacitance be used to predict root mass in soil? Ann. Bot. 2013, 112, 457–464. [Google Scholar] [CrossRef] [Green Version]
  10. Peruzzo, L.; Chou, C.; Wu, Y.; Schmutz, M.; Mary, B.; Wagner, F.M.; Petrov, P.; Newman, G.; Blancaflor, E.B.; Liu, X.; et al. Imaging of plant current pathways for non-invasive root phenotyping using a newly developed electrical current source density approach. Plant Soil 2020, 450, 567–584. [Google Scholar] [CrossRef] [Green Version]
  11. Ozier-Lafontaine, H.; Bajazet, T. Analysis of root growth by impedance spectroscopy (EIS). Plant Soil 2005, 277, 299–313. [Google Scholar] [CrossRef]
  12. Čermák, J.; Ulrich, R.; Staněk, Z.; Koller, J.; Aubrecht, L. Electrical measurement of tree root absorbing surfaces by the earth impedance method: 2. Verification based on allometric relationships and root severing experiments. Tree Physiol. 2006, 26, 1113–1121. [Google Scholar] [CrossRef] [Green Version]
  13. Ellis, T.; Murray, W.; Paul, K.; Kavalieris, L.; Brophy, J.; Williams, C.; Maass, M. Electrical capacitance as a rapid non-invasive indicator of root length. Tree Physiol. 2013, 33, 3–17. [Google Scholar] [CrossRef] [PubMed] [Green Version]
  14. Cseresnyés, I.; Rajkai, K.; Takács, T. Indirect monitoring of root activity in soybean cultivars under contrasting moisture regimes by measuring electrical capacitance. Acta Physiol. Plant. 2016, 38, 121. [Google Scholar] [CrossRef]
  15. Cseresnyés, I.; Szitár, K.; Rajkai, K.; Füzy, A.; Mikó, P.; Kovács, R.; Takács, T. Application of electrical capacitance method for prediction of plant root mass and activity in field-grown crops. Front. Plant Sci. 2018, 9, 93. [Google Scholar] [CrossRef] [PubMed] [Green Version]
  16. Chloupek, O.; Dostál, V.; Středa, T.; Psota, V.; Dvořáčková, O. Drought tolerance of barley varieties in relation to their root system size. Plant Breed. 2010, 129, 630–636. [Google Scholar] [CrossRef]
  17. Aulen, M.; Shipley, B. Non-destructive estimation of root mass using electrical capacitance on ten herbaceous species. Plant Soil 2012, 355, 41–49. [Google Scholar] [CrossRef]
  18. Carlson, C.H.; Smart, L.B. Electrical capacitance as a predictor of root dry weight in shrub willow (Salix; Salicaceae) parents and progeny. Appl. Plant Sci. 2016, 4, 1600031. [Google Scholar] [CrossRef]
  19. Wu, W.; Duncan, R.W.; Ma, B.-L. Quantification of canola root morphological traits under heat and drought stresses with electrical measurements. Plant Soil 2017, 415, 229–244. [Google Scholar] [CrossRef]
  20. Svačina, P.; Středa, T.; Chloupek, O. Uncommon selection by root system size increases barley yield. Agron. Sustain. Dev. 2014, 34, 545–551. [Google Scholar] [CrossRef]
  21. Vamerali, T.; Bandiera, M.; Mosca, G. Minirhizotrons in modern root studies. In Measuring Roots; Mancuso, S., Ed.; Springer: Berlin, Germany, 2012; pp. 341–361. [Google Scholar] [CrossRef]
  22. Muñoz-Romero, V.; Benítez-Vega, J.; López-Bellido, L.; López-Bellido, R.J. Monitoring wheat root development in a rainfed vertisol: Tillage effect. Eur. J. Agron. 2010, 33, 182–187. [Google Scholar] [CrossRef]
  23. Milchunas, D.G. Estimating root production: Comparison of 11 methods in shortgrass steppe and review of biases. Ecosystems 2009, 12, 1381–1402. [Google Scholar] [CrossRef]
  24. Postic, F.; Beauchêne, K.; Gouache, D.; Doussan, C. Scanner-based minirhizotrons help to highlight relations between deep roots and yield in various wheat cultivars under combined water and nitrogen deficit conditions. Agronomy 2019, 9, 297. [Google Scholar] [CrossRef] [Green Version]
  25. Bedoussac, L.; Justes, E. The efficiency of a durum wheat–winter pea intercrop to improve yield and wheat grain protein concentration depends on N availability during early growth. Plant Soil 2010, 330, 19–35. [Google Scholar] [CrossRef]
  26. Pankou, C.; Lithourgidis, A.; Dordas, C. Effect of irrigation on intercropping systems of wheat (Triticum aestivum L.) with pea (Pisum sativum L.). Agronomy 2021, 11, 283. [Google Scholar] [CrossRef]
  27. Knörzer, H.; Graeff-Hönninger, S.; Guo, B.; Wang, P.; Claupein, W. The rediscovery of intercropping in China: A traditional cropping system for future Chinese agriculture. In Climate Change, Intercropping, Pest Control and Beneficial Microorganisms. Sustainable Agriculture Reviews 2; Lichtfouse, E., Ed.; Springer: Dordrecht, The Netherlands, 2009; pp. 13–44. [Google Scholar] [CrossRef]
  28. Aziz, M.; Mahmood, A.; Asif, M.; Ali, A. Wheat-based intercropping: A review. J. Anim. Plant Sci. 2015, 25, 896–907. [Google Scholar]
  29. Klimek-Kopyra, A.; Zając, T.; Oleksy, A.; Kulig, B. Biological and production responses of intercropped plants of pea, spring wheat, and linseed. Acta Agrobot. 2018, 71, 1737. [Google Scholar] [CrossRef] [Green Version]
  30. Ghaley, B.B.; Hauggaard-Nielsen, H.; Høgh-Jensen, H.; Jensen, E.S. Intercropping of wheat and pea as influenced by nitrogen fertilization. Nutr. Cycl. Agroecosyst. 2005, 73, 201–212. [Google Scholar] [CrossRef]
  31. Amossé, C.; Jeuffroy, M.-H.; David, C. Relay intercropping of legume cover crops in organic winter wheat: Effects on performance and resource availability. Field Crop. Res. 2013, 145, 78–87. [Google Scholar] [CrossRef]
  32. Naudin, C.; Corre-Hellou, G.; Pineau, S.; Crozat, Y.; Jeuffroy, M.-H. The effect of various dynamics of N availability on winter pea–wheat intercrops: Crop growth, N partitioning and symbiotic N2 fixation. Field Crop. Res. 2010, 119, 2–11. [Google Scholar] [CrossRef]
  33. Fageria, N.K. The Role of Plant Roots in Crop Production; CRC Press: Boca Raton, FL, USA, 2013. [Google Scholar]
  34. Hodgkinson, L.; Dodd, I.C.; Binley, A.; Ashton, R.W.; White, R.P.; Watts, C.W.; Whalley, W.R. Root growth in field-grown winter wheat: Some effects of soil conditions, season and genotype. Eur. J. Agron. 2017, 91, 74–83. [Google Scholar] [CrossRef]
  35. Jha, S.K.; Gao, Y.; Liu, H.; Huang, Z.; Wang, G.; Liang, Y.; Duan, A. Root development and water uptake in winter wheat under different irrigation methods and scheduling for North China. Agr. Water Manage. 2017, 182, 139–150. [Google Scholar] [CrossRef]
  36. Yang, B.; Wang, P.; You, D.; Liu, W. Coupling evapotranspiration partitioning with root water uptake to identify the water consumption characteristics of winter wheat: A case study in the North China Plain. Agr. For. Meteorol. 2018, 259, 296–304. [Google Scholar] [CrossRef]
  37. Herrera, J.M.; Stamp, P.; Liedgens, M. Interannual variability in root growth of spring wheat (Triticum aestivum L.) at low and high nitrogen supply. Eur. J. Agron. 2007, 26, 317–326. [Google Scholar] [CrossRef]
  38. Döring, T.; Wolfe, M.; Jones, H.; Pearce, H.; Zhan, J. Breeding for resilience in wheat–Nature’s choice. In Eucarpia 2nd Conference of the Organic and Low-Input Agriculture Section; Goldringer, I., Dawson, J.C., Rey, F., Vettoretti, A., Chable, V., Lammerts van Bueren, E., Finckh, M., Barot, S., Eds.; INRA: Paris, France, 2010; pp. 47–50. [Google Scholar]
  39. De Micco, V.; Aronne, G. Morpho-anatomical traits for plant adaptation to drought. In Plant Responses to Drought Stress; Aroca, R., Ed.; Springer: Heidelberg, Germany, 2012; pp. 37–62. [Google Scholar] [CrossRef]
  40. Hooker, J.E.; Hendrick, R.; Atkinson, D. The measurement and analysis of fine root longevity. In Root Methods: A Handbook; Smit, A.L., Bengough, A.G., Engels, C., van Noordwijk, M., Pellerin, S., van de Geijn, S.C., Eds.; Springer: Berlin, Germany, 2000; pp. 273–304. [Google Scholar] [CrossRef]
  41. Monti, M.; Pellicanò, A.; Santonoceto, C.; Preiti, G.; Pristeri, A. Yield components and nitrogen use in cereal–pea intercrops in Mediterranean environment. Field Crop. Res. 2016, 196, 379–388. [Google Scholar] [CrossRef]
  42. Mariotti, M.; Masoni, A.; Ercoli, L.; Arduini, I. Above- and below-ground competition between barley, wheat, lupin and vetch in a cereal and legume intercropping system. Grass Forage Sci. 2009, 64, 401–412. [Google Scholar] [CrossRef]
  43. Pelzer, E.; Bazot, M.; Makowski, D.; Corre-Hellou, G.; Naudin, C.; Al Rifaï, M.; Baranger, E.; Bedoussac, L.; Biarnès, V.; Boucheny, P.; et al. Pea–wheat intercrops in low-input conditions combine high economic performances and low environmental impacts. Eur. J. Agron. 2012, 40, 39–53. [Google Scholar] [CrossRef]
  44. Gregersen, P.L.; Culetic, A.; Boschian, L.; Krupinska, K. Plant senescence and crop productivity. Plant Mol. Biol. 2013, 82, 603–622. [Google Scholar] [CrossRef]
  45. Monostori, I.; Árendás, T.; Hoffman, B.; Galiba, G.; Gierczik, K.; Szira, F.; Vágújfalvi, A. Relationship between SPAD value and grain yield can be affected by cultivar, environment and soil nitrogen content in wheat. Euphytica 2016, 211, 103–112. [Google Scholar] [CrossRef] [Green Version]
  46. Asseng, S.; Ritchie, J.T.; Smucker, A.J.M.; Robertson, M.J. Root growth and water uptake during water deficit and recovering in wheat. Plant Soil 1998, 201, 265–273. [Google Scholar] [CrossRef]
  47. Wang, C.; Liu, W.; Li, Q.; Ma, D.; Lu, H.; Feng, W.; Xie, Y.; Zhu, Y.; Gou, T. Effects of different irrigation and nitrogen regimes on root growth and its correlation with above-ground plant parts in high-yielding wheat under field conditions. Field Crop. Res. 2014, 165, 138–149. [Google Scholar] [CrossRef]
  48. IUSS Working Group. World Reference Base (WRB) for Soil Resources 2014, Update 2015. International Soil Classification System for Naming Soils and Creating Legends for Soil Maps; World Soil Resources Reports 106; FAO: Rome, Italy, 2015. [Google Scholar]
  49. Meier, U. (Ed.) Growth Stages of Mono- and Dicotyledonous Plants. BBCH Monograph, 2nd ed.; Federal Biological Research Centre for Agriculture and Forestry: Berlin, Germany, 2001. [Google Scholar]
  50. Liu, L.; Gan, Y.; Bueckert, R.; van Rees, K. Rooting systems of oilseed and pulse crops I: Temporal growth patterns across the plant developmental periods. Field Crop. Res. 2011, 122, 256–263. [Google Scholar] [CrossRef]
Figure 1. Changes in the apparent root electrical capacitance (CR*; in nanofarads, nF) of wheat with plant age (DAP: days after planting) under (a) well-watered and (b) drought-stressed conditions. Bars show standard deviations (n = 30). Treatment codes: N: wheat cv. Mv Nádor; K: cv. Mv Kolompos; C: YQCCP population; 0: wheat sole crop; P: wheat–pea intercrop; (+): well-watered; (–): drought-stressed.
Plants 10 01991 g001
Figure 2. (a,d) Root length (RL), (b,e) root surface area (RSA) and (c,f) average root diameter (ARD), obtained by minirhizotron image analysis, in relation to plant age (DAP: days after planting) under well-watered (ac) and drought-stressed (df) conditions. RL and RSA are sums from the three soil depths (20, 50 and 80 cm), ARD is a weighted average. For treatment codes, see Figure 1.
Plants 10 01991 g002
Figure 3. Maximum root length (RL) at 20, 50 and 80 cm soil depths, obtained by minirhizotron image analysis, under (a) well-watered and (b) drought-stressed conditions. For treatment codes, see Figure 1.
Plants 10 01991 g003
Figure 4. (a) Leaf chlorophyll content as SPAD value (mean ± SD; n = 15), (b) total shoot dry mass (SDM) and (c) total grain yield (GY) under well-watered (white columns) and drought-stressed (grey columns) conditions. For treatment codes, see Figure 1.
Plants 10 01991 g004
Figure 5. Percentage changes in the apparent root electrical capacitance (CR*), total shoot dry mass (SDM) and total grain yield (GY) of wheat and in the root surface area (RSA) caused by (a) pea intercropping and (b) drought stress. In the case of CR* and RSA, maximum values (detected at the wheat flowering stage) were used for calculation. For treatment codes, see Figure 1.
Plants 10 01991 g005
Figure 6. Linear relationships between the apparent root electrical capacitance (CR*) and root surface area (RSA) in well-watered (filled symbols and solid lines) and drought-stressed (empty symbols and dashed lines) treatments. Only data obtained up to the flowering stage of the wheat genotypes were considered, and were pooled over the two pea treatments. For treatment codes, see Figure 1.
Plants 10 01991 g006
Publisher’s Note: MDPI stays neutral with regard to jurisdictional claims in published maps and institutional affiliations.

