Abstract
A deep analysis of ankle mechanical properties is a fundamental step in the design of an exoskeleton, especially if it is to be suitable for both adults and children. This study aims at assessing age-related differences of ankle properties using pediAnklebot. To achieve this aim, we enrolled 16 young adults and 10 children in an experimental protocol that consisted of the evaluation of ankle mechanical impedance and kinematic performance. Ankle impedance was measured by imposing stochastic torque perturbations in dorsi-plantarflexion and inversion-eversion directions. Kinematic performance was assessed by asking participants to perform a goal-directed task. Magnitude and anisotropy of impedance were computed using a multiple-input multiple-output system. Kinematic performance was quantified by computing indices of accuracy, smoothness, and timing. Adults showed greater magnitude of ankle impedance in both directions and for all frequencies, while the anisotropy was higher in children. By analyzing kinematics, children performed movements with lower accuracy and higher smoothness, while no differences were found for the duration of the movement. In addition, adults showed a greater ability to stop the movement when hitting the target. These findings can be useful to a proper development of robotic devices, as well as for implementation of specific training programs.
1. Introduction
In recent years, advanced technologies have allowed robot-mediated therapy to become a prominent solution for rehabilitation, as an alternative and/or a supporting solution to traditional rehabilitative programs [1,2]. Robotic devices permit intensive, controlled, and tailored rehabilitation, as well as reducing the therapist’s burden [3]. Since the ability of locomotion is fundamental to avoid the worsening of the quality of life [4], one of the main challenges in the robotic field is the design and development of robots for ankle rehabilitation [5]; in fact it is well-known that the ankle joint plays essential roles during walking, such as shock absorption, propulsion, lower limb coordination, adaptation to different environments, and maintenance of stability [6]. From this perspective, an appropriate design of robotic devices for the ankle joint is required for: (i) rehabilitating people affected by neuromuscular diseases [7,8]; (ii) restoring athletes after injuries [9]; and, (iii) augmenting human strength and endurance in industrial and military applications [10,11]. Through the aim of ankle robotic device development, a full insight into kinematic performance and dynamic characterization of ankle appears to be mandatory in order to design robots that operate in accordance with human behavior, leading to a stable and effective physical human–robot interaction [12].
As regards the kinematic performance, several experimental protocols have been developed for quantifying kinematic indices using a robotic device. Among the protocols developed for kinematic performance evaluation, goal-directed movements through the use of serious games represent the most commonly adopted approach in clinical settings [13,14,15,16]. Generally, goal-directed tasks are used to understand how the central nervous system optimizes kinematic parameters, such as movement accuracy, smoothness, and speed, when a dynamic task is required [14]. These factors can be also considered the most relevant to be pursued for a proper design of a robotic ankle [12]. However, few studies have been conducted to evaluate ankle kinematic performance during goal-directed tasks. Michmizos and Krebs evaluated the relationship between the speed and the accuracy in both dorsi-plantar (DP) and inversion-eversion (IE) movements performed by adults, assessing the possibility to describe this relation with Fitt’s law [17]. The same authors, in [18], compared several models of speed profile in ankle pointing movements, finding that the best fitting models were those already used for upper limbs during pointing movements.
By moving to the dynamic characterization, ankle impedance represents one of the main properties to monitor during rehabilitation programs, as it is one of the most important mechanical components involved in lower body stability during locomotion [19], providing fundamental information for designing robotic devices physically interacting with human lower extremities [20]. In addition, it has been already demonstrated that neurological diseases lead to a significant deterioration of ankle impedance, with respect to healthy subjects [21]. The application of dynamic perturbations to the examined anatomical joint and successive analysis of torque vs. angle graphs is currently the most widespread methodology for the measurement of the dynamic joint mechanical impedance [20,22,23,24]. Different studies have been proposed in the literature for the objective measurement of ankle impedance in adult subjects. More specifically, Lee et al. validated a stochastic methodology for the quantification of ankle impedance, considering dumping, stiffness, and further dynamic aspects [25,26]. The innovative aspect proposed by the authors is related to the feasibility of impedance evaluation in multiple directions, overcoming the limits of the previously proposed approaches [27,28,29]. Following a similar approach, Dallali et al. evaluated ankle impedance in the external-internal direction by analyzing the lower limb muscle activation and by applying an artificial neural network that achieved accuracy of 85% in the impedance estimation [22]. Conversely, in the literature, a limited number of studies have focused on ankle impedance evaluation in children. Alhusaini et al. [30] assessed ankle impedance by analyzing the responses to imposed movements in dorsi-plantarflexion in children with cerebral palsy (CP), while Martelli and colleagues [23] applied the methodology proposed by Lee [25] to quantify the effects of botulinum toxin on dynamic ankle impedance.
Currently, the design of robotic devices for the rehabilitation of children is an increasingly appealing and challenging field [16,31,32,33,34]. However, properly scaling robotic devices designed for adults to match the characteristics of children, remains an existing challenge, and is generally recognized as an important goal to achieve in the robotic field [35]. Considering this aspect, the quantification of age-related differences in terms of kinematic and dynamic performance clearly represents the starting point. However, no studies, to the best of the authors’ knowledge, have been conducted for investigating the age-related differences in terms of ankle impedance between adults and children, as well as regarding kinematic performance, such as accuracy and smoothness, during goal-directed movements. Thus, this study aims at providing full insight into the ankle properties’ maturation by comparing kinematic and dynamic performance indices in both DP and IE directions related to healthy young adults and healthy children using a robotic device. The outcomes of the study could offer important guidelines for the correct design and development of robotic devices and rehabilitation protocols addressed for adults and children, as well as serving as a starting point for solving the issue related to the scalability of robotic devices.
2. Materials and Methods
2.1. Subjects
Sixteen healthy adults aged from 22 to 30 years old and ten healthy children aged from 5 to 9 years old were enrolled in the study. The inclusion criteria were: (i) absence of neurological and visual deficits, (ii) physiological range of motion (ROM) for ankle, (iii) adequate anthropometric measures in order to freely move the ankle in the robot workspace, and (iv) right footedness. The dominant leg was established by asking them to kick a ball [36].
Written informed consent was obtained from all subjects. The protocol was compliant with the ethical standards outlined in the Declaration of Helsinki.
2.2. Experimental Setup and Procedure
All measurements were conducted by means of the pediAnklebot [31]. Subjects were seated in front of a monitor with knee flexed at 45°. They wore a knee brace fixed to the limb by means of Velcro straps, and a shoe of proper size, firmly tightened to the foot with shoelaces to prevent foot slippage. The main body of the robot was attached to the knee brace and the end-effectors were connected to the bracket attached to the bottom of the shoe. The calf of the subjects leaned against an aluminum support, covered with foam rubber and linked to the chair. The robot was laterally attached to the chair to ensure collected data were free from the weight of the robot and to improve repeatability.
The robot was equipped with two linear encoders and two load cells to acquire displacements and forces of each end-effector at 200 Hz. From the acquired data, rotations and moments of the ankle were obtained as reported in [29,37]. The robot was mainly designed for children, but can be used by adults in the sitting configuration, by changing the dimensions of shoe and knee brace, and using a new ad-hoc developed linkage between the brace and chair. Different anthropometric features across enrolled subjects do not affect moment arm, which only depend on robot design. In particular, torque was computed from the sensors as follows [29]:
where and are the dorsi-plantar and inversion-eversion net torques at the ankle joint; and are the forces measured by the right and left force sensors; and and are the distances between the line of action of the actuator force and the point of attachment between the ankle and robot in the sagittal and the frontal planes, respectively. The experimental setup is shown in Figure 1.
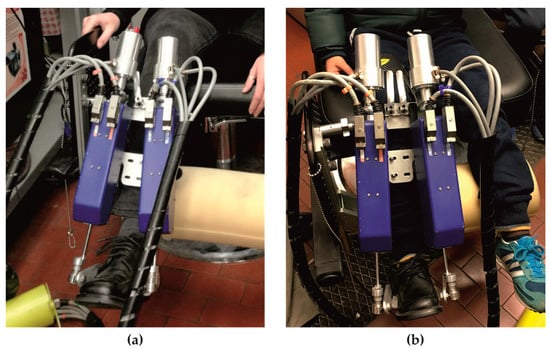
Figure 1.
Experimental setup: an adult (a) and a child (b) wearing the robot.
The experimental protocol consisted of two different phases: the first aimed at the evaluation of the ankle mechanical impedance, while the second aimed at the evaluation of ankle kinematic performance in a goal-directed task. Before starting the experimental procedure, the initial and reference positions were set by positioning the foot at 90° relative to the shank, for both the experimental phases. In addition, each participant performed a familiarization session that lasted until participants felt familiar with the equipment and the tasks. All subjects performed the entire protocol with the dominant limb.
2.2.1. Dynamic Ankle Impedance Evaluation
During the first experimental phase, the robot applied random stochastic torque perturbations to the ankle, both in IE and DP directions for 60 s, with a random white noise signal characterized by no periodicity in time and a flat spectrum in a frequency range of 0–100 Hz. In particular, the torque perturbation ranged between ±12.82 Nm in the IE direction and ±21.11 Nm in the DP direction, for both adults and children. The voluntary reactions of the participant were minimized due to the random nature of the chosen perturbation [38]. The commanded torques and corresponding angular displacements at the ankle were recorded at 200 Hz. Recorded data were expressed in the IE-DP space, which defined the joint coordinates.
2.2.2. Ankle Motor Performance Evaluation
In the second experimental phase, subjects carried out a goal-directed task, playing an in-home-developed serious game [14], based on the one proposed by Michmizos et al. [17]. In particular, subjects were asked to move a pointer controlled through ankle rotations in both sagittal (DP direction) and frontal (IE direction) planes, in order to hit targets appearing on the game scene alternatively at the top and at the bottom of the game scene. Subjects were instructed to reach the targets as fast as possible without stopping during the movement, to stop the ankle movement as soon as the target was reached, and to wait until a new target appeared on the scene. The game scenario is shown in Figure 2. The pointer (yellow dot) could be moved in every part of the scene by means of ankle rotations both in the frontal plane, i.e., inversion-eversion (IE), and in the sagittal plane, i.e., dorsi-plantarflexion (DP). Then, each point of the game scenario was described by 2 coordinates (x and y) that corresponded to the inversion and plantarflexion angles, respectively. The coordinates of the two target centers reported in the ankle reference system were: 0° in inversion-eversion and 10° in dorsiflexion for the up-target, and 0° in inversion-eversion and −10° in plantarflexion for the down-target. One second after hitting the target, a new target appeared in the opposite position. This experimental phase consisted of 2 blocks of 40 targets, 20 up (up-targets) and 20 down (down-targets), making a total of 80 goal-directed movements for each subject.
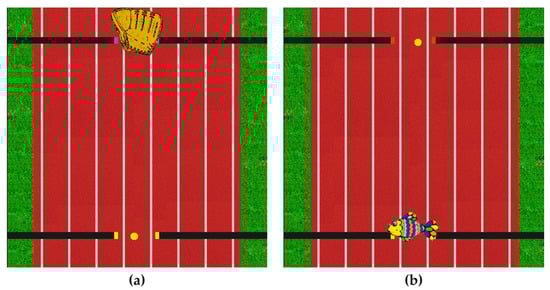
Figure 2.
Scenario of the game with up-(a) and down-targets (b) for the ankle motor performance evaluation.
2.3. Data Analysis
Data acquired by the sensors of the robot were processed offline. Regarding the evaluation of dynamic ankle impedance, multiple-input multiple-output (MIMO) system identification was used on the recorded signals, in accordance with Lee et al. [39], whereas, for the characterization of ankle motor performance in the goal-directed task, a set of kinematic indices was computed.
2.3.1. Dynamic Ankle Impedance Evaluation
A brief description of the MIMO system identification methodology is here reported for clarity. The MIMO system is characterized by 2 input and 2 output signals that are the commanded torques () and the corresponding angular displacements () at the ankle, respectively.
The first 200 samples of each signal were ignored to remove mechanical noise due to motor activation.
To obtain ankle impedance (), mechanical admittance () of the closed-loop system was firstly identified:
Finally, mechanical impedance of the closed loop system () was obtained from the inverse of mechanical admittance ():
Since the ankle and the robot shared the same displacement, the impedance of the closed loop system is the parallel between robot and ankle impedances. Thus, to obtain , the impedance component due to the robot dynamics was subtracted from . Bode plots of ankle impedance in both IE and DP direction were determined.
Power spectral density of was estimated using Welch’s periodogram approach. The number of fast Fourier transform points was set at 1024, thus obtaining a spectral resolution of 0.19 Hz, and a periodic Hamming window was used, with a 50% overlap of the window size. These parameters were chosen considering a trade-off among spectral resolution, bias error, and variance of estimation [38].
Directional variation (anisotropy) of ankle impedance in two DOFs (Degree of Freedom) was evaluated applying rotations from 0° to 90° (step of 1°) to the original joint coordinates, thus obtaining the impedance magnitude for each rotation in the space defined by IE and DP directions. Then, the ankle impedance was represented through a polar plot, to obtain the Direction Depend Map (DDM) (Figure 3). Ankle impedance was analyzed as a function of frequency, by dividing the analyzed range of frequencies into three bands: low (0 Hz ≤ f ≤ 2 Hz), mid (2 Hz < f ≤ 5 Hz), and high (5 Hz < f ≤ 8 Hz) frequency ranges. These ranges are named, hereafter, LF, MF, and HF, respectively. The ranges were selected from the results of Bode plot analysis. In particular, Bode plots were consistent with a second order system, characterized by a stiffness dominated region below 2 Hz, whereas inertial component was not negligible starting from 5 Hz. Beyond approximately 10 Hz, Bode plots showed oscillations that can be ascribed to vibrational modes of shoe bracket and of the chair that the robot was attached to [23]. Impedance was averaged in each range and the following parameters were evaluated: , , , and Φ. Specifically, and represent ankle impedance magnitude in IE and DP directions, respectively; and and Φ were defined as shape and orientation index of DDM, respectively. represents the ratio between minimum () and maximum () values of ankle impedance and quantifies how accentuated is the “peanut” shape of DDM: the closer is to 1, the more the peanut shape is transformed into a circumference. Φ is the absolute value of the angle between and the direction individuated by , and quantifies how the DDM is tilted with respect to the DP direction.
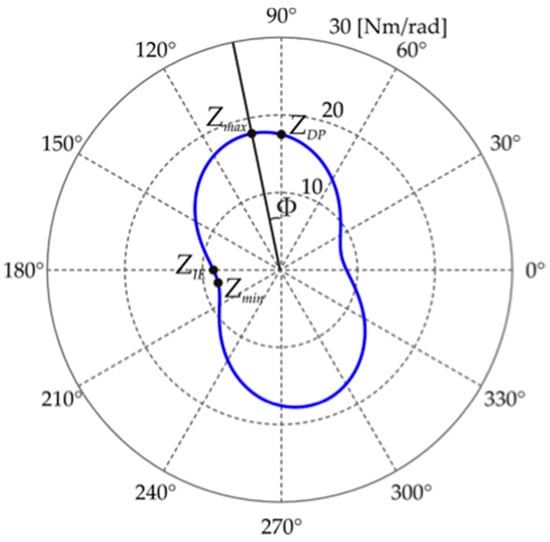
Figure 3.
Example of direction dependent map (blue line) and the evaluated parameters (ZIE, ZDP, Zmax, Zmin, and Φ).
2.3.2. Ankle Motor Performance Evaluation
The recorded position of the pointer was filtered with a 6th order, zero phase shift low-pass Butterworth filter, with a cut-off frequency of 10 Hz, and then differentiated, with a two-point differentiation, to obtain speed, acceleration, and jerk. The global data obtained from each subject were divided into single goal-directed movements and grouped into plantarflexion (down-target) and dorsiflexion (up-target) movements. Each movement was assumed to start when the speed magnitude became greater than 10% of the peak speed; the movement was assumed to end when the speed dropped and remained below 10% of the peak speed [40].
Trajectories were accurately screened and discarded if one of following cases occurred: (i) the movement began before the new target appearance, i.e., the initial velocity was not equal to zero, and (ii) when the subject stopped the ankle movement before reaching the target. The number of discarded trials was lower than 5% for each subject. For the characterization of movement kinematics, a set of indices was computed and grouped into: (i) accuracy and smoothness indices, (ii) temporal indices, and (iii) stopping indices.
The first group comprises the lateral deviation (LD) and the normalized jerk (NJ), as accuracy and smoothness indexes, respectively. In particular, LD is defined as the highest deviation from the straight line connecting the starting and the target position. The LD value decreases when the movement accuracy increases. NJ is the normalized jerk, as proposed by Teulings et al. [41]. Lower values of NJ indicate smoother movements.
The set of temporal indices is constituted by the duration of movement (T), the time position symmetry (TPS), and the time velocity symmetry (TVS). T is the time between the movement onset and the movement termination, which was evaluated according to the speed threshold. The remaining two indices quantify the temporal symmetry of kinematic parameters of the trajectory. In particular, TPS is defined as follows:
TPS represents the temporal duration () of the eversion rotations with respect to the total duration of the trajectory. In fact, when the foot is moved upward or downward, the corresponding rotation should be a pure dorsiflexion or plantarflexion, but actually a component of inversion or eversion is always present. TPS ranges from 0 to 1. If the TPS value is equal to 0.5, it means an equal temporal duration of the inversion and eversion rotations during dorsi-plantarflexion movements. A value of TPS higher than 0.5 means a prevalence of eversion with respect to inversion rotations, and vice versa, a value lower than 0.5 means a prevalence of inversion. Thus, TPS can be considered a measure of the contribution of the ankle rotation around the secondary movement axis, i.e., inversion/eversion, in dorsiflexion/plantarflexion. TVS is defined as the time tv in which the velocity peak occurred, normalized to the duration the trajectory.
TVS ranges from 0 to 1. The closer TVS is to 1, the more the velocity peak occurs close to the end of the trajectory. Thus, a TVS value close to 0.5 represents a perfect bell-shaped trajectory, in which the peak speed is close to the middle of the trajectory.
The stopping indices are delay (ΔT) and dispersion (σtrj). They evaluate the ability of the subject to stop the movement once the target is reached [13]. ΔT represents the temporal delay, normalized to T, between the time in which the subject hits the target and the end of the movement evaluated accordingly to the velocity threshold. A ΔT value close to zero indicates that the subject rapidly stops the ankle movement after hitting the target. σtrj is defined as:
where dIE and dDP are the coordinates of the trajectory performed after hitting the target, and CIE and CDP are the coordinates of the target center position. Thus, σtrj is a measure of the dispersion of the trajectory travelled after hitting the target. Low values of σtrj imply a trajectory confined in a small area.
All the aforementioned indices were evaluated for both dorsiflexion and plantarflexion movements.
2.4. Statistical Analysis
A two-way repeated measures ANOVA was performed on , , , and Φ considering, as independent variables, the age (adults vs. children) and the frequency range (low, mid, and high frequency). If the interaction effects were significant, the interactions were broken down by comparing each age at each frequency with a one-way repeated measures ANOVA and, vice versa, with an unpaired t-test. A Bonferroni test for multiple comparisons was performed when statistical differences were found. All data were tested for normality with the Shapiro–Wilk test and sphericity was checked. If sphericity was violated, Greenhouse–Gasser correction was applied.
A two-way repeated measures ANOVA was performed on all the kinematic indices to find differences between age and movement direction. If the interaction effects were significant, the interactions were broken down by comparing each age at each movement direction with an unpaired t-test and, vice versa, with a paired t-test. All data were tested for normality with a Shapiro–Wilk test.
The significance level was set to 0.05 for all performed tests.
3. Results
3.1. Ankle Impedance
Mean and standard deviation values of , , , and Φ averaged across subjects for the tree frequency range (LF, MF, HF) are reported in Figure 4.
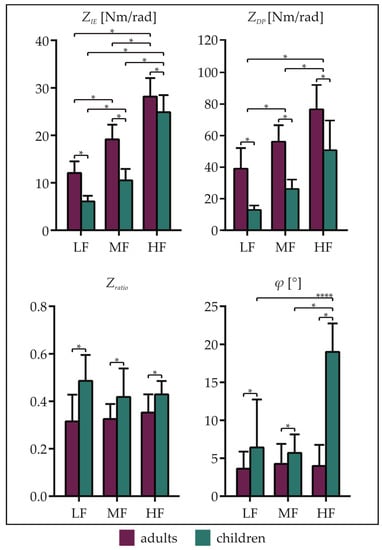
Figure 4.
Means and standard deviations of the ankle impedance parameters , , , and Φ averaged across subjects related to adults and children for all frequency ranges (LF, MF, and HF). Asterisks denote statistical differences (p < 0.05).
was higher for adults with respect to children for all the frequency ranges (p < 0.01). Moreover, it was higher in HF with respect to both MF and LF, and in MF with respect to LF, for both adults and children (adults: HF vs. MF, HF vs. LF, and MF vs. LF: p < 0.01; children: HF vs. MF, HF vs. LF, and MF vs. LF: p < 0.01). As regards , it showed higher values for adults than children, in all frequency ranges (p < 0.01). Furthermore, was higher in HF with respect to both MF and LF, and in MF with respect to LF (p < 0.01 for all the comparisons).
Considering , it showed lower values for adult subjects than children in LF (p < 0.01), MF (p = 0.02) and HF (p = 0.01), whereas no differences were found between frequency ranges.
Finally, Φ was lower in the adult group for all frequency ranges. Moreover, considering the children group, Φ was higher in HF with respect to both MF (p < 0.01) and LF (p < 0.01). No differences were found among frequency ranges for adult subjects.
The representation of DDM as a function of frequency is reported in Figure 5, through two representative examples related to adults (Figure 5a) and children (Figure 5b). It emerged that the characteristic peanut shape remains unchanged for all the frequencies in both adults and children, whereas the impedance magnitude is different between the two cohorts in the whole DP-IE space and for all frequencies. Finally, the orientation of DMM with respect to the DP axis remains unaltered in the adult whereas it visibly rotates in the child.
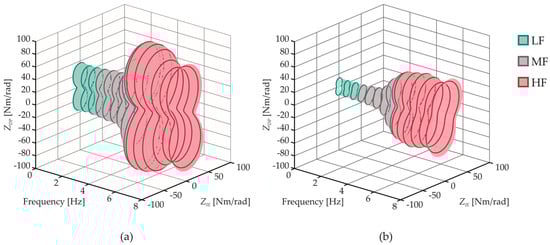
Figure 5.
Example of directional variation (anisotropy) of ankle mechanical impedance as a function of frequency related to a representative subject of the adult group (a) and of the child group (b).
3.2. Kinematic Indices
Mean and standard deviation of all the kinematic indices averaged across subjects for both plantarflexion and dorsiflexion movements are reported in Figure 6.
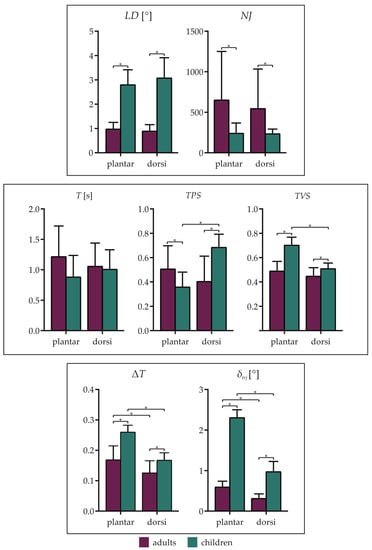
Figure 6.
Means and standard deviations of the kinematic parameters averaged across subjects related to adults and children, grouped in plantarflexion (plantar) and dorsiflexion (dorsi) movements. (Top row): accuracy and smoothness indices, (mid row): temporal indices, (bottom row): stopping indices. Asterisks denote statistical differences (p < 0.05).
For all the indices, except NJ, the interaction factor was significant. In particular, as regards the accuracy index (LD), no differences were found between plantarflexion and dorsiflexion movements related to the same group. Instead, LD was higher in children than adults for both plantarflexion (p < 0.01) and dorsiflexion (p < 0.01) movements. The opposite occurred for the smoothness index (NJ), which showed higher values in the adult group for both plantarflexion and dorsiflexion movements (p = 0.04).
As regards the temporal indices, no differences were found for the duration of the movement (T), neither between age or movement direction. Considering TPS, it showed higher values in adults for plantarflexion movements (p = 0.05), whereas the opposite occurred for dorsiflexion movements (p < 0.01). Moreover, TPS was higher in dorsiflexion than in plantarflexion movements (p < 0.01) related to the child group, and no differences were found between dorsiflexion and plantarflexion in the adult group. Finally, TVS showed lower values in the adult group, for both plantarflexion (p < 0.01) and dorsiflexion (p = 0.03) movements. Furthermore, TPS was higher in plantarflexion with respect to dorsiflexion in the child group (p < 0.01).
Considering the stopping indices, ΔT was higher in children for both plantarflexion (p < 0.01) and dorsiflexion (p = 0.01) movements. Additionally, ΔT was higher in plantarflexion than in dorsiflexion for both adults (p < 0.01) and children (p < 0.01). A similar behavior was found for σtrj, which showed lower values in the adult group, for both plantarflexion (p < 0.01) and dorsiflexion (p < 0.01) movements. Moreover, σtrj was lower in dorsiflexion than in plantarflexion for both adults (p < 0.01) and children (p < 0.01).
4. Discussion
With the aim of investigating age-related differences of ankle mechanical properties, we compared ankle mechanical behaviors, in terms of ankle impedance and kinematic performance, of children and young adult subjects. The experimental protocol was performed using pediAnklebot, a robotic device for the ankle joint.
4.1. Age-Related Differences of Ankle Impedance
The results of both groups confirm that ankle impedance in DP and IE directions assumes a peanut shape in the diagram of DP vs. IE, as also reported in [23,25]. This finding indicates that the two examined populations are characterized by a similar behavior, i.e., a greater value of impedance in DP rather than in IE direction, even though all the examined children were less than 14 years, which is recognized as the age of complete maturation of the ankle joint [42].
Despite the similar shape, statistical differences were found for the magnitude values of impedance in both directions. These differences can be ascribed to the incomplete maturation of elastic properties of tendon structures that lead to an incorrect transmission of force exerted by muscle to the bone [43]. In addition, our outcomes are in accordance with [44], confirming that ankle stiffness increases with age and stature. The lowest values of ankle impedance found for children can be also considered one of the main causes of the dynamic instability of children when walking [33,42]. In fact, a complete development of lower limb joints guarantees a natural interaction between limbs and the environment, and a proper value of ankle impedance allows correct regulating and controlling movements [45].
Differences among frequencies in both groups are in line with the concept that ankle impedance is characterized by different behaviors according to the frequency range [25]. More specifically, the size of the peanut shape rapidly increases with the frequency, indicating that the contribution to the ankle impedance of the inertia is dominant at high frequencies, whereas, at low and medium frequencies, stiffness and viscosity represent the main contributions to the impedance magnitude value, since the size of the peanut remains stable [39].
By moving to the analysis of shape parameters, we can state that ankle impedance was highly direction dependent, being weak in IE direction, in all examined range frequencies. This outcome can be considered as one of the main sources of the greater prevalence of ankle injuries in IE direction in both adults and children [46]. In addition, this anisotropy is more evident in children rather than in adults, as confirmed by the statistical differences found between the two groups. This outcome can be justified by considering the greater joint and ligament laxity typical of children younger than 10 years old [47]. This greater laxity, also known as hypermobility, is caused by an incomplete development of muscle elasticity [47]. The excessive anisotropy could be considered a causal factor that leads to the high rate of instability in children, leading to a greater prevalence of ankle sprains, especially in IE direction [48]. However, the anisotropy is not influenced by frequencies in both examined groups; thus, we can speculate that children have the capability to maintain constant differences between DP and IE directions at different frequencies as adults, even considering the above-mentioned factors of incomplete joint development. This finding could suggest that children can also perform highly dynamic activities without increasing the risk of injuries. Furthermore, the parameter related to the orientation of the peanut shape is frequency-invariant in adults, while the highest values were obtained when analyzing the high frequencies in children. This implies that the maximum value of impedance in children is not in correspondence of the DP direction and can be ascribed to the incomplete development of muscles. This finding indicates that children are not able to provide maximum impedance during movements that mainly involve the dorsi-plantarflexion of the ankle, such as walking; thus, it could be one of the main reasons for the well-known higher stride-to-stride variability found for children [33].
These findings should be taken into account for proper development and design of ankle robotic devices, especially when they are addressed to recover the functionality of the ankle in both degrees of freedom.
4.2. Age-Related Differences of Ankle Kinematic Performance
Results related to accuracy and smoothness indices highlighted that, independently of movement direction, adults performed trajectories characterized by a higher accuracy, whereas children performed smoother trajectories. Additionally, these differences in terms of accuracy and smoothness were not reflected in the duration of the movement, which revealed no age-related differences. The lower accuracy characterizing children movements can be ascribed to a lower proprioceptive ability, as already found for the upper limbs in a comparison between children and adolescent movements [49]. In addition, it has been demonstrated that children performed movement favoring smoothness with respect to accuracy [50].
The TPS index can be considered a measure of the coupling between ankle rotations performed in sagittal and frontal planes. In fact, ankle rotations are usually described as movements around fixed mutually perpendicular axes, but they actually change their position depending on ankle rotation [51]. This complexity yields to a significant coupling between the two DOFs: when the foot is moved upward or downward, the resulting rotation is always a combination of plantar-dorsiflexion and inversion-eversion. Considering the child group, there is a significance difference of TPS when comparing dorsiflexion and plantarflexion movements. In particular, plantarflexion movements are characterized by the prevalence of inversion rotations, whereas dorsiflexion movements show a prevalence of eversion rotations. This behavior is not present in the adult group, which revealed no differences between movement directions, showing a TPS value always close to 0.5 for both plantarflexion and dorsiflexion. These results indicate that adults are able to balance the contribution of rotations around the secondary axis and that this ability is not completely developed by children in the examined age range. Thus, it implies a higher mobility of ankle movement axes in children, which is probably due to the greater joint and ligament laxity typical of children younger than 10 years old [47], as already discussed for the ankle impedance. Moreover, results from TPS are consistent with the findings related to the accuracy and smoothness indices. Children, in fact, present less accurate trajectories, i.e., highly deviating from a straight line, which are then characterized by a significant contribution of inversion or eversion movements. On the contrary, the smoothness of the movement was higher in the child group. Thus, it can be speculated that, during the motor development, subjects prefer to optimize the movement accuracy in order to obtain a better-balanced trajectory even though it implies performing fewer smooth movements.
Focusing on the bell-shaped profile of velocity, results from TVS highlighted that, in the child group, the velocity peak occurred early in dorsiflexion with respect to plantarflexion. This finding could be explained by considering that subjects needed to counter gravity when the foot is moved upwards, exerting a greater force at the beginning of the movement, which allowed reaching the maximum speed earlier in dorsiflexion than in plantarflexion. On the contrary, adults showed a perfect bell-shaped velocity profile and, consequently, they are not influenced by gravity. These results are in line with [18], in which authors established that, in adults subjects, the velocity profile is not affected by gravity. Thus, we can speculate that the differences between children and adults could be due to higher force levels that can be exerted by adults at the ankle, implying a negligible effect of gravity.
Considering the stopping indices, it emerged that both adults and children can stop the movement more easily during dorsiflexion than plantarflexion. This result can be explained by considering that plantarflexion is a movement performed in the same direction of gravity. Thus, after hitting the target, subjects have to counter gravity to stop ankle movement. Another important consideration emerging from the stopping indices is that, independently of the movement direction, children showed higher difficulty in stopping the ankle movement as soon as the target was reached. This characteristic can be ascribed to the lower magnitude of ankle impedance of children that emerged from the impedance evaluation.
From an overall analysis of the kinematic indices it seems that the complete maturation of the ankle joint leads to a loss in the smoothness of the movement but, at the same time, to an increase in the accuracy. Moreover, the incomplete maturation of the ankle joint leads to differences in plantarflexion and dorsiflexion movements in terms of symmetry of the trajectory evaluated by means of TPS and TVS. These differences, in fact, were only found in the child group.
Results related to the kinematic parameters should be considered together with those reported for the ankle impedance for a full understanding of ankle properties, leading to a more suitable development of robots.
5. Conclusions
Age-related differences in terms of dynamic properties and kinematic performance related to the ankle joint were assessed by means of a robotic device.
Outcomes revealed for children were characterized by a lower magnitude of ankle impedance in both dorsi-plantarflexion and inversion-eversion directions and by a greater anisotropy. By considering a goal-directed task, adults performed more accurate and less smooth movements, and a lower symmetry of movement in both directions was found in children. Moreover, a greater ability to stop the movement after hitting the target was found in adults.
These findings provide fundamental information usable as guidelines for researcher groups involved in the design of robotic devices and training protocols for rehabilitation purposes. Furthermore, they could represent a starting point for solving the issues related to the scalability of robots suitable for adults and children.
Author Contributions
Conceptualization, F.M., J.T. and S.R.; methodology, F.M., J.T. and S.R.; software, F.M. and S.R.; formal analysis, F.M., J.T. and S.R.; data curation, F.M., J.T. and S.R.; writing—original draft preparation, F.M., J.T. and S.R.; writing—review and editing, F.M., J.T., Z.D.P., E.P. and S.R.; supervision, Z.D.P., E.P. and S.R.; project administration, F.M., J.T., E.P. and S.R.
Conflicts of Interest
The authors declare no conflict of interest.
References
- Marchal-Crespo, L.; Reinkensmeyer, D.J. Review of control strategies for robotic movement training after neurologic injury. J. Neuroeng. Rehabil. 2009, 6, 20. [Google Scholar] [CrossRef]
- Meyer-Heim, A.; Ammann-Reiffer, C.; Schmartz, A.; Schäfer, J.; Sennhauser, F.H.; Heinen, F.; Knecht, B.; Dabrowski, E.; Borggraefe, I. Improvement of walking abilities after robotic-assisted locomotion training in children with cerebral palsy. Arch. Dis. Child. 2009, 94, 615–620. [Google Scholar] [CrossRef]
- Adiputra, D.; Nazmi, N.; Bahiuddin, I.; Ubaidillah, U.; Imaduddin, F.; Rahman, M.A.A.; Mazlan, S.A.; Zamzuri, H. A Review on the Control of the Mechanical Properties of Ankle Foot Orthosis for Gait Assistance. Actuators 2019, 8, 10. [Google Scholar] [CrossRef]
- Edwards, M.K.; Rosenbaum, S.; Loprinzi, P.D. Differential Experimental Effects of a Short Bout of Walking, Meditation, or Combination of Walking and Meditation on State Anxiety Among Young Adults. Am. J. Health Promot. 2018, 32, 949–958. [Google Scholar] [CrossRef]
- Alvarez-Perez, M.G.; Garcia-Murillo, M.A.; Cervantes-Sánchez, J.J. Robot-assisted ankle rehabilitation: A review. Disabil. Rehabil. Assist. Technol. 2019, 1–15. [Google Scholar] [CrossRef]
- Trevino, J.; Lee, H. Sex Differences in 2-DOF Human Ankle Stiffness in Relaxed and Contracted Muscles. Ann. Biomed. Eng. 2018, 46, 2048–2056. [Google Scholar] [CrossRef]
- Sawicki, G.S.; Ferris, D.P. Powered ankle exoskeletons reveal the metabolic cost of plantar flexor mechanical work during walking with longer steps at constant step frequency. J. Exp. Biol. 2009, 212, 21–31. [Google Scholar] [CrossRef]
- Contreras-Vidal, J.L.; A Bhagat, N.; Brantley, J.; Cruz-Garza, J.G.; He, Y.; Manley, Q.; Nakagome, S.; Nathan, K.; Tan, S.H.; Zhu, F.; et al. Powered exoskeletons for bipedal locomotion after spinal cord injury. J. Neural Eng. 2016, 13, 031001. [Google Scholar] [CrossRef] [PubMed]
- Jamwal, P.K.; Xie, S.Q.; Hussain, S.; Parsons, J.G. An Adaptive Wearable Parallel Robot for the Treatment of Ankle Injuries. IEEE/ASME Trans. Mechatron. 2014, 19, 64–75. [Google Scholar] [CrossRef]
- Zoss, A.B.; Kazerooni, H.; Chu, A. Biomechanical design of the Berkeley lower extremity exoskeleton (BLEEX). IEEE/ASME Trans. Mechatron. 2006, 11, 128–138. [Google Scholar] [CrossRef]
- Walsh, C.J.; Eond, K.; Herr, H. A quasi-passive leg exoskeleton for load-carrying augmentation. Int. J. Humanoid Robot. 2007, 4, 487–506. [Google Scholar] [CrossRef]
- Miao, Q.; Zhang, M.; Wang, C.; Li, H. Towards Optimal Platform-Based Robot Design for Ankle Rehabilitation: The State of the Art and Future Prospects. J. Healthc. Eng. 2018, 2018, 1–9. [Google Scholar] [CrossRef]
- Martelli, F.; Palermo, E.; Rossi, S. A novel protocol to evaluate ankle movements during reaching tasks using pediAnklebot. In Proceedings of the 2017 International Conference on Rehabilitation Robotics (ICORR), London, UK, 17–20 July 2017; Volume 2017, pp. 326–331. [Google Scholar]
- Martelli, F.; Bertini, E.; del Prete, Z.; Palermo, E.; Rossi, S. Submovement changes in goal-directed and non-goal-directed ankle movements using pediAnklebot. In Proceedings of the 2018 IEEE International Symposium on Medical Measurements and Applications (MeMeA), Rome, Italy, 11–13 June 2018; pp. 1–5. [Google Scholar]
- Perez-Ibarra, J.C.; Gomez-Pena, G.; Siqueira, A.A.G. Estimation of Patient Participation during Therapeutic Movements Using the Anklebot: Technique and Preliminary Results. In Proceedings of the 2015 12th Latin American Robotics Symposium and 2015 3rd Brazilian Symposium on Robotics (LARS-SBR), Uberlândia, Brazil, 28 October–1 November 2015; pp. 198–203. [Google Scholar]
- Krebs, H.I.; Ladenheim, B.; Hippolyte, C.; Monterroso, L.; Mast, J. Robot-assisted task-specific training in cerebral palsy. Dev. Med. Child Neurol. 2009, 51, 140–145. [Google Scholar] [CrossRef]
- Michmizos, K.P.; Krebs, H.I. Pointing with the ankle: The speed-accuracy trade-off. Exp. Brain Res. 2014, 232, 647–657. [Google Scholar] [CrossRef]
- Michmizos, K.P.; Vaisman, L.; Krebs, H.I. A comparative analysis of speed profile models for ankle pointing movements: Evidence that lower and upper extremity discrete movements are controlled by a single invariant strategy. Front. Hum. Neurosci. 2014, 8, 1–15. [Google Scholar] [CrossRef]
- Hansen, A.; Childress, D.; Miff, S.; Gard, S. The human ankle during walking: Implications for design of biomimetic ankle prostheses. J. Biomech. 2004, 37, 1467–1474. [Google Scholar] [CrossRef]
- Nalam, V.; Lee, H. Development of a Two-Axis Robotic Platform for the Characterization of Two-Dimensional Ankle Mechanics. IEEE/ASME Trans. Mechatron. 2019, 24, 459–470. [Google Scholar] [CrossRef]
- Lee, H.; Patterson, T.; Ahn, J.; Klenk, D.; Lo, A.; Krebs, H.I.; Hogan, N. Static ankle impedance in stroke and multiple sclerosis: A feasibility study. In Proceedings of the 2011 Annual International Conference of the IEEE Engineering in Medicine and Biology Society EMBS, Boston, MA, USA, 30 August–3 September 2011; pp. 8523–8526. [Google Scholar]
- Dallali, H.; Knop, L.; Castelino, L.; Ficanha, E.; Rastgaar, M. Using lower extremity muscle activity to obtain human ankle impedance in the external–internal direction. Int. J. Intell. Robot. Appl. 2018, 2, 29–42. [Google Scholar] [CrossRef]
- Martelli, F.; Rossi, S.; Frascarelli, F.; Germanotta, M.; Petrarca, M.; Castelli, E.; Cappa, P. Estimation of multivariable dynamic ankle impedance after botulinum toxin injection in children with cerebral palsy. In Proceedings of the 2016 IEEE International Symposium on Medical Measurements and Applications (MeMeA), Benevento, Italy, 15–18 May 2016; pp. 1–6. [Google Scholar]
- Dai, C.; Martel, S.; Martel, F.; Rancourt, D.; Clancy, E.A. Single-trial estimation of quasi-static EMG-to-joint-mechanical-impedance relationship over a range of joint torques. J. Electromyogr. Kinesiol. 2019, 45, 18–25. [Google Scholar] [CrossRef]
- Lee, H.; Krebs, H.I.; Hogan, N. Multivariable dynamic ankle mechanical impedance with active muscles. IEEE Trans. Neural Syst. Rehabil. Eng. 2014, 22, 971–981. [Google Scholar] [CrossRef]
- Rastgaar, M.A.; Ho, P.; Lee, H.; Krebs, H.I.; Hogan, N. Stochastic Estimation of the Multi-Variable Mechanical Impedance of the Human Ankle with Active Muscles. In Proceedings of the ASME 2010 Dynamic Systems and Control Conference, Cambridge, MA, USA, 12–15 September 2010; pp. 1–3. [Google Scholar]
- Hunter, I.W.; Kearney, R.E. Dynamics of human ankle stiffness: Variation with mean ankle torque. J. Biomech. 1982, 15, 747–752. [Google Scholar] [CrossRef]
- Kearney, R.E.; Hunter, I.W. Dynamics of human ankle stiffness: Variation with displacement amplitude. J. Biomech. 1982, 15, 753–756. [Google Scholar] [CrossRef]
- Roy, A.; Krebs, H.I.; Williams, D.J.; Bever, C.T.; Forrester, L.W.; Macko, R.M.; Hogan, N. Robot-aided neurorehabilitation: A novel robot for ankle rehabilitation. IEEE Trans. Robot. 2009, 25, 569–582. [Google Scholar] [CrossRef]
- Alhusaini, A.A.; Crosbie, J.; Shepherd, R.B.; Dean, C.M.; Scheinberg, A. Mechanical properties of the plantarflexor musculotendinous unit during passive dorsiflexion in children with cerebral palsy compared with typically developing children. Dev. Med. Child Neurol. 2010, 52, 101–106. [Google Scholar] [CrossRef] [PubMed]
- Michmizos, K.; Rossi, S.; Castelli, E.; Cappa, P.; Krebs, H. Robot-Aided Neurorehabilitation: A Pediatric Robot for Ankle Rehabilitation. IEEE Trans. Neural Syst. Rehabil. Eng. 2015, 23, 1056–1067. [Google Scholar] [CrossRef]
- Patanè, F.; Rossi, S.; del Sette, F.; Taborri, J.; Cappa, P. WAKE-Up Exoskeleton to Assist Children with Cerebral Palsy: Design and Preliminary Evaluation in Level Walking. IEEE Trans. Neural Syst. Rehabil. Eng. 2017, 25, 906–916. [Google Scholar] [CrossRef]
- Mileti, I.; Taborri, J.; Rossi, S.; Petrarca, M.; Patanè, F.; Cappa, P. Evaluation of the effects on stride-to-stride variability and gait asymmetry in children with Cerebral Palsy wearing the WAKE-up ankle module. In Proceedings of the 2016 IEEE International Symposium on Medical Measurements and Applications (MeMeA), Benevento, Italy, 15–18 May 2016. [Google Scholar]
- Germanotta, M.; Taborri, J.; Rossi, S.; Frascarelli, F.; Palermo, E.; Cappa, P.; Castelli, E.; Petrarca, M. Spasticity Measurement Based on Tonic Stretch Reflex Threshold in Children with Cerebral Palsy Using the PediAnklebot. Front. Hum. Neurosci. 2017, 11, 277. [Google Scholar] [CrossRef]
- Kardofaki, M.; Tabti, N.; Alfayad, S.; Ouezdou, F.B.; Chitour, Y.; Dychus, E. Mechanical Development of a Scalable Structure for Adolescent Exoskeletons. In Proceedings of the 2019 IEEE 16th International Conference on Rehabilitation Robotics (ICORR), Toronto, ON, Canada, 24–28 June 2019; Volume 2019, pp. 323–330. [Google Scholar]
- Taborri, J.; Palermo, E.; Masiello, D.; Rossi, S. Factorization of EMG via muscle synergies in walking task: Evaluation of intra-subject and inter-subject variability. In Proceedings of the I2MTC 2017—2017 IEEE International Instrumentation and Measurement Technology Conference, Turin, Italy, 22–25 May 2017. [Google Scholar]
- Krebs, H.I.; Michmizos, K.P.; Monterosso, L.; Mast, J. Pediatric anklebot: pilot clinical trial. In Proceedings of the 2016 6th IEEE International Conference on Biomedical Robotics and Biomechatronics (BioRob), Singapore, 26–29 June 2016. [Google Scholar]
- Perreault, E.J.; Kirsch, R.F.; Acosta, A.M. Multiple-input, multiple-output system identification for characterization of limb stiffness dynamics. Biol. Cybern. 1999, 80, 327–337. [Google Scholar] [CrossRef]
- Lee, H.; Krebs, H.; Hogan, N. Multivariable dynamic ankle mechanical impedance with relaxed muscles. IEEE Trans. Neural Syst. Rehabil. Eng. 2014, 22, 1104–1114. [Google Scholar] [CrossRef]
- Emken, J.L.; Benitez, R.; Sideris, A.; Bobrow, J.E.; Reinkensmeyer, D.J. Motor Adaptation as a Greedy Optimization of Error and Effort. J. Neurophysiol. 2007, 97, 3997–4006. [Google Scholar] [CrossRef]
- Teulings, H.L.; Contreras-Vidal, J.L.; Stelmach, G.E.; Adler, C.H. Parkinsonism reduces coordination of fingers, wrist, and arm in fine motor control. Exp. Neurol. 1997, 146, 159–170. [Google Scholar] [CrossRef]
- Hausdorff, J.M.; Zemany, L.; Peng, C.; Goldberger, A.L. Maturation of gait dynamics: Stride-to-stride variability and its temporal organization in children. J. Appl. Physiol. 1999, 86, 1040–1047. [Google Scholar] [CrossRef] [PubMed]
- Kubo, K.; Kanehisa, H.; Kawakami, Y.; Fukanaga, T. Growth Changes in the Elastic Properties of Human Tendon Structures. Int. J. Sports Med. 2001, 22, 138–143. [Google Scholar] [CrossRef] [PubMed]
- Lambertz, D.; Mora, I.; Grosset, J.-F.; Pérot, C. Evaluation of musculotendinous stiffness in prepubertal children and adults, taking into account muscle activity. J. Appl. Physiol. 2003, 95, 64–72. [Google Scholar] [CrossRef] [PubMed]
- Hogan, N. The mechanics of multi-joint posture and movement control. Biol. Cybern. 1985, 52, 315–331. [Google Scholar] [CrossRef]
- Baumhauer, J.F.; Alosa, D.M.; Renström, A.F.; Trevino, S.; Beynnon, B. A Prospective Study of Ankle Injury Risk Factors. Am. J. Sports Med. 1995, 23, 564–570. [Google Scholar] [CrossRef]
- Clinch, J.; Deere, K.; Sayers, A.; Palmer, S.; Riddoch, C.; Tobias, J.H.; Clark, E.M. Epidemiology of generalized joint laxity (hypermobility) in fourteen-year-old children from the UK: A population-based evaluation. Arthritis Rheum. 2011, 63, 2819–2827. [Google Scholar] [CrossRef]
- Mandarakas, M.; Pourkazemi, F.; Sman, A.; Burns, J.; Hiller, C.E. Systematic review of chronic ankle instability in children. J. Foot Ankle Res. 2014, 7, 21. [Google Scholar] [CrossRef]
- Goble, D.J.; Lewis, C.A.; Hurvitz, E.A.; Brown, S.H. Development of upper limb proprioceptive accuracy in children and adolescents. Hum. Mov. Sci. 2005, 24, 155–170. [Google Scholar] [CrossRef]
- Bo, J.; Contreras-Vidal, J.L.; Kagerer, F.A.; Clark, J.E. Effects of increased complexity of visuo-motor transformations on children’s arm movements. Hum. Mov. Sci. 2006, 25, 553–567. [Google Scholar] [CrossRef]
- Nordin, M.; Frankel, V.H. Basic Biomechanics of the Musculoskeletal System; Lippincott Williams & Wilkins: Philadelphia, PA, USA, 2001. [Google Scholar]


© 2019 by the authors. Licensee MDPI, Basel, Switzerland. This article is an open access article distributed under the terms and conditions of the Creative Commons Attribution (CC BY) license (http://creativecommons.org/licenses/by/4.0/).