Abstract
This paper presents a comparative study of the effects of grid resolution, vehicle velocity and wind vector fields on the trajectory planning of unmanned airships. A wavefront expansion trajectory planner that minimizes a multi-objective cost function consisting of flight time, energy consumption and collision avoidance while respecting the differential constraints of the vehicle is presented. Trajectories are generated using a variety of test environments and flight conditions to demonstrate that the inclusion of a high terrain map resolution, a temporal vehicle velocity and a spatial wind vector field yields significant improvements in trajectory feasibility and energy economy when compared to trajectories generated using only two of these three elements.
1. Introduction
Path planning algorithms can be categorized into those with differential constraints and those without. Differential constraints refer to limitations such as velocity and acceleration limits, non-holonomic motion and other higher order dynamic constraints. The inclusion of these constraints is important to promote more realistic and feasible paths [1]. Goerzen et al. developed a comprehensive literature summary of path planning methods for unmanned aerial vehicle (UAV) guidance and defined five distinct stages in the planning process: sensor model, terrain representation, roadmap generation, graph search and trajectory generation [2]. The idealized sensor model detects and maps all critical points such as sensed obstacles, initial pose, and goal pose. The terrain representation stage divides the map into a finite search space and segments passable and impassible regions. Roadmap generation is the process of producing a graph that is then searched, with or without differential constraints, for feasible paths or the optimal path (depending on the search approach) between the start and goal poses. The optimality of the path is generally subjective and based on multiple user-defined mission objectives such as time, energy and risk. Applying a scalar-valued preference (or weighting) function to relate each objective into a global cost function is a common approach in multi-objective optimization problems [3,4]. Finally, trajectory generation can be used to perform path smoothing and speed control.
Wind is a major concern for airships and small UAVs with limited propulsion power [5]. If the strength of the local wind is larger than the maximum vehicle velocity, impassible zones are created which many planners do not account for [6]. Moreover, while many planners consider wind as a disturbance whose influence is suppressed by the vehicle’s autopilot [7], the wind vector field has the potential to be used as a source for powering the UAV to further reduce energy consumption and travel time [8]. This has been especially important in the path planning of static soaring UAVs that use the vertical component of wind for lift, or dynamic soaring UAVs that exploit the vertical gradients in the horizontal wind [9,10,11,12,13]. Other sources of wind energy that can be exploited are horizontal shear layers [8]. For example, unperturbed wind velocity creates a boundary layer with the Earth’s surface as shown in Figure 1. During path planning, it is more energy efficient to fly at lower altitudes when travelling into the wind and higher altitudes when travelling with the wind.
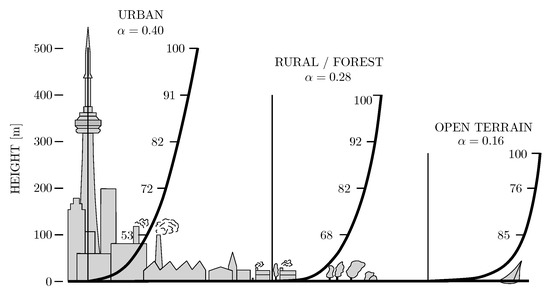
Figure 1.
Percent gradient wind, surface roughness and boundary layer height for different situations (data from Plate [14]).
Potential field path planning methods are uniquely suited to this problem since much of the environmental data, such as digital elevation maps (DEMs) and wind vector fields (WVFs), are already available in a discrete matrix form. The wavefront expansion algorithm is a type of path planning approach that propagates the costs for the graph and does not rely on the potential field being known a priori. Therefore, a navigation policy can be applied to restrict field graph connectivity during the propagation phase based on dynamic constraints such turning rate, pitching rate, velocity and acceleration bounds. This policy promotes more realistic and feasible paths and has the added benefit of reducing the search space. An example of this type of planner is presented by Soulignac to provide feasible and the minimum-time optimal path for small UAVs in the presence of strong current fields [6]. Unfortunately, the research is performed in 2D and does not include other objectives such as fuel or risk. Besada-Portas et al. presented an evolutionary algorithm-based on-line planner for multiple UAVs in 3D that includes optimization of multiple mission objectives such as path length, fuel and several flight risks, but has no mention of wind [15]. McManus developed a wavefront expansion type planner with multiple objectives (distance travelled, time taken, fuel consumed) for a UAV in 3D [16]. In this work, the wind was added as a disturbance, and the dynamic constraints were not taken into account. Al- Sabban et al. presented a Markov decision process-based fixed-wing UAV path planner that exploits wind energy to minimize energy consumption in an uncertain and time-varying wind field [17]. The simulation results showed almost 30% energy savings compared to a straight line path, but this was only conducted for one WVF sample. Furthermore, the study was conducted in 2D with a constant vehicle speed relative to the wind. Perhaps the most relevant work in this field is by Wu et al., who presented an on-line, multi-objective mission planner for fixed-wing UAVs in 3D that includes time, fuel and several risk objectives in the presence of planar wind fields from weather forecasts [5]. However, their path planner uses a nodal resolution of one nautical mile with interpolated 10-nautical mile resolution wind fields to generate long-range paths which cannot account for local terrain features, an important consideration for low-altitude UAVs.
Many non-deterministic methods combining genetic algorithms, ant colony algorithms, particle swarm optimization or neural networks have also been applied to the path planning of autonomous robot navigation [18]. Besada-Portas et al. presented an evolutionary algorithm-based on-line planner for multiple UAVs in 3D that includes optimization of multiple mission objectives such as path length, fuel and several flight risks, but has no mention of wind [15]. To address the growing complexity of problems with increased constraints such as multiple UAVs, parallel evolutionary algorithms have been implemented to decrease the execution time [19]. More recently, biologically-inspired tau-based path planning strategies such as the decentralized receding horizon optimization in [20] were developed to include velocities and time dependencies in the trajectory generation. Many path planners including evolutionary algorithms are based on uniform WVFs [21,22,23,24,25,26] or constant vehicle velocities [6,8,15,27,28,29,30]. The few planners that account for variable wind conditions simplify the environment to two dimensions by assuming a fixed cruise altitude [6,27,28] or assume that the WVF is horizontally planar [5,31,32] with coarse resolution discretization of the flight space (≥1 km).
The purpose of this paper is to demonstrate that coarse resolution grids, average wind data and fixed vehicle speeds overestimate the number of feasible paths and underestimate the energy consumption. This paper also demonstrates that aggregating these parameters in the cost function yields more realistic and feasible paths and shows that corrective wind disturbance rejection methods are inadequate for under-actuated and under-powered unmanned airships. The remainder of this paper is as follows: First, a background on wind modelling and current wind usage is presented. Then, the trajectory planning method consisting of a cost wavefront expansion type trajectory planner is proposed, including a comprehensive multi-objective function to compute energy-optimized flight trajectories for small unmanned airships. The trajectory planner is then simulated in a set of randomly-generated 3D environments, and its effectiveness is evaluated based on several performance metrics.
2. Wind Vector Fields
Wind can be modelled as the vectored sum of two components: a steady ambient component and a stochastic (gust) component [33]. The gust component can be estimated using the Dryden model [34]. The Dryden model consists of passing white noise through the a filter with generalized parameters based on flight conditions such as altitude and severity of turbulence as defined in MIL-F-8785C [35].
The steady ambient wind is typically expressed in the Earth inertial reference frame and can be modelled based on weather information for a given area. For example, wind vector fields are available in 6-h increments with a resolution of ten nautical miles for multiple areas across North America [36] and will likely get more accurate, timely and widespread as weather sensing technology improves. Figure 2 shows a typical wind vector field provided by the National Weather Service in the U.S.
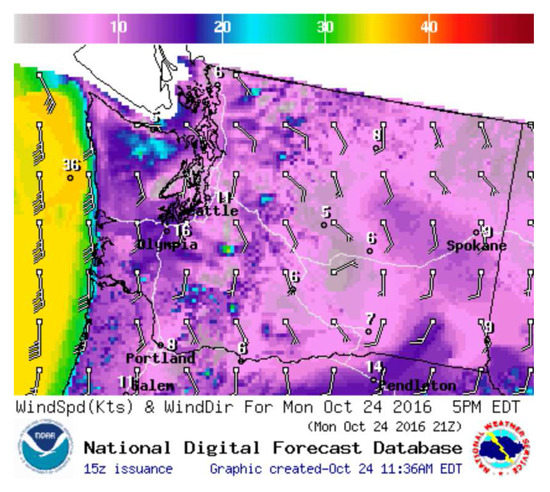
Figure 2.
A typical 2D wind vector field [36].
As an alternative to the publicly available weather information, CFD software is capable of estimating 3D spatial WVF over a DEM given sparse wind monitoring stations. CFD software is especially useful where real-time weather information for an area is not available or for periods when communication with the UAV is lost. It can also provide finer resolution fields capable of capturing local weather patterns such as wind currents around buildings and other surface features such as variations in terrain [37].
3. Vehicle Model
For vehicles with a constant input power, the lowest energy path will be the path with the shortest arrival time. However, with the introduction of a set time goal and 3D spatial WVF applied to a vehicle capable of zero-speed flight, such as airships, there is the potential of a velocity varying path (i.e., trajectory) that consumes less energy. Energy consumption estimates are dependent on multiple factors and are highly platform specific. Airships, like most UAVs, are under-actuated non-holonomic vehicles, which require additional energy to change their orientation, which cannot be neglected for medium to long-range path planning. Moreover, rapid changes in orientation can cause unstable behaviours. A recent study by Al-Sabban et al. suggests that these changes, as well as incorporating a six-degree of freedom model affect path planning performance [8]. The model developed in this paper includes several significant differential constraints inherent to airships and other non-holonomic UAVs.
The theoretical energy required to change orientation is negligible compared to that of forward motion for highly dynamic manoeuvring UAVs. Conversely, airships are typically under-actuated and under-powered and thus have large turning radii. This results in longer paths and increased flight times between two points. The additional time to travel between two points depends on two factors: the ratio of the minimum turning radius over the distance between nodes, , and the magnitude of the orientation change, . Figure 3 shows an example of an idealized kinematic reorientation that takes into account the minimum turning radius. The true distance, , is the arc length of the two tangent arcs; the first is tangent to with radius , and the second is tangent to both the first arc and . The orientation ratio, o, is the ratio of the true distance over the idealized straight line distance, .
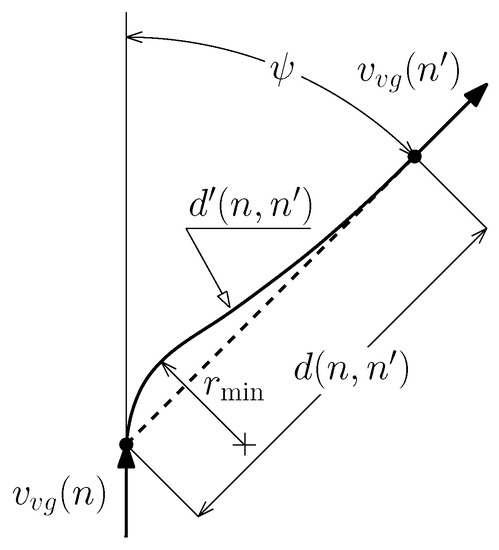
Figure 3.
Idealized reorientation between two nodes.
The platform considered in this paper is shown in Figure 4. It has a fixed pair of forward facing electric thrusters complimented by a hybrid gas-electric power plant and uses two tail-mounted thrusters for directional control and roll stability [38,39]. The minimum turning radius ranges from 0 m at zero linear velocity to 10 m at a cruise speed of 12 m/s. This was estimated empirically from the full dynamic model of the vehicle developed in [40]. Considering a resolution between nodes of 50 m, the increase in energy to reorient the vehicle can be upwards of 25% for a 90 turn. The platform considered also exploits the use of air ballasts (ballonets) for altitude control and pitch stability. These actuators use an electric air pump to change ballast volume. The ballonets also provide two essential alternate functions of pressure regulation to ensure structural integrity and weight ballasting to compensate for the consumed fuel of the power plant.
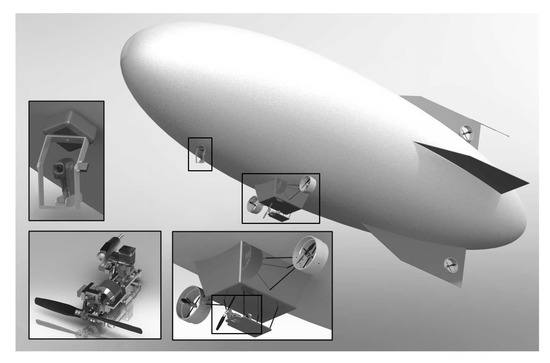
Figure 4.
Platform used in the simulations (middle), camera, GPS and inertial navigation system (left), hybrid power plant (lower left) and auxiliary electric propulsion (lower middle) [38].
4. Cost Wavefront Expansion Planner
The optimal flight trajectory is defined to be the one that reaches the goal position within the desired time while consuming the minimum amount of energy and avoiding obstacles at a sufficiently safe distance.
The cost wavefront propagation is a simple yet efficient method for generating optimal paths in autonomous robot applications in unknown environments [41]. This approach starts from the robots’s current position and expands anisotropically outward toward the goal position while minimizing a cost function. The cost function is the sum of all trajectory objectives multiplied by the mission weights that are dependent on the mission objective priority and selected by the user a priori. The cost function is then searched using a multi-resolution Dijkstra algorithm. This approach produces a trajectory that is complete and resolution optimal [2].
The cost function, , proposed for the trajectory planning of unmanned airships is given by,
with the user-selectable weight, W, given by:
for any two nodes n and where the subscripts t, e and a denote the time, energy and avoidance objectives, respectively. In (1), the three objective cost functions are mapped onto a common scale of zero to one with the exception of , which equals ∞ at the obstacle boundary.
The selection of resolution and scope is critical since the Dijkstra search algorithm is only resolution optimal and has a proven computational complexity of , where N is the number of nodes in the grid [2]. If the resolution is too large, the planner will generalize obstacles and will over-simplify the wind vector field. If the resolution is too small, planning becomes more computationally expensive. One approach to reduce computation time is to apply sub-optimality bounds through the inclusion of an inflated heuristic (a multiplier greater than one that penalizes new path branches) [42]. It can be shown that the confidence level on the environmental information, such as wind, decreases as the distance from the vehicle increases [43]. The optimal trajectory segments close to the goal node may change due to variations in temporal environmental information (such as wind and flight patterns of other aircraft). Thus, the value of determining the optimal trajectory segments near the goal node is diminished. Two types of methods can be imposed to mitigate this uncertainty. The first is the use a multi-resolution grid, employing a fine resolution in the immediate vicinity of the UAV, and a coarse resolution approaching the goal node. This approach is similar to the action space map decomposition approach outlined in [44]. Since both fine and coarse resolutions follow the same procedure, this paper focuses on the short-range, fine resolution grid. Using this method, the sub-optimality condition can be effectively controlled by adapting the spatial range and gradient of resolution changes to maximize optimality within the computational constraints. The second method, which could also be applied during the implementation stage, is temporal re-planning which is similar to the three re-planning triggers outlined in [45].
5. Trajectory Objectives
The three objectives in (1) need to be simultaneously optimized for any given mission. The trajectory objectives can be formulated based on the availability and limitations of the equipment on-board the UAV to facilitate the implementation of the planner on a physical platform.
Wind is added to each node n according to the sum of WVF and gusts, but assumed to be constant in between nodes. If the vehicle is to arrive at the next node , the vehicle’s ground velocity, , must be parallel to the unit vector direction to that node, . Thus, the perpendicular components of the wind, , and the vehicle velocity relative to the wind, , must be equal and opposite. The parallel component of the vehicle’s relative velocity, , can then be optimized for the time and energy objectives depending on the current flight conditions. The components of the vehicle velocity vector relative to the ground and to the wind are shown in Figure 5.
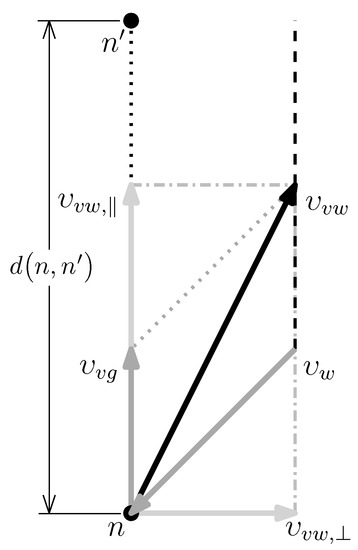
Figure 5.
Vehicle velocity vector components relative to the ground and to the wind.
5.1. Arrival Time
The time to traverse a cell bounded by the nodes n and can be approximated by,
where o is the orientation ratio (described in Section 3) and d is the distance between nodes. This time estimate extends the work of Wu et al. [5] by considering that the distances and vectors are three-dimensional, and the time estimate approaches infinity when the wind magnitude along the vehicle trajectory is equal to or above the vehicle’s cruise velocity. The equation adjusts for the non-linear flight trajectory between nodes using the orientation ratio. It is assumed that, when , the vehicle will achieve an angle of sideslip (crab angle) to offset the lateral wind. This is an important distinction as the lateral wind reduces the vehicle’s available goal-oriented velocity, whereas the parallel component reduces the traversal time. It is also important to note that the true traversal time depends on other factors such as vehicle stabilization effort and trajectory tracking error, which require a complete dynamic model flight simulation for a more accurate approximation.
Although time between nodes can be minimized directly, it does not provide the operator any feedback on the final travel time before selecting a weight, which makes weight selection difficult. In real-world applications, the travel time between grid nodes is time-dependent [46,47]. In other words, the arrival time cost is a function of the progress the aircraft has made towards arriving to the goal node. Therefore, it is appropriate to non-dimensionalize time by a user-selectable time goal and the distance remaining to the final goal node. This also has the advantage of extending the arrival time factor to the time-dependent case where the remaining cost is dependent on the total cost so far (i.e., how on schedule the UAV is to meet a given estimated time of arrival). Cumulative time can be non-dimensionalized by considering the user-selectable arrival time to the goal node, . The time objective cost function, , can thus be written as,
where is the initial Euclidean distance from the start to the goal node while, is the remaining Euclidean distance from the current node n to the goal node and is the total time spent from the start node to current node. When is less than one half, the UAV is ahead of schedule, and when it is greater than one half, the UAV is behind schedule. Equation (4) enables the trajectory planner to adapt to unforeseen environments. Since lighter-than-air vehicles do not need a forward velocity to maintain lift, the velocity of the UAV can be modified along the length of the path to successfully arrive at the goal node by the user-set time. Under this assumption, the optimal vehicle speed, , for time at each node can be defined as,
If the current travel time has already exceeded the time goal, the vehicle speed for time is set to maximum vehicle velocity, , for the remaining duration of the flight. Changing the weight for arrival time, , affects the choice of the path, but also changes the vehicle’s velocity, which is further explained in Section 5.2.
5.2. Energy Consumption
The energy objective cost function, , can be defined by the energy required to traverse two nodes. Considering the vehicle described in Section 3, is given by,
where is the power required to propel the vehicle at the desired ground speed along the horizontal path, is the power required to change altitude and is the constant electrical power required to maintain on-board electronics (e.g., camera, flight controller, telemetry, etc.). The inclusion of is significant as it can represent up to 65% of the total power for airships [48]. The addition of this parameter also prevents unrealistic loitering when a large time goal is set in the planner. The platform simulated in this paper has constant on-board electronic power requirements of W [38]. The energy constant is used to normalize the energy cost. It is set at with zero net wind (computed to be 1.50 Wh for the proposed platform).
Substituting the definitions of mechanical power for propeller and pump actuators into (6) gives,
where −12 L/s L/S is the air flow rate through the air ballast pump for the given platform [40], is the change in atmospheric pressure between nodes and is the force required from the UAV’s thrusters. The propeller forces applied by the UAV thrusters, including the electric motors and the hybrid power plant, are non-linear functions of input electrical power. A propeller’s efficiency, , is dependent on the propeller advance ratio, which is the ratio of the vehicle’s relative velocity over the product of the propeller’s diameter and rotational speed. Based on a third order least squares fit of propeller efficiency curves for the 12-inch propeller used by the simulated platform, the propeller efficiency can be estimated from,
for m/s [38]. The wind vector field is a crucial addition to the energy consumption model as longitudinal winds will effect the arrival time in (3) and compounds the effect of applied lateral winds in (7). For a force equilibrium,
The product of the axial drag coefficient and reference area, , in (9) can be estimated by a few methods. Using the empirical method proposed by Hoerner [49], the value for this platform is 0.229. Using the procedure outlined by Jones [50], the value is 0.147. Furthermore, the value is not constant for all flight conditions, and increases with both the angle of attack and the angle sideslip. Therefore, for the airship to hold a constant crab angle into the wind is not trivial from the perspective of energy consumption. In this paper, the value predicted by Jones was used as it was developed explicitly for airships [50].
The air ballast flow rate, Q, is assumed to be equal to the ballast volume change, , required to maintain vehicle buoyancy with changes in altitude over a given travel time,
where is the envelope volume of vehicle. Substituting (3), (9) and (10) into (7) yields the complete energy objective function,
The energy objective cost function (11) is a non-linear function with respect to , which makes solving for the vehicle velocity for minimum energy, , difficult. It can be solved using non-linear optimization or numerical methods, but this was found to be too computationally expensive for real-time planning. For these simulations, was solved directly assuming that is constant and,
Although the trajectory planner finds the optimal path based on the energy and time priorities, the vehicle’s velocity along the path also has a significant impact. When time and energy priorities have conflicting vehicle speeds, a weighted sum of both optimal speeds is used to select the speed according to,
while satisfying the vehicle’s velocity limits of . If the vehicle speed for minimum energy is faster than the one for arriving on time, the vehicle speed for minimum energy is used.
5.3. Collision Avoidance
In this paper, the collision avoidance objective function, , considers the terrain, the altitude ceiling and static obstacles (including airspace constraints and no-fly-zones). Each risks is considered to have a finite minimum separation zone (MSZ) based on aircraft visual flight regulations or risk minimization. The MSZ for each risk is defined as a distance from the risk boundary to the obstacle. The collision objective cost is normalized from zero to one while operating outside any MSZ and is equal to ∞ inside the MSZ. The collision avoidance objective function for the proposed vehicle is taken to be the maximum of the terrain, altitude ceiling and static obstacle components such that:
The terrain component, , adopted is,
The pressure altitude ceiling component, , is taken as,
The static obstacles component including buildings, , is defined as,
where are the distances between the vehicle v and the terrain l, altitude ceiling m and blocks of buildings o, along the x,y,z axis in Cartesian coordinates. The selection of the avoidance term depends on the vehicle position with respect to the obstacle. As an example, the second term of (17) would be used for the vehicle position shown in Figure 6.
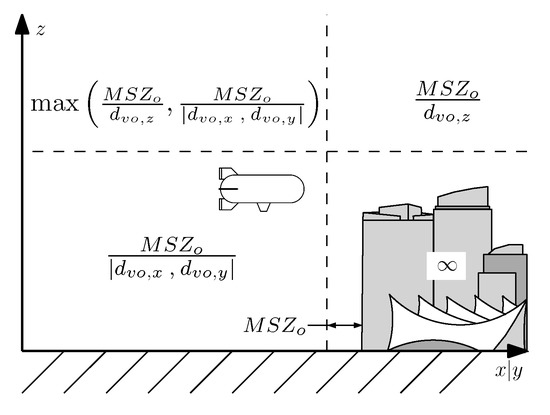
Figure 6.
Definition of term in relation to buildings.
Additional terms can be added to (14) to include restricted airspace, dynamic objects such as other UAVs and ground vehicles. The planner’s ability to avoid dynamic obstacles depends on the the object’s speed relative to the UAV, the frequency, range and uncertainty of the available on-board sensor information and the frequency of the re-planning process.
6. Numerical Simulations
6.1. Trajectory Planning and Test Setup
Once a multi-objective cost function field is formulated, the desired trajectory through the field is determined using 3D grid search techniques. A terrain map nodal list is generated based on an rectangular grid representation of 2 km × 2 km × 1 km with a nodal resolution of 50 m × 50 m × 10 m for a total of nodes. This resolution was chosen because it is roughly the same as 0.75 arc-sec digital elevation maps that are publicly available from GeoBase. To reduce the computation time, the connections between nodes are generated using the vector neighbor operator [5]. It provides an average horizontal angle increment and allows for flight path angles of some predetermined values to connect successive path nodes as they may not lie within adjacent grid cells. This technique avoids the exhaustive search within all the nodes and provides a better scalability to the search space. As it is illustrated in Figure 7, the black arrow represents the UAV direction while the gray lines represent possible UAV directions (assuming that the nodes exist and are not outside the search environment). Redundant connections are eliminated (for example, [2, 2, 2] is excluded because it is a multiple of [1, 1, 1]). Furthermore, connections that create an angle greater than the critical turning or pitching angles of the UAV described in Section 3 were also omitted.
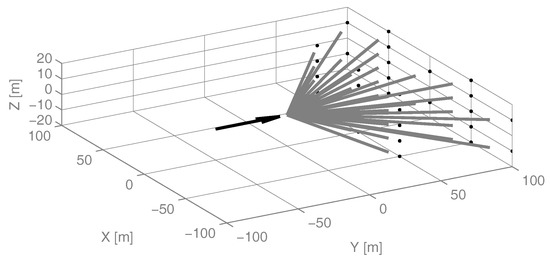
Figure 7.
Vector neighbor operator.
The field strengths for obstacles are computed using (15) to (17). The field strengths for time and energy consumption are computed on demand as they depend on the nodal approach direction, wind conditions and other flight characteristics. The multi-objective cost function is minimized using the Dijkstra algorithm [51] and the computation time, total trip time, energy consumption and the distance to the closest obstacle along the path are recorded. In the implementation of the planner, the WVF data would be recomputed frequently to capture changes over time and could be supplemented by publicly available weather forecasts for added confidence.
As mentioned in Section 1, many planners described in the literature consider only uniform WVFs or assume constant vehicle velocity paths. Additionally, planners that do include variable WVFs were found to have a coarse terrain resolution (>1 km). The low resolution of a planner can oversimplify weather information between nodes reducing the planning problem to the shortest straight line path in a uniform wind field case. The following four test cases were identified to illustrate the importance of a fine terrain nodal resolution, spatial WVFs, and temporal vehicle velocities.
Case 1, Low terrain resolution: This case emulates low terrain resolution planning by constructing a trajectory that consists of the shortest straight line segment between the current node and the goal node that respects the vehicle constraints and avoids known obstacles. The cost function (1) is modified to . This case uses the spatial WVF, and the planner optimizes the velocity along the path.
Case 2, Constant velocity: The optimal velocity Equation (13) is ignored, and the vehicle velocity is held at a constant value equal to the distance between the start and goal nodes divided by the goal time. This case uses the spatial WVF.
Case 3, Uniform WVF: The planner assumes a constant and uniform WVF equal to the average bulk flow direction and magnitude at all nodes (computed from the spatial WVF). The planner optimizes the velocity and the path.
Case 4, Complete planner: This is the full trajectory planner proposed in this work. It is applied as outlined in Section 5 using fine nodal resolution. This case uses the spatial WVF, and the planner optimizes the velocity and the path.
Paths were planned using the WVF data generated. Stochastic wind gust was added to the steady field after the planning process to account for uncertainties in the wind model. A trajectory is considered to converge to a feasible solution if the planner finds an obstacle-free path that connects the start and goal nodes within a finite time. The path planning is considered to fail in reaching a feasible solution if the generated path crosses regions where the total (WVF and gust) wind magnitude is higher than the vehicle velocity. This is when strong opposing winds form a planar barrier preventing the UAV from reaching its destination. Trajectories that do not meet the time goal are considered convergent, but with a poor performance due to their long flight times. The three weights defined in (1) were set to 1/3. The goal time was set to 300 s, and the maximum vehicle velocity was set to 12 m/s. The simulations were performed in MATLAB on an Intel Core 2 Duo 2.80-GHz CPU with 4 GB of RAM.
6.2. Test Environment
The DEMs (terrain) for the test environments were generated based on statistical data from the real DEM of Vancouver, BC, Canada, which is publicly available on GeoBase [52] as it features significant changes in elevation. One hundred DEMs were then generated by randomly adding blocks of buildings to the terrain according to the seed variables listed in Table 1.

Table 1.
Seed values for terrain generation based on typical conditions in Vancouver, BC, Canada.
For each environment, a 3D spatial WVF was generated with the help of the CFD software WindStation using a single wind vector seed to populate the entire control volume based on the interaction with the terrain and the building topography. The wind seed direction was a uniformly random integer between and . The wind seed magnitudes were produced based on the approximation that wind magnitude follows a Weibull probability density function [53] with a shape value of two and a scale of , where the mean wind velocity , for Vancouver is 3.61 m/s (averaged annually) [54]. The WVF resolution was set equal to the terrain’s nodal resolution of 50 m to negate any computational time required for interpolation between nodes. The WVF was generated using the k-epsilon turbulence model with surface roughness set to 2 m and the max residual set to .
6.3. Results and Discussion
Figure 8 shows a typical environment with the planned trajectory plotted for each planner and cross-sections of the variable WVF. In this example, the start and goal nodes are set to and km, respectively. The wind seed, represented by a light blue line, is approximately located at km, has a direction, and a magnitude of 3.25 m/s. The darker regions of the WVF cross-sections in the figure indicate high wind magnitudes. The WVF is computed at the start of the planning process and remains constant during the simulation.
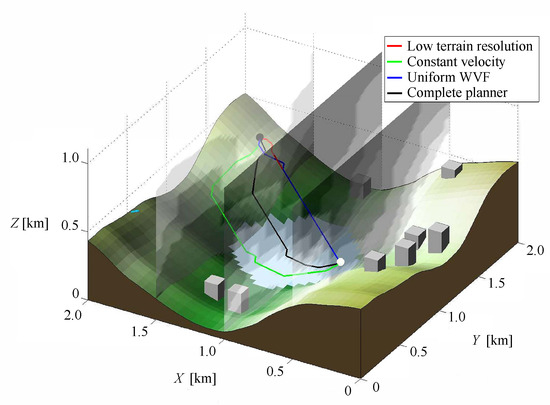
Figure 8.
A typical planned trajectory in a simulated city landscape showing WVF magnitude cross-sections. Note: please refer to the full-color PDF.
The performance of the proposed complete planner was bench-marked against that of the other three. The aggregated results of 100 simulations are summarized in Table 2. It is important to note that the average computation time, the average flight time and the average energy consumption were only computed for instances where all four cases had produced a feasible trajectory. It is also important to note that buildings are randomly generated in each new simulation. Generally speaking, however, the wind amplitude and turbulence is much larger around buildings than away from buildings, as will be discussed at the end of this section. Therefore, when combined with the MSZ, the airship tends to plan paths well away from buildings.

Table 2.
Performance comparison between trajectories generated by the four planners. (a) impact of nodal resolution; (b) impact of path planning versus trajectory planning; (c) impact of fixed versus variable WVF.
The first comparison, shown in Table 2a, illustrates the impact of using a low terrain resolution planner. The high resolution trajectory planner converged to a viable solution 94/100 times as opposed to 57/100 for the low resolution version. The convergence rate for the shortest straight line case is understandably low since the vehicle has limited on-board power and the number of passable nodes is limited. Furthermore, the average energy computed in the low resolution case for the trajectories that did converge was over four-times higher than the high resolution version. The lower computation time for the low terrain resolution planner was caused by many of the potential trajectory options being eliminated when optimizing for the shortest distance instead of minimum time and/or energy. However, the computation time for both planners was still only a fraction of the predicted flight time.
The second comparison, shown in Table 2b, illustrates the impact of using a temporal vehicle velocity. The paths generated without velocity optimization were generally spatially similar to the complete trajectory planner. However, the constant velocity planner exhibited a lower convergence due its inability to overcome stronger lateral and head winds. Excluding velocity in the path planning process also excludes the option of planning the time the UAV will be in a given wind field. To fully optimize energy consumption, it is desirable to remain in tail winds for a longer period of time (by reducing airspeed) and passing through strong lateral and head winds as quickly as possible.
To further illustrate this effect, a case study was conducted to highlight the function selecting the vehicle velocity to minimize the energy consumption defined in (11). Consider the vehicle flying horizontally over a straight line distance of 100 m, with varying amounts of parallel and perpendicular wind components, and = 0, 3, 6 m/s, respectively. If these wind components are known, the vehicle velocity, , can be chosen to minimize energy, as shown by the white line on each surface in Figure 9. Clearly, since the line in each graph is nonlinear, the desired vehicle velocity for minimal energy consumption is not constant and should be included in the planning process. Furthermore, Figure 9 shows that the optimal vehicle velocity is never zero even in the presence of a pure tail wind due to the non-negligible constant power required to maintain the on-board electronics.

Figure 9.
Energy map for various lateral wind speeds. (a) m/s; (b) m/s; (c) m/s.
The third comparison, shown in Table 2c, illustrates the impact of using a fixed WVF path planner. The trajectories generated with this planner tended to be similar to those generated by the low terrain resolution planning, discussed earlier. Since the WVF was considered to be uniform, the UAV would climb into higher magnitude winds resulting in considerable energy consumption increases. The uniform WVF planner converged less often due to the lack of awareness and planning for stronger head winds. In the cases where the planner converged, the resulting viable trajectories were faster on average, but exhibited greater variability. The standard deviation in flight times for the uniform WVF and the complete planners was 135 s and 74 s, respectively. The full planner was slightly faster on average then the constant velocity and the uniform WVF planners. This can be explained by the fact that fewer connections between the nodes were feasible in the full planner case as a consequence of more connections exhibiting negative ground velocities. The reduction in the number of feasible connections reduces the computational load and the processing time of the optimization. In individual tests with low wind velocity seeds, the fixed WVF path planner converged faster than the complete planner; however energy savings could still be achieved using the complete planner, as airships are highly sensitive to wind disturbances. It is worth noting that the mean wind velocity seed used in the simulation was 3.61 m/s or 13 km/h and that this is considered low wind for heavier-than-air UAVs.
In addition to these comparisons, it is worth commenting on the design of the trajectory planner. The complete trajectory planner has a consistently higher convergence rate than any other planner considering only two of the three key factors. The limited flight speed for small-scale UAVs imposes severe path restrictions and even impassible regions at high altitudes where wind magnitudes can be higher. The inability to adapt the path or vehicle velocity to avoid these conditions has been shown to reduce the feasibility of the trajectories that were produced. More importantly, the energy consumed by trajectories generated by the complete trajectory planner using a variable trajectory and variable WVF data was found to be at least 50% lower on average over all scenarios simulated.
Figure 10 shows the average energy consumed for each planner with a 95% confidence interval. The improvement in performance between the complete and the other planners was greater than the error in performance caused by the random gust wind component. Therefore, the inclusion of all three key factors to UAV trajectory planning yielded a significant improvement.
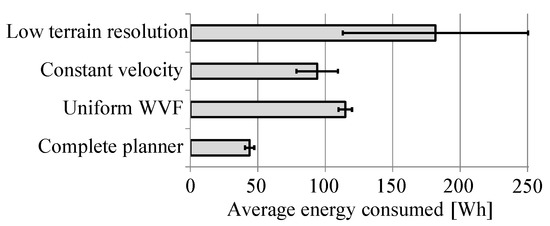
Figure 10.
Comparison of the average energy consumed per trial for each planner.
The maximum computation time for a single trial of the complete planner was 78 s. It is worth noting that the WVFs were loaded from a calculated a priori database. Hence, uploading variable WVFs’ data using CFD computations in the physical UAV may lead to an additional overhead and so to a slight increase in the processing time. However, it was observed that the WVFs for these trials were calculated in 60 s, on average, and never more than 90 s using WindStation Version 4.0.1. The resulting total computation time to calculate the CFD WVF plus the trajectory over the 2 km × 2 km × 1 km control volume would still be only a fraction of the predicted flight time to traverse the trajectory. Since the trajectories can be planned faster than they can be followed, it is reasonable to conclude that the proposed complete trajectory planner could be used for unmanned airships. Depending on the desired resolution and on-board processing capabilities, it is foreseeable to include temporal and spatial WVF generation into the re-planning process or equipping the UAV with a local planner to find optimal paths within regions where obstacles are detected and re-planning is required, for instance. CFD-generated WVF data could also be fused with national weather service predictions (when available) and UAV-generated wind measurements for added certainty.
The UAV attempts to arrive at the goal node within the allowed time frame by adjusting both the path in (4) and the vehicle speed in (5). This redundancy leads to a conservative trajectory planning approach. Based on the one-to-one weight ratio of time and energy, the ability to arrive at the goal node on time for the four respective planners was 53.2%, 53.2%, 87.2% and 91.5%, respectively. In addition, the complete planner arrived 32.5% earlier than expected, on average. If the weight for time is reduced, the arrival time will follow the goal time more closely. The average additional time due to reorientation of the UAV was on average 1.5% per convergent trial. Therefore, the idealized reorientation of Figure 3 is relevant to this UAV platform.
The trajectory planner uses wind speed and direction to optimize the vehicle velocity and path. Therefore, incorporating turbulence intensity data into the path planner may further optimize the generated path. It is known that turbulence flows persist long into the wake of a disturbance. Although their intensity is low, it may have a detrimental effect on the flight performance. As an example, this means penalizing areas with relatively high turbulence intensities, such as the one circled in a solid line in Figure 11a, and rewarding the others with low turbulence intensities, like the one circled in a dashed line. The CFD software WindStation, used to generate WVFs, also produces the turbulence intensity fields, shown in Figure 11b. These data could readily be incorporated into the objectives in the cost function. However, platform-specific experimental flight data would be required to fully realize the impact of turbulence intensity on the flight performance and to properly utilize the turbulence data for trajectory planning. In addition to turbulence, thermal effects could also be included in the generation of the WVF generated by the CFD software to account for the vertical wind components produced by thermal convection [55].

Figure 11.
Wind speed and turbulence intensity around a mountain ridge and city blocks. (a) Wind speed plot; (b) turbulence intensity plot.
7. Conclusions
In this paper, a wavefront expansion trajectory planner incorporating a comprehensive multi-objective function for unmanned airships is presented with the purpose of quantifying the reductions in energy consumption achievable when using spatial WVFs, high resolution grid and temporal vehicle velocities in the planning process. The planner was subjected to large, highly realistic, 3D environments and simulated over a variety of flight conditions. The inclusion of spatial WVF data significantly improved the trajectory feasibility (convergence rate) and reduced the energy consumption by 53–76% when compared to other planners. The results have also illustrated that the trajectory planner could operate in semi-real time on a less powerful on-board computer as the average processing times were a small fraction of the flight times.
Although the energy objective function encompasses many of the factors contributing to the energy consumption, there is still room for improvement. The aerodynamic drag on the vehicle is not constant for all flight conditions as was assumed in this model. Furthermore, various degrees of stabilization are often required to maintain a UAV on a given trajectory, which are not accounted for. Errors due to this stabilization effort will increase when aggressive arrival times are set. Applying a trajectory following controller with the complete non-linear dynamic model and a temporal WVF would help validate the realism of the generated trajectories and would provide a more accurate prediction of the travel time and energy consumed.
Acknowledgments
This research was partially funded by Natural Sciences and Engineering Research Council of Canada (NSERC) and the Canada Foundation for Innovation (CFI).
Author Contributions
This article is an outcome of the Ph.D. research of Steven Recoskie. He conceived of, designed and performed the experiments. He also wrote most of the paper. Eric Lanteigne and Wail Gueaieb co-supervised and co-directed the research. They also helped analyse the results and contributed in writing and editing the article.
Conflicts of Interest
The authors declare no conflict of interest. The funding sponsors had no role in the design of the study; in the collection, analyses or interpretation of data; in the writing of the manuscript; nor in the decision to publish the results.
Abbreviations
The following abbreviations are used in this manuscript:
| A | Reference area [m] |
| Cost | |
| C | Constant |
| Density [kg/m] | |
| d | Distance [m] |
| E | Energy [J] |
| F | Force [N] |
| Efficiency | |
| n | Node identifier |
| N | Number of nodes |
| o | Orientation ratio |
| Pressure [Pa] | |
| P | Power [W] |
| Q | Volume flow rate [m/s] |
| t | Time [s] |
| Velocity [m/s] | |
| V | Volume [m] |
| W | Weight |
| z | Elevation [m] |
| a | Avoidance |
| c | Constant |
| d | Drag |
| e | Energy |
| g | Goal |
| l | Terrain |
| m | Pressure ceiling |
| o | Obstacle |
| Optimal for time | |
| Optimal for energy | |
| r | Remaining |
| T | Thrust |
| w | Wind |
| v | Vehicle |
| Vehicle with respect to ground | |
| Vehicle with respect to wind | |
| ‖ | Parallel |
| ⊥ | Perpendicular |
| CFD | Computational fluid dynamics |
| DEM | Digital elevation map |
| ETA | Estimated time of arrival |
| MSZ | Minimum separation zone |
| UAV | Unmanned aerial vehicle |
| WVF | Wind vector field |
References
- Kong, Z.; Korukanti, V.; Mettler, B. Mapping 3D guidance performance using approximate optimal cost-to-go function. In Proceedings of the AIAA Navigation, Guidance and Control Conference, Chicago, IL, USA, 10–13 August 2009; pp. 1–21. [Google Scholar]
- Goerzen, C.; Kong, Z.; Mettler, B. A survey of motion planning algorithms from the perspective of autonomous UAV guidance. J. Intell. Robot. Syst. 2010, 57, 65–100. [Google Scholar] [CrossRef]
- Sawaragi, Y.; Nakayama, H.; Tanino, T. Theory of Multiobjective Optimization; Academic Press: New York, NY, USA, 1985. [Google Scholar]
- Guivant, J.; Nebot, E.; Nieto, J.; Masson, F. Survey of multi-objective optimization methods for engineering. Struct. Multidiscip. Optim. 2004, 26, 369–395. [Google Scholar]
- Wu, P.P.Y.; Campbell, D.; Merz, T. On-board multi-objective mission planning for unmanned aerial vehicles. In Proceedings of the IEEE Aerospace conference, Big Sky, MT, USA, 7–14 March 2009; pp. 1–10. [Google Scholar]
- Soulignac, M. Feasible and optimal path planning in strong current fields. IEEE Trans. Robot. 2011, 27, 89–98. [Google Scholar] [CrossRef]
- Masoud, A.A. A harmonic potential field approach for planning motion of a UAV in a cluttered environment with a drift field. In Proceedings of the IEEE Conference on Decision and Control, Orlando, FL, USA, 12–15 December 2011; pp. 7665–7671. [Google Scholar]
- Al-Sabban, W.H.; Gonzalez, L.F.; Smith, R.N.; Wyeth, G.F. A wind-energy based path planning for unmanned aerial vehicles using markov decision processes. In Proceedings of the IEEE International Conference on Robotics and Automation, Karlsruhe, Germany, 6–10 May 2013; pp. 1–6. [Google Scholar]
- Lawrance, N.R.J.; Sukkarieh, S. A guidance and control strategy for dynamic soaring with a gliding UAV. In Proceedings of the IEEE International Conference on Robotics and Automation, Kobe, Japan, 12–17 May 2009; pp. 3632–3637. [Google Scholar]
- Rubio, J.; Kragelund, S. The trans-pacific crossing: Long range adaptive path planning for UAVs through variable wind fields. In Proceedings of the 22nd Digital Avionics Systems Conference, Indianapolis, IN, USA, 12–16 October 2003; pp. 1–12. [Google Scholar]
- Langelaan, J.W.; Spletzer, J.; Montella, C.; Grenestedt, J. Wind field estimation for autonomous dynamic soaring. In Proceedings of the IEEE International Conference on Robotics and Automation, Saint Paul, MN, USA, 14–18 May 2012; pp. 16–22. [Google Scholar]
- Chakrabarty, A.; Langelaan, J. UAV flight path planning in time varying complex wind-fields. In Proceedings of the American Control Conference, Washington, DC, USA, 17–19 June 2013; pp. 2568–2574. [Google Scholar]
- Chakrabarty, A.; Langelaan, J.W. Energy maps for long-range path planning for small-and micro-UAVs. In Proceedings of the Guidance, Navigation and Control Conference, Chicago, IL, USA, 10–13 August 2009; pp. 1–13. [Google Scholar]
- Pasquill, P. Aerodynamic Characteristics of Atmospheric Boundary Layers; US Department of Energy: Southwest Washington, DC, USA, 1971; pp. 622–623.
- Besada-Portas, E.; de la Torre, L.; De La Cruz, J.M.; Andres-Toro, B. Evolutionary trajectory planner for multiple UAVs in realistic scenarios. IEEE Trans. Robot. 2010, 26, 619–634. [Google Scholar] [CrossRef]
- McManus, I.A. A Multidisciplinary Approach to Highly Autonomous UAV Mission Planning and Piloting for Civilian Airspace. Ph.D. Thesis, Queensland University of Technology, Brisbane, Australia, 2001. [Google Scholar]
- Sarma, A.; Hochstetler, R.; Wait, T. Optimization of airship routes for weather. In Proceedings of the AIAA Aviation Technology, Integration and Operations Conference, Belfast, Ireland, 18–20 September 2007; pp. 1–6. [Google Scholar]
- Chen, J.; Xie, S.; Li, H.; Feng, K. Robot path planning based on adaptive integrating of Genetic and Ant Colony Algorithm. Int. J. Innov. Comput. Inf. Control 2016, 11, 833–850. [Google Scholar]
- Cekmez, U.; Ozsiginan, M.; Sahingoz, O.K. Multi-UAV path planning with parallel genetic algorithms on CUDA architecture. In Proceedings of the Genetic and Evolutionary Computation Conference Companion, Denver, CO, USA, 20–24 July 2016; pp. 1079–1086. [Google Scholar]
- Yang, Z.; Fang, Z.; Li, P. Decentralized 4D trajectory generation for UAVs based on improved intrinsic tau guidance strategy. Int. J. Adv. Robot. Syst. 2016, 13, 1–13. [Google Scholar] [CrossRef]
- Nelson, D.R.; Barber, D.B.; McLain, T.W.; Beard, R.W. Vector field path following for miniature air vehicles. Proc. IEEE Trans. Robot. 2007, 23, 519–529. [Google Scholar] [CrossRef]
- Sjanic, Z. On-Line Mission Planning Based on Model Predictive Control. Master’s Thesis, Division of Automatic Control, Department of Electrical Engineering, Linkoping University, Linkoping, Sweden, 2001. [Google Scholar]
- Techy, L.; Woolsey, C.A. Minimum-time path planning for unmanned aerial vehicles in steady uniform winds. J. Guid. Control Dyn. 2009, 32, 1736–1746. [Google Scholar] [CrossRef]
- Doshi, A.A.; Singh, S.P.N.; Postula, A.J. Towards reduced-order models for online motion planning and control of UAVs in the presence of wind. In Proceedings of the Australasian Conference on Robotics and Automation, Wellington, New Zealand, 3–5 December 2012; pp. 1–7. [Google Scholar]
- Selecký, M.; Ván̆a, P.; Rollo, M.; Meiser, T. Wind corrections in flight path planning. Int. J. Adv. Robot. Syst. 2013, 10. Available online: http://arx.sagepub.com/content/10/5/248.full.pdf+html (accessed on 17 October 2017). [CrossRef]
- McNeely, R.L.; Iyer, R.V.; Chandler, P.R. Tour planning for an unmanned air vehicle under wind conditions. J. Guid. Control Dyn. 2007, 30, 1299–1306. [Google Scholar] [CrossRef]
- Soulignac, M.; Taillibert, P.; Rueher, M. Time-minimal path planning in dynamic current fields. In Proceedings of the IEEE International Conference on Robotics and Automation, Kobe, Japan, 12–17 May 2009; pp. 2473–2479. [Google Scholar]
- Liu, C.; McAreet, O.; Chen, W.H. Path following for small UAVs in the presence of wind disturbance. In Proceedings of the UKACC International Conference on Control, Cardiff, UK, 3–5 September 2012; pp. 613–618. [Google Scholar]
- Kuroki, Y.; Young, G.S.; Haupt, S.E. UAV navigation by an expert system for contaminant mapping with a genetic algorithm. Expert Syst. Appl. 2010, 37, 4687–4697. [Google Scholar] [CrossRef]
- Chang, S.R.; Huh, U.Y. Curvature-continuous 3D path-planning using QPMI method. Int. J. Adv. Robot. Syst. 2015, 12, 1–8. [Google Scholar] [CrossRef]
- Lee, S.; Bang, H. Three-dimensional ascent trajectory optimization for stratospheric airship platforms in the jet stream. J. Guid. Control Dyn. 2007, 30, 1341–1352. [Google Scholar] [CrossRef]
- Mueller, J.B.; Zhao, Y.J.; Garrad, W.L. Optimal ascent trajectories for stratospheric airships using wind energy. J. Guid. Control Dyn. 2009, 32, 1232–1245. [Google Scholar] [CrossRef]
- Stengel, R.F. Flight Dynamics; Princeton University Press: Princeton, NJ, USA, 2004. [Google Scholar]
- Beard, R.W.; McLain, T. Small Unmanned Aircraft; Princeton University Press: Princeton, NJ, USA, 2012. [Google Scholar]
- US Air Force. Military Specification: Flying Qualities of Piloted Airplanes MIL-F-8785C; Technical Report; US Department of Defense: Washington, DC, USA, 1980.
- National Oceanic and Atmospheric Administration. Available online: http://graphical.weather.gov/sectors/ (accessed on 17 October 2017).
- Harmat, A.; Sharf, I.; Trentini, M. A hybrid particle/grid wind model for realtime small UAV flight simulation. In Proceedings of the International Conference on Intelligent Robots and Systems, Vilamoura, Portugal, 7–12 October 2012; pp. 3780–3785. [Google Scholar]
- Recoskie, S.; Fahim, A.; Gueaieb, W.; Lanteigne, E. Hybrid power plant design for a long-range dirigible UAV. IEEE/ASME Trans. Mechatron. 2013, 19, 606–614. [Google Scholar] [CrossRef]
- Recoskie, S.; Fahim, A.; Gueaieb, W.; Lanteigne, E. Experimental testing of a hybrid power plant for a dirigible UAV. J. Intell. Robot. Syst. 2013, 69, 69–81. [Google Scholar] [CrossRef]
- Recoskie, S. Autonomous Hybrid Powered Long Ranged Airship for Surveillance and Guidance. Ph.D. Thesis, University of Ottawa, Ottawa, ON, Canada, 2014. [Google Scholar]
- Soulignac, M.; Taillibert, P.; Rueher, M. Adapting the wavefront expansion in presence of strong currents. In Proceedings of the IEEE International Conference on Robotics and Automation, Pasadena, CA, USA, 19–23 May 2008; pp. 1352–1358. [Google Scholar]
- Ferguson, D.; Likhachev, M.; Stentz, T. A guide to heuristic-based path planning. In Proceedings of the International Workshop on Planning under Uncertainty for Autonomous Systems, International Conference on Automated Planning and Scheduling, Monterey, CA, USA, 5–10 June 2005; pp. 1–10. [Google Scholar]
- Behnke, S. Local multiresolution path planning. In RoboCup 2003: Robot Soccer World Cup VII; Polani, D., Browning, B., Bonarini, A., Yoshida, K., Eds.; Springer Berlin Heidelberg: Berlin, Heidelberg, 2004; pp. 332–343. [Google Scholar]
- Likhachev, M.; Ferguson, D. Planning long dynamically feasible maneuvers for autonomous vehicles. Int. J. Robot. Res. 2009, 28, 933–945. [Google Scholar] [CrossRef]
- Cocaud, C. Autonomous Tasks Allocation and Path Generation of UAVs. Master’s Thesis, Ottawa-Carleton Institute for Mechanical and Aerospace Engineering, University of Ottawa, Ottawa, ON, Canada, 2006. [Google Scholar]
- Demiryurek, U.; Banaei-Kashani, F.; Shahabi, C. A case for time-dependent shortest path computation in spatial networks. In Proceedings of the International Conference on Advances in Geographic Information Systems, San Jose, CA, USA, 2–5 November 2010; pp. 474–477. [Google Scholar]
- Wellman, M.P.; Ford, M.; Larson, K. Path planning under time-dependent uncertainty. In Proceedings of the Conference on Uncertainty in Artificial Intelligence, Montreal, QC, Canada, 18–20 August 2013; pp. 532–539. [Google Scholar]
- Khoury, G.A.; Gillett, J.D. Airship Technology; Cambridge University Press: Cambridge, UK, 1999. [Google Scholar]
- Hoerner, S.F. Fluid Dynamic Drag; Hoerner Fluid Dynamics: Vancouver, WA, Canada, 1993. [Google Scholar]
- Jones, S.P.; DeLaurier, J.D. Aerodynamic estimation techniques for aerostats and airships. In Proceedings of the AIAA Lighter-than-Air Systems Conference, Annapolis, MD, USA, 8–10 July 1981; pp. 120–126. [Google Scholar]
- Lavalle, S.M. Planning Algorithms; Cambridge University Press: Cambridge, UK, 2006. [Google Scholar]
- Canadian Council on Geomatics. Available online: http://www.geobase.ca/ (accessed on 17 October 2017).
- Garcia, A.; Torres, J.L.; Prieto, E.; De Francisco, A. Fitting wind speed distributions: A case study. Sol. Energy 1998, 62, 139–144. [Google Scholar] [CrossRef]
- Environment Canada. Wind Speed over the Last Year (Monthly Data) for Vancouver. Available online: http://vancouver.weatherstats.ca/ (accessed on 17 October 2017).
- Moore, G.; Paine, R.; Lopes, A. Practical uses of the windstation computational fluid dynamics (CFD) model in air quality dispersion studies. In Proceedings of the Guideline on air quality models; Guideline on Air Quality Models 2013 the Path Forward, Raleigh, NC, USA, 19–21 March 2013; pp. 1053–1079. [Google Scholar]
© 2017 by the authors. Licensee MDPI, Basel, Switzerland. This article is an open access article distributed under the terms and conditions of the Creative Commons Attribution (CC BY) license (http://creativecommons.org/licenses/by/4.0/).