Article

Automated Remote Insect Surveillance at a Global Scale and the Internet of Things

by
Ilyas Potamitis
1,*,
Panagiotis Eliopoulos
2 and
Iraklis Rigakis
3
1
Department of Music Technology & Acoustics, Technological Educational Institute of Crete, E. Daskalaki Perivolia, 74100 Rethymno Crete, Greece
2
Department of Agricultural Technologists, Technological Educational Institute of Thessaly, 41110 Larissa, Greece
3
Department of Electronics, Technological Educational Institute of Crete, Romanou 3—Chalepa, 73133 Chania, Greece
*
Author to whom correspondence should be addressed.
Robotics 2017, 6(3), 19; https://doi.org/10.3390/robotics6030019
Submission received: 26 May 2017 / Revised: 11 August 2017 / Accepted: 21 August 2017 / Published: 22 August 2017
(This article belongs to the Special Issue Agriculture Robotics)

Abstract

:
The concept of remote insect surveillance at large spatial scales for many serious insect pests of agricultural and medical importance has been introduced in a series of our papers. We augment typical, low-cost plastic traps for many insect pests with the necessary optoelectronic sensors to guard the entrance of the trap to detect, time-stamp, GPS tag, and—in relevant cases—identify the species of the incoming insect from their wingbeat. For every important crop pest, there are monitoring protocols to be followed to decide when to initiate a treatment procedure before a serious infestation occurs. Monitoring protocols are mainly based on specifically designed insect traps. Traditional insect monitoring suffers in that the scope of such monitoring: is curtailed by its cost, requires intensive labor, is time consuming, and an expert is often needed for sufficient accuracy which can sometimes raise safety issues for humans. These disadvantages reduce the extent to which manual insect monitoring is applied and therefore its accuracy, which finally results in significant crop loss due to damage caused by pests. With the term ‘surveillance’ we intend to push the monitoring idea to unprecedented levels of information extraction regarding the presence, time-stamping detection events, species identification, and population density of targeted insect pests. Insect counts, as well as environmental parameters that correlate with insects’ population development, are wirelessly transmitted to the central monitoring agency in real time and are visualized and streamed to statistical methods to assist enforcement of security control to insect pests. In this work, we emphasize how the traps can be self-organized in networks that collectively report data at local, regional, country, continental, and global scales using the emerging technology of the Internet of Things (IoT). This research is necessarily interdisciplinary and falls at the intersection of entomology, optoelectronic engineering, data-science, and crop science and encompasses the design and implementation of low-cost, low-power technology to help reduce the extent of quantitative and qualitative crop losses by many of the most significant agricultural pests. We argue that smart traps communicating through IoT to report in real-time the level of the pest population from the field straight to a human controlled agency can, in the very near future, have a profound impact on the decision-making process in crop protection and will be disruptive of existing manual practices. In the present study, three cases are investigated: monitoring Rhynchophorus ferrugineus (Olivier) (Coleoptera: Curculionidae) using (a) Picusan and (b) Lindgren trap; and (c) monitoring various stored grain beetle pests using the stored-grain pitfall trap. Our approach is very accurate, reaching 98–99% accuracy on automatic counts compared with real detected numbers of insects in each type of trap.

1. Introduction

Given the urgency to increase world food production to satisfy the needs of an increasing population, it is vital that we assist farmers to make decisions to mitigate high rates of crop loss due to insect pests and thus implicitly increase food production. Crop losses due to insect pests can be substantial and may be prevented, or reduced, by crop protection measures [1,2]. Farmers rarely have the quality of information needed to make timely decisions about insecticidal treatments. We attribute this to the fact that farmers’ knowledge on when and where the infestation initially occurred and how effective the treatment was, is based on manual inspection of monitoring traps deployed on a limited spatial and temporal scale. Scouters performing visual identification and counting of insect species are not always confident experts making reliable identifications and the protocols they follow often result in compromises. Manual inspection of traps shows considerable heterogeneity in geographic and temporal coverage. Since inspection of insect traps, is concentrated in a few sites, this highly aggregated distribution of information, limits our ability to understand the large-scale dynamic of insect distribution and to benefit from its knowledge.
From both a conceptual and management perspective, there is an urgent need to increase the information flow over a large area and through time from the field-traps straight to a central monitoring agency, as well as to visualize and summarize this flow in a statistically reliable sense. To this end, we develop technologies to improve, expand and automate global monitoring of insects of economic importance to thousands of nodes around the world.
Innovative use of sensors and networks targeting animals are starting to be translated into new ecological knowledge [3,4]. Automatic monitoring of biodiversity [5,6] mainly in the form of automated species identification of vocalizations of birds [7], bats [8], insects [9,10], whales [11] and amphibians [12] is a developing trend in ecology. This knowledge, however, is still fragmented and isolated to small scale paradigms that neither communicate nor are integrated with a universal view of biodiversity monitoring.
In our vision, a trap is a ‘thing’ in the context of the IoT, i.e., a typical plastic trap augmented with a sensor that records the insect’s presence upon its entrance in the trap and with wireless communication capability to broadcast the sensed data. These individual entities are single nodes that can possibly interact with other nodes to establish their own network or they can report straight to the conventional internet highway through the ubiquitous mobile phone coverage (i.e., through the GPRS functionality). We are currently investigating a multitude of sensors to detect the insects’ presence in a distributed fashion and in a cost- and power-effective way. As an example of distributed monitoring, in the stored-grain pitfall case several traps are placed in the silo. These e-pitfall traps exchange information and collectively report insect counts to the management service of the silo. Several ways have already been identified to detect insects’ presence:
(a)
photo-interruption of either entering or falling insects in several types of traps (e.g., Red-palm weevil traps, pitfall traps, funnel traps). Photo-interruption is also used in electronic gates installed in beehives. A low power emitter of infrared light and a coupled photodiode form a sheet of light covering the entrance of the trap. The flow of light is interrupted from an insect entering and thus it is counted,
(b)
Analysis of the wingbeat of insects flying in traps (as in McPhail type and mosquito traps). The flow of light is modulated by the wingbeat of the insect flying-in. The wingbeat is recorded and constitutes a biometric signature of a specific species [9,13],
(c)
Picking up their vibrations due to locomotion and feeding (chewing) in grains (only for stored grain pests [10,14,15]).
Traps equipped with a detection sensor and wireless communication abilities have some distinct advantages compared to manual monitoring. They can monitor insect populations 24 h a day, upon their entrance to the trap, every day of the year, in dispersed nodes across a variety of fields, simultaneously, and all counts and recordings can be permanently stored in a cloud service. Another distinct advantage is the determination of the precise onset of an infestation. The time-schedule of trips to the field for trap inspection may not coincide with the initiation of a pest population increase, whereas automatic monitoring and reporting can be set in real-time (or more practically in a daily schedule). Real-time reporting, in our opinion, opens up new grounds in agricultural research and mainly in crop protection as—besides a timely control action in response to a pest infestation—it can help in the evaluation of the impact of a control treatment (e.g., chemical spraying, release of beneficial entomophagous insects etc.), and therefore schedule future actions accordingly.
The electronic traps can naturally include a time stamp of each insect incident and the information provided by the e-traps formulates new services: to carry out studies that cannot be practically performed manually, as explained hereinafter: There have been numerous studies demonstrating the periodicity of trap captures [16,17,18,19,20,21]. Some insect species appear to respond to pheromone during daylight while others are active during the night because of complicated mechanisms of insect physiology and reproduction [22,23]. A record including the trap location, time, date, temperature and humidity each time an insect enters the trap, would provide a significant amount of data that would help us understand better the chemical ecology of a pest. It is very difficult to run these studies with direct observation and they are not replicated through time or across sites to any great extent because of the manpower requirement.
Another advantage of automated insect surveillance is that long-term population and distribution data for insect species of interest can be logged. The logging of adequate historical data can help us to understand the population dynamics of the pest and use predictive models to estimate statistically meaningful risks of an infestation, its evolution and the possibility of future outbreaks. Finally, communication on a global scale can bring researchers to work together across large distances on the same pest by navigating themselves through the IoT to distant traps or receiving data summaries across all sensors in the network. Infestation data at global scales can be exploited by commercial and colonial interests to forecast prices in crop production.
The reported literature on electronic insect traps that employ optical sensors is sparse. In Hendricks [20,24] the first integrated synergy of a trap with electronic elements is reported with a view of transferring recorded data to a computer. The approach is interesting given the means of that time. In [25,26], the authors presented a stand-alone device that would count and transmit counts from the field of a very destructive fruit pest, the oriental fruit fly, Bactrocera dorsalis (Hendel) (Diptera: Tephritidae).
Our approach aims at reducing the necessity of human-in-the loop in any intermediate processing stage of the workflow and reserves the need of expert entomologists only for the highest abstraction layer: the interpretation of the data received (trap catches) normally presented in the form of georeferenced maps and the corresponding decision making and action planning based on pest Economic Injury Levels (EIL) population thresholds that are applied in the frames of Integrated Pest Management (IPM). Our work focuses on leveraging the quality of service of remote surveillance of pest populations to a better and cost-effective status than sparsely applied human inspection.

2. Materials and Methods

We have embedded our electronics in traps monitoring the population of insect pests of olive, cotton, grapes, fruit trees, stored cereals and pulses, pine trees, and palm plantations. Mosquitoes and beehives are a category of their own that have also been integrated within our framework. Our approach is not constrained to a specific brand or type of trap. However, we need types of traps that protect to a certain extent the exposure of the electronics and have a shape that allows the insects to pass through a funnel entrance so that they constrain their movement pattern to be counted and/or recorded. In this work, we provide field results for three traps: The Picusan (SANSAN Prodecing SL, Valencia, Spain), the Stored-grain pitfall (EDIALUX, Bornem, Belgium), and the Lindgren (Forestry Distributing, Inc., Boulder, CO, USA) type, as the evaluation of traps in the field is a laborious process. In time, results of all common trap types will be presented in detail.
The philosophy in all trap types is common: There is always an emitter of light opposite to a receiver of light and the path of the incoming insect stands in between. The interruption of the path of light effects a voltage drop that exceeds a threshold and constitutes a count. The technology that does not analyze wingbeat (e.g., as in the case of fruit flies and mosquitoes) is simpler than the one that senses only the presence of insects. All three traps presented in this study sense the presence of an incoming insect. Both receiving and emitting elements are deployed as 1D linear arrays that are long enough to cover the entrance to the trap. There are small variations among these three different traps mainly due to the size of the insects and the peculiarities of the trap (see Table 1). Picusan is custom made for R. ferrugineus that is a relatively large insect whereas the stored-grain pitfall trap needs to count insects possibly smaller than 1 mm. In the Picusan and Lindgren traps the light field is composed of five parallel light-beams (5 LEDs with a small emitting angle of ±10 degrees) opposite to five photodiodes connected in row. Therefore, if there is an interruption of light in any of the five beams no light passes through the photodiodes and the insect is detected by comparing the voltage to a threshold. The distance of one beam from the consecutive one is 7 mm. Therefore, it detects insects larger than 6 mm. In the stored-grain pitfall case, an insect can enter from any hole of the lid. To avoid blind spots in the field of view we need to have uniform field sensing insect sizes ≤0.5 mm. We used 16 LEDs and the same number of photodiodes and both emitter and receiver have a light diffuser. All sensors are operated in pulse mode i.e., there is no constant flow of light from emitter to receiver but a pulse train is emitted. This is the key element to a long-lasting operation and this is analyzed in detail in [9].
In Figure 1 we envisage how insect surveillance can be applied at local, regional, country, continental, and global scales using the emerging technology of IoT. Local networks become themselves nodes in larger networks until reaching global coverage.
The detected events due to photo-interruption need to be combined with the use of species specific pheromone attractants. This is because photo-interruption senses the presence of the insect during its entrance to the trap but is blind to species identity. Therefore, we must ensure that in the clear majority of cases the insect is attracted by a species-specific pheromone. The actual power sufficiency of these traps is three months expandable to 12 months with additional batteries. Although the human presence is again vital to replace pheromone lures it is possible to greatly reduce the visiting frequency at least to a bimonthly basis and simplify the attendance work during trap check. On the other hand, devices equipped with sensors that can analyze the wingbeat, besides sex-pheromones, can use food baits as well, as the wingbeat is a biometric information that can be used as evidence to identify species in an automated fashion.

2.1. Trap Type #1: The Picusan Trap

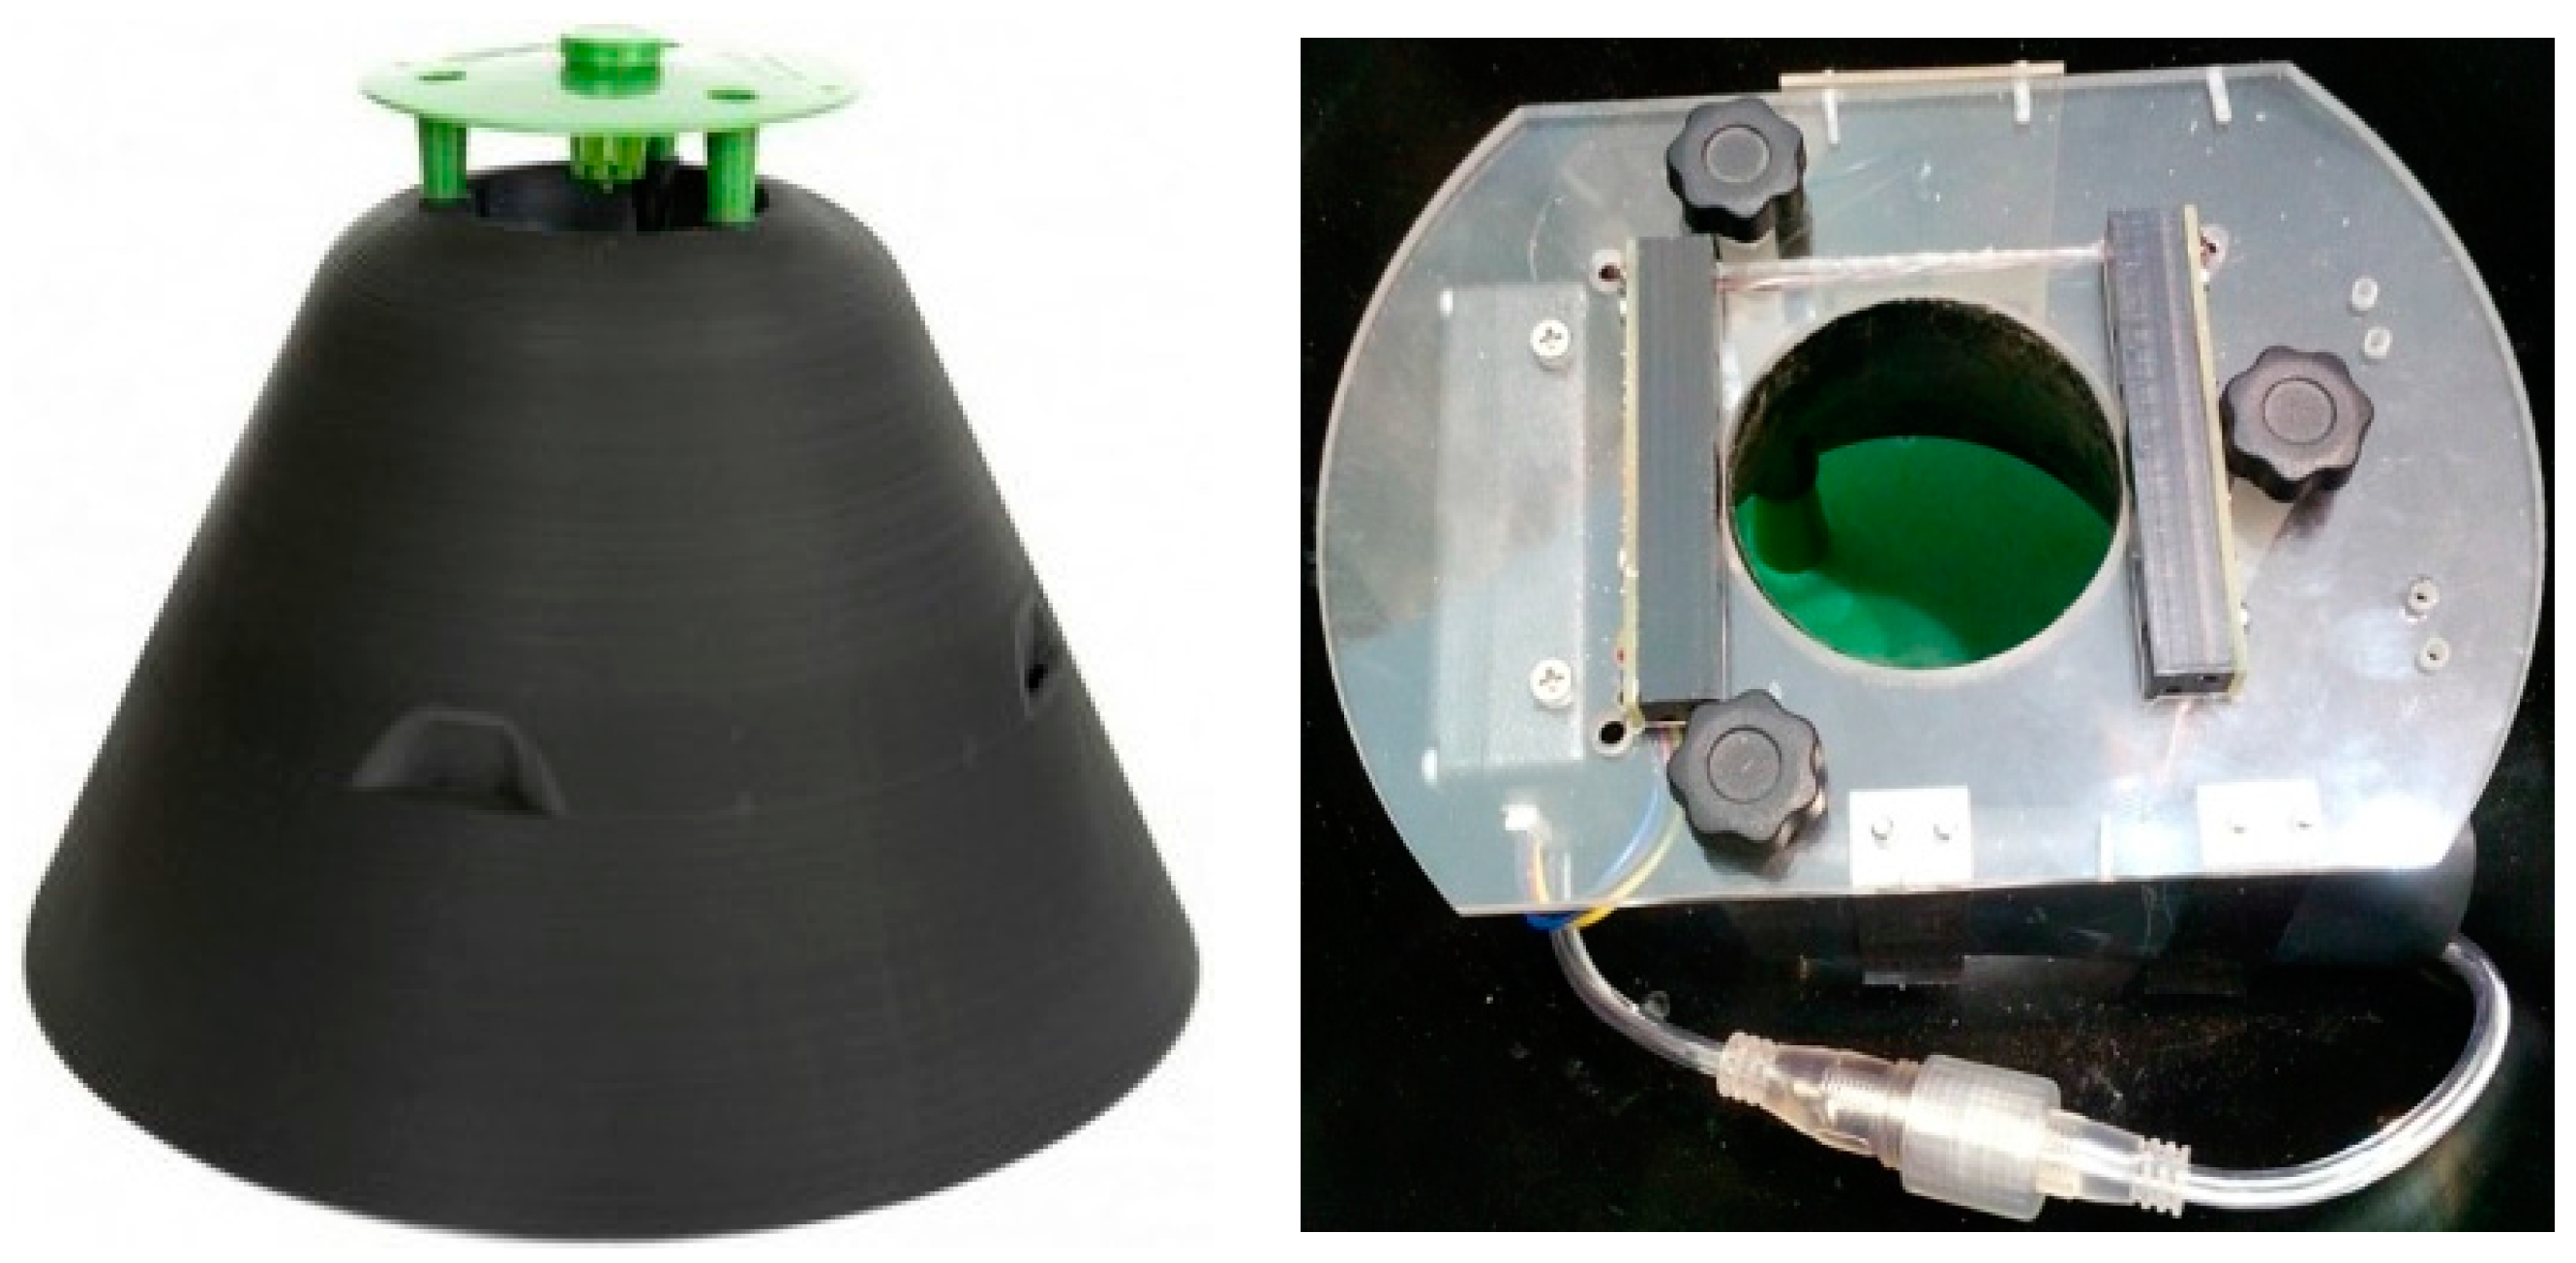
The red palm weevil, Rhynchophorus ferrugineus (Olivier) (Coleoptera: Curculionidae) is the most dangerous and devastating pest of the date palm as it can weaken and eventually kill the tree [27]. Given the importance of the red palm weevil, efforts are being made to develop new monitoring tools, such as the deployment of a new black pyramidal trap design (Picusan trap Figure 2) [28]. Traps of this type, containing aggregation pheromones of R. ferrugineus are modified to include an optical sensor that senses adult pests falling into the trap. Counts, as well as other environmental parameters are transmitted straight to the internet through GPRS. The aggregation pheromone 4-methyl-5-nonanol or ferrugineol with ethyl acetate, was mixed with a combination of food lures specialized to attract R. ferrugineus, capturing adults of both sexes [28]. Though it did not occur in our experiments, it is known that another species very similar to R. ferrugineus, the sisal weevil Scyphophorus acupunctatus (Gyllenhal) (Coleoptera: Curculionidae) may be attracted to the specific pheromone and enter into the trap [29]. This insect is an important pest of agave, yucca, and various other plants of the families Agavaceae and Dracenaceae [30]. In such a case, the trap would not discern the entrance of S. acupunctatus against R. ferrugineus. In case of palms absence in the monitored area, the same smart trap configuration can be used for S. acupunctatus.

2.2. Trap Type #2: The Stored-Grain Pitfall Trap

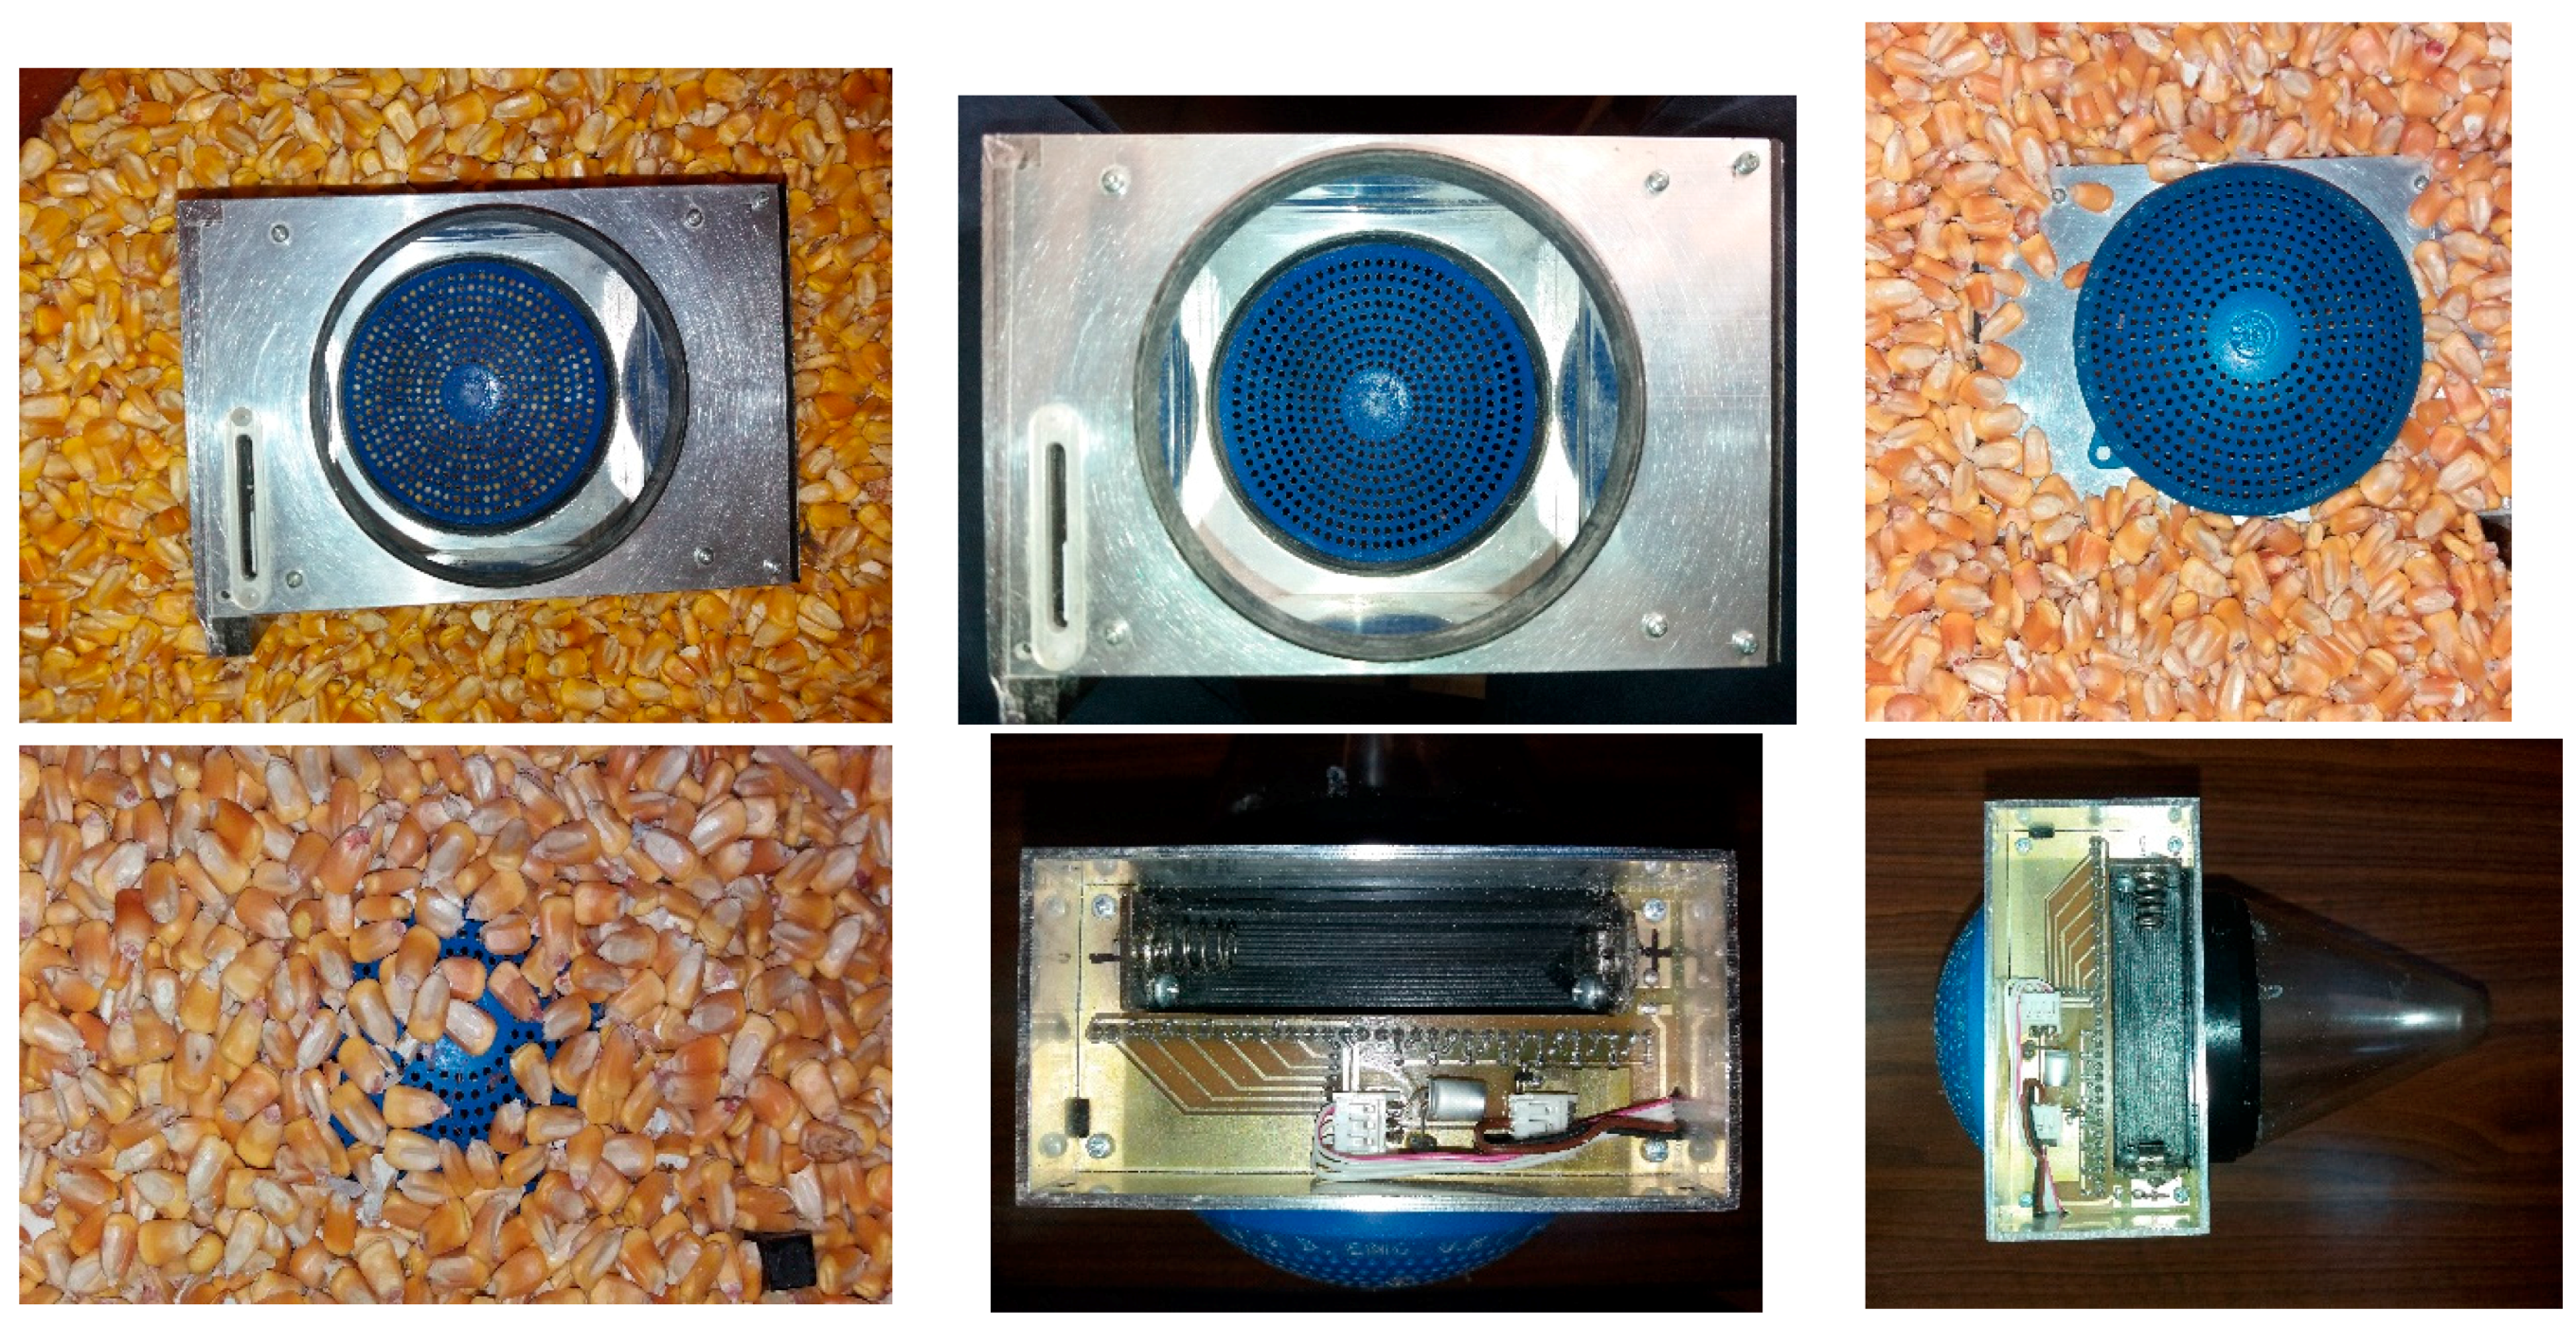
Stored-grain pitfall traps are typically used for monitoring several species of stored-grain beetles (Coleoptera) in silos, warehouses and processing plants [31]. They are placed inside the bulk grain near the surface (Figure 3). The cone-shaped device is made of clear plastic and has a removable perforated lid, which allows insects to enter, but not escape. As in the case of the funnel trap, various pheromone lures targeting different species may be used.
Many destructive beetle pests of stored grain may be monitored by this type of trap: the flour beetles Tribolium spp. (Tenebrionidae), the grain weevils Sitophilus sp. (Curculionidae), the lesser grain borer Rhyzopertha dominica (F.) (Bostrichidae), the cigarette beetle Lasioderma serricorne (F.) (Anobiidae), and the khapra beetle Trogoderma granarium Everts (Dermestidae) [32,33,34,35].
For the purposes of our study, a prototype equipped with a linear array of five Light Emitting Diodes (LED) opposite to five receiving photodiodes was evaluated. The prototype trap was put in a large plastic barrel (120 L) with 80 kg maize. Adult beetles of various species were collected from laboratory rearings and transferred to the experimental barrel. In order to ensure trap catches a large number of adult beetles was used resulting in an infestation level of more than 15 adults per kg maize. Caught beetle adults were checked and counted after 24 h and were compared with the counts from the electronic system.

2.3. Trap Type #3: The Lindgren Trap

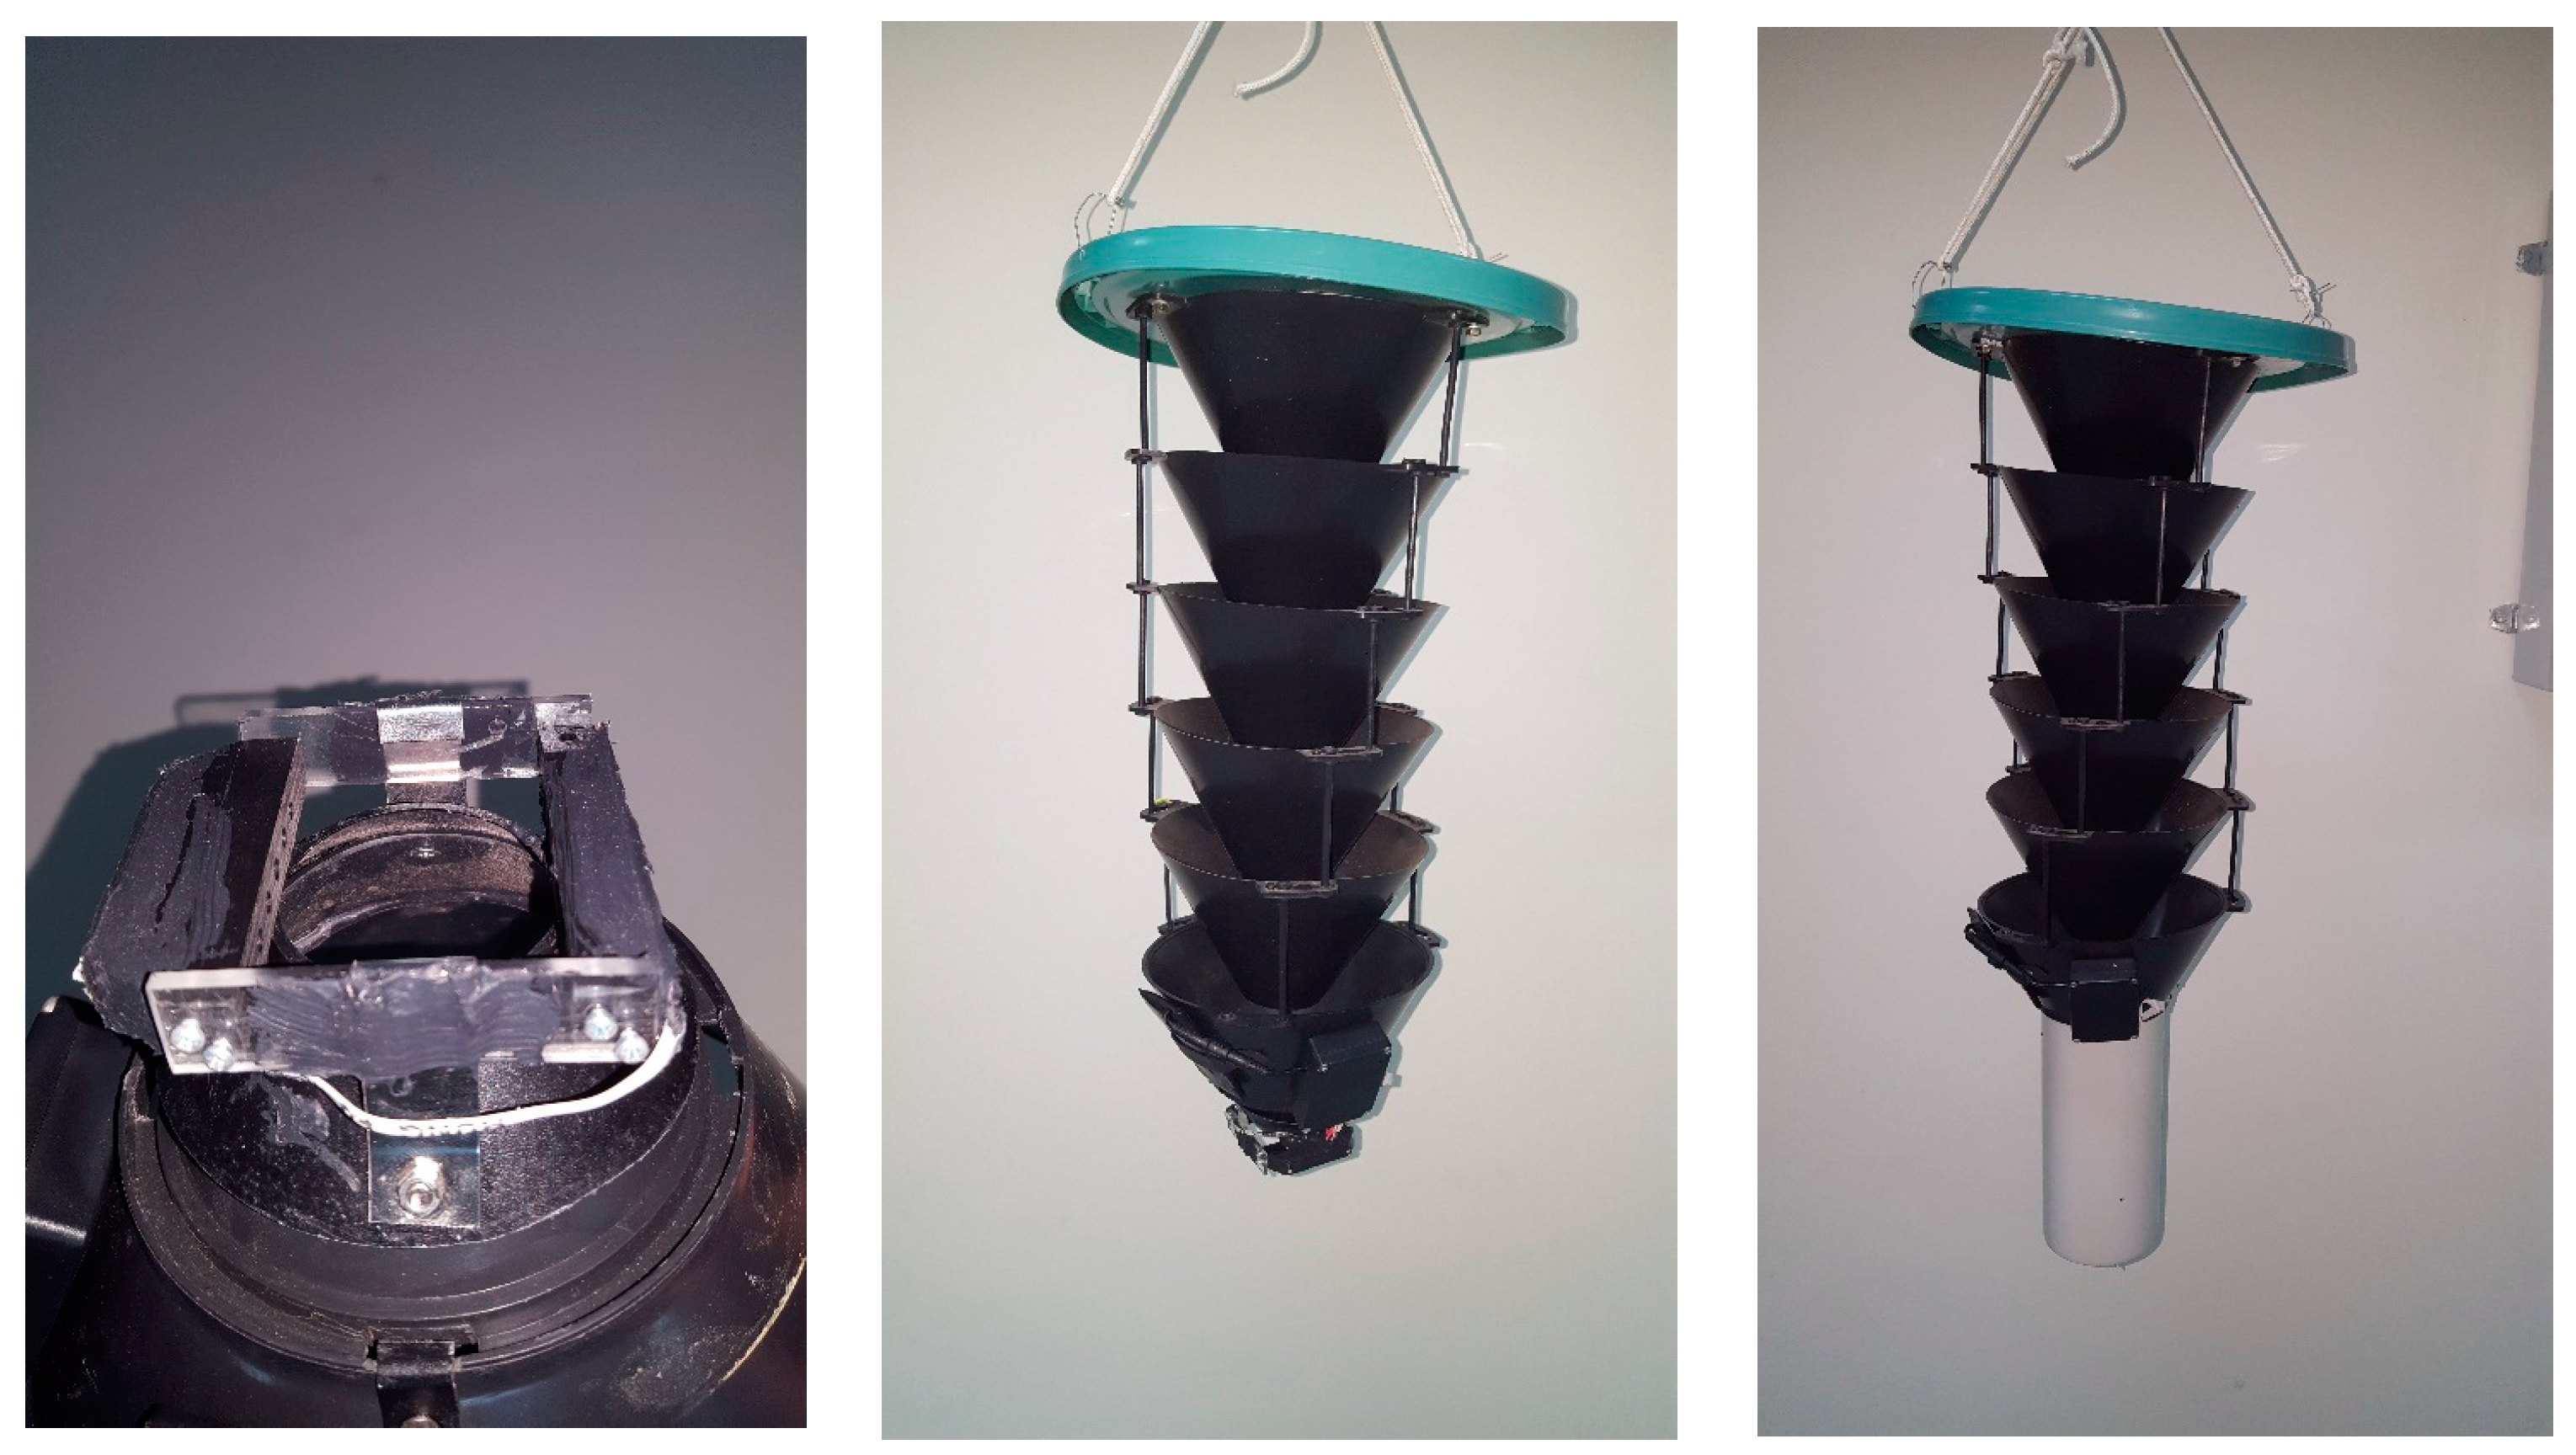
Pine Beetle Lindgren Trap (Figure 4) is a form of a funnel trap. Lindgren pheromone traps are widely used to attract the pine beetle Dendroctonus ponderosae Hopkins (Coleoptera: Curculionidae) [36,37]. They are used either as monitoring traps or for mass trapping to reduce the populations of pine beetles.
They come with different numbers of funnels that form a tree-mimicking silhouette. We have used them successfully to count R. ferrugineus beetles as well. The same attractants were used as with the Picusan trap.

3. Results & Discussion

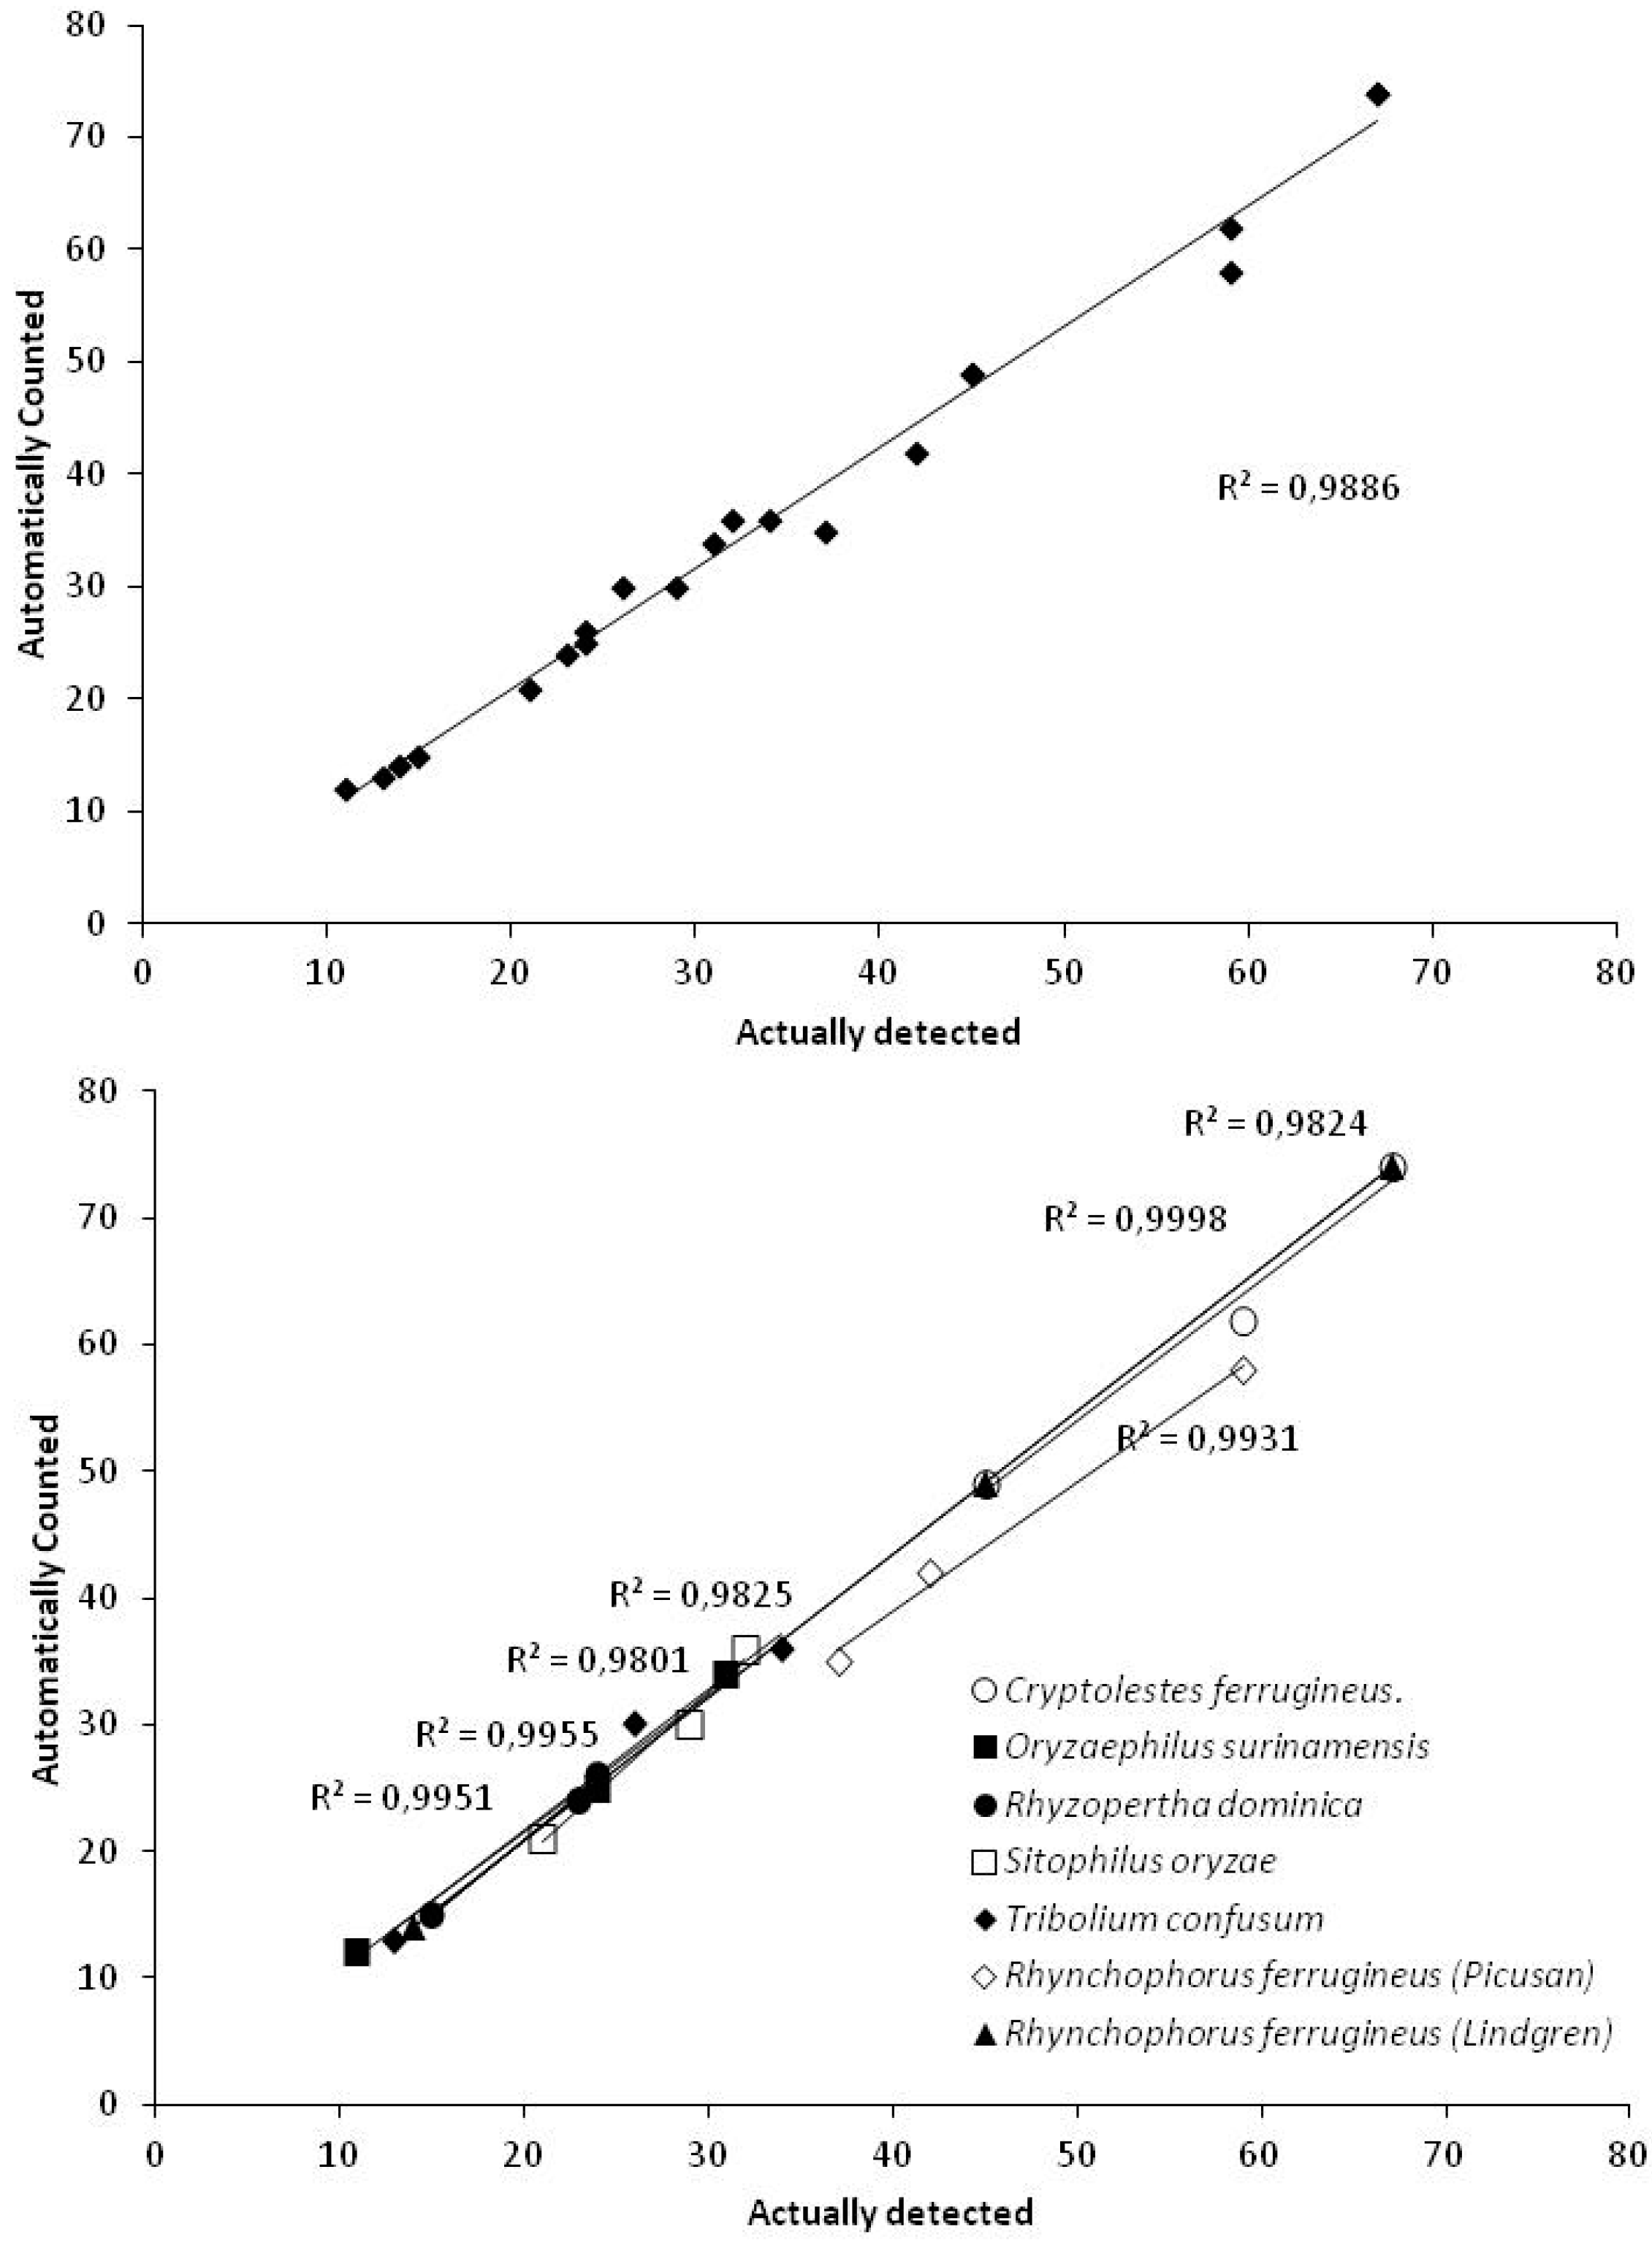
Results from the evaluation of the prototype traps are presented in Table 2 and Figure 5. As is clearly concluded from our data, our system is very accurate, reaching 98–99% accuracy on automatic counts compared with real detected numbers of adult beetles in each trap. The accuracy of our system in detecting adult beetle catches is also shown by the very high (r > 0.99 in all cases) correlation between the generated signals and actual numbers of insects caught in the trap.
Only a few remote pest monitoring systems, based on wireless communication technology, have been evaluated in the past, with varying accuracy. The oriental leafworm moth Spodoptera litura (Fabricius) (Lepidoptera: Noctuidae) was effectively monitored by an ecological monitoring system combining GSM transmission technologies with mechatronics with accuracy ranging from 71% to 100% [38]. Average accuracies of 78.1% [25], 96.3% [39], and 94.9% [40] were demonstrated by automatic monitoring systems counting the catches of the oriental fruit fly B. dorsalis. Other automated systems with image analysis technology also proved to be reliable in detecting mainly whiteflies and moths, with accuracies ranging from 70% to 100% [41,42,43,44,45]. The accuracy of our system is higher than almost all of the abovementioned monitoring systems.

4. Data Processing and the IoT

The IoT has made its appearance in agricultural tasks [46,47,48,49] but is not connected, up to now, directly to the vision of insect monitoring at large spatial scales as this work suggests. Though one may think that the most valuable part of a service based on a network of traps is the trading of the hardware or the software, the priceless product is the transmitted numbers. Granting access to a cloud service visualizing and interpreting data is a business of its own. Data can be used to influence decisions, it can be exchanged, hired or sold and become input in predictive analytics tools whose predictions can lead to new services (e.g., price prediction of food products, prediction for possible pest population outbreaks and crop losses).
The data delivered can be split into three distinct subsets:
(a)
Counts delivered on a pre-scheduled basis along with the time-stamps of each insect entrance to the traps.
(b)
Environmental data (mainly humidity, temperature and GPS tag).
(c)
Wingbeat recordings uploaded to a server (in the case of McPhail and mosquito traps).
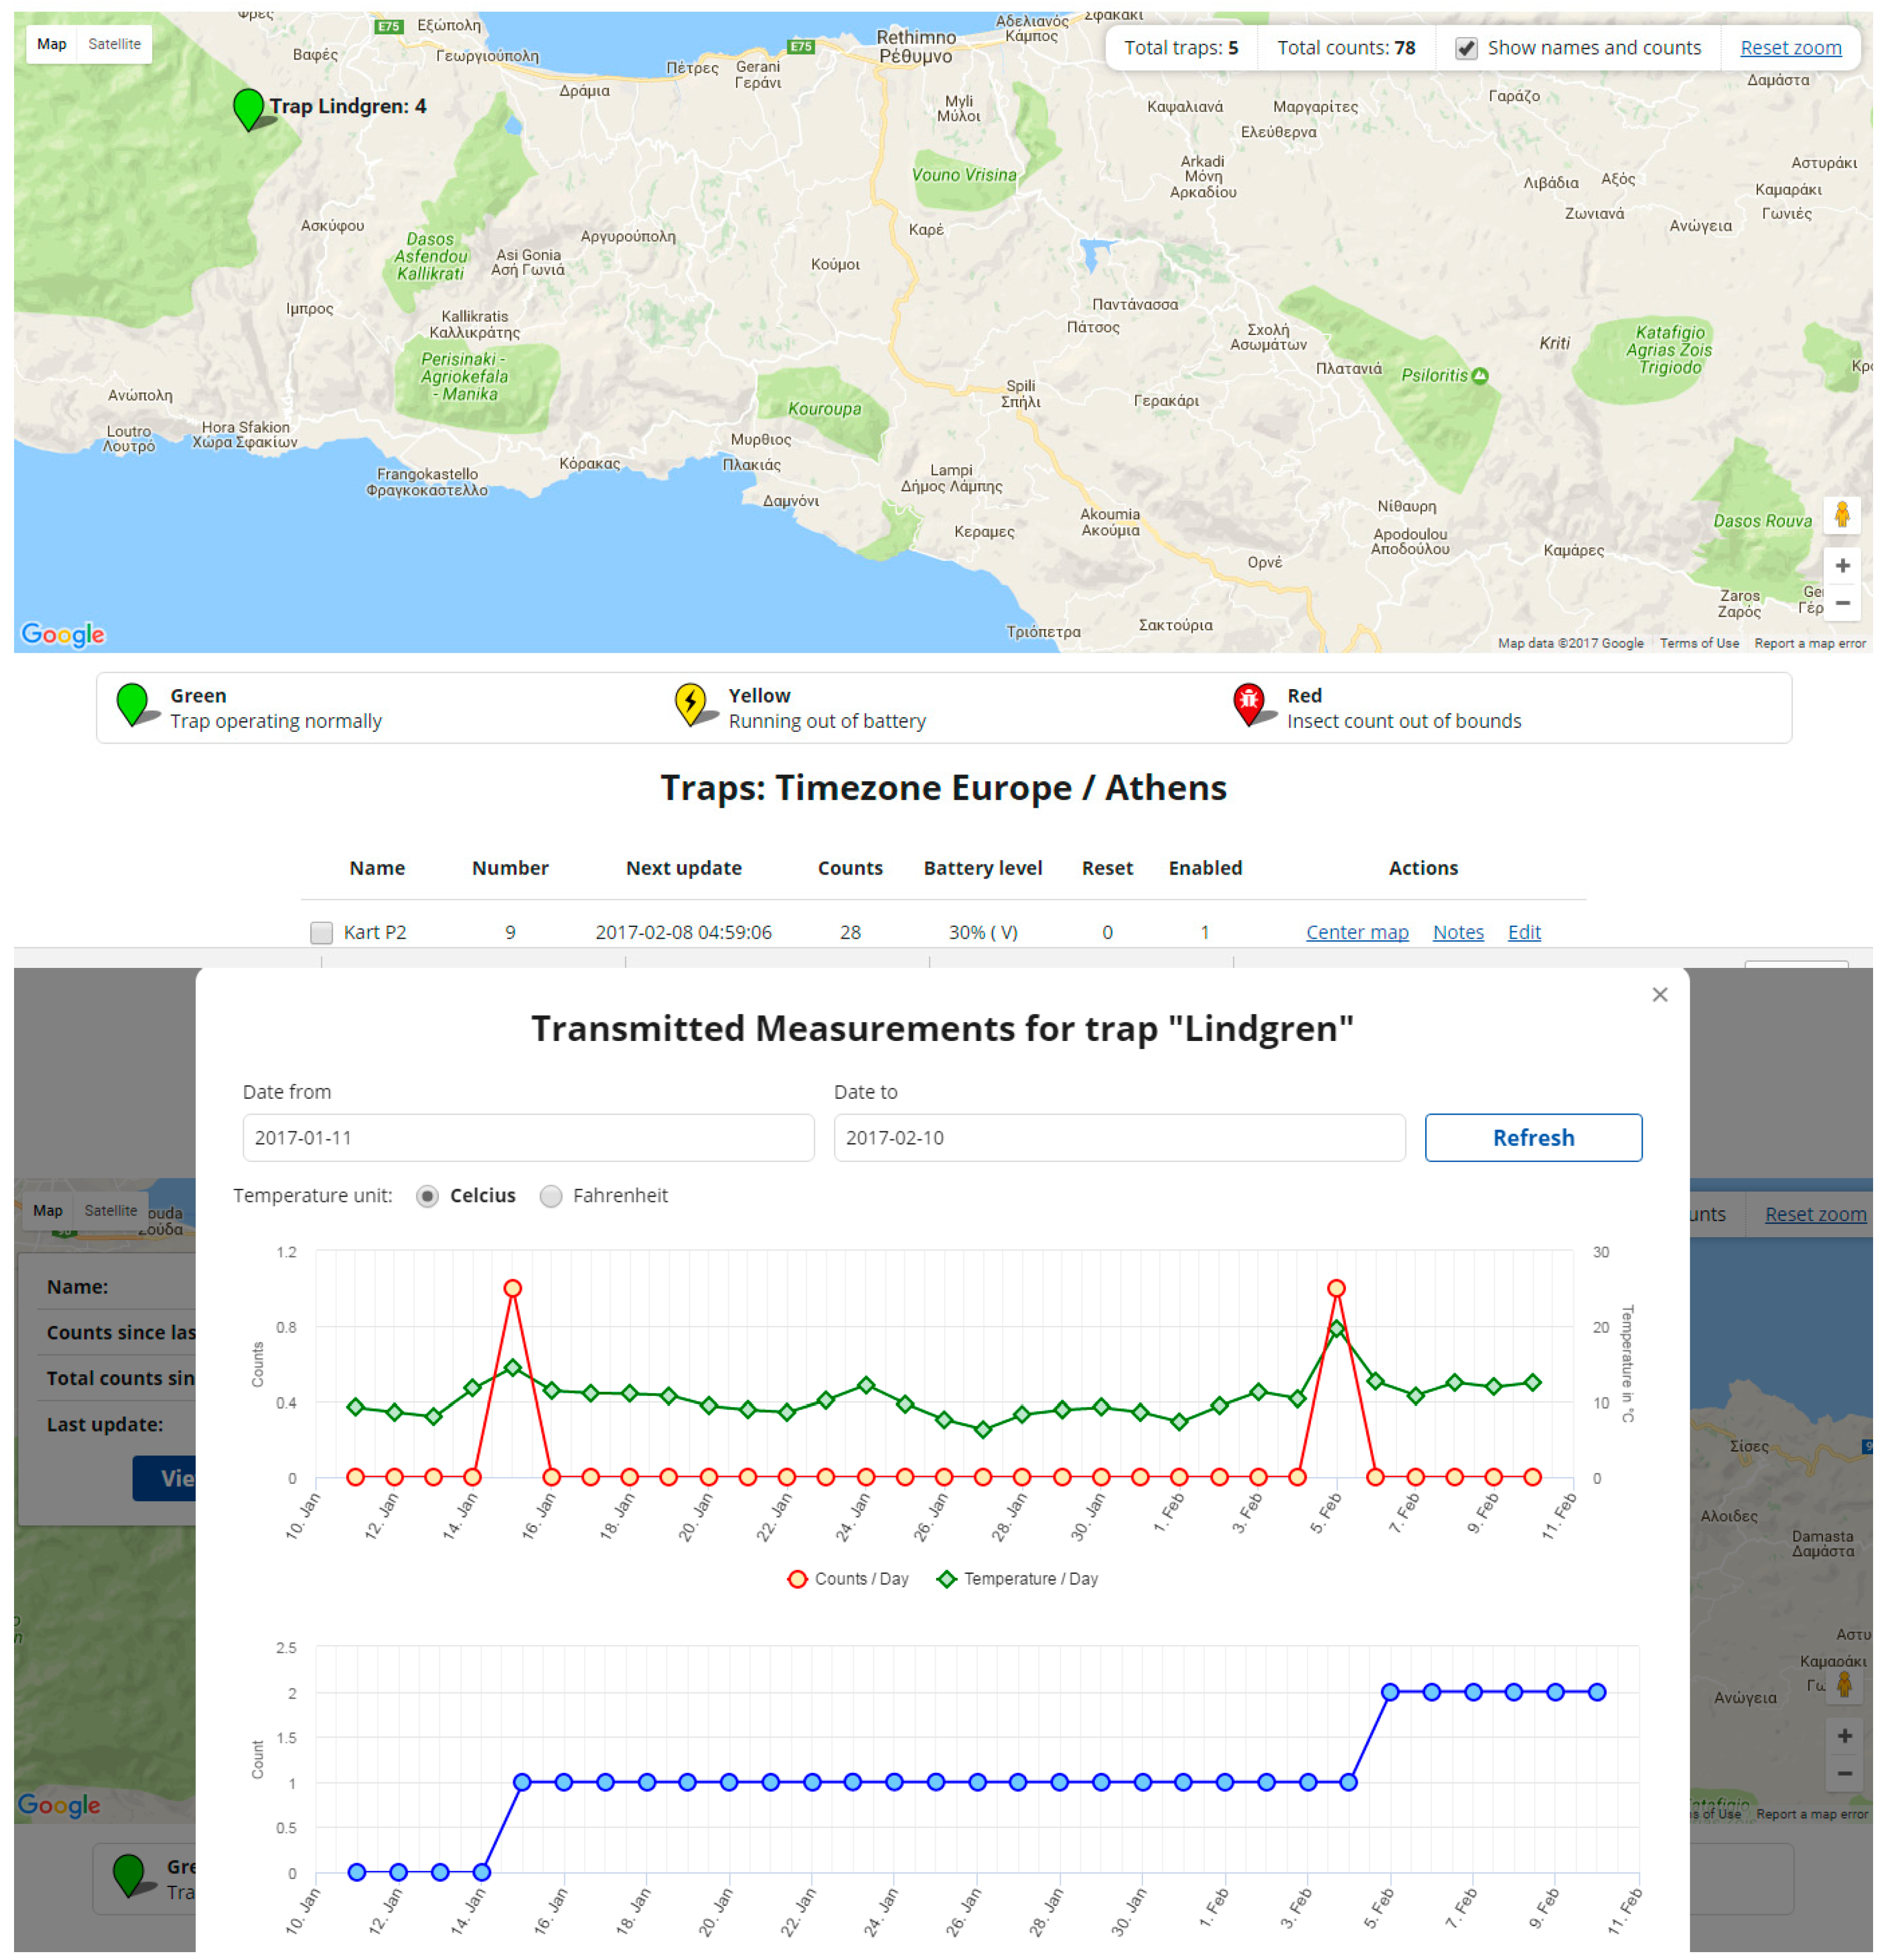
Once the data are collected and delivered to the server there are different levels of data processing abstractions that we can apply. A data-collection interface with inference based data analysis provides the basis for predictive ecological models and mining of events for agricultural management. In Figure 6 we show the visualization interface that can be used for streamlining data collection and management. The following mode of engagement between data representations and the human expert is to set counts on maps and interpolate measurement between nodes to form pest population level maps to assess the current situation and respond timely with a focused localized treatment. Additionally, one can validate causal hypotheses between the timing of treatments and after treatment insect counts. Moreover, the distribution of time stamps can be related to the efficacy of different attractants in the pheromone cycle of insects. Regarding the wingbeat recordings, these become a permanent record in the database and can be subjected to different feature extraction and classification practices to identify the source of the audio data at the species level.
Regarding long term data abstractions, once historical data are piled up over time, they provide the basis for predictive models of infestations and outbreaks of epidemics (e.g., as in the case of mosquitoes).
The GPRS modem of the trap, once connected to the mobile provider, is capable of having internet connectivity. The trap has the domain name of the backend site embedded in its EPROM and, through the GPRS modem and the mobile network that supports GPRS, makes a TCP/IP connection to the webserver of the backend, via an HTTP request, essentially mimicking a web browser (client). At this point, the trap inserts its data as parameters for the page that it wants to access. Once the HTTP request reaches the web server, the latter receives the data from the request of the trap (via the appropriate code, written in PHP) and logs the information in the database.
The web application consists of two parts: The backend that manages the information and the database in the server and a frontend that visualizes the information at the browser of the user and the interface with the user. The site is based on a web hosting provider running Apache, with PHP 5.5 support. The database is setup using MySQL, which is open source. The backend is written in Laravel 5.1 PHP 5.5 and the frontend is written in HTML 5, making use of the Angularjs Javascript and JQuery javascript Framework. The data follow the JSON formalisation. The maps are provided via the Google Maps API.
Technological advances do not always manage to penetrate the routine practice of cultivators. To succeed in altering the habits of decades, we must offer a working solution to the real needs of practitioners. Moreover, the cost of altering standard traps to electronic ones must be low and the cost/benefit trade off due to their use carefully calculated. In order to help assessing this ratio we report that the current production cost of an insect counter as in the Stored-grain pitfall trap is 65 Euros for a single device falling to 40 Euros for 100 traps and 32 Euros for 1000. Regarding Picusan and Lindgren the corresponding costs are 40 Euros falling to 26 and 19 Euros respectively (as per 26 May 2017). The power sufficiency of Picusan/Lindgren trap is 3.5 months with a single 3.7/3000 mAh rechargeable lithium battery and as regards stored-grain pitfall 2.5 months using a 3400 mAh battery. It is an encouraging fact that, long term autonomous deployment is feasible due to low-power electronics and scheduling of operations to minimize power consumption and in the long run the cost of electronics can only drop.
Agricultural entomologists master the knowledge of their field and cannot have the technical expertise of disparate and interdisciplinary knowledge requiring the cooperation of diverse technologies. These technologies include wireless communication networks, security of data, quality control protocols, data processing and management. Therefore, the whole sensor-network setup must be offered by engineers and data scientists to stakeholders as a ‘plug and play’ installation. The collaboration of agricultural entomologists is mainly needed for the species identification of trapped insects, assessing the accuracy of the whole set-up, and translating summarized information to ecological knowledge.
Trained practitioners and qualified experts return high quality data but are not easily available to attain field-data from traps. Even when some kind of a sensing modality is available, they are often unwilling to spend their time and expertise to carry out detrimental tasks such as inspecting endless information queues (e.g., microphone recordings or pictures from cameras). Unattended remote surveillance solves the problem of collecting sparse manual data and overcomes scalability limitations, but produces large quantities of data that can prove of limited use if not sorted out and summarized automatically. In this section, we clarify what information we can obtain from a collection of distributed trap nodes and if the visualization and aggregated indices of such data suffice to augment policy decisions.
In this work, we establish a connection between sensors’ readings, pest population level, and predictive models to ensure timely and effective control treatments. Acceptance of automated monitoring practices will raise doubts about the reliability of data collected without an expert’s intervention. The optoelectronics need to reduce their errors (i.e., false alarms and misses) to reach comparable analysis to that done by experts. A long-term field operation is needed to identify the cause of possible false alarms, detection misses, and sensor failures in sometimes harsh conditions before applying the output of such data-collection schemes to modeling and policy. To give a lucid example, we discovered a source of false alarms in the Picusan trap after a rainstorm where some raindrops entered through the top entrance of the trap. This was not observed during the operation of a trap from spring to fall and was observed only during winter time. This problem was easily solved by modifying the top of the trap, but was only solved because of the long-term deployment that indicated a problem. Our perspective is that the potential for big data collected from the collaboration of nodes at large spatial scales can overcome random local errors and this combined with their streaming to data visualization tools is sufficient to grant an advantage over the current manual practices. We believe current results are sufficient to warrant further exploration on insect surveillance. Insect surveillance can provide insight into the effects of insecticide efficiency, reduce their use and shape our understanding of pest problems in agriculture. Provided we continue improving the reliability of devices and services and perform real-field, long-term trials, we can upgrade automated practices to the level of being indispensable to farmers, policy makers and stakeholders.

Acknowledgment

We used Picusan traps from Sansan®, stored-grain pitfall traps from EDIALUX Belgium and Lindgren from Forestry Distributing, Inc. This research was partially funded from the European Union’s FP7 Program managed by REA—Research Executive Agency (http://ec.europa.eu/research/rea) under grant agreement No. 605073 project ENTOMATIC.

Author Contributions

I.P. and P.E. conceived and designed the experiments; P.E. performed the experiments; I.R. and I.P. analyzed the data; I.R. contributed material and hardware tools; I.P. and P.E., wrote the paper.

Conflicts of Interest

The authors declare no conflict of interest.

References

  1. Oerke, E.-C. Crop losses to pests. J. Agric. Sci. 2006, 144, 31–43. [Google Scholar] [CrossRef]
  2. Oerke, E.C.; Dehne, H.W.; Schönbeck, F.; Weber, A. Crop Production and Crop Protection: Estimated Losses in Major Food and Cash Crops; Elsevier: Amsterdam, The Netherlands, 2012. [Google Scholar]
  3. Porter, J.H.; Nagy, E.; Kratz, T.K.; Hanson, P. New eyes on the world: Advanced sensors for ecology. BioScience 2009, 59, 385–397. [Google Scholar] [CrossRef]
  4. Chen, C.-P.; Chuang, C.-L.; Jiang, J.-A. Ecological Monitoring Using Wireless Sensor Networks—Overview, Challenges, and Opportunities. In Smart Sensors, Measurement and Instrumentation; Book Section in Advancement in Sensing Technology, V. 1; Mukhopadhyay, S.C., Jayasundera, K.P., Eds.; Springer: Berlin/Heidelberg, Germany, 2013; pp. 1–21. [Google Scholar]
  5. Aide, T.M.; Corrada-Bravo, C.; Campos-Cerqueira, M.; Milan, C.; Vega, G.; Alvarez, R. Real-time bioacoustics monitoring and automated species identification. PeerJ 2013, 1, e103. [Google Scholar] [CrossRef] [PubMed]
  6. Chesmore, D. Automated bioacoustic identification of species. An. Acad. Bras. Ciênc. 2004, 76, 436–440. [Google Scholar] [CrossRef] [PubMed]
  7. Potamitis, I. Automatic Classification of a Taxon-Rich Community Recorded in the Wild. PLoS ONE 2014, 9, e96936. [Google Scholar] [CrossRef] [PubMed]
  8. Walters, C.L.; Freeman, R.; Collen, A.; Dietz, C.; Fenton, M.B.; Jones, G.; Obrist, M.K.; Puechmaille, S.J.; Sattler, T.; Siemers, B.M.; et al. A continental-scale tool for acoustic identification of European bats. J. Appl. Ecol. 2012, 49, 1064–1074. [Google Scholar] [CrossRef]
  9. Potamitis, I.; Rigakis, I.; Tatlas, N.-A. Automated Surveillance of Fruit Flies. Sensors 2017, 17, 110. [Google Scholar] [CrossRef] [PubMed]
  10. Potamitis, I.; Ganchev, T.; Kontodimas, D. On Automatic Bioacoustic Detection of Pests: The Cases of Rhynchophorus ferrugineus and Sitophilus oryzae. J. Econ. Entomol. 2009, 102, 1681–1690. [Google Scholar] [CrossRef] [PubMed]
  11. Mellinger, D.K.; Clark, C.W. Recognizing transient low-frequency whale sounds by spectrogram correlation. J. Acoust. Soc. Am. 2000, 107, 3518–3529. [Google Scholar] [CrossRef] [PubMed]
  12. Ospina, O.E.; Villanueva-Rivera, L.J.; Corrada-Bravo, C.J.; Mitchell, A.T. Variable response of anuran calling activity to daily precipitation and temperature: Implications for climate change. Ecosphere 2013. [Google Scholar] [CrossRef]
  13. Chen, Y.; Why, A.; Batista, G.; Mafra-Neto, A.; Keogh, E. Flying insect classification with inexpensive sensors. J. Insect Behav. 2014, 27, 657–677. [Google Scholar] [CrossRef] [Green Version]
  14. Eliopoulos, P.A.; Potamitis, I.; Kontodimas, D.C.; Givropoulou, E.G. Detection of Adult Beetles Inside the Stored Wheat Mass Based on Their Acoustic Emissions. J. Econ. Entomol. 2015, 108, 2808–2814. [Google Scholar] [CrossRef] [PubMed]
  15. Eliopoulos, P.A.; Potamitis, I.; Kontodimas, D.C. Estimation of population density of stored grain pests via bioacoustic detection. Crop Prot. 2016, 85, 71–78. [Google Scholar] [CrossRef]
  16. Aldryhim, Y.N.; Ayedh, H.Y.A. Diel flight activity patterns of the red palm weevil (Coleoptera: Curculionidae) as monitored by smart traps. Fla. Entomol. 2015, 98, 1019–1024. [Google Scholar] [CrossRef]
  17. Fanini, L.; Longo, S.; Cervo, R.; Roversi, P.F.; Mazza, G. Daily activity and non-random occurrence of captures in the Asian palm weevils. Ethol. Ecol. Evolut. 2014, 26, 95–203. [Google Scholar] [CrossRef]
  18. Murchie, A.K.; Burn, D.J.; Kirk, W.D.J.; Williams, I.H. A novel mechanism for time-sorting insect catches, and its use to derive the diel flight periodicity of brassica pod midge Dasineura brassicae (Diptera: Cecidomyiidae). Bull. Entomol. Res. 2001, 91, 199–204. [Google Scholar] [PubMed]
  19. Batiste, W.C.; Olson, W.H.; Berlowitz, A. Codling moth: Influence of temperature and daylight intensity on periodicity of daily flight in the field. J. Econ. Entomol. 1973, 66, 883–892. [Google Scholar] [CrossRef]
  20. Hendricks, D.E. Portable electronic detector system used with inverted-cone sex pheromone traps to determine periodicity and moth captures. Environ. Entomol. 1985, 14, 199–204. [Google Scholar] [CrossRef]
  21. Kondo, A.; Sano, T.; Tanaka, F. Automatic record using camera of diel periodicity of pheromone trap catches. Jpn. J. Appl. Entomol. Zool. 1994, 38, 197–199. [Google Scholar] [CrossRef]
  22. Engelmann, F. The Physiology of Insect Reproduction; International Series of Monographs in Pure and Applied Biology Zoology; Pergamon Press: Oxford, UK, 1970; Volume 44. [Google Scholar]
  23. Saunders, D.S. Insect Clocks; Elsevier: Amsterdam, The Netherlands, 2002. [Google Scholar]
  24. Hendricks, D.E. Electronic system for detecting trapped boll weevils in the field and transferring incident information to a computer. Southwest. Entomol. 1990, 15, 39–48. [Google Scholar]
  25. Jiang, J.A.; Tseng, C.L.; Lu, F.M.; Yang, E.C.; Wu, Z.S.; Chen, C.P.; Lin, S.H.; Lin, K.C.; Liao, C.S. A GSM-based remote wireless automatic monitoring system for field information: A case study for ecological monitoring of the oriental fruit fly, Bactrocera dorsalis (Hendel). Comput. Electron. Agric. 2008, 62, 243–259. [Google Scholar] [CrossRef]
  26. Okuyama, T.; Yang, E.; Chen, C.; Lin, T.; Chuang, C.; Jiang, J. Using automated monitoring systems to uncover pest population dynamics in agricultural fields. Agric. Syst. 2011, 104, 666–670. [Google Scholar] [CrossRef]
  27. Faleiro, J.R. A review of the issues and management of the red palm weevil Rhynchophorus ferrugineus (Coleoptera: Rhynchophoridae) in coconut and date palm during the last one hundred years. Int. J. Trop. Insect Sci. 2006, 26, 135–154. [Google Scholar]
  28. Vacas, S.; Primo, J.; Navarro-Llopis, V. Advances in the use of trapping systems for Rhynchophorus ferrugineus (Coleoptera: Curculionidae): Traps and attractants. J. Econ. Entomol. 2013, 106, 1739–1746. [Google Scholar] [CrossRef] [PubMed]
  29. Ruiz-Montiel, C.; García-Coapio, G.; Rojas, J.C.; Malo, E.A.; Cruz-López, L.; Del Real, I.; González-Hernández, H. Aggregation pheromone of the agave weevil, Scyphophorus acupunctatus. Entomol. Exp. Appl. 2008, 127, 207–217. [Google Scholar] [CrossRef]
  30. Aguilar, J.F.S.; Hernández, H.G.; Vázquez, J.L.L.; Martínez, A.E.; Mendoza, F.J.F.; Garza, Á.M. Scyphophorus Acupunctatus Gyllenhal, Plaga del Agave Tequilero en Jalisco, México; Colegio de Postgraduados: Córdoba, México, 2001. [Google Scholar]
  31. Reed, C.R.; Wright, V.F.; Mize, T.W.; Pedersen, J.R.; Evans, B.J. Pitfall traps and grain samples as indicators of insects in farm-stored wheat. J. Econ. Entomol. 1991, 84, 1381–1387. [Google Scholar] [CrossRef]
  32. Toews, M.D.; Nansen, C. 21 Trapping and Interpreting Captures of Stored Grain Insects. Stored Prod. Prot. 2012, 21, 243. [Google Scholar]
  33. White, N.D.G.; Arbogast, R.T.; Fields, P.G.; Hillmann, R.C.; Loschiavo, S.R.; Subramanyam, B.; Throne, J.E.; Wright, V.F. The development and use of pitfall and probe traps for capturing insects in stored grain. J. Kansas Entomol. Soc. 1990, 63, 506–525. [Google Scholar]
  34. Neethirajan, S.; Karunakaran, C.; Jayas, D.S.; White, N.D.G. Detection techniques for stored-product insects in grain. Food Control 2007, 18, 157–162. [Google Scholar] [CrossRef]
  35. Aulicky, R.; Stejskal, V.; Kucerova, Z.; Trematerra, P. Trapping of internal and external feeding stored grain beetle pests with two types of pitfall traps: A two-year field study. Plant Prot. Sci. 2016, 52, 45–53. [Google Scholar] [CrossRef]
  36. Lindgren, B.S. A multiple funnel trap for scolytid beetles (Coleoptera). Can. Entomol. 1983, 115, 299–302. [Google Scholar] [CrossRef]
  37. Bentz, B.J. Mountain pine beetle population sampling: Inferences from Lindgren pheromone traps and tree emergence cages. Can. J. For. Res. 2006, 36, 351–360. [Google Scholar] [CrossRef]
  38. Shieh, J.C.; Wang, J.Y.; Lin, T.S.; Lin, C.H.; Yang, E.C.; Tsai, Y.J.; Jiang, J.A. A GSM-based field monitoring system for Spodoptera litura (Fabricius). Eng. Agric. Environ. Food 2011, 4, 77–82. [Google Scholar] [CrossRef]
  39. Liao, M.S.; Chuang, C.L.; Lin, T.S.; Chen, C.P.; Zheng, X.Y.; Chen, P.T.; Jiang, J.A. Development of an autonomous early warning system for Bactrocera dorsalis (Hendel) outbreaks in remote fruit orchards. Comput. Electron. Agric. 2012, 88, 1–12. [Google Scholar] [CrossRef]
  40. Deqin, X.; Qiumei, Y.; Junqian, F.; Xiaohui, D.; Jianzhao, F.; Yaowen, Y.; Yongyue, L. A multi-target trapping and tracking algorithm for Bactrocera Dorsalis based on cost model. Comput. Electron. Agric. 2016, 123, 224–231. [Google Scholar] [CrossRef]
  41. Xia, C.; Lee, J.M.; Li, Y.; Chung, B.K.; Chon, T.S. In situ detection of small-size insect pests sampled on traps using multifractal analysis. Opt. Eng. 2012, 51, 027001-1–027001-12. [Google Scholar] [CrossRef]
  42. Boissard, P.; Martin, V.; Moisan, S. A cognitive vision approach to early pest detection in greenhouse crops. Comput. Electron. Agric. 2008, 62, 81–93. [Google Scholar] [CrossRef]
  43. Ding, W.; Taylor, G. Automatic moth detection from trap images for pest management. Comput. Electron. Agric. 2016, 123, 17–28. [Google Scholar] [CrossRef]
  44. López, O.; Rach, M.M.; Migallon, H.; Malumbres, M.P.; Bonastre, A.; Serrano, J.J. Monitoring pest insect traps by means of low-power image sensor technologies. Sensors 2012, 12, 15801–15819. [Google Scholar] [CrossRef] [PubMed]
  45. Guarnieri, A.; Maini, S.; Molari, G.; Rondelli, V. Automatic trap for moth detection in integrated pest management. Bull. Insectol. 2011, 64, 247–251. [Google Scholar]
  46. Douglas, E.N. The Premonition Trap: First Field Trials of a Robotic Smart Trap for Mosquitoes with Species Recognition. In Proceedings of the 47th Annual Conference of Society for Vector Ecology, Anchorage, Alaska, 11–15 September 2016. [Google Scholar]
  47. Ma, J.; Zhou, X.; Li, S.; Li, Z. Connecting Agriculture to the Internet of Things through Sensor Networks. In Proceedings of the 2011 International Conference on Internet of Things and 4th International Conference on Cyber, Physical and Social Computing, Dalian, China, 19–22 October 2011; pp. 184–187. [Google Scholar]
  48. Shi, Y.; Wang, Z.; Wang, X.; Zhang, S. Internet of Things Application to Monitoring Plant Disease and Insect Pests. In Proceedings of the China International Conference on Applied Science and Engineering Innovation (ASEI 2015), Xi’an, China, 30–31 August 2015. [Google Scholar]
  49. Shahzadi, R. Internet of Things based Expert System for Smart Agriculture, (IJACSA). Int. J. Adv. Comput. Sci. Appl. 2016, 7. [Google Scholar] [CrossRef]
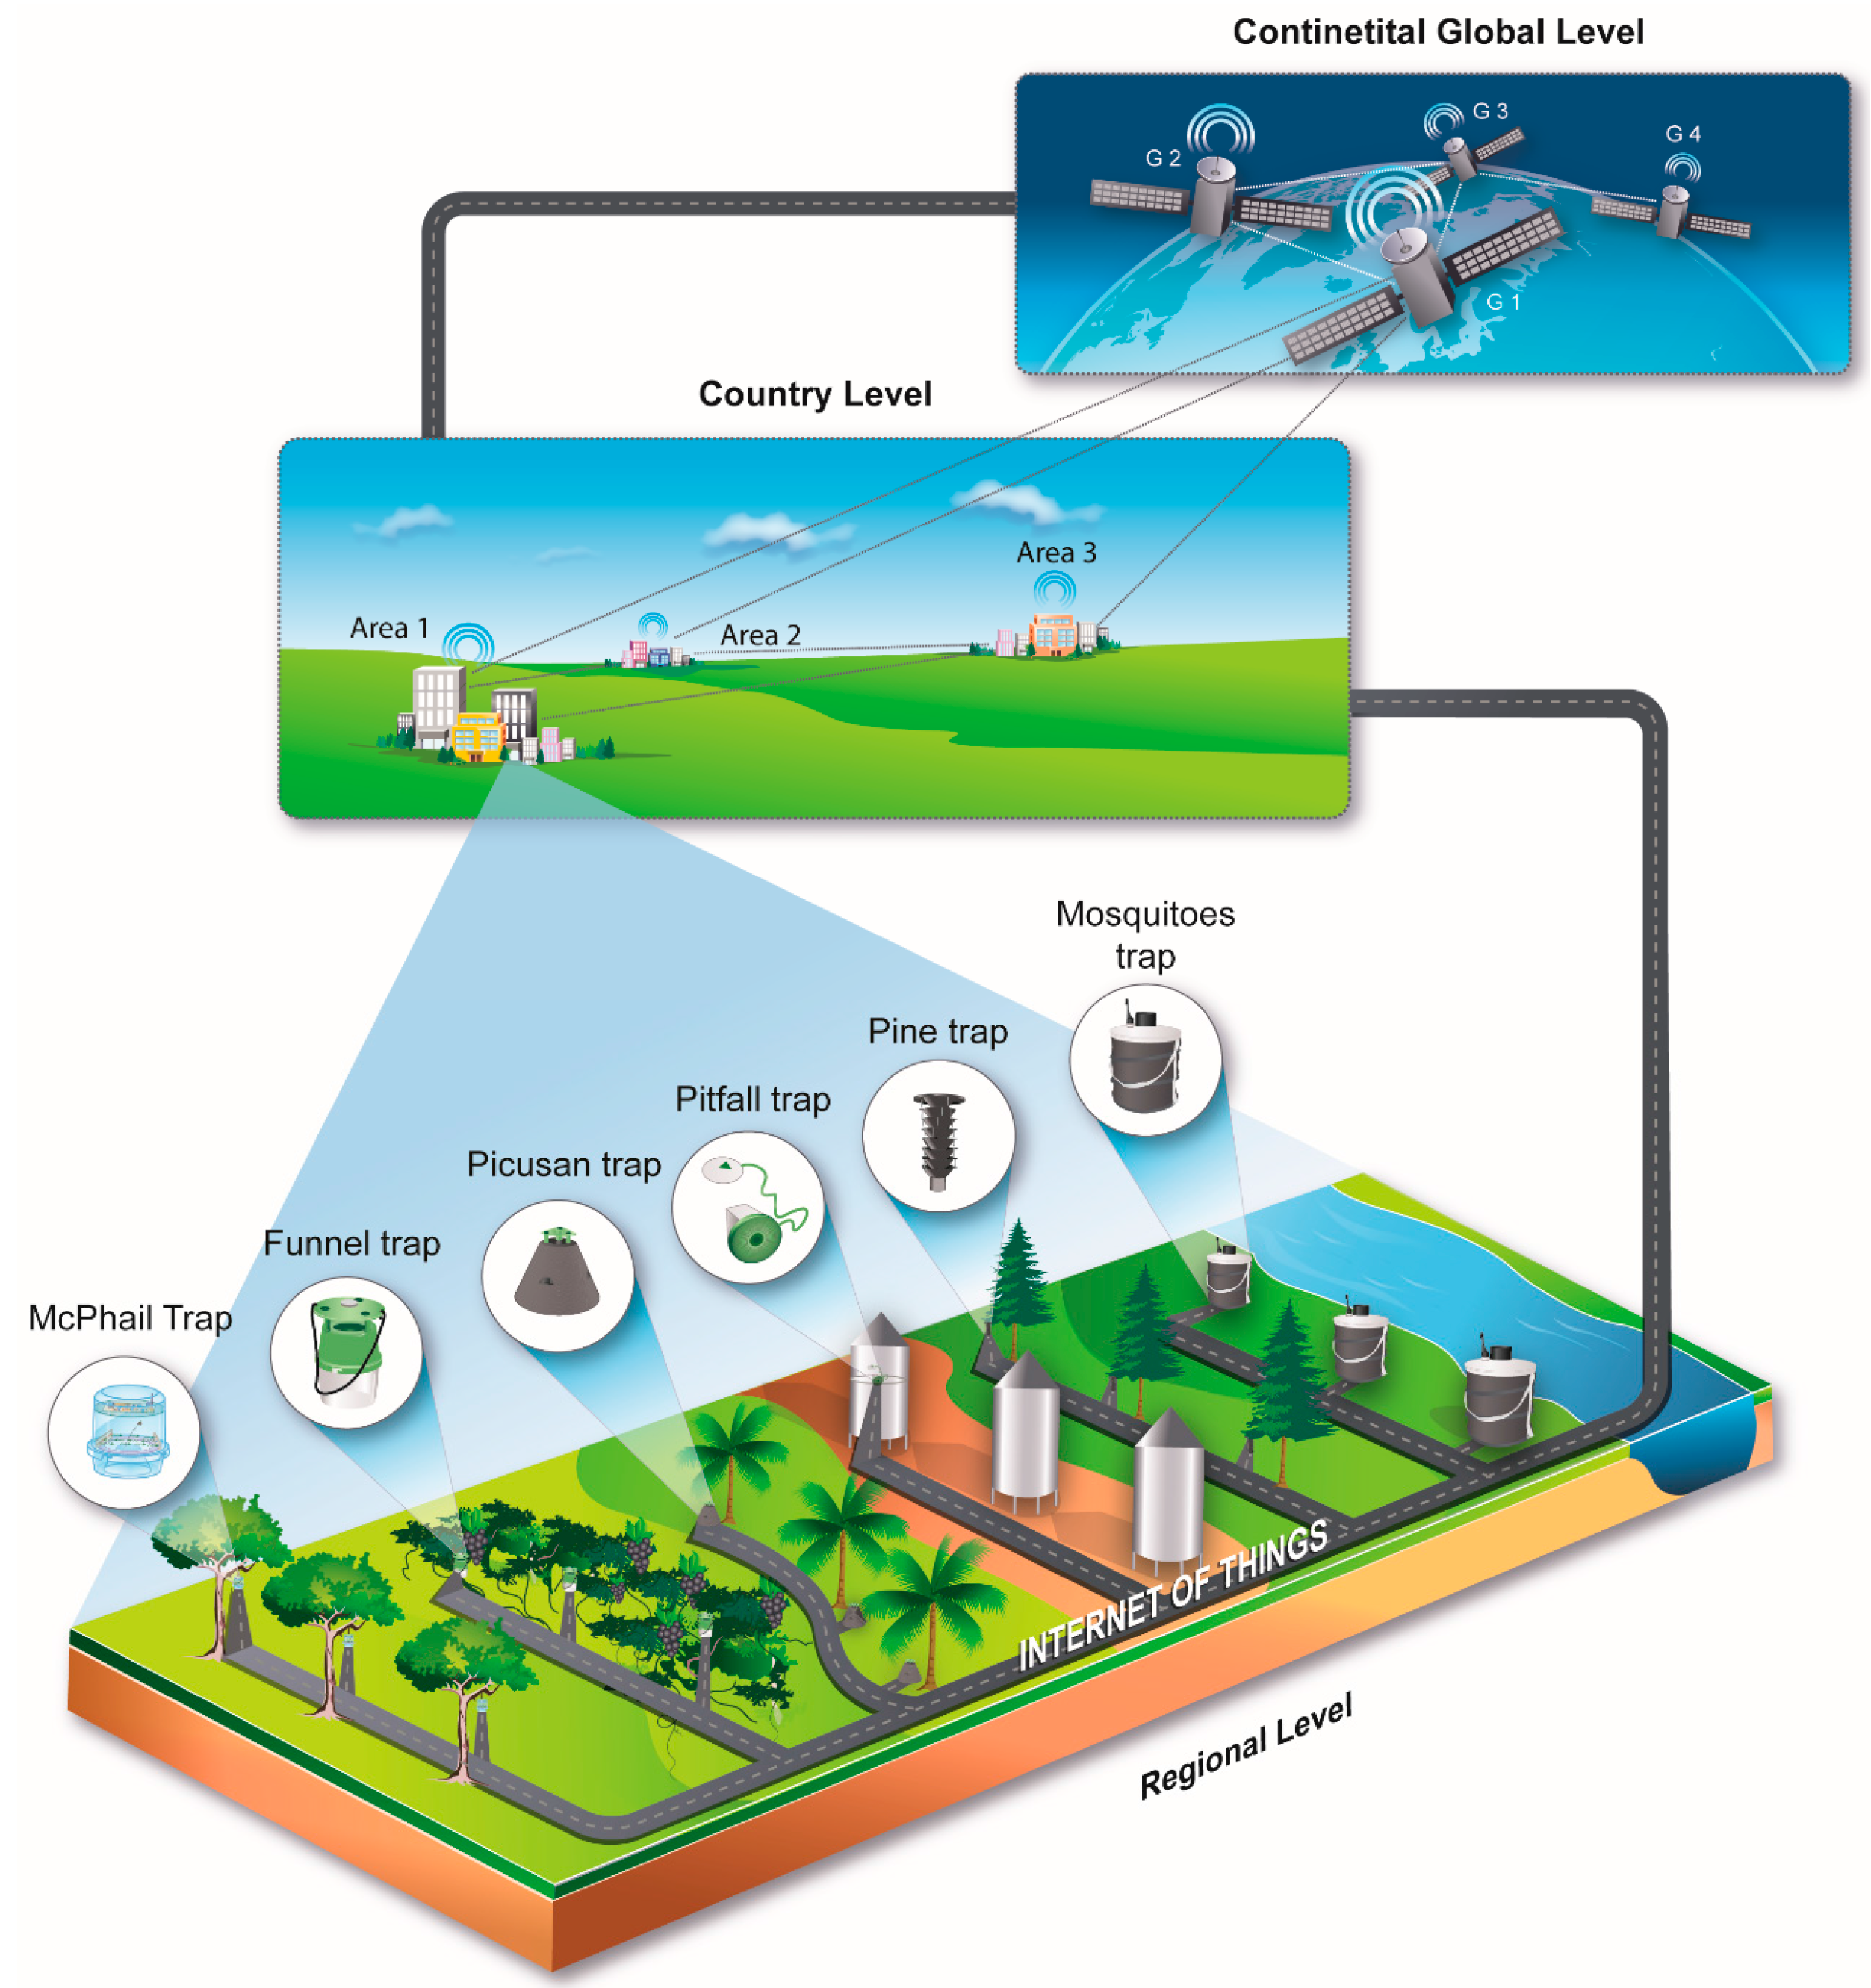
Figure 1. Traps reporting recordings and counts from the regional level to a central agency. Central agencies report to a global level at continental and/or global level.
Robotics 06 00019 g001
Figure 2. (Left) Picusan trap; (Right): Embedding the sensor at the end of the inverted funnel.
Robotics 06 00019 g002
Figure 3. Various pictures of the stored-grain pitfall trap inside grain. A sheet of light covers the lid entrance. Photo interruption due to a falling insect produces a voltage variation that is turned to a count. Counts as well as environmental parameters and a time stamp are transmitted wirelessly and uploaded to a server. These traps organize their own network and pass their counts from node to node until they reach the gateway to internet.
Robotics 06 00019 g003
Figure 4. Pine Beetle Lindgren Traps (Left): Sensor attached at the end of the funnel; (Middle) Full deployment of the trap; (Right): Final placement. Electronics and sensors located at the top of the bucket are attached to the end of the funnels.
Robotics 06 00019 g004
Figure 5. Accuracy of automatic counting in comparison with actual detection, of all species (up) and for each species separately (down). The values of the linear regression coefficient R2 prove that our system is 98–99% accurate (when detected and counted values are the same then R2 is equal to 1).
Robotics 06 00019 g005
Figure 6. Example of insect surveillance results at the local and regional level in the case of R. ferrugineus. Note that the same framework can be used for any insect counted in pheromone traps.
Robotics 06 00019 g006
Table 1. Optical elements of the sensor embedded in the insect traps.
Trap TypeLEDs/PhotodiodesDiffuser
Picusan5NO
Stored-grain pitfall16YES
Lindgren5NO
Table 2. Number of insects (manual inspection) and automatically counted (electronic sensors) adult beetles in three trap types.
Trap TypeSpeciesManually VerifiedAutomatically CountedCorrelation Coefficient (r)
Picusan 1R. ferrugineus37350.9966
4242
5958
Pitfall 2C. ferrugineus.59620.9912
4549
6774
O. surinamensis31340.9978
1112
2425
R. dominica15150.9976
2324
2426
S. oryzae21210.9900
3236
2930
T. confusum13130.9912
2630
3436
Lindgren 3R. ferrugineus.14140.9999
4549
6774
Monitoring period from 1 September 2016 to 5 December 2016; 1 Number of traps: 3; 2 Single trap inside grain mass, insect density >15 adults/kg grain; 3 Single trap hung from a wall externally to a laboratory.