Article

Synthetic Aperture Computation as the Head is Turned in Binaural Direction Finding

Environmental Research Institute, North Highland College, University of the Highlands and Islands, Thurso, Caithness KW14 7EE, UK
Robotics 2017, 6(1), 3; https://doi.org/10.3390/robotics6010003
Submission received: 28 December 2016 / Revised: 28 February 2017 / Accepted: 9 March 2017 / Published: 12 March 2017

Abstract

:
Binaural systems measure instantaneous time/level differences between acoustic signals received at the ears to determine angles λ between the auditory axis and directions to acoustic sources. An angle λ locates a source on a small circle of colatitude (a lamda circle) on a sphere symmetric about the auditory axis. As the head is turned while listening to a sound, acoustic energy over successive instantaneous lamda circles is integrated in a virtual/subconscious field of audition. The directions in azimuth and elevation to maxima in integrated acoustic energy, or to points of intersection of lamda circles, are the directions to acoustic sources. This process in a robotic system, or in nature in a neural implementation equivalent to it, delivers its solutions to the aurally informed worldview. The process is analogous to migration applied to seismic profiler data, and to that in synthetic aperture radar/sonar systems. A slanting auditory axis, e.g., possessed by species of owl, leads to the auditory axis sweeping the surface of a cone as the head is turned about a single axis. Thus, the plane in which the auditory axis turns continuously changes, enabling robustly unambiguous directions to acoustic sources to be determined.

1. Introduction

This article proposes a biologically inspired solution to the binaural location of directions to single or multiple acoustic sources in both azimuth and elevation. Wallach [1], based on observations of human behavior, inferred that humans locate directions to acoustic sources by “dynamically” integrating information received at the ears as the head is turned while listening to a sound. A synthetic aperture computation analogous to those performed in the geophysical process of migration applied to seismic profiler data, and in synthetic aperture sonar/radar systems, can explain Wallach’s observations, constituting the “dynamic” process alluded to. The solution can readily be implemented in a binaural robotic system measuring interaural time differences as the head is turned. This might inform the development of hypotheses on biological acoustic localization as well as being of considerable interest in the field of robotics in its own right.
Sound received at the human ear is perceived by our conscious mental view of the world as a continuously updated collection of tones. The human auditory system detects sound over a broad range of frequencies from ~20 Hz to 20,000 Hz, ~10 octaves, which for a transmission velocity in air of 330 ms−1 corresponds to wavelengths of 16.5 m to 0.0165 m (1.65 cm). For comparison, a concert piano accommodates a tonal range of just over seven octaves. Sound with a wavelength the distance between the ears for a human (nominally ~0.15 m) has a frequency of ~2200 Hz.
The human auditory system characterizes sound from the shape of amplitude/power spectra and recognizes sound sources with reference to memorized associations between spectral characteristics and sources. This function of the human auditory system has inspired the development of methods applied to marine geophysical sonar data to characterize and classify sea-beds based on features describing the morphologies of sidescan sonar trace power spectra [2,3].
The human visual system in contrast to the auditory system perceives a little less than a single octave of the optical part of the electromagnetic (e-m) spectrum in frequency bands centered on just three frequencies. The human mind constructs a high resolution color worldview of the environment from images formed on the retina at the backs of the eyes, focused at the center of the field of view.
Auditory systems operate on signal having considerably greater wavelength than visible e-m radiation with correspondingly lower capacity for resolution, estimated to be 1.0 ° (Mills [4]) to 1.5 ° (Brughera et al. [5]) in the direction the head is facing. For comparison the face of the Moon subtends an angle of ~0.5 ° at the Earth’s surface. Nevertheless, similar to the human visual system, the auditory system provides us with spatial information on the location of energy sources. Humans do not perceive sound as images in the way we perceive objects illuminated by light, though there is no reason in principle why this is so, nor why other animals, or robotic systems, should not. With an index finger pointing at arm’s length in the direction of an acoustic source within our field of vision, a human can impose aurally derived information on its visual system demonstrating that despite the absence of an aurally derived image, we nevertheless have an aurally informed conscious worldview either incorporated into or existing in parallel with and augmenting our visually informed one.
The human visual system is binocular. Two eyes confer no advantage over one for direction finding, but extend the field of view to a little less than a hemisphere (a solid angle a little less than 2π steradians), and more significantly provide a perception of range. The closer an object, the more accurate is the estimate of range. The amount of convergence applied to the axes of the eyes to achieve a single focused image, and the amount of compression applied to the eyes’ lenses constitute measures of the distance to an object in our visually informed worldview.
With two ears we are able to extract information on the direction to an acoustic source over a spherical field of audition (a solid angle of 4π steradians) based on differences in arrival times of sound at the ears (interaural time difference, ITD). We might expect the limiting acoustic frequency for measurement of ITD to be that corresponding to the wavelength approximately equal to the distance between the ears (frequencies less than ~2200 Hz), however the limiting frequency is found to be somewhat less at approximately 1500 Hz (e.g., Wightman and Kistler [6], Brughera et al. [5]). Measurement of arrival time difference might be made by applying a short time-base cross-correlation process to sounds received at the ears (Sayers and Cherry [7]) or by a functionally equivalent process (e.g., Jeffress [8], Colburn [9], Kock [10], Durlach [11], Licklider [12]). For acoustic signal at higher frequencies locating acoustic sources is dominated by the use of interaural level difference (ILD) [5,6].
With two ears there is a difficulty in determining the direction to an acoustic source. A single estimate of an angle between the acoustic source and the auditory axis   λ , whether by an ITD or ILD ambiguously determines the acoustic source to lie on the surface of a cone and does not unambiguously determine the direction to an acoustic source in azimuth (longitude) and elevation (latitude) with respect to the direction the head is facing. Some species of animal possess ears with independently orientable external ears, pinnae, for example, cats. These animals can explore sounds by rotating their pinnae without turning their heads. In this way, they appear to be able to determine the direction to a source of sound with a single ear and, in principle with a pair of ears even be able to estimate range by triangulation. However, many species of animal including humans cannot orientate their pinnae and some other mechanism must apply for binaural direction finding, and it is with this that this article is concerned. Wallach [1] found that the ambiguity inherent in finding the direction to an acoustic source with a pair of ears in humans is overcome as the head is actively turned to explore a sound (also [13,14,15,16,17]), which he posited is achieved through a “dynamic” integration of information received.
Other aural information might also be integrated into an interpretation of the direction to an acoustic source. A nodding rotation of the head about the auditory axis might provide information on the elevation of a sound source due to the effect on the spectral content of the signal arriving at the ears of the shape of the pinnae and the head around which sound has to diffract; the so called head related transfer function (HRTF; Roffler and Butler [18], Batteau [19], Middlebrooks et al. [20], Rodemann et al. [21], also Norberg [22,23,24] for owls). However, Wallach [1] observed that nodding is ineffective for locating a sound source. Nevertheless, a HRTF effect might provide supplementary information in aural direction finding.
It is proposed in this article that the dominant process by which the directions to acoustic sources are located by the human and other animals’ binaural systems, and one which is readily implementable in a robotic binaural system, employs a synthetic aperture computation acting on a stream of estimates of the angle λ as the head is turned while listening to a sound. The synthetic aperture computation process locates directions in both azimuth and elevation for single or multiple sources. There is no front–back ambiguity. There is a below–above horizon ambiguity for turning the head about a single vertical axis for a pair of listening sensors arranged without vertical offset, but this ambiguity is overcome by introducing a vertical offset (a slope on the auditory axis). The method is described in terms of geometrical mathematical manipulation and is readily implementable in a robotic system. In fact, the detail of how the method might be implemented in nature in terms of biological/neural components performing functions equivalent to mathematical operations is currently shrouded in rather more mystery.
The synthetic aperture computation process is an integration that can be imagined as being performed in a virtual field of audition, implemented in a robot as a 2D array of azimuth, elevation (longitude, latitude) positions, or in a natural auditory system by a subconscious representation of the field of audition existing in parallel with the one of which we are aware. The synthetic aperture computation has the effect of promoting the direction finding capability of two ears to that of a large two-dimensional array of stationary ears. The process is analogous to those applied in the anthropic technologies of migration in seismic data processing and in synthetic aperture side-looking radar, and sidescan sonar systems (Appendix C).
It is only relatively recently that binaural sensing in robotic systems has developed sufficiently for the deployment of processes such as finding directions to acoustic sources [25,26,27,28,29,30,31,32,33,34,35,36]. Acoustic source localization has been largely restricted to estimating azimuth [26,27,28,29,30,31,32,33] on the assumption of zero elevation, except where audition has been fused with vision for estimates also of elevation [34,35,37,38]. Information gathered as the head is turned has been exploited either to locate the azimuth at which ITD reduces to zero thereby determining the azimuthal direction to a source, or to resolve the front–back ambiguity associated with estimating only azimuth [28,29,30,31,32,33,34,39,40]. Recently, the application of Kalman filters acting on a changing ITD has produced promising results [41,42,43].

2. Angle λ (Lamda) between the Auditory Axis and the Direction to an Acoustic Source

A straight line simplification of the relationship between arrival time difference and angle to acoustic source is illustrated in Figure 1. In fact, sound must diffract around the head to reach the more distant ear particularly for large values of   | λ 90 ° | rather than travel the straight line paths shown [39,44]. The relationship is rendered more complicated still where differences in signal level at the ears, as well as differences in arrival time, have an effect on the estimate of   λ . However, the relationship would be accurate for a simple robotic head designed for the purpose of acoustic localization experiments, consisting of little more than a pair of microphones, and for which acoustic signal dominated by wavelengths greater than the distance between the microphones is utilized.
From Figure 1, the relationship between angle to source and path length difference for straight line and far-field approximations is:
cos λ = f d / d = f
λ = acos ( f )
where
λ is the angle between the auditory axis and the direction to the acoustic source;
d is the distance between the ears (the length of the line LR); and
f d is the difference in the acoustic ray path lengths from the source to the left and right ears as a proportion of the length d ( 1 f 1 ).
The distance f d is related to the difference in arrival times at the ears measured by the auditory system by:
  f d = c   Δ t
where
c is the acoustic transmission velocity in air (e.g., 330 ms−1); and
Δ t is the difference in arrival times of sound received at the ears.
A machine computes an angle to source by performing the calculation in Equation (2). In nature the mind subconsciously computes the angle by a functionally equivalent process.
An estimate for λ does not uniquely determine the direction to an acoustic source but ambiguously determines the location of the source on the surface of a cone situated to one side of the head, rotationally symmetric about the auditory axis, with its apex at the auditory center midway between the ears. The surface of the cone projected from the auditory center onto a spherical surface centered at the auditory center, maps onto the sphere’s small circle of colatitude for angle λ (a lamda circle). With respect to the direction the head is facing, the circle in the field of audition has an elliptical aspect. In the most extreme case, in which the acoustic source is equidistant from the ears ( λ = 90 ° ), the cone reduces to a plane coincident with the median plane, and the corresponding circle in the field of audition appears rotated by 90 ° to an ellipse with zero width i.e., a line.
One way to uniquely determine the direction to an acoustic source would be to align the auditory axis with the direction to an acoustic source by turning the head to maximize the time delay between the ears. The estimate of angle would be compromised by the need for sound to diffract around the head to the more distant ear, but more importantly, the uncertainty in estimates of angle from the difference in arrival times becomes large as λ approaches 0° (or 180°).
The uncertainty in the angle λ between the auditory axis and the sound source is:
σ λ = d λ d Δ t   σ Δ t
where
σ Δ t is the uncertainty in the estimate of arrival time difference Δ t ; and
d λ / d Δ t is the rate of change of λ with respect to Δ t .
Differentiating   λ with respect to   Δ t Equations (1) and (3) gives:
d λ d Δ t = c d / s q r t ( 1 ( c   Δ t d ) 2 )
The quantity ( c   Δ t / d ) tends to unity as λ approaches 0° or 180°, and the rate of change d λ / d Δ t tends to   , and so the estimate of λ is maximally inaccurate when the acoustic source is on the auditory axis. By the same token,   d λ / d Δ t is smallest when   Δ t is zero, and the estimate of   λ is therefore most accurate, hence in principle the most accurate estimate of λ is made for λ = 90° (the auditory central fovea [21,45]). In practice, humans in exploring a sound do not turn the head to align the auditory axis with the direction to an acoustic source in fact quite emphatically we tend to turn our face to it (aligning the auditory axis normal to it).
The need for an accurate determination of angles at which sounds arriving at the ears maximally correlate for   Δ t ≈ 0 suggests that in humans/animals the data upon which the cross-correlation process acts are not the power spectra of which we are consciously aware, for phase information in waves is lost in computing amplitude/power spectra. To correlate two series of continuously updated power spectra as a two-dimensional cross-correlation would require power spectra to be updated at a very high rate, and require a varying signal to be present at the highest frequencies discernible to the human ear. In fact, we can accurately determine the null position Δ t = 0, when high frequency signal is absent. These considerations suggest that the cross-correlation process acts upon a subconscious transduction of the raw pressure signal received at the ears [7].

3. Synthetic Aperture Audition

It is now considered how information from a series of estimates of values for λ determined as a binaural head is turned while listening to a sound can be integrated for estimation of the direction to an acoustic source in azimuth and elevation. This is done with reference to simulated data computed for an acoustic source at an azimuth or longitudinal position θ = 0°, and at an elevation or latitude of φ = −30° (i.e., below the horizontal).

3.1. Horizontal Auditory Axis

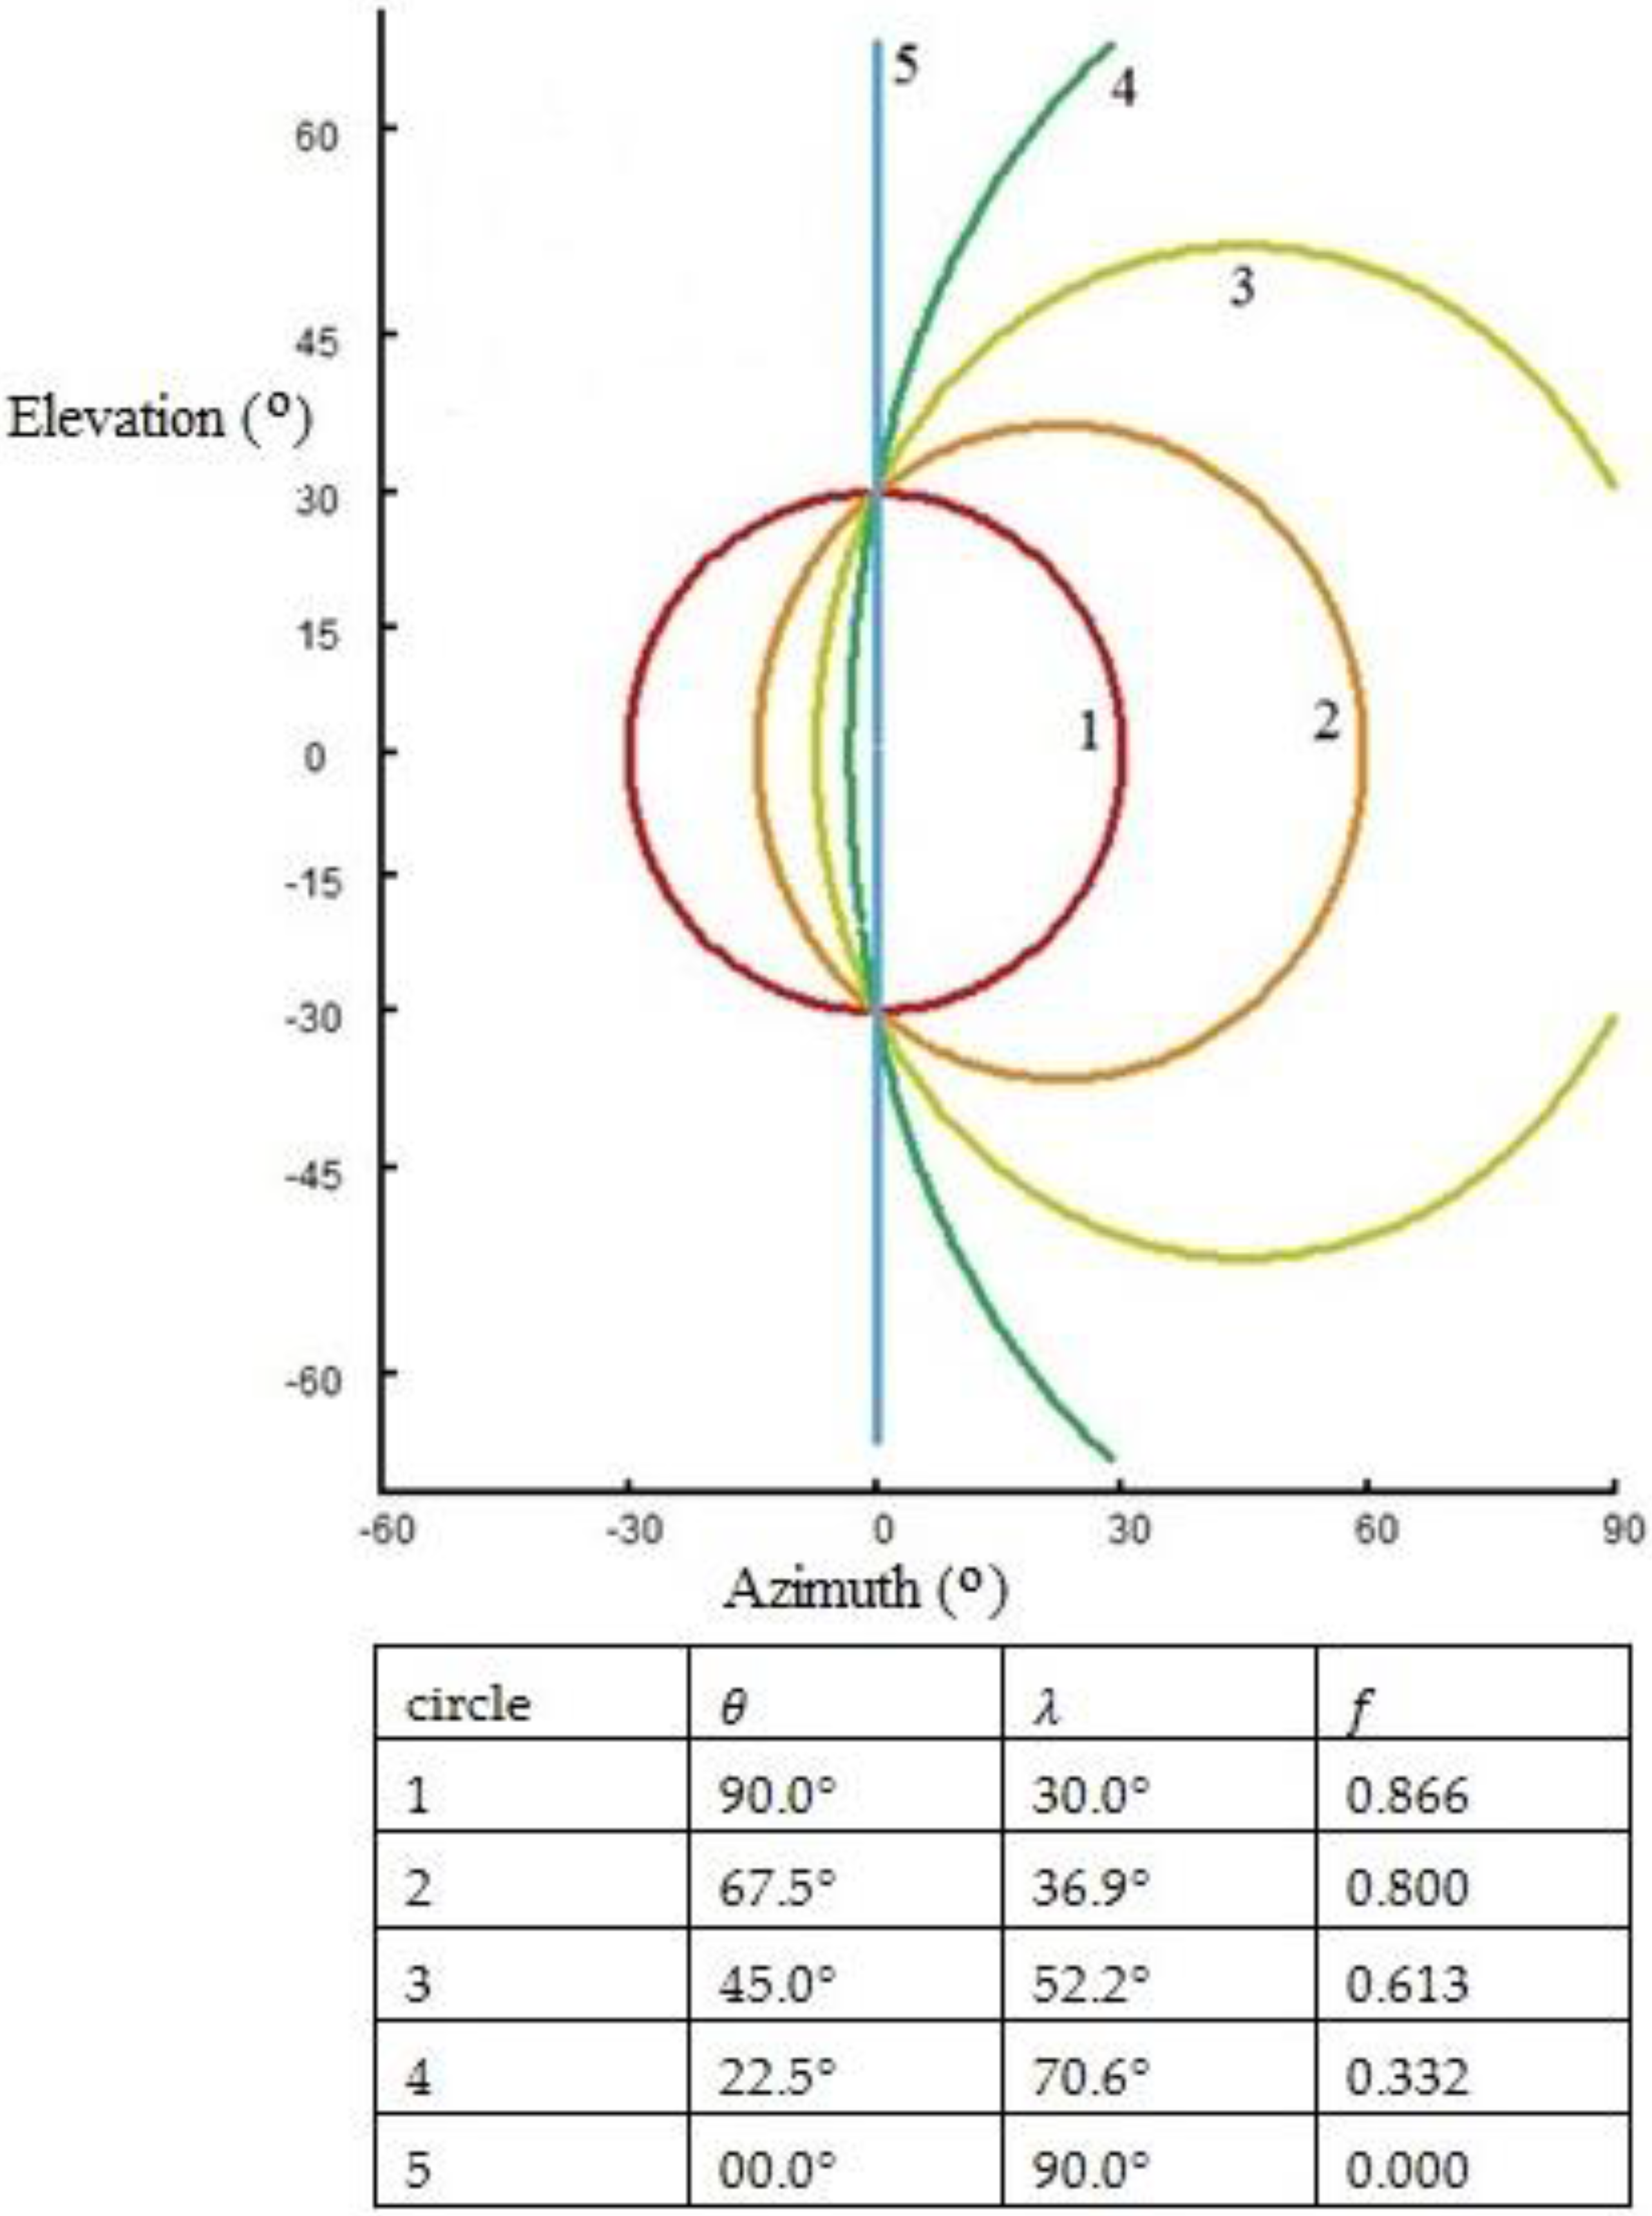
The integration of data acquired by a binaural system as the head is turned, constituting a synthetic aperture computation, is illustrated for simulated data in Figure 2 and Figure 3. Figure 2 shows a chart of a collection of lamda small circles of colatitude on the surface of a sphere in a virtual field of audition in Mercator projection for five instantaneous lateral (longitudinal) angles θ to the right of the direction the head is facing to a single acoustic source. The direction to the acoustic source is used as the datum against which measurements of θ are made. In fact any direction could be chosen for this purpose. The discrete values of θ in Figure 2 vary from 90° to 0° in intervals Δ θ (−22.5°) as the head is turned. Figure 3 illustrates the relationship between the orientation of the head and the orientation of the lamda circles for each of the discrete positions of the head for the same data shown in Figure 2.
In a practical robotic implementation, and in nature, the number of lamda circles as the head is rotated through 90° would be many. Just five are shown in Figure 2 and Figure 3 for the sake of clarity for the purpose of illustrating and describing the synthetic aperture process. Simulated values of λ as a function of θ and φ in Figure 2 are computed (Appendix A) from:
  λ = acos ( cos θ cos φ )
The implementation details of how values for λ and θ , e.g., as shown in Figure 2, are rendered as lamda circles for display in a chart, are provided in Appendix B.
The vertical center of Figure 2 represents the vertical position of the auditory center. With the head facing left ( θ = 90°) the auditory axis is perpendicular to the page and aligned with the lateral position of the acoustic source. The source is ambiguously located on the small circle of colatitude labeled 1 (red), and in a synthetic aperture computation, acoustic energy is integrated over the circle into the virtual field of audition (Figure 2 and Figure 3, top left). As the head is turned through an angle Δ θ = −22.5 ° , the mind/vestibular system or a robotic analogue, compensates by rotating the spatial information in the worldview with respect to the position of the head, by − Δ θ = 22.5 ° . Thus, the representation of objects in the worldview and data pertaining to them (e.g., the integrated acoustic energy over lamda circles in a virtual field of audition), do not move relative to objects in the real world as the head is turned. With the observer’s head turned one quarter of the way towards the acoustic source ( θ = 67.5°), the updated instantaneous value for λ will locate the source on the cone represented by the circle numbered 2 (orange), and again in a synthetic aperture computation, acoustic energy is integrated over the circle into the virtual field of audition (Figure 2 and Figure 3 top middle). This continues for successive values of θ until the observer is facing the source of sound ( θ = 0°) and the acoustic source is located on a cone that is reduced to a plane coincident with the median plane, represented in the observer’s worldview by the great circle of colatitude for λ = 90° numbered 5 (blue) appearing as a line, and in a synthetic aperture computation acoustic energy is integrated along the line into the virtual field of audition (Figure 2 and Figure 3 bottom middle).
As the head is turned, acoustic energy (alternatively, the amplitude of a peak in a short time-base cross correlation function between acoustic amplitudes received at the ears) over multiple instantaneous lamda circles is integrated in the virtual/subconscious field of audition. The direction to the acoustic source is given by the direction to the maxima in the integrated acoustic energy in the acoustic image in the virtual field of audition. This corresponds to the direction to the intersections of the lamda circles as they would appear in the virtual field of audition. In this way, the ambiguity associated with directions to a multiplicity of points on individual lamda circles collapses to an unambiguous (or at least, less ambiguous) direction to points of intersection of the circles.
By the time we have turned our head through a few, to a few tens, of degrees we have usually unambiguously located the direction to an acoustic source both azimuthally (in longitude) and in elevation (latitude) [1,13,14,15,16,17] having generated estimates for θ and   φ with respect to the direction the head is facing, by the mind subconsciously performing in real time a computation functionally equivalent to an integration of energy over numerous instantaneous lamda circles. Note that whilst Figure 2 and Figure 3 (and similarly Figure 4) show collected lamda circles pertaining to the time when the head is turned such that λ = 90° and for a large change in   θ , in fact a solution to the direction to the acoustic source requires only a sufficient change in   θ for a solution to emerge, and does not require the head to turn to face the source. The result of the synthetic aperture computation is presented to the aurally informed worldview as the (in nature consciously perceived) location of an acoustic source along a line. The perceived directions to acoustic sources may be refreshed as required by repeating the application of the synthetic aperture computation process by turning the head.
In the synthetic aperture computation, the auditory system integrates geometrically coherent data received by a pair of ears as the head is turned, to endow it with the functionality of a large static two-dimensional (2D) array of hearing sensors.

3.2. The effect of an Inclined Auditory Axis

Rotating the auditory axis within a single plane leads to the ambiguity of two possible locations for an acoustic source in Figure 2 ( φ = ±30°). To uniquely determine the direction to an acoustic source, the head could be turned such that the auditory axis is swept within more than a single plane. Wallach [1] noted based on experimental observations made, “We have found a number of different movements of the head to be effective in sound localization. The most frequent natural head movement is a turning of the head upon which a tilting to the side is gradually superimposed as the motion approaches the end of the excursion”, (italics Wallach’s). It was also noted that “a side-to-side motion is very effective but unnatural” [1].
The effective use of a lateral tilt of the auditory axis for direction finding during head rotation is exploited in an evolutionary adaptation by species of owl which have ears vertically offset on an auditory axis slanting at an angle [22,23,24], e.g., at approximately 20°. Thus, as a slanting auditory axis is rotated about a single axis, the auditory axis sweeps over the surface of a cone and in this way the plane in which the auditory axis sweeps continuously changes. Therefore the integration of acoustic energy over lamda circles in a synthetic aperture computation as the head is turned for various values of θ yields a robustly unique direction to the source of sound.
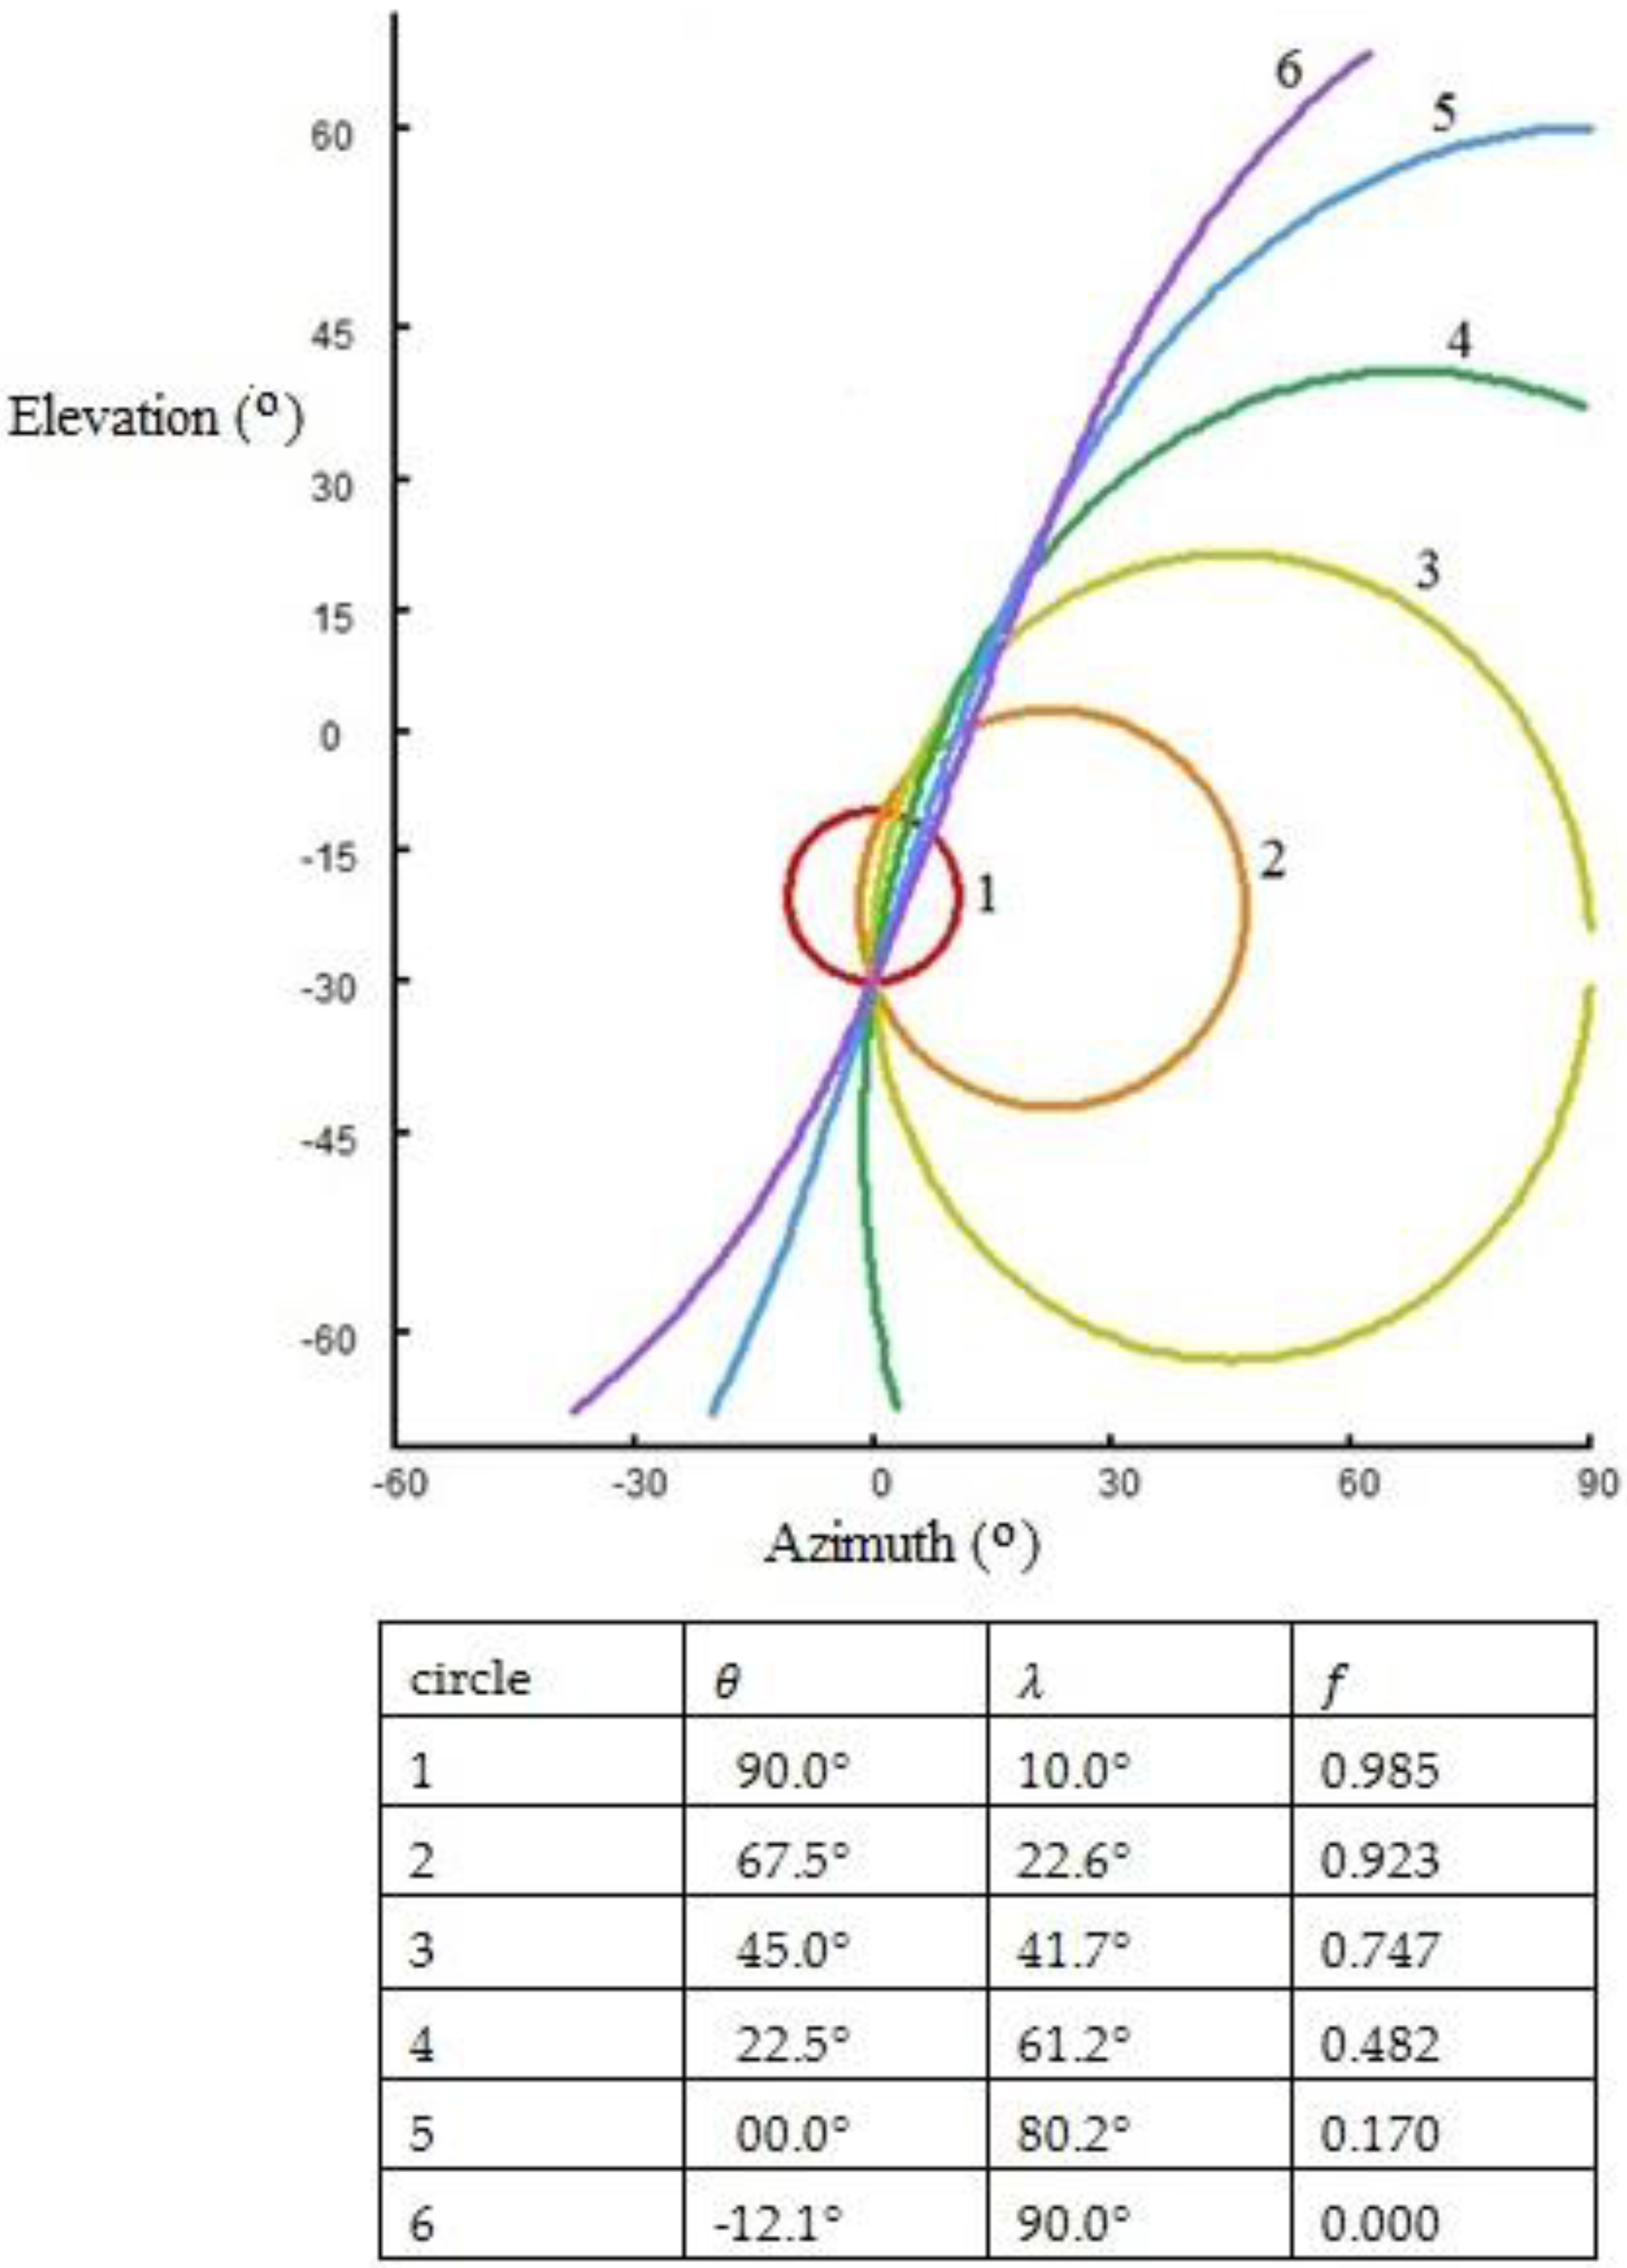
Angles   λ in the table in Figure 4 are computed for values of   θ ,   φ and   i (Appendix A) from:
  λ = acos ( sin θ cos i cos φ + sin i sin φ )
where   i is the inclination of the auditory axis to the right across the head.
The angle   θ for λ = 90 ° in which an inclined median plane intersects the source of sound (the line labelled 6 in Figure 4) (Appendix A) is:
θ = asin ( tan i   ·   tan φ )
It is seen in Figure 4 that an unambiguous solution for the direction ( θ , φ ) to an acoustic source is generated for ears with a vertical offset and slanting auditory axis, rather than the ambiguous ones for a horizontal auditory axis (Figure 2).
It is often stated that the slant of the auditory axis of owls endows an advantage to hearing performance (e.g., in ornithological guide books), however, apart from a use in synthetic aperture computation, this adaptation would serve no obvious advantageous purpose.

4. Remarks

Synthetic aperture computation during the turning of the head delivers a solution to the direction to acoustic sources both azimuthally (longitudinally) and in elevation (latitudinally) with respect to the direction the head is facing.
The computation in synthetic aperture audition (SAA) is strikingly similar to the process of migration applied to seismic profiler 2D or 3D images. This is described and illustrated in Appendix C. In the SAA process, the location of data distended over circles generated for instantaneous determinations of acoustic source direction, reduces to points after the data are integrated in the virtual field of audition in which the SAA process is performed. Similarly, in migration, data that appear in pre-migrated distance-time sections to be located over hyperbolae, are actually ambiguously located on circles. When the data are subsequently distended over the circles and integrated in the migrated distance-distance section, hyperbolae in the raw pre-migrated section collapse to points in the migrated section [46,47,48,49,50]. Similarly, SAA computation is analogous to synthetic aperture computation performed in synthetic aperture radar (SAR) and sonar (SAS) systems to compute precisely located positions of targets on high resolution distance-distance radio/sonograms from poorly resolved linear elongated features spread over multiple traces on unprocessed distance-time images [46,51,52,53,54,55].
These anthropic computer programmed image processing methods involve computationally intensive (and often very time consuming) calculation. Migration and SAR/SAS computations require accurately navigated data in order to take advantage of the geometrical coherence inherent in the raw data. Similarly, SAA computation must incorporate accurately measured (in nature vestibular) attitudinal data for the head as it is turned, continuously and in real time, to re-orient the aural worldview to appropriately realign compound integrated data in the virtual field of audition, in readiness for integrating acoustic energy over the current instantaneous lamda circle.
An interesting aspect of SAA in humans and undoubtedly other animals too is that sound from multiple sources arriving at the ear from different directions can be disentangled and sources located simultaneously. The synthetic aperture computation approach is naturally extensible for multiple acoustic sources. Multiple sources leading to multiple events (peaks) in short time-base cross correlation signals can all be mapped to lamda circles. Multiple sources then lead to multiple sets of lamda circles with intersections at correspondingly multiple points. Accumulations of acoustic energy at multiple points in the virtual field of audition will allow the directions to multiple sources to be simultaneously determined. Spurious events in short time-base cross correlation signals not associated with primary acoustic sources but with secondary effects, will be less likely to produce lamda circles coherently intersecting at points and therefore be unlikely to register and be identified as primary sources in the virtual field of audition.
It should in principle be possible to estimate range as well as direction in SAA computations from near-field deviations from far-field behavior. By relaxing the far-range approximation and computing lamda circles at multiple spherical shells with radii equal to distances s , it should in principle be possible to estimate range by optimising the distance s to that for which the corresponding lamda circles best converge/focus to a point. This would add a dimension to the synthetic aperture calculation, and acoustic energy maxima would be sought in a three dimensional volume over a virtual field of audition, rather than over a two-dimensional surface. Whether humans are capable of estimating range in this or an equivalent way is questionable but it is likely that animals with more highly developed auditory systems are capable of this. Bats hardly need to since they measure distance to target more directly using an active source sonar system [56], but owls’ hearing is passive and yet they are known to be able to catch prey in total darkness suggesting they are equipped to measure distances to acoustic sources.
Bats follow convoluted flight paths, much more so than swallows, swifts and martins in pursuit of the same kind of prey. The purpose of this might be to perform SAS type calculations in generating a worldview informed almost exclusively by sonar in the near absence of visually derived information.
We subconsciously move our heads to update our worldview on our environment, integrating both visually and aurally derived information. In the absence of visual cues, for example in complete darkness, we tend to turn our heads in a quite exaggerated way to explore aural signal. This suggests that visual and aural directional cues are integrated by a top level worldview manager incorporating information from both (plus other) types of sensory system, and this approach has been exploited in robotic systems (e.g., [35]).
Acoustic source direction finding is achieved in nature by formidable feats of acoustic signal and image processing: first, to estimate values for   λ from the results of a short time-base cross-correlation of acoustic signal received at the ears [7]; and second, to integrate acoustic intensity over lamda circles (or an equivalent process) in a virtual field of audition in performing a synthetic aperture computation. Some processes in Nature were not recognized until after processes developed for anthropic technologies suggested they might exist, e.g., the development of anthropic sonar technologies (Chesterman et al. [57]) suggested echo-location in bats (Griffin [56]) and toothed whales, e.g., dolphins (Au [58], Au and Simmons [59]). The same may apply to synthetic aperture processing. These computationally intensive calculations dramatically, and seemingly to the initiate almost magically, find degrees of resolution in processed geophysical images very much absent in the raw data images, and it now appears that analogous processes have been operational all day every day in natural auditory systems including our own for epochs.
It seems possible even likely that animals having highly developed auditory systems such as owls, bats and dolphins experience aurally informed mental images akin to those associated with the visual system in humans, possibly in some cases even incorporating color. There is no reason in principle why this should not be so. The worldview imaging capability of nocturnal animals in particular would otherwise be underutilized in low light conditions [60,61]. An option to display acoustic images on monitors could be provided for a robotic system for the human visualization of the results of the stages of processing acoustic data. The option could be exercised for the purpose of system development though it need not necessarily be exercised in subsequent routine use. In this way the workings and results of intermediate calculations in a robotic system would be rendered visible. It is an unfortunate fact that humans are aware and conscious of the result of some astounding feats of acoustic data processing, but we are quite unaware of the workings out along the way performed sub-consciously.
Methods for performing SAA computations, and hypotheses on how SAA computations are carried out in natural auditory systems, could be developed and explored by experimenting with robotic auditory systems to perform the tasks achieved by natural audition. An engineered system could incorporate a monitor for visualizing the content of the virtual field of audition as aural data are subjected to various stages of processing, and for displaying a summary of inferences made in a visualization of the aurally informed worldview.

5. Summary

An approach has been developed to uniquely determine directions to acoustic sources using a pair of omnidirectional listening devices (e.g., ears without independently orientable pinnae) based on measurement of arrival time differences in signals received at the ears, and on the integration of information in a virtual, and in nature subconscious, field of audition as the head is turned. At any instantaneous position of the head, a sound is ambiguously located on a small circle of colatitude of a sphere centered at the auditory center. As the head is turned, the ambiguity collapses to the point of intersection of multiple small circles of colatitude in the virtual/subconscious field of audition in which the positions of the circles are continuously updated by a direction measurement sensor or in nature the vestibular system, as the head is turned. This process constitutes a synthetic aperture computation promoting the direction finding capability of a pair of listening sensors to that of a large two-dimensional array of sensors, and is remarkably similar to those performed in migration applied to seismic data and in synthetic aperture radar and sonar systems. The method can elegantly account for the observations of human acoustic localization by Wallach [1] and might constitute the “dynamic” process he posited whereby data acquired as the head is turned are integrated for determining directions to acoustic sources. The method is readily implementable in robotic systems capable of determining angles between the auditory axis and an acoustic source by measuring interaural time differences (or by some other method), and with an appropriate motion sensor for measuring head orientation, in emulation of natural audition, and in-so-doing will: enhance robotic auditory capability; provide a powerful basis for exploring developing hypotheses on the operations of auditory systems in nature; and enable a comparison of robotic auditory performance with those of natural auditory systems.

Acknowledgments

The author is supported at the Environmental Research Institute, North Highland College, University of the Highlands and Islands, by Kongsberg Underwater Mapping AS. I thank Kongsberg Underwater Mapping AS for covering the costs of publishing in open access. I thank two peer reviewers for their greatly appreciated comments and criticisms to help me improve my paper.

Conflicts of Interest

The author declares there to be no conflict of interest.

Appendix A. Trigonometrical Relationships in an Auditory System

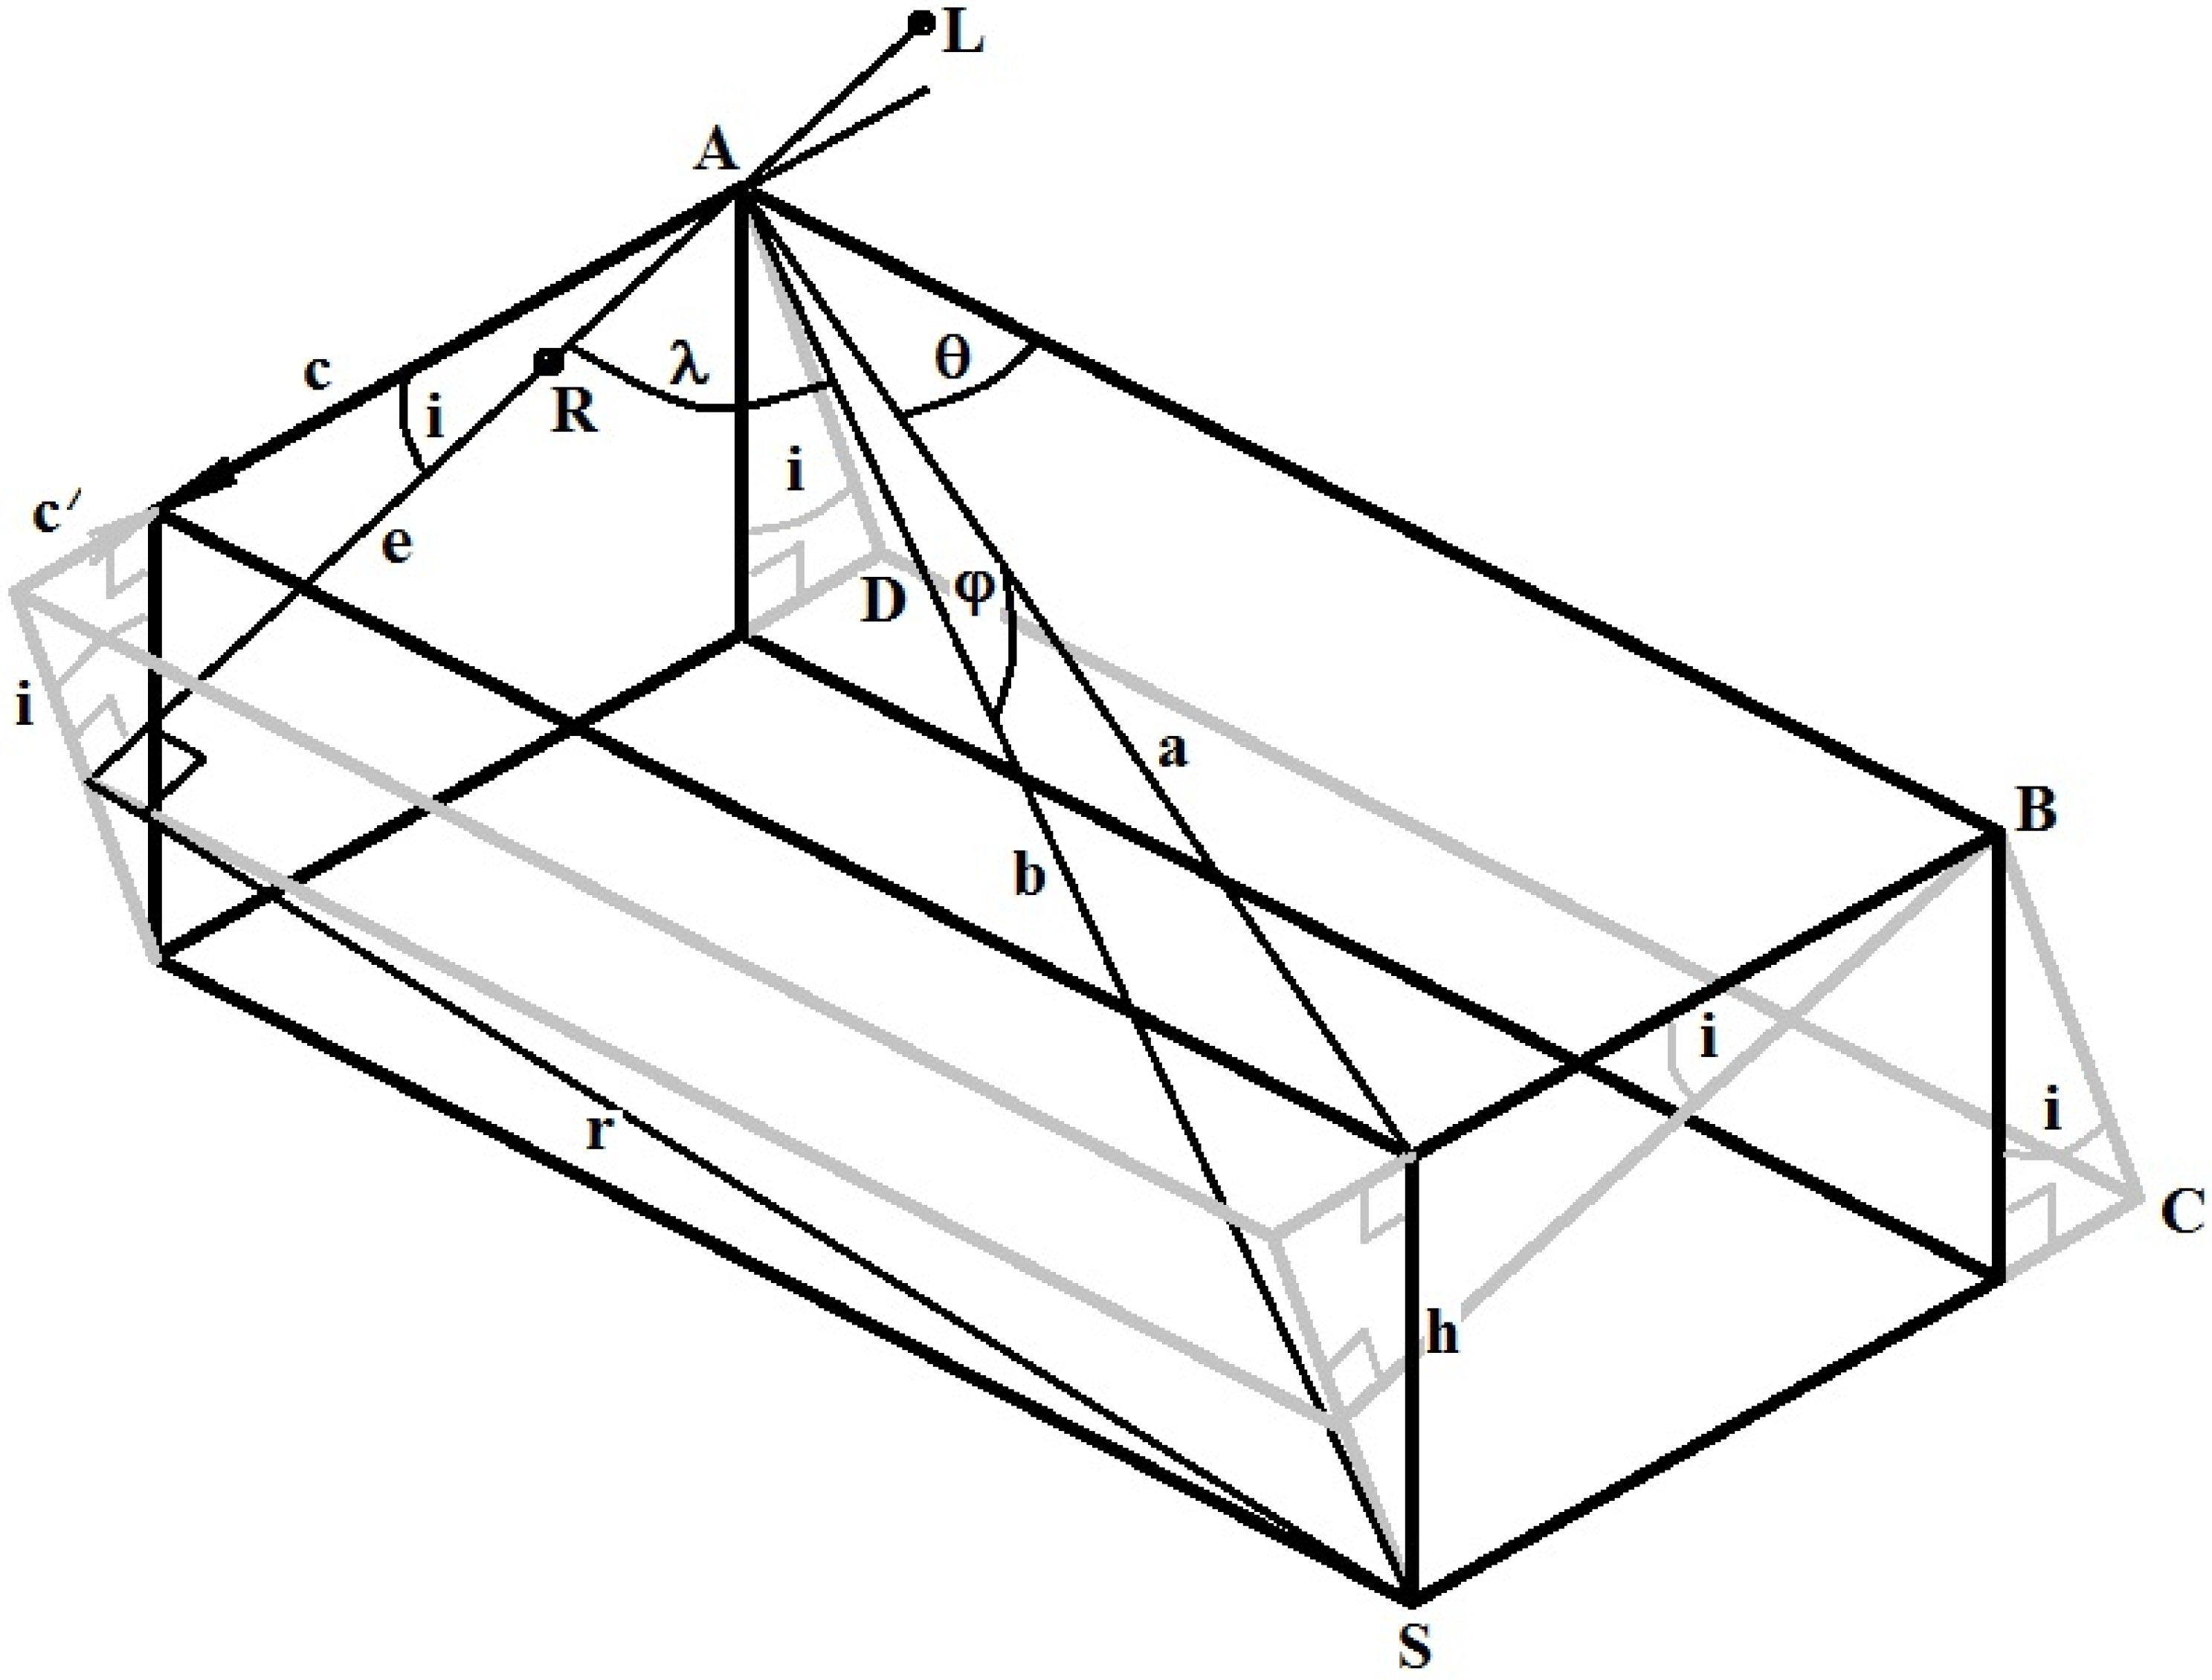
The geometry of an auditory system is illustrated in Figure A1, in which:
λ is the angle between the auditory axis (the straight line that passes through both ears) and the direction to an acoustic source;
θ is the lateral (longitudinal) angle to a source of sound to the right of the direction in which ahead is facing;
φ is the vertical (latitudinal) angle below the horizontal (with respect to the direction the head is facing) to an acoustic source; and
i is the inclination of the auditory axis to the right across the head.
Figure A1. Geometry of an auditory system. L schematically represents the position of the left ear, and R the position of the right ear. The line LR lies on the auditory axis of the ears. The line AB is a line in the direction the head is facing. The rectangle ABCD lies on the median plane, the plane normal to the auditory axis at the auditory center. S is the position of an acoustic source at an inclination angle φ and at a vertical distance h below the horizon.
Robotics 06 00003 g005

Appendix A.1. The Angle λ as a Function of Angles:   θ , φ and i :

A synthetic aperture computation process deployed in a binaural system, whether natural or machine, measures change in θ , and generates estimates for λ as a function of time as the head is turned, and from these determines the direction to acoustic sources. To generate simulated data for simple simulated experiments, we require an equation for λ in terms of θ and also φ and i .
From Figure A1:
tan φ = h / a       a = h / tan φ
sin φ = h / b       b = h / sin φ
sin θ = c / a       c = asin θ
tan i = c / h       c = h tan i
cos i = e / ( c + c )     e = ( c + c ) cos i
cos λ = e / b        λ = acos ( e / b )
Substituting Equations (A1)–(A5) in Equation (A6) yields:
  λ = acos ( sin θ cos i cos φ + sin i sin φ )
The derived relationship (Equation A7) is used to compute angles λ in the table in Figure 4.
For the special case in which there is no vertical offset between the ears, i = 0° (Figure 2), Equation (A7) reduces to:
  λ = acos ( cos θ cos φ )

Appendix A.2. The Angle θ when λ = 90° as a Function of Angles: φ and i

Setting λ to 90° in Equation (A7) and rearranging yields:
θ = asin ( tan i ·   tan φ )
This relationship is used to compute the angle θ for great circle 6 (violet) in the table in Figure 4.

Appendix B. Lamda Circle Plots in a Virtual Field of Audition for Display in Mercator Projection

This section provides practical implementation detail not covered in the main text, for the generation of the loci of lamda circle in charts of the virtual field of audition (e.g., Figure 2 and Figure 4).
Lamda circles may be constructed by first generating an array of points P , at say every degree of longitude, on the small circle of latitude of a sphere corresponding to a value for λ . Each point in the array can be rotated over the surface of the sphere using spherical geometric computation originally developed for rotating tectonic plate perimeters over a spherical surface in plate tectonic reconstructions (Dutch [62]). The points are rotated by an angle A , about a pole of rotation intersecting the sphere’s surface at point C , and plotting the transformed positions P in Mercator projection.
Adapting Dutch [62], the position of the pole of rotation at one of the points of its intersection with the surface of a unit radius sphere C , is described in terms of x y z Cartesian coordinates: C 1 , C 2 and C 3 ; for which, C 1 2 + C 2 2 + C 3 2 = 1 .
To convert a position in latitude and longitude to Cartesian coordinates:
C 1 = cos ( C l a t ) cos ( C l o n g )
C 2 = cos ( C l a t )   sin ( C l o n g )
C 3 = sin ( C l a t )
where
  • C l a t = 0.0 ;
  • C l o n g = θ ; and
  • θ is the azimuthal orientation of head with respect to some datum, e.g., grid/magnetic north, and north latitude and east longitude are positive.
The points P in latitude and longitude are converted to Cartesian coordinates in a similar way from:
P 1 = cos ( P l a t )   cos ( P l o n g )
P 2 = cos ( P l a t )   sin ( P l o n g )
P 3 = sin ( P l a t )
where
  • P l a t = π / 2     λ (to convert colatitude to latitude); and
  • P l o n g varies by say one degree between 0 and 2 π radians.
The transformed positions P , after rotation of points P over the surface of the sphere by angle A , with respect to the pole of rotation at C , are:
P 1 = P 1 cos ( A ) + ( 1 cos ( A ) ( C 1 C 1 P 1 + C 1 C 2 P 2 + C 1 C 3 P 3 ) + ( C 2 P 3 C 3 P 2 ) sin ( A )
P 2 = P 2 cos ( A ) + ( 1 cos ( A ) ( C 2 C 1 P 1 + C 2 C 2 P 2 + C 2 C 3 P 3 ) + ( C 3 P 1 C 1 P 3 ) sin ( A )
P 3 = P 3 cos ( A ) + ( 1 cos ( A ) ( C 3 C 1 P 1 + C 3 C 2 P 2 + C 3 C 3 P 3 ) + ( C 1 P 2 C 2 P 1 ) sin ( A )
where
  • A = i + π / 2 ; and
  • i is the slope of the auditory axis across the head (downslope to the right is positive).
To convert the transformed positions back to latitude and longitude:
P l a t = asin ( P 3 )
P l o n g = atan ( P 2 / P 1 )
To display the points P in Mercator projection, a transformation is applied in the vertical/latitudinal dimension:
Y m e r c a t o r = l o g ( tan ( π / 2   +   P l a t / 2 ) )

Appendix C. Synthetic Aperture Computation in Migration
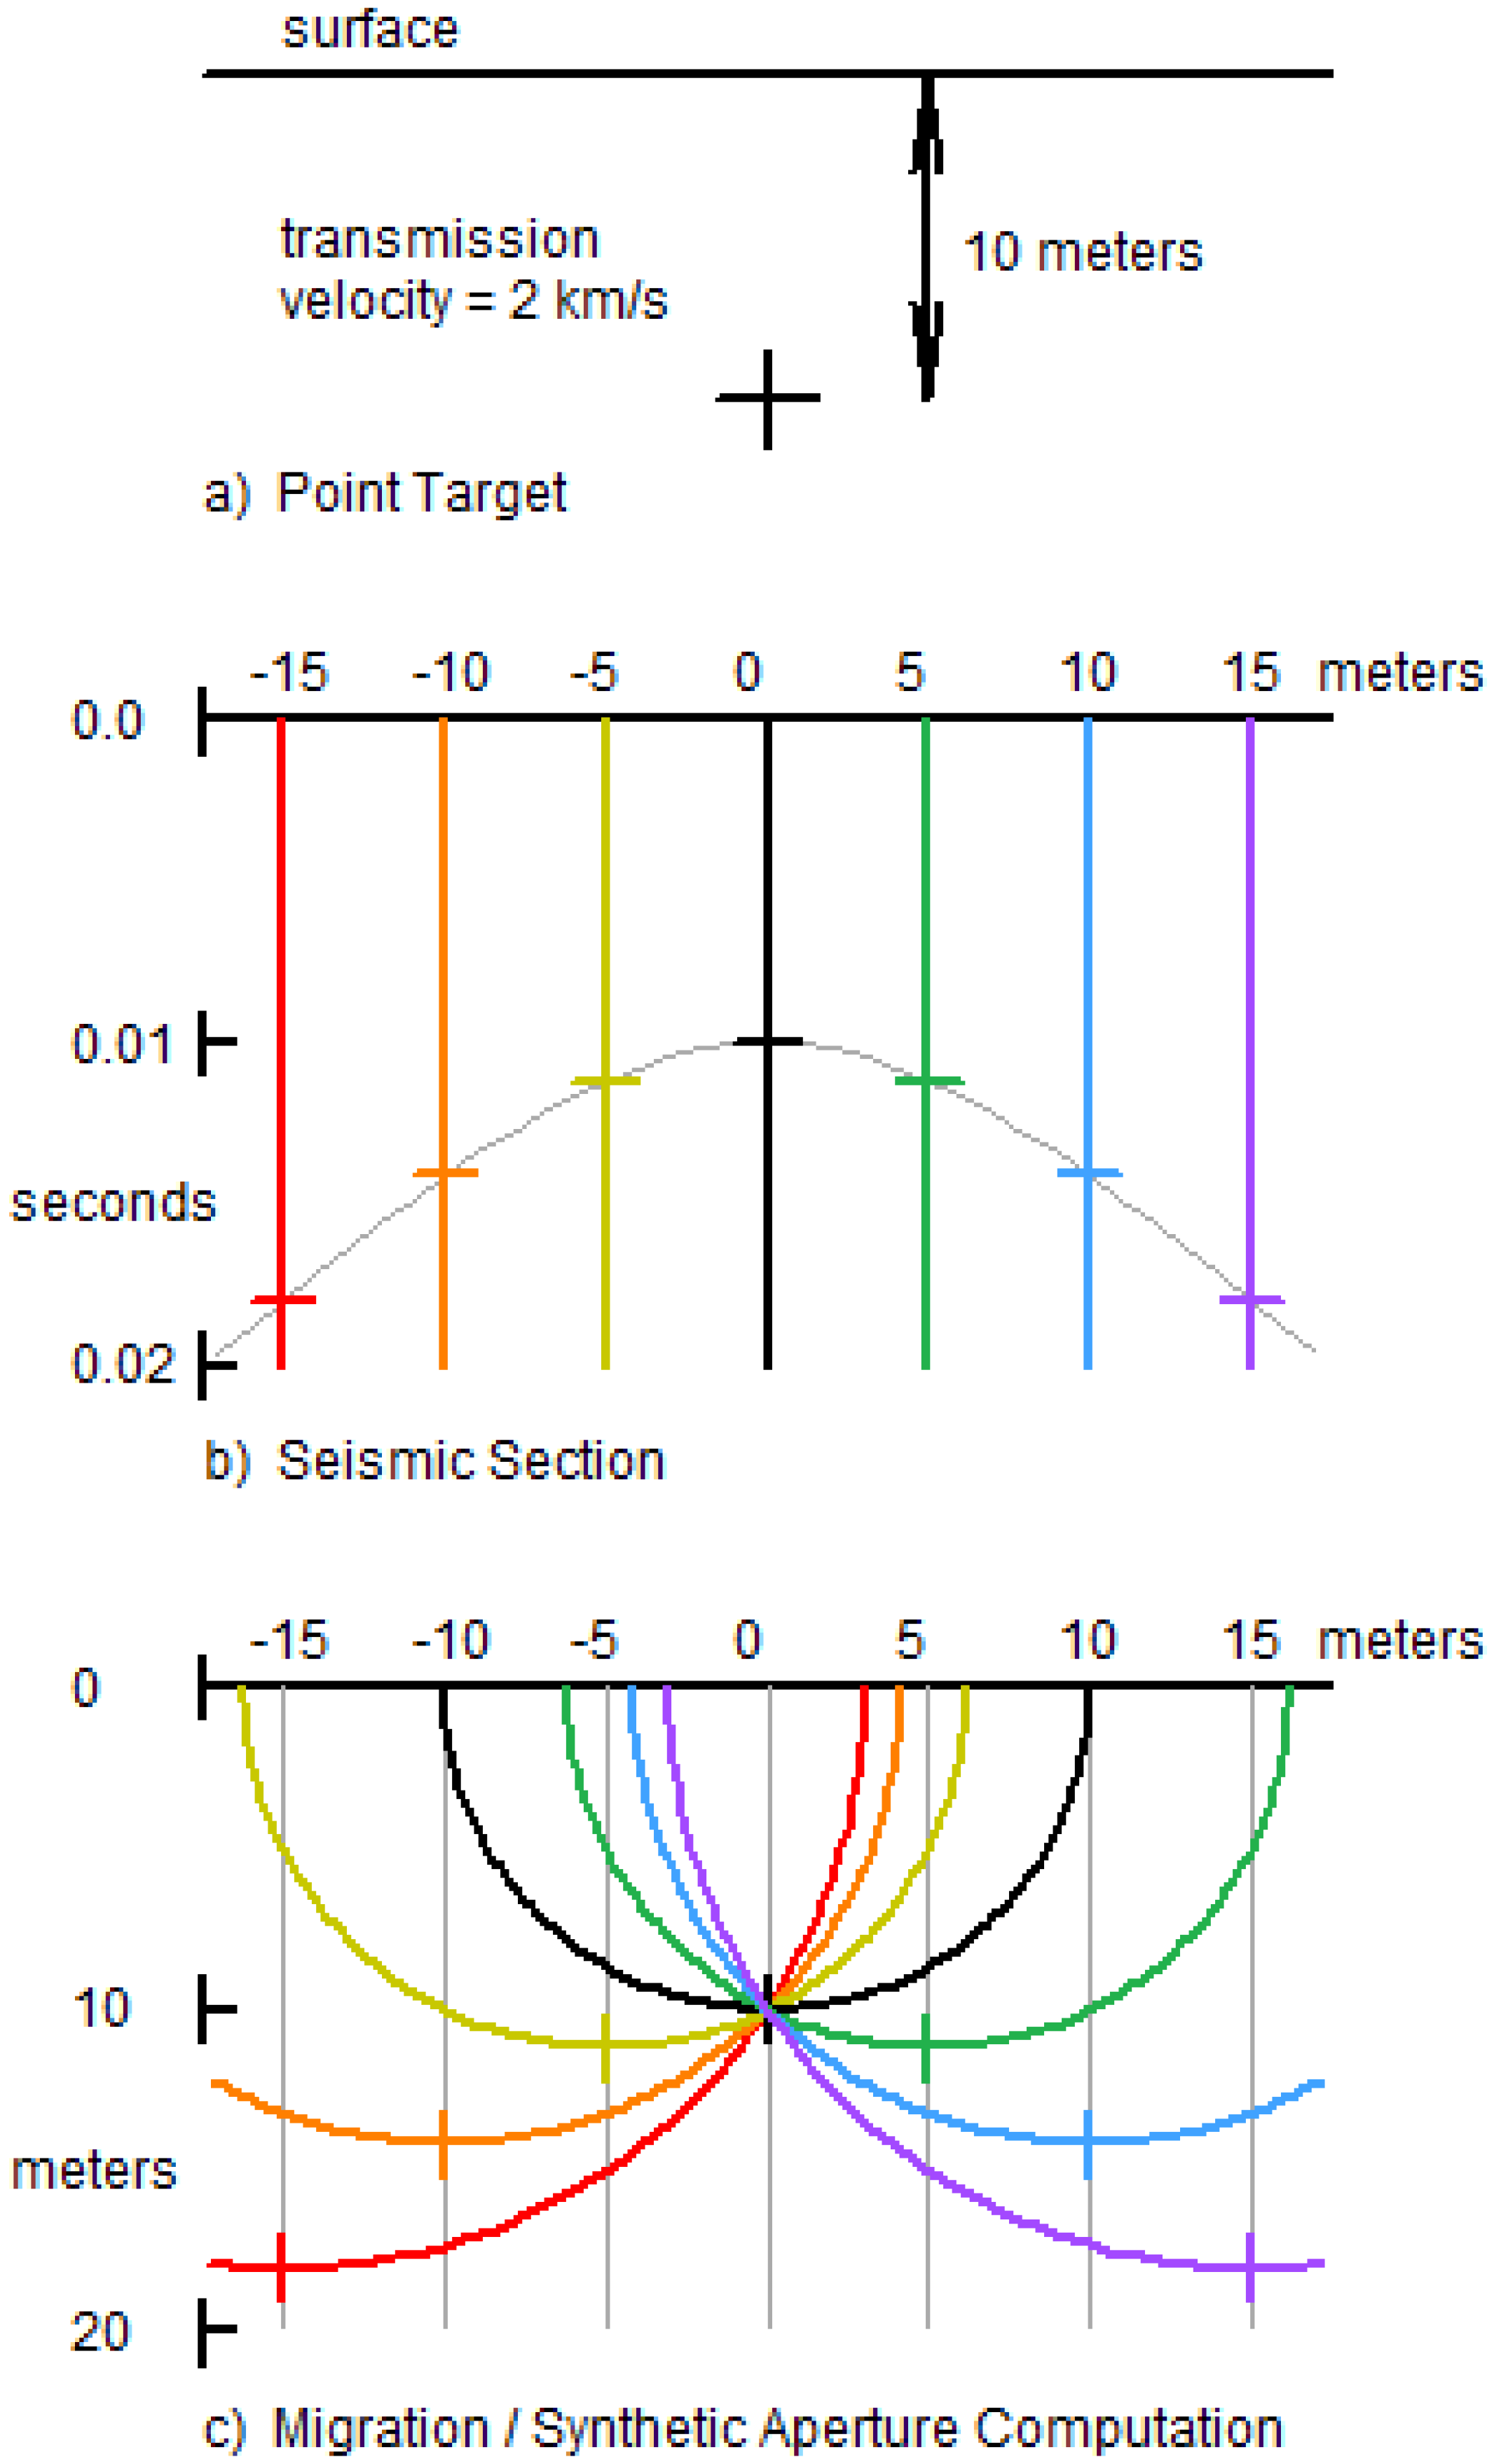
A synthetic aperture computation as it is more familiarly applied in the migration process applied to seismic profiler images is illustrated in Figure C1.
Some people have some familiarity with the effect of migration on seismic profiler images, in reducing hyperbolae in raw images to points in processed images, but are unfamiliar with the detail of the process behind the effect. Such people may not immediately recognize the synthetic aperture computation process inherent in Figure 2, Figure 3 and Figure 4. The purpose of this appendix is to demonstrate the essential similarity between the synthetic aperture computation as it applies in audition with the synthetic aperture computation in migration (and similarly also in synthetic aperture sonar and radar systems).
Figure C1a illustrates a point target buried at a depth of 10 m in an otherwise seismically isotropic medium having a P wave transmission velocity of 2 km·s−1.
Consider a simple seismic profiling system in which a seismic source and geophone are co-located and are moved over a buried object to record seismic traces at 5 m intervals. The colored lines in Figure C1b represent the seismic profiler traces, and the collection of traces represents an unprocessed seismic section. The point target registers on the raw traces at times corresponding to equal two-way travel times between the geophone and the target. The target appears on the raw seismic section as a hyperbola.
Figure C1c illustrates the synthetic aperture computation carried out to perform migration. All non-zero amplitudes on all trace are distended over circular arcs in a migrated section, and the values over the arcs are integrated at all points in the migrated section. For a large number of traces, constructive/destructive interference in the migrated section leads to hyperbolae in the raw seismic section associated with point targets, collapsing to points in the migrated section where circular arcs carrying distended data intersect.
Note the essential similarity between Figure C1c illustrating the synthetic aperture computation behind the migration process applied in seismic image processing, and Figure 2 and Figure 4 illustrating synthetic aperture computation in binaural direction finding as the head is turned.
In applying a synthetic aperture computation in seismic profiling and synthetic aperture sonar (SAS) and radar (SAR), a circular arc is generated for each point on each trace, in which traces are distributed as a function of distance along a profile or swath. In synthetic aperture audition (SAA), a circular arc is generated as a function of the angle the head is turned with respect to some longitudinal datum (e.g., the longitudinal position of an acoustic source). For SAA a “raw image” analogous to the raw seismic image in Figure C1b could be generated by drawing a graph of “difference in arrival times   Δ t , or travel distances   f d , at the ears”, against “angle   θ (the lateral angle of the head with respect to some longitudinal datum)” (e.g., graphs of   f against   θ using the data in Figure 2 and Figure 3). The locus of acoustic sources in such graphs is analogous to hyperbolae associated with a point targets in a raw seismic or sonar/radar image.
Figure C1. Illustration of synthetic aperture computation as it is more familiarly encountered in the process of migration applied to seismic profiler sections. (a) A point target buried in an otherwise seismically isotropic medium. (b) The colored lines represent seismic profiler traces. The collection of traces represents a seismic section. The point target registers on the unprocessed seismic section as a hyperbola. (c) The synthetic aperture computation/migration process. Non-zero amplitudes on each trace are distended over circular arcs and integrated into a migrated section. For a large number of traces, a hyperbola in the raw seismic section collapses to a point in the migrated section.
Robotics 06 00003 g006

References

  1. Wallach, H. The role of head movement and vestibular and visual cues in sound localisation. J. Exp. Psychol. 1940, 27, 339–368. [Google Scholar] [CrossRef]
  2. Pace, N.G.; Gao, H. Swathe seabed classification. IEEE J. Ocean. Eng. 1988, 13, 83–90. [Google Scholar] [CrossRef]
  3. Tamsett, D. Characterisation and classification of the sea-floor from power-spectra of side-scan sonar traces. Mar. Geophys. Res. 1993, 15, 43–64. [Google Scholar] [CrossRef]
  4. Mills, A.W. On the minimum audible angle. J. Acoust. Soc. Am. 1958, 30, 237–246. [Google Scholar] [CrossRef]
  5. Brughera, A.; Danai, L.; Hartmann, W.M. Human interaural time difference thresholds for sine tones: The high-frequency limit. J. Acoust. Soc. Am. 2013, 133, 2839. [Google Scholar] [CrossRef] [PubMed]
  6. Wightman, F.L.; Kistler, D.J. The dominant role of low frequency interaural time differences in sound localization. J. Acoust. Soc. Am. 1992, 91, 1648–1661. [Google Scholar] [CrossRef] [PubMed]
  7. Sayers, B.M.A.; Cherry, E.C. Mechanism of binaural fusion in the hearing of speech. J. Acoust. Soc. Am. 1957, 36, 923–926. [Google Scholar] [CrossRef]
  8. Jeffress, L.A.A. A place theory of sound localization. J. Comp. Physiol. Psychol. 1948, 41, 35–39. [Google Scholar] [CrossRef] [PubMed]
  9. Colburn, H.S. Theory of binaural interaction based on auditory-nerve data. 1. General strategy and preliminary results in interaural discrimination. J. Acoust. Soc. Am. 1973, 54, 1458–1470. [Google Scholar] [CrossRef] [PubMed]
  10. Kock, W.E. Binaural localization and masking. J. Acoust. Soc. Am. 1950, 22, 801–804. [Google Scholar] [CrossRef]
  11. Durlach, N.I. Equalization and cancellation theory of binaural masking-level differences. J. Acoust. Soc. Am. 1963, 35, 1206–1218. [Google Scholar] [CrossRef]
  12. Licklider, J.C.R. Three auditory theories. In Psychology: A Study of a Science; Koch, S., Ed.; McGraw-Hill: New York, NY, USA, 1959; pp. 41–144. [Google Scholar]
  13. Perrett, S.; Noble, W. The effect of head rotations on vertical plane sound localization. J. Acoust. Soc. Am. 1997, 102, 2325–2332. [Google Scholar] [CrossRef] [PubMed]
  14. Wightman, F.L.; Kistler, D.J. Resolution of front-back ambiguity in spatial hearing by listener and source movement. J. Acoust. Soc. Am. 1999, 105, 2841–2853. [Google Scholar] [CrossRef] [PubMed]
  15. Iwaya, Y.; Suzuki, Y.; Kimura, D. Effects of head movement on front-back error in sound localization. Acoust. Sci. Technol. 2003, 24, 322–324. [Google Scholar] [CrossRef]
  16. Kato, M.; Uematsu, H.; Kashino, M.; Hirahara, T. The effect of head motion on the accuracy of sound localization. Acoust. Sci. Technol. 2003, 24, 315–317. [Google Scholar] [CrossRef]
  17. McAnally, K.I.; Russell, L.M. Sound localization with head movement: Implications for 3-D audio displays. Front. Neurosci. 2014, 8, 1–6. [Google Scholar] [CrossRef] [PubMed]
  18. Roffler, S.K.; Butler, R.A. Factors that influence the localization of sound in the vertical plane. J. Acoust. Soc. Am. 1968, 43, 1255–1259. [Google Scholar] [CrossRef] [PubMed]
  19. Batteau, D. The role of the pinna in human localization. Proc. R. Soc. Lond. B Biol. Sci. 1967, 168, 158–180. [Google Scholar] [CrossRef] [PubMed]
  20. Middlebrooks, J.C.; Makous, J.C.; Green, D.M. Directional sensitivity of sound-pressure levels in the human ear canal. J. Acoust. Soc. Am. 1989, 86, 89–108. [Google Scholar] [CrossRef] [PubMed]
  21. Rodemann, T.; Ince, G.; Joublin, F.; Goerick, C. Using binaural and spectral cues for azimuth and elevation localization. In Proceedings of IEEE/RSJ International Conference on Intelligent Robots and Systems, Nice, France, 22–26 September 2008; pp. 2185–2190.
  22. Norberg, R.A. Independent evolution of outer ear asymmetry among five owl lineages; morphology, function and selection. In Ecology and Conservation of Owlss; Newton, I., Kavanagh, J., Olsen, J., Taylor, I., Eds.; CSIRO Publishing: Victoria, Australia, 2002; pp. 229–342. [Google Scholar]
  23. Norberg, R.A. Occurrence and independent evolution of bilateral ear asymmetry in owls and implications on owl taxonomy. Phil. Trans. Roy. Soc. Lond. Ser. B. 1977, 280, 375–408. [Google Scholar] [CrossRef]
  24. Norberg, R.A. Skull asymmetry, ear structure and function, and auditory localization in Tengmalmt Owl, Aegolius funereus (Linne). Phil. Trans. Roy. Soc. Lond. Ser. B. 1978, 282, 325–410. [Google Scholar] [CrossRef]
  25. Lollmann, H.W.; Barfus, H.; Deleforge, A.; Meier, S.; Kellermann, W. Challenges in acoustic signal enhancement for human-robot communication. In Proceedings of the ITG Conference on Speech Communication, Erlangen, Germany, 24–26 September 2014.
  26. Takanishi, A.; Masukawa, S.; Mori, Y.; Ogawa, T. Development of an anthropomorphic auditory robot that localizes a sound direction. Bull. Cent. Inf. 1995, 20, 24–32. (In Japanese) [Google Scholar]
  27. Matsusaka, Y.; Tojo, T.; Kuota, S.; Furukawa, K.; Tamiya, D.; Nakano, Y.; Kobayashi, T. Multi-person conversation via multi-modal interface—A robot who communicates with multi-user. In Proceedings of 16th National Conference on Artificial Intelligence (AAA1–99), Orlando, Florida, 18–22 July 1999; pp. 768–775.
  28. Ma, N.; Brown, G.J.; May, T. Robust localisation of multiple speakers exploiting deep neural networks and head movements. In Proceedings of INTERSPEECH 2015, Dresden, Germany, 6–10 September 2015; pp. 3302–3306.
  29. Schymura, C.; Winter, F.; Kolossa, D.; Spors, S. Binaural sound source localization and tracking using a dynamic spherical head model. In Proceedings of the INTERSPEECH 2015, Dresden, Germany, 6–10 September 2015; pp. 165–169.
  30. Winter, F.; Schultz, S.; Spors, S. Localisation properties of data-based binaural synthesis including translator head-movements. In Proceedings of the Forum Acusticum, Krakow, Poland, 7–12 September 2014.
  31. Bustamante, G.; Portello, A.; Danes, P. A three-stage framework to active source localization from a binaural head. In Proceedings of the IEEE International Conference on Acoustics, Speech and Signal Processing (ICASSP), Brisbane, Australia, 19–24 April 2015; pp. 5620–5624.
  32. May, T.; Ma, N.; Brown, G. Robust localisation of multiple speakers exploiting head movements and multi-conditional training of binaural cues. In Proceedings of IEEE International Conference on Acoustics, Speech and Signal Processing (ICASSP), Brisbane, Australia, 19–24 April 2015; pp. 2679–2683.
  33. Ma, N.; May, T.; Wierstorf, H.; Brown, G. A machine-hearing system exploiting head movements for binaural sound localisation in reverberant conditions. In Proceedings of the IEEE International Conference on Acoustics, Speech and Signal Processing (ICASSP), Brisbane, Australia, 19–24 April 2015; pp. 2699–2703.
  34. Nakadai, K.; Lourens, T.; Okuno, H.G.; Kitano, H. Active audition for humanoids. In Proceedings of the 17th National Conference Artificial Intelligence (AAAI-2000), Austin, TX, USA, 30 July–3 August 2010; pp. 832–839.
  35. Cech, J.; Mittal, R.; Delefoge, A.; Sanchez-Riera, J.; Alameda-Pineda, X. Active speaker detection and localization with microphone and cameras embedded into a robotic head. In Proceedings of the IEEE-RAS International Conference on Humanoid Robots (Humanoids), Atlanta, GA, USA, 15–17 October 2013; pp. 203–210.
  36. Deleforge, A.; Drouard, V.; Girin, L.; Horaud, R. Mapping sounds on images using binaural spectrograms. In Proceedings of the European Signal Processing Conference, Lisbon, Portugal, 1–5 September 2014; pp. 2470–2474.
  37. Nakamura, K.; Nakadai, K.; Asano, F.; Ince, G. Intelligent sound source localization and its application to multimodal human tracking. In Proceedings of the IEEE/RSJ International Conference on Intelligent Robots and Systems, San Francisco, CA, USA, 25–30 September 2011; pp. 143–148.
  38. Yost, W.A.; Zhong, X.; Najam, A. Judging sound rotation when listeners and sounds rotate: Sound source localization is a multisystem process. J. Acoust. Soc. Am. 2015, 138, 3293–3310. [Google Scholar] [CrossRef] [PubMed]
  39. Kim, U.H.; Nakadai, K.; Okuno, H.G. Improved sound source localization in horizontal plane for binaural robot audition. Appl. Intell. 2015, 42, 63–74. [Google Scholar] [CrossRef]
  40. Rodemann, T.; Heckmann, M.; Joublin, F.; Goerick, C.; Scholling, B. Real-time sound localization with a binaural head-system using a biologically-inspired cue-triple mapping. In Proceedings of the IEEE/RSJ International Conference on Intelligent Robots and Systems, Beijing, China, 9–15 October 2006; pp. 860–865.
  41. Portello, A.; Danes, P.; Argentieri, S. Acoustic models and Kalman filtering strategies for active binaural sound localization. In Proceedings of the IEEE/RSJ International Conference on Intelligent Robots and Systems, San Francisco, CA, USA, 25–30 September 2011; pp. 137–142.
  42. Sun, L.; Zhong, X.; Yost, W. Dynamic binaural sound source localization with interaural time difference cues: Artificial listeners. J. Acoust. Soc. Am. 2015, 137, 2226. [Google Scholar] [CrossRef]
  43. Zhong, X.; Sun, L.; Yost, W. Active binaural localization of multiple sound sources. Robot. Auton. Syst. 2016, 85, 83–92. [Google Scholar] [CrossRef]
  44. Stern, R.; Brown, G.J.; Wang, D.L. Binaural sound localization. In Computational Auditory Scene Analysis; Wang, D.L., Brown, G.L., Eds.; John Wiley and Sons: Hoboken, NJ, USA, 2005; pp. 1–34. [Google Scholar]
  45. Nakadai, K.; Okuno, H.G.; Kitano, H. Robot recognizes three simultaneous speech by active audition. In Proceedings of the ICRA/IEEE International Conference on Robotics and Automation, Taipel, Taiwan, 14–19 September 2003; pp. 398–405.
  46. Lurton, X. Seafloor-mapping sonar systems and Sub-bottom investigations. In An Introduction to Underwater Acoustics: Principles and Applications, 2nd ed.; Springer: Berlin, Germany, 2010; pp. 75–114. [Google Scholar]
  47. Claerbout, J.F. Imaging the Earth’s Interior; Blackwell Science Ltd.: Oxford, UK, 1985. [Google Scholar]
  48. Yilmaz, O. Seismic Data Processing; Society of Exploration Geophysics: Tulsa, OK, USA, 1987. [Google Scholar]
  49. Scales, J.A. Theory of Seismic Imaging; Colarado School of Mines, Samizdat Press: Golden, CO, USA, 1994. [Google Scholar]
  50. Biondi, B.L. 3D Seismic Imaging; Society of Exploration Geophysics: Tulsa, OK, USA, 2006. [Google Scholar]
  51. Cutrona, L.J. Comparison of sonar system performance achievable using synthetic aperture techniques with the performance achievable with conventional means. J. Acoust. Soc. Am. 1975, 58, 336–348. [Google Scholar] [CrossRef]
  52. Cutrona, L.J. Additional characteristics of synthetic-aperture sonar systems and a further comparison with nonsynthetic-aperture sonar systems. J. Acoust. Soc. Am. 1977, 61, 1213–1217. [Google Scholar] [CrossRef]
  53. Oliver, C.; Quegan, S. Understanding Synthetic Aperture Radar Images; Artech House: Boston, MA, USA, 1998. [Google Scholar]
  54. Bellettini, A.; Pinto, M.A. Theoretical accuracy of synthetic aperture sonar micro navigation using a displaced phase-center antenna. IEEE J. Ocean. Eng. 2002, 27, 780–789. [Google Scholar] [CrossRef]
  55. Hagen, P.E.; Hansen, R.E. Synthetic aperture sonar on AUV—Making the right trade-offs. J. Ocean Technol. 2011, 6, 17–22. [Google Scholar]
  56. Griffin, D.R. Listening in the Dark; Yale University Press: New York, NY, USA, 1958. [Google Scholar]
  57. Chesterman, W.D.; Clynick, P.R.; Stride, A.H. An acoustic aid to sea-bed survey. Acustica 1958, 8, 285–290. [Google Scholar]
  58. Au, W.W.L. The Sonar of Dolphins; Springer: New York, NY, USA, 1993. [Google Scholar]
  59. Au, W.W.L.; Simmons, J.A. Echolocation in dolphins and bats. Phys. Today 2007, 60, 40–45. [Google Scholar] [CrossRef]
  60. Dawkins, R. Chapter 2—Good design. In The Blind Watchmaker; Penguin Books: London, UK, 1986. [Google Scholar]
  61. Tamsett, D.; McIlvenny, J.; Watts, A. Colour sonar: Multi-frequency sidescan sonar images of the seabed in the Inner Sound of the Pentland Firth, Scotland. J. Mar. Sci. Eng. 2016, 4, 26. [Google Scholar] [CrossRef]
  62. Dutch, S. Rotation on a Sphere. 1999. Available online: https://www.uwgb.edu/dutchs/MATHALGO/sphere0.htm (accessed on 14 February 2017).
Figure 1. Top view of left (L) and right (R) ears receiving incoming horizontal sound rays from a distant acoustic source. The line LR lies on the auditory axis. The figure illustrates a far-field approximation, in which the distance from an acoustic source is much greater than the distance between the ears, and the two rays incident on the ears are parallel. The relationship between the radius of a spherical surface and the radius of a lamda circle of colatitude (grey lines) is illustrated.
Robotics 06 00003 g001
Figure 2. Lamda small circles of colatitude plotted in a virtual field of audition shown as a chart in Mercator projection for θ = 0 ° after the head has turned from θ = 90 ° (in Δ θ = 22.5 ° intervals) for an acoustic source at an inclination angle φ = −30° from horizontal. The figure illustrates a synthetic aperture computation process by which the direction to an acoustic source may be determined. With the source laterally situated at one of the angles θ to the right from the direction the head is facing, the source is ambiguously located on the corresponding circle. Maxima in acoustic energy integrated over all circles in the virtual field of audition as the head is turned constrain the location of the source to one of the two points of intersection of the circles.
Robotics 06 00003 g002
Figure 3. This shows in top view the relationship between the orientation of the head and the lamda circles of colatitude (1–5) on a spherical surface centered at the center of audition (C). The position of the left ear is labeled L, the right ear, R, and the location of the acoustic source, S. The azimuthal component of the angles between the directions the head is facing, and the direction to the source (Figure 2), are labeled. The lamda circles for all five positions of the head are shown together in the bottom right.
Robotics 06 00003 g003
Figure 4. Lamda circles in a virtual field of audition shown as a chart in Mercator projection in which the auditory axis is inclined at i = 20° to the right across the head (as for example in species of owl) for θ = 12.1 ° after the head has turned from θ = 90 ° (in Δ θ = 22.5 ° intervals) for a sound source φ = 30° from the horizon. As the head is turned, the plane in which the auditory axis rotates continuously changes allowing the integration of sound energy over all the circles to unambiguously locate the source of sound at the single point of intersection.
Robotics 06 00003 g004