Article

Room Volume Estimation Based on Ambiguity of Short-Term Interaural Phase Differences Using Humanoid Robot Head †

1
College of Industrial Technology, Nihon University, Tokyo 275-8575, Japan
2
System Research Division Image Information Systems Laboratory, Canon Electronics Inc., Tokyo 105-0011, Japan
*
Author to whom correspondence should be addressed.
This paper is an extended version of our paper published in Proceedings of the 23rd International Conference on Robotics in Alpe-Adria-Danube Region (RAAD), Smolenice, Slovakia, 3–5 September 2014.
Robotics 2016, 5(3), 16; https://doi.org/10.3390/robotics5030016
Submission received: 16 June 2016 / Revised: 14 July 2016 / Accepted: 14 July 2016 / Published: 21 July 2016

Abstract

:
Humans can recognize approximate room size using only binaural audition. However, sound reverberation is not negligible in most environments. The reverberation causes temporal fluctuations in the short-term interaural phase differences (IPDs) of sound pressure. This study proposes a novel method for a binaural humanoid robot head to estimate room volume. The method is based on the statistical properties of the short-term IPDs of sound pressure. The humanoid robot turns its head toward a sound source, recognizes the sound source, and then estimates the ego-centric distance by its stereovision. By interpolating the relations between room volume, average standard deviation, and ego-centric distance experimentally obtained for various rooms in a prepared database, the room volume was estimated by the binaural audition of the robot from the average standard deviation of the short-term IPDs at the estimated distance.

Graphical Abstract

1. Introduction

An autonomous robot needs to know its actual location, orientation, and surrounding environment in order to turn around or otherwise move safely in unregulated environments. The robot can localize its position visually in a well-regulated environment, in which every object is recognized by its position. A monitoring system may send the robot much information on the surrounding environment either manually or automatically by networked sensors. In unregulated environments, such as those destroyed by disaster, or when sensors are malfunctioning, visual information is not enough. However, an additional acoustic sensing system could provide the robot with a redundant way for recognizing its location and changes in the environment.
It is well known that a humanoid robot can adapt easily to human living environments due to its physical shape, size, and appearance. The audition of humanoid robots has conventionally been an array system and not a binaural system. As an example of an array system, multiple lightweight microphones are mounted on the head of humanoid robots ASIMO (Advanced Steps in Innovative Mobility) and HRP-2 (Humanoid Robotics Project-2) [1,2]. Multiple microphones are necessary for realizing multiple acoustical functions. In conventional design, the number of microphones and the algorithm are selected before developing the hardware. Since humans can recognize approximate room size by only binaural hearing, this work examines the possibility of binaural audition for room volume estimation by a humanoid robot, in a reverse approach from hardware design. Binaural audition is a kind of biologically inspired approach.
To estimate the volume of a room, impulse room response has conventionally been used. Reverberation time, which is related to room volume, is calculated from the damping characteristic of the impulse response measured by one microphone in a room [3,4]. Binaural room impulse response can also be used [5,6,7,8,9]. The conventional impulse room response is actively detected, so the measurement is noisy and interferes with our living environments. Binaural audition is passively detected and does not interfere with our environments.
Studies on sound source localization and distance or trajectory estimation from binaural signals have been reported [10,11,12]. Sound reverberation is not negligible in reverberation environments such as an enclosed space (except for an anechoic room), since reverberation comprises significant components of the received signal. The ratio of energies of direct and reflected sound depends on the perceived distance of a sound source [13,14,15,16,17]. In psychophysical experiments, the effect of reflected sound on received sound depended on the positions of the sound source and the receiver in a room. The absolute position or trajectory of the sound source in a room has usually been the focus of the estimation.
The reverberation causes temporal fluctuations in short-term interaural phase differences (IPDs) and interaural level differences (ILDs) [8,11]. The statistical properties of the received sound signal have been studied for sound source location classification and distance estimation [11,18,19]. Hu et al. discussed the influence of amplitude variation of non-stationary sound sources on the distribution pattern of IPDs and ILDs when short-term Fourier transform is used [18]. Their method is invalid in an unknown room or a changing environment. Georganti et al. proposed a method for binaural distance estimation of a sound source from a voice sound [11]. The accuracy of the estimation decreased in a shorter time frame. Reverberation degrades the repeatability of measurement due to the temporal fluctuations in short-term IPDs and ILDs. No algorithm based on unrepeatable data has yet produced satisfactory results. Though a shorter time frame is valid for conducting temporal measurements, unrepeatable data are inadequate for exact measurement.
In this study, a novel method for estimating the room volume is proposed. The proposed method is based on the statistical properties of short-term IPDs of sound pressure and uses a binaural humanoid robot. The time frame adapted is less than 1 s. In this short time frame, the accuracy of estimation decreases in the conventional method. The temporal fluctuation in short-term IPDs in rooms is evaluated as the average standard deviation. The humanoid robot turns its head toward a sound source, recognizes the object of the sound source, and then estimates the ego-centric distance to the object. Ego-centric means that the robot is always at the origin of the local coordinates. The relative distance between the robot at the origin of the local coordinates and the sound source in a room is utilized for estimating room volume. The absolute locations of the robot and sound source in a room are not the focus of this study. The room volume is estimated from the average standard deviation of short-term IPDs at the estimated distance by interpolating the data in a prepared database. The database contains the relations between room volume, average standard deviation, and ego-centric distance experimentally obtained for various rooms. When the acoustical properties that relate only to the room volume can be detected, the robot can identify various environments. This method may be a solution for recognizing unknown or changed environments where no information on the environment is available.
In Section 2, the methods and procedures are presented. The ego-centric distance by robot vision and the statistical properties of sound by robot audition are described. A procedure for evaluating the statistical properties of IPDs is described. Other procedures include localizing the sound source, rotating the robot head toward the sound source, and preparing the database. The experimental measuring system is also described, which consists of eight room measurements and volumes. The statistical properties of IPDs in a short-term frequency analysis are shown in Section 3. The prepared database and the results of room volume estimations in unknown rooms are shown. The effect of surrounding obstacles on the room volume estimation is described. In Section 4, experimental results are discussed in comparison with the results of conventional methods. Finally, in Section 5, a summary is given.

2. Methods and Procedures

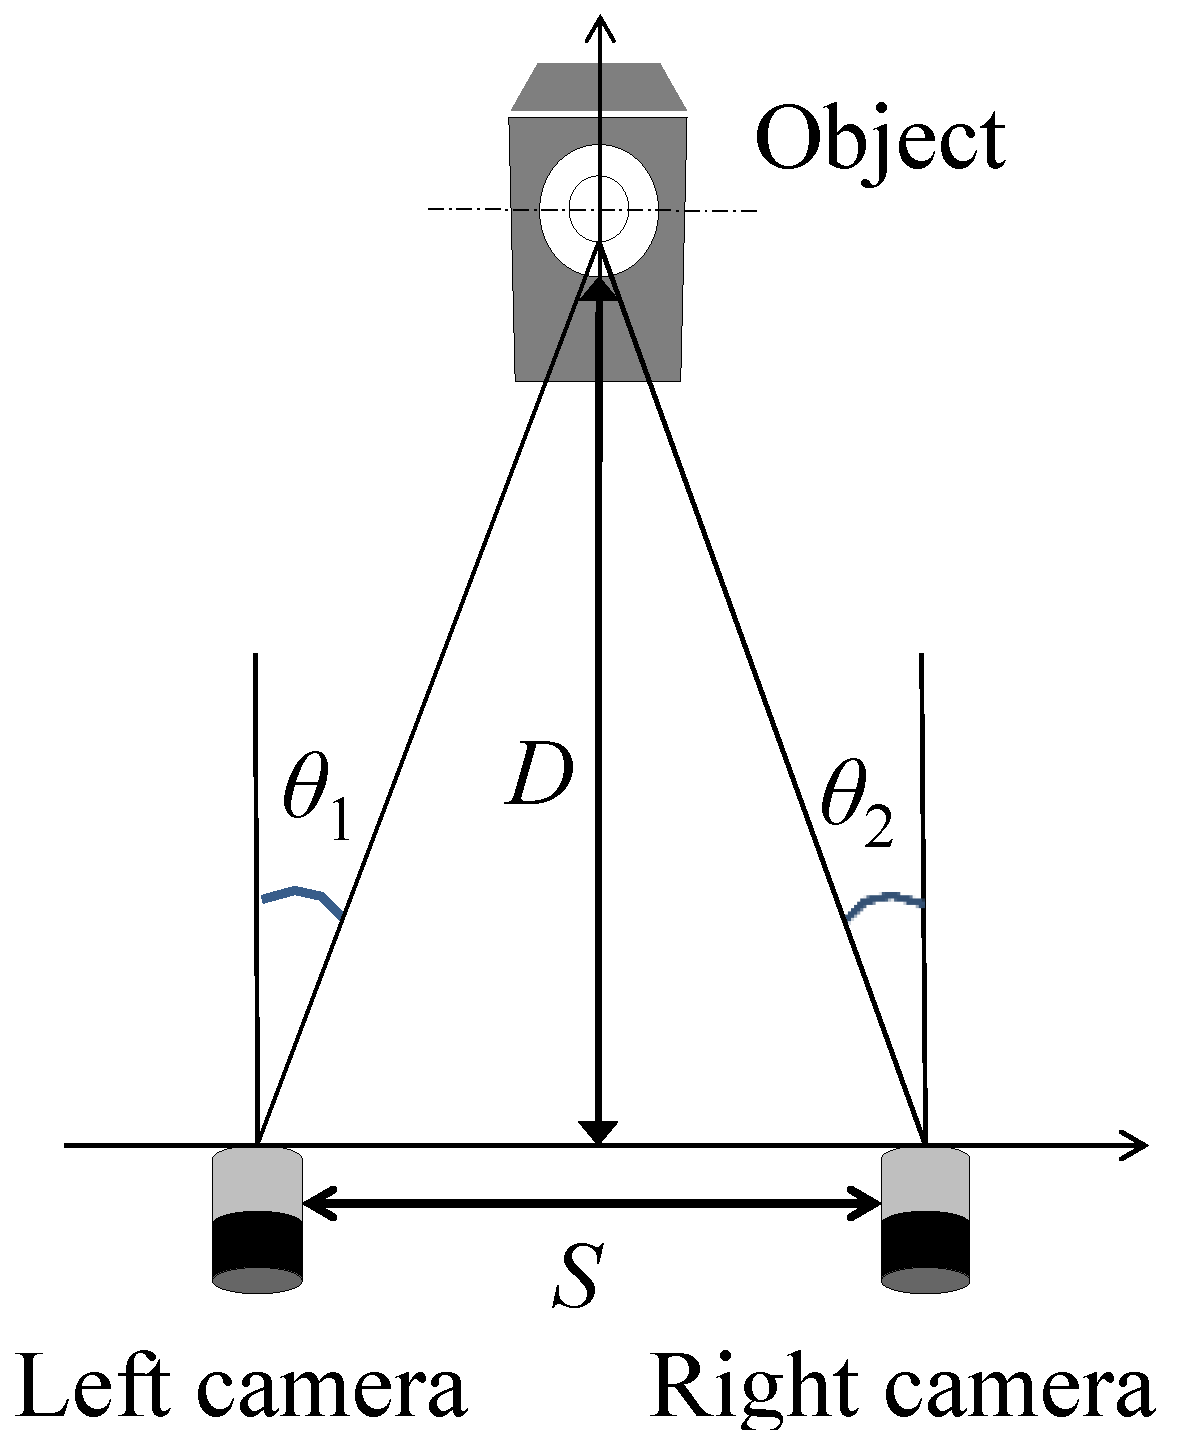
2.1. Ego-Centric Distance Estimation by Robot Vision

Figure 1 shows the geometry of a humanoid robot head and a loudspeaker in a reverberation room. The ego-centric distance D to the loudspeaker is estimated by robot vision provided by two cameras.
The geometry of the two cameras mounted in the robot head and the object is shown in Figure 2. The distance from the center point between the two cameras to the object is defined as the ego-centric distance. It should be emphasized that Figure 2 shows no absolute location in the room. The object, which is the sound source, is detected by each camera.
In Figure 2, the two visual angles for the object are θ1 and θ2, and distance D is given by
D = S tan θ 1 + tan θ 2
where S is the distance between the two cameras. Each visual angle is calculated as the difference between the center of the graphical image and the center position of the object recognized in the same image. The accuracy of ego-centric distance D decreases with decreasing distance between the two cameras. The absolute difference ε between θ1 and θ2 is expressed as
ε = | θ 1 θ 2 |
If θ1 = θ2, the object is positioned at the same distance from each camera. The robot can rotate its head horizontally to minimize Equation (2). The robot can also adjust its head vertically to match the center of the object to the vertical center of the image. To find the exact center position of the object, the object pattern is calculated by a geometry matching algorithm [20]. The center position of the object is defined as the center of the matched template. The error of the object position in the graphical image may significantly affect the ego-centric distance estimation. Several template patterns photographed at various distances are used and the best matching template is selected automatically for calculating the precise object position in the graphical image. The estimated distance D is corrected at several measuring positions by comparing with true distances, so that the error of the estimated ego-centric distance is below 0.02 m over the range from 0.5 m to 1.5 m for “ε < 0.5 degrees”.

2.2. Estimation of Statistical Properties of Sound by Binaural Audition

Two acoustical signals, x(t) and y(t), are detected with two microphones. The cross-power spectrum G12 is expressed as
G 12 = X ( f ) Y ( f ) *
where X(f) and Y(f) are the respective spectra after discrete Fourier transform (DFT) processing and * indicates the complex conjugate [20].
The phase of G12 (IPD) is expressed as
G 12 = ( X ( f ) Y * ( f ) )
Figure 3a shows a sample of the IPDs for the measured sound pressure in a room. The discontinuity of the IPDs is quantified by the standard deviation.
If 2m + 1 data of the discrete phase difference are included within the frequency width Δf, where m is an integer, the standard deviation σi at center frequency fi is given by the following equation:
σ i = 1 2 m + 1 j = i m i + m ( ϕ j ϕ ¯ i ) 2
where ϕj is the phase difference value at frequency fj, and ϕ ¯ i is the average of the phase differences at frequency fi. The frequency spectrum of the standard deviation is obtained as the center frequency shifted over the measured frequency range (Figure 3b). The average value S.D.AVE over the frequency range from fmin to fmax is given by
S . D . A V E = 1 n i = 1 n σ i
where n data of the discrete standard deviation are included within the frequency range from fmin to fmax. S.D.AVE is a steady indicator that corresponds to the reverberation condition in the room.
The frequency spectrum of the standard deviation is not always necessary, since the average standard deviation value can be directly calculated from the short-term IPDs of binaural signals, as shown in Figure 3a. The frequency spectrum of the standard deviation is utilized for selecting the adequate frequency range that is most sensitive to the change of room volume.

2.3. Procedures

In an actual environment, sound is not always generated in front of the robot. In addition, the sound source cannot be distinguished between several objects by using only the visual image captured by the two cameras. Therefore, after localizing the sound source, the robot head is rotated toward the sound source and the object nearest to the center of the cameras is assumed to be the sound source. Additional procedures are necessary for the robot head to rotate toward the sound source and to calculate the ego-centric distance and room volume. The proposed algorithm is shown in Figure 4.
Four procedures are additionally needed as pre-processes:
  • Sound is generated in the room.
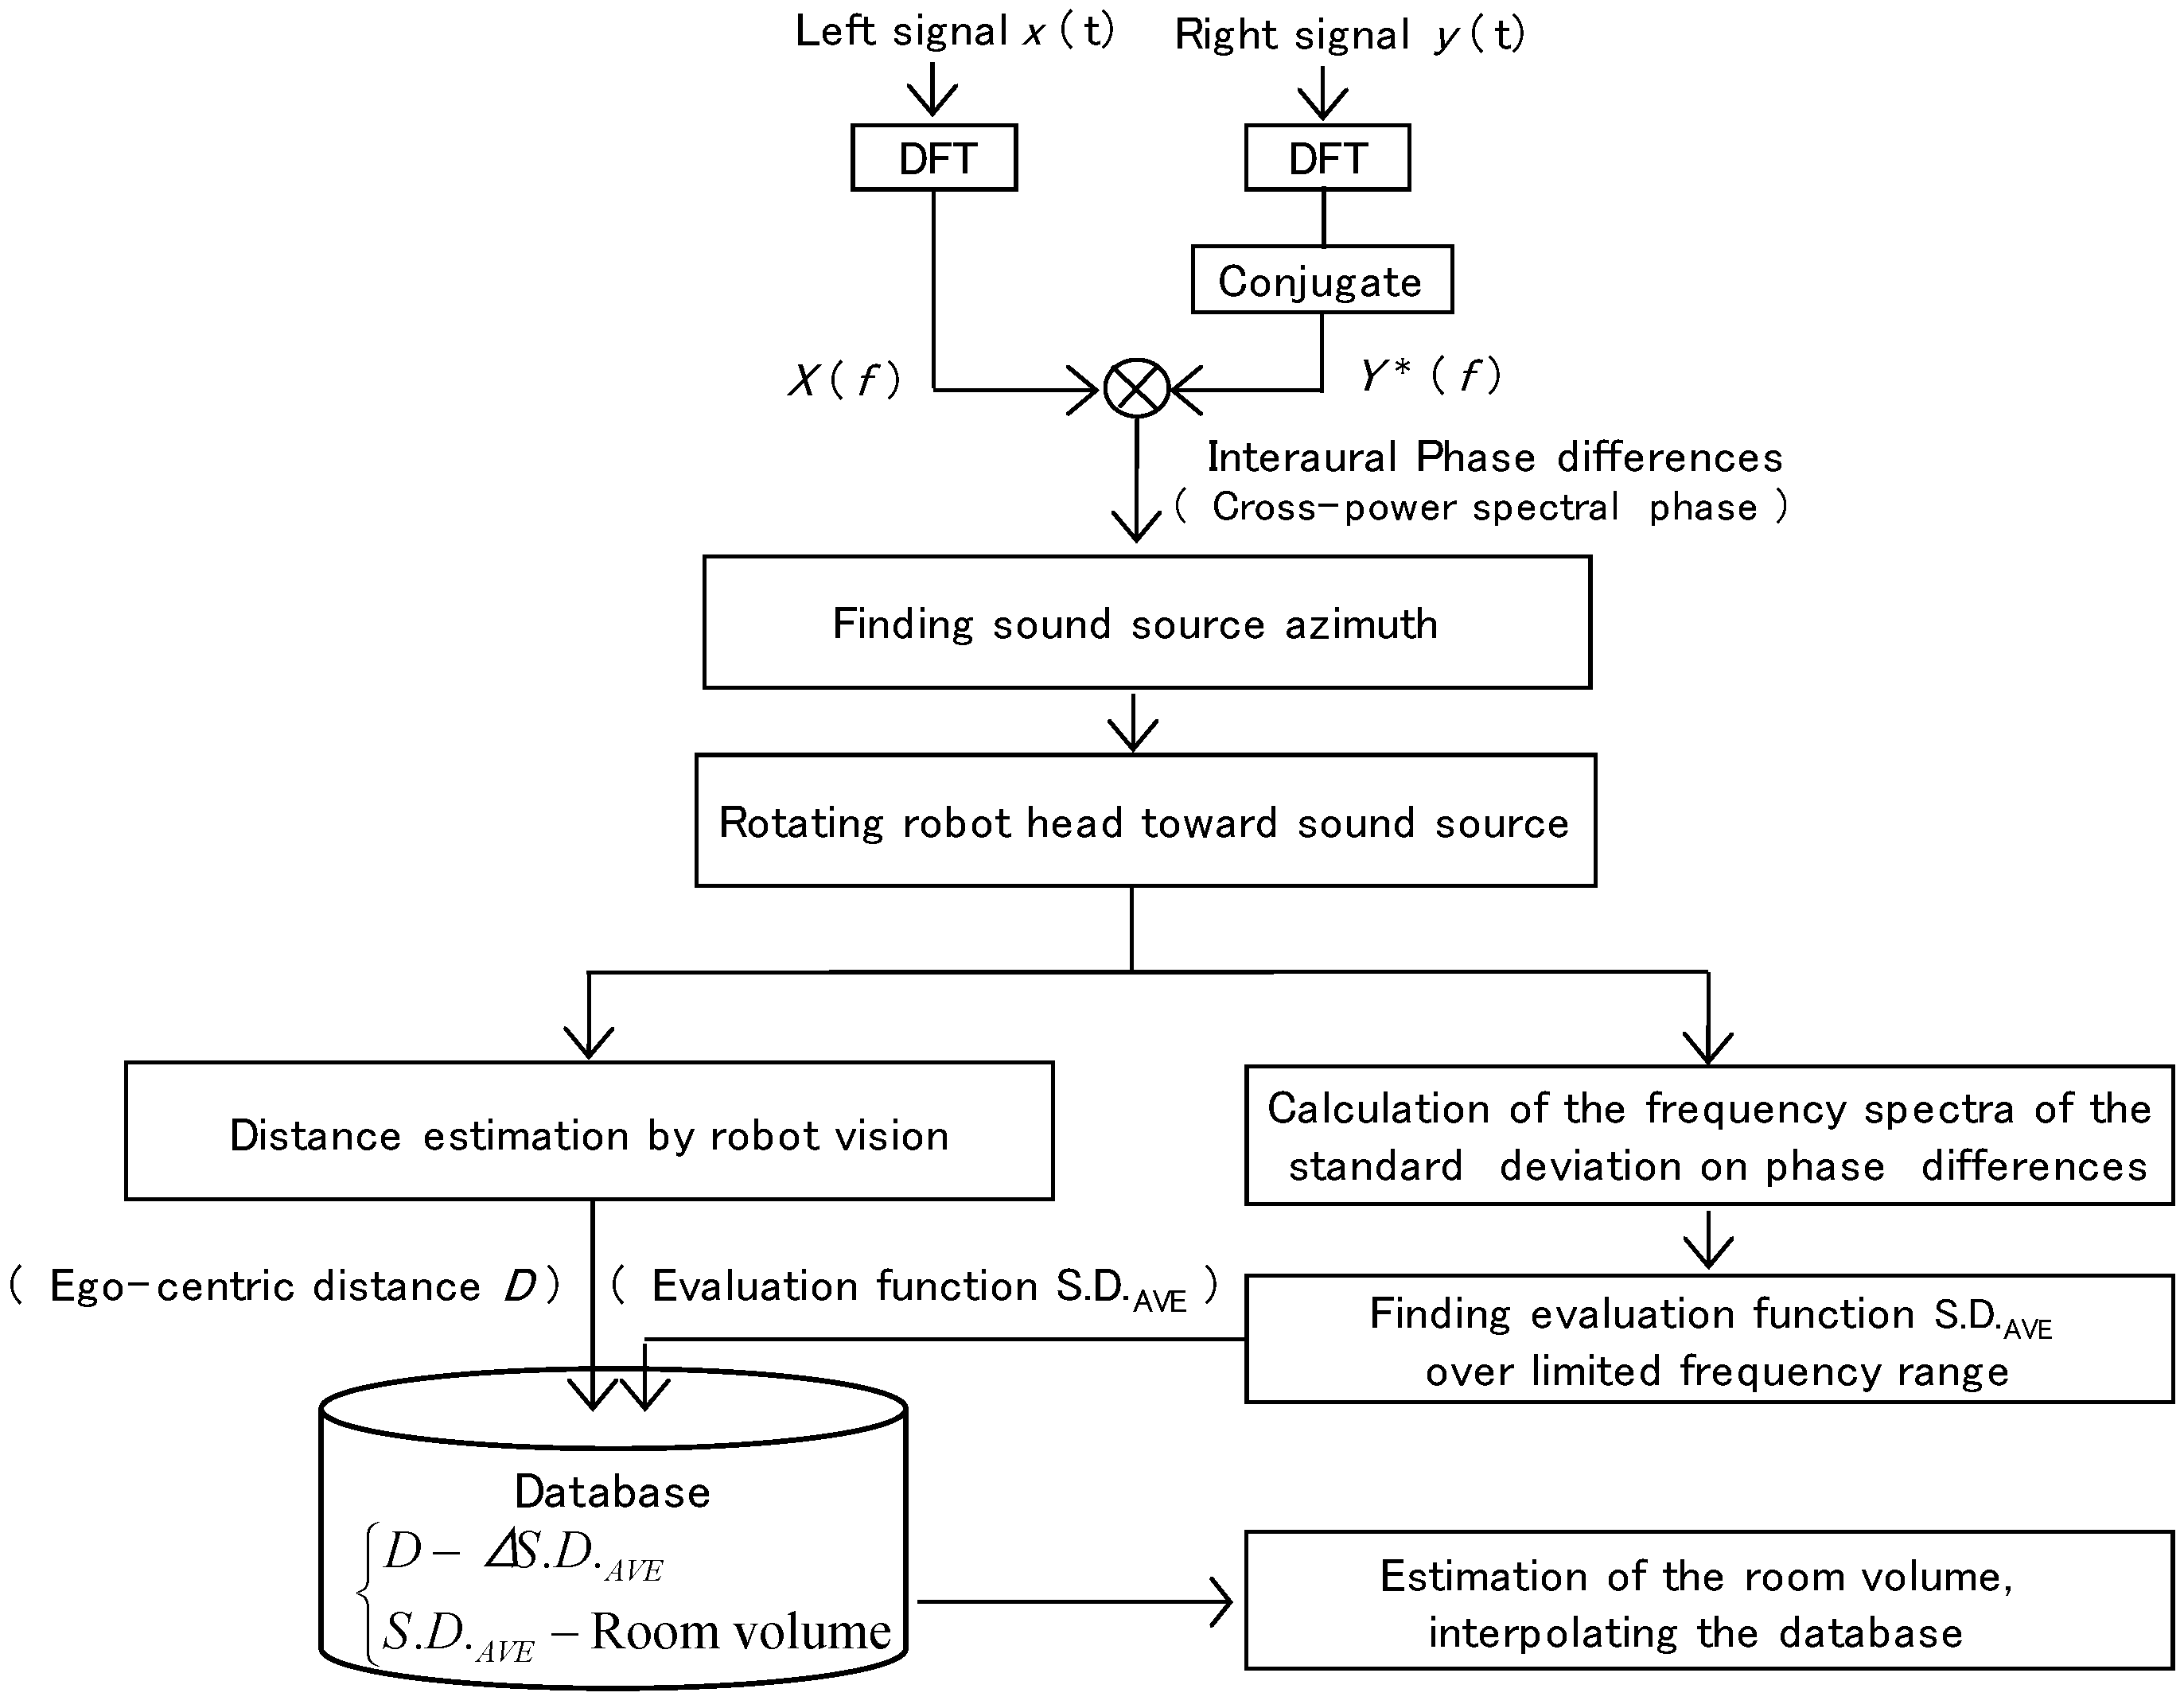
  • The sound source is localized with binaural signals by using the localization algorithm CAVSPAC [21]. The robot head is rotated toward the sound source. Though there is ambiguity in the sound source’s position in terms of front or back, the robot can distinguish front from back by rotating its head several times.
  • The object is recognized by robot vision. The robot adjusts its head angle horizontally and vertically to satisfy ε < 0.5 degrees in Equation (2). This threshold value was based on the results of preliminary measurements.
  • The ego-centric distance is calculated by Equation (1). The error of the estimated ego-centric distance is below 0.02 m over the range from 0.5 m to 1.5 m after correction.
The object that may be the sound source is recognized and the ego-centric distance is estimated by the above procedures.
  • Binaural sound signals are measured during the measuring time frame. The cross-power spectral phase is calculated by Equations (3) and (4).
  • The frequency spectrum of the standard deviation is obtained by Equation (5).
  • S.D.AVE is calculated for evaluating the reverberation by Equation (6).
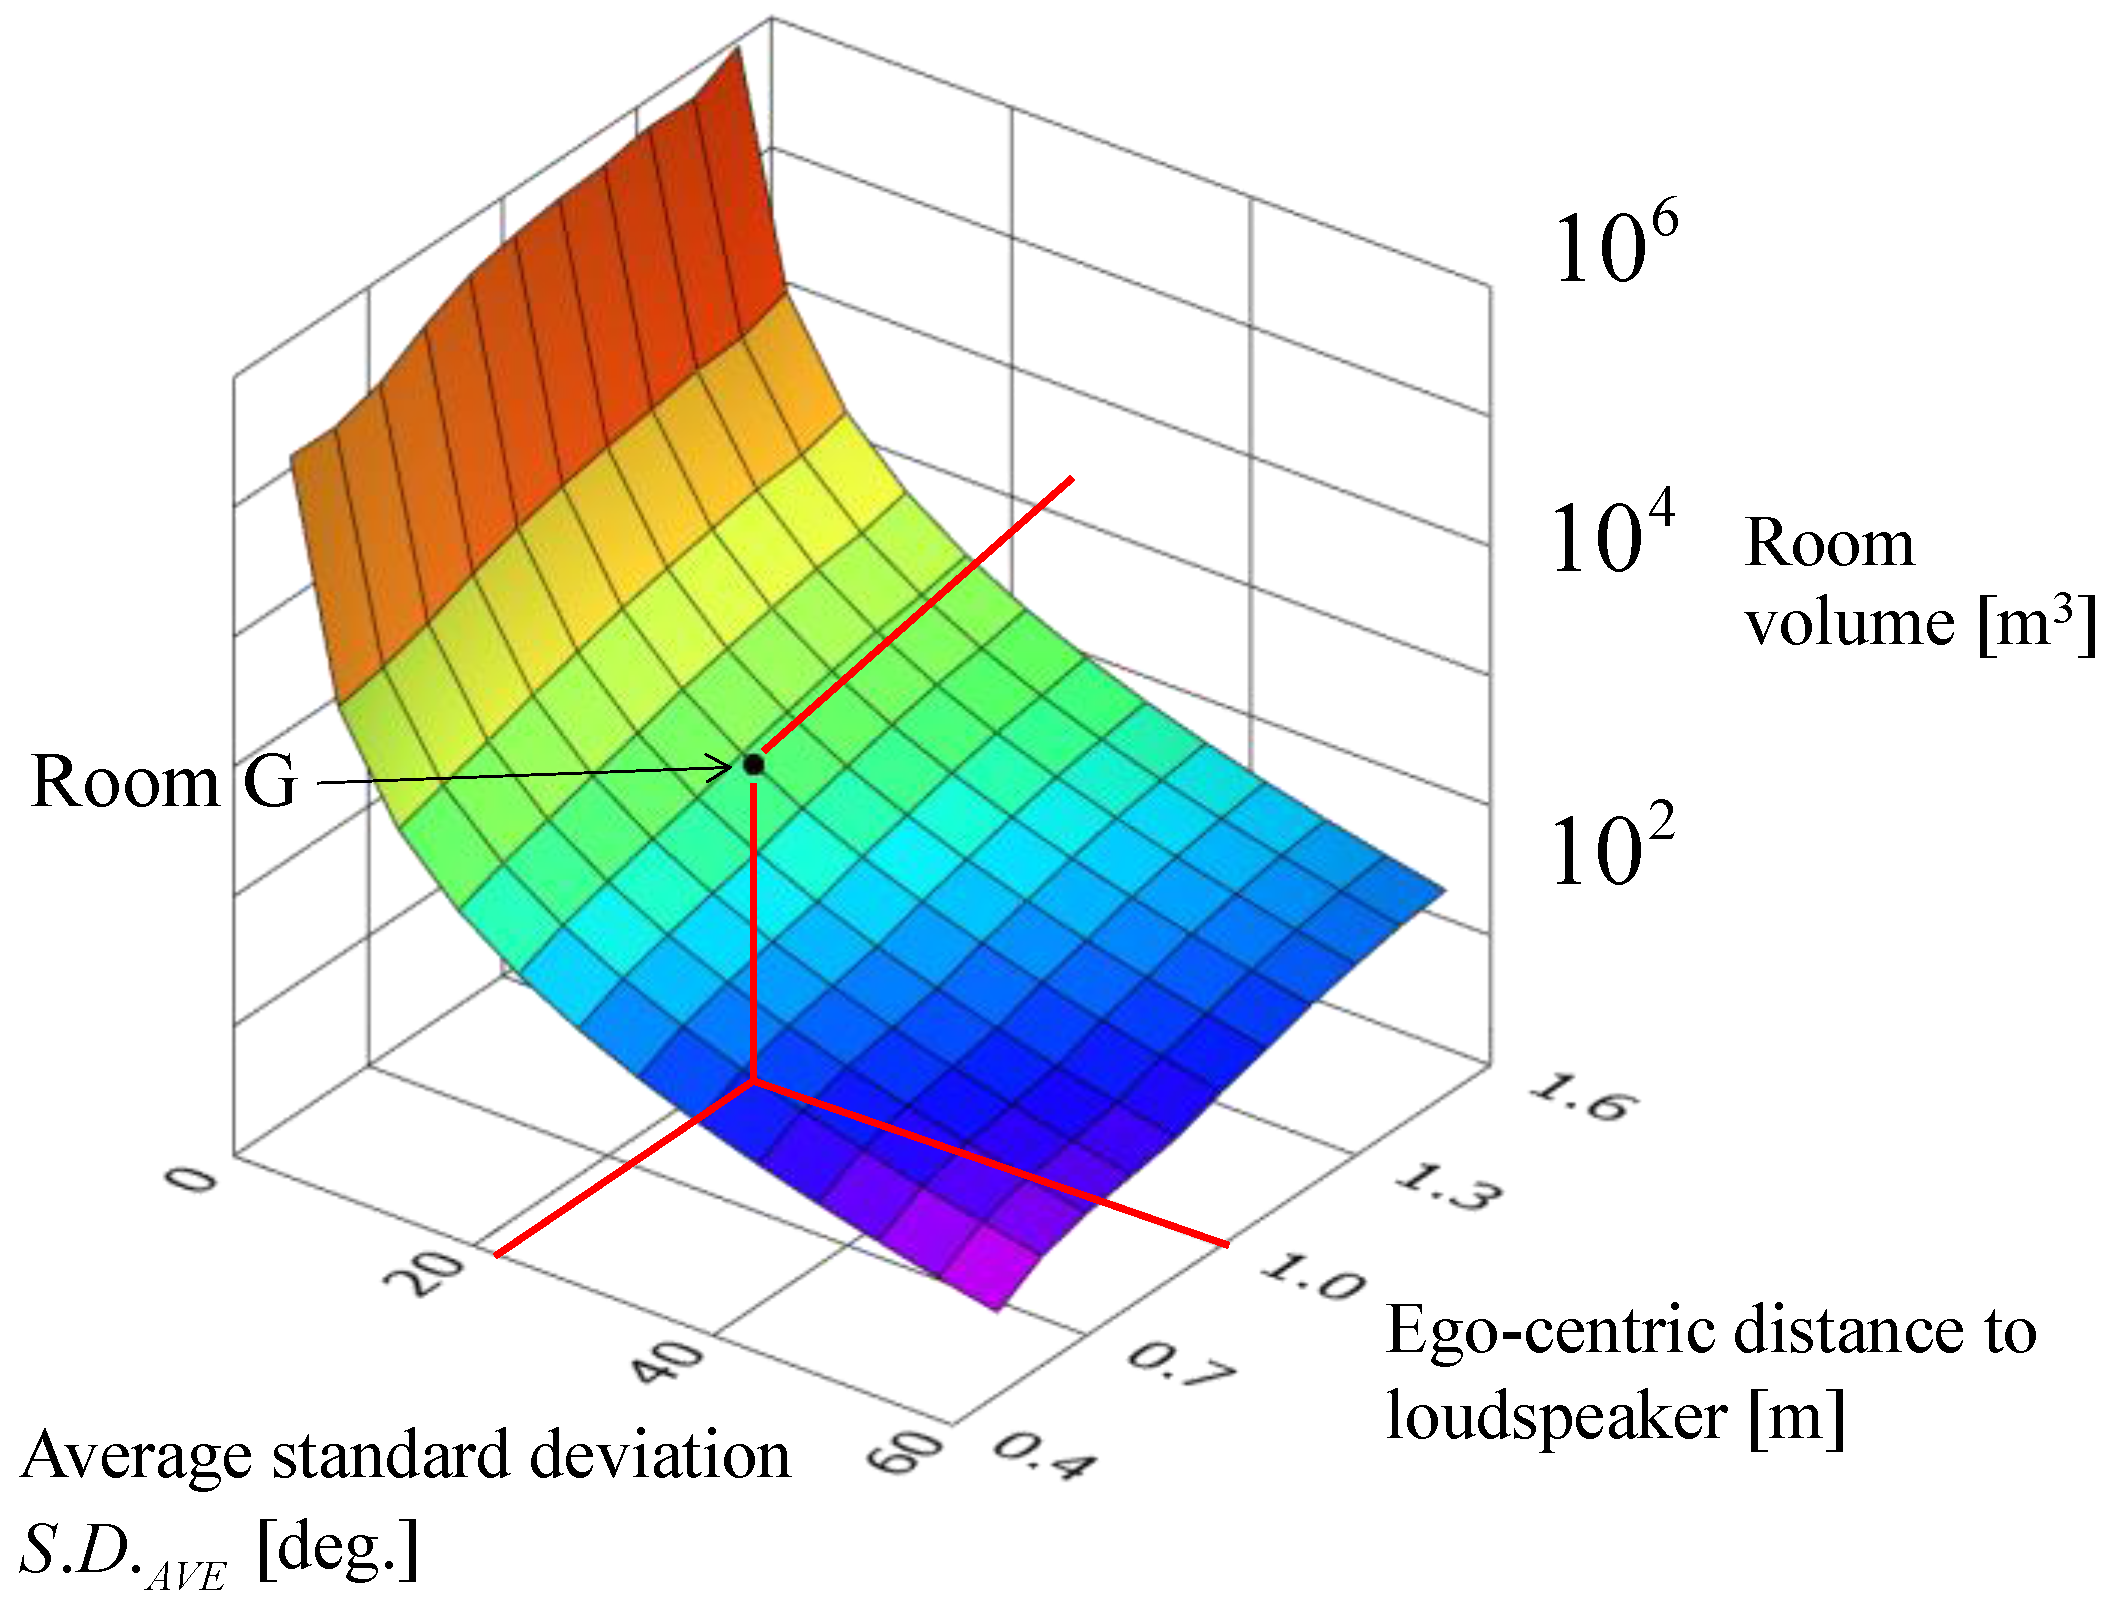
  • The room volume is estimated by referring to the database, which contains the relations between the average standard deviation, the ego-centric distance, and the room volume, experimentally defined in advance.

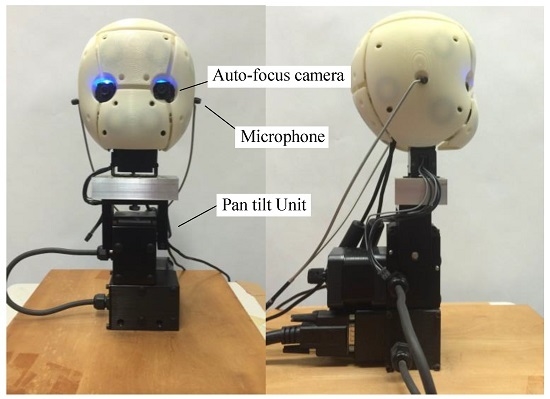
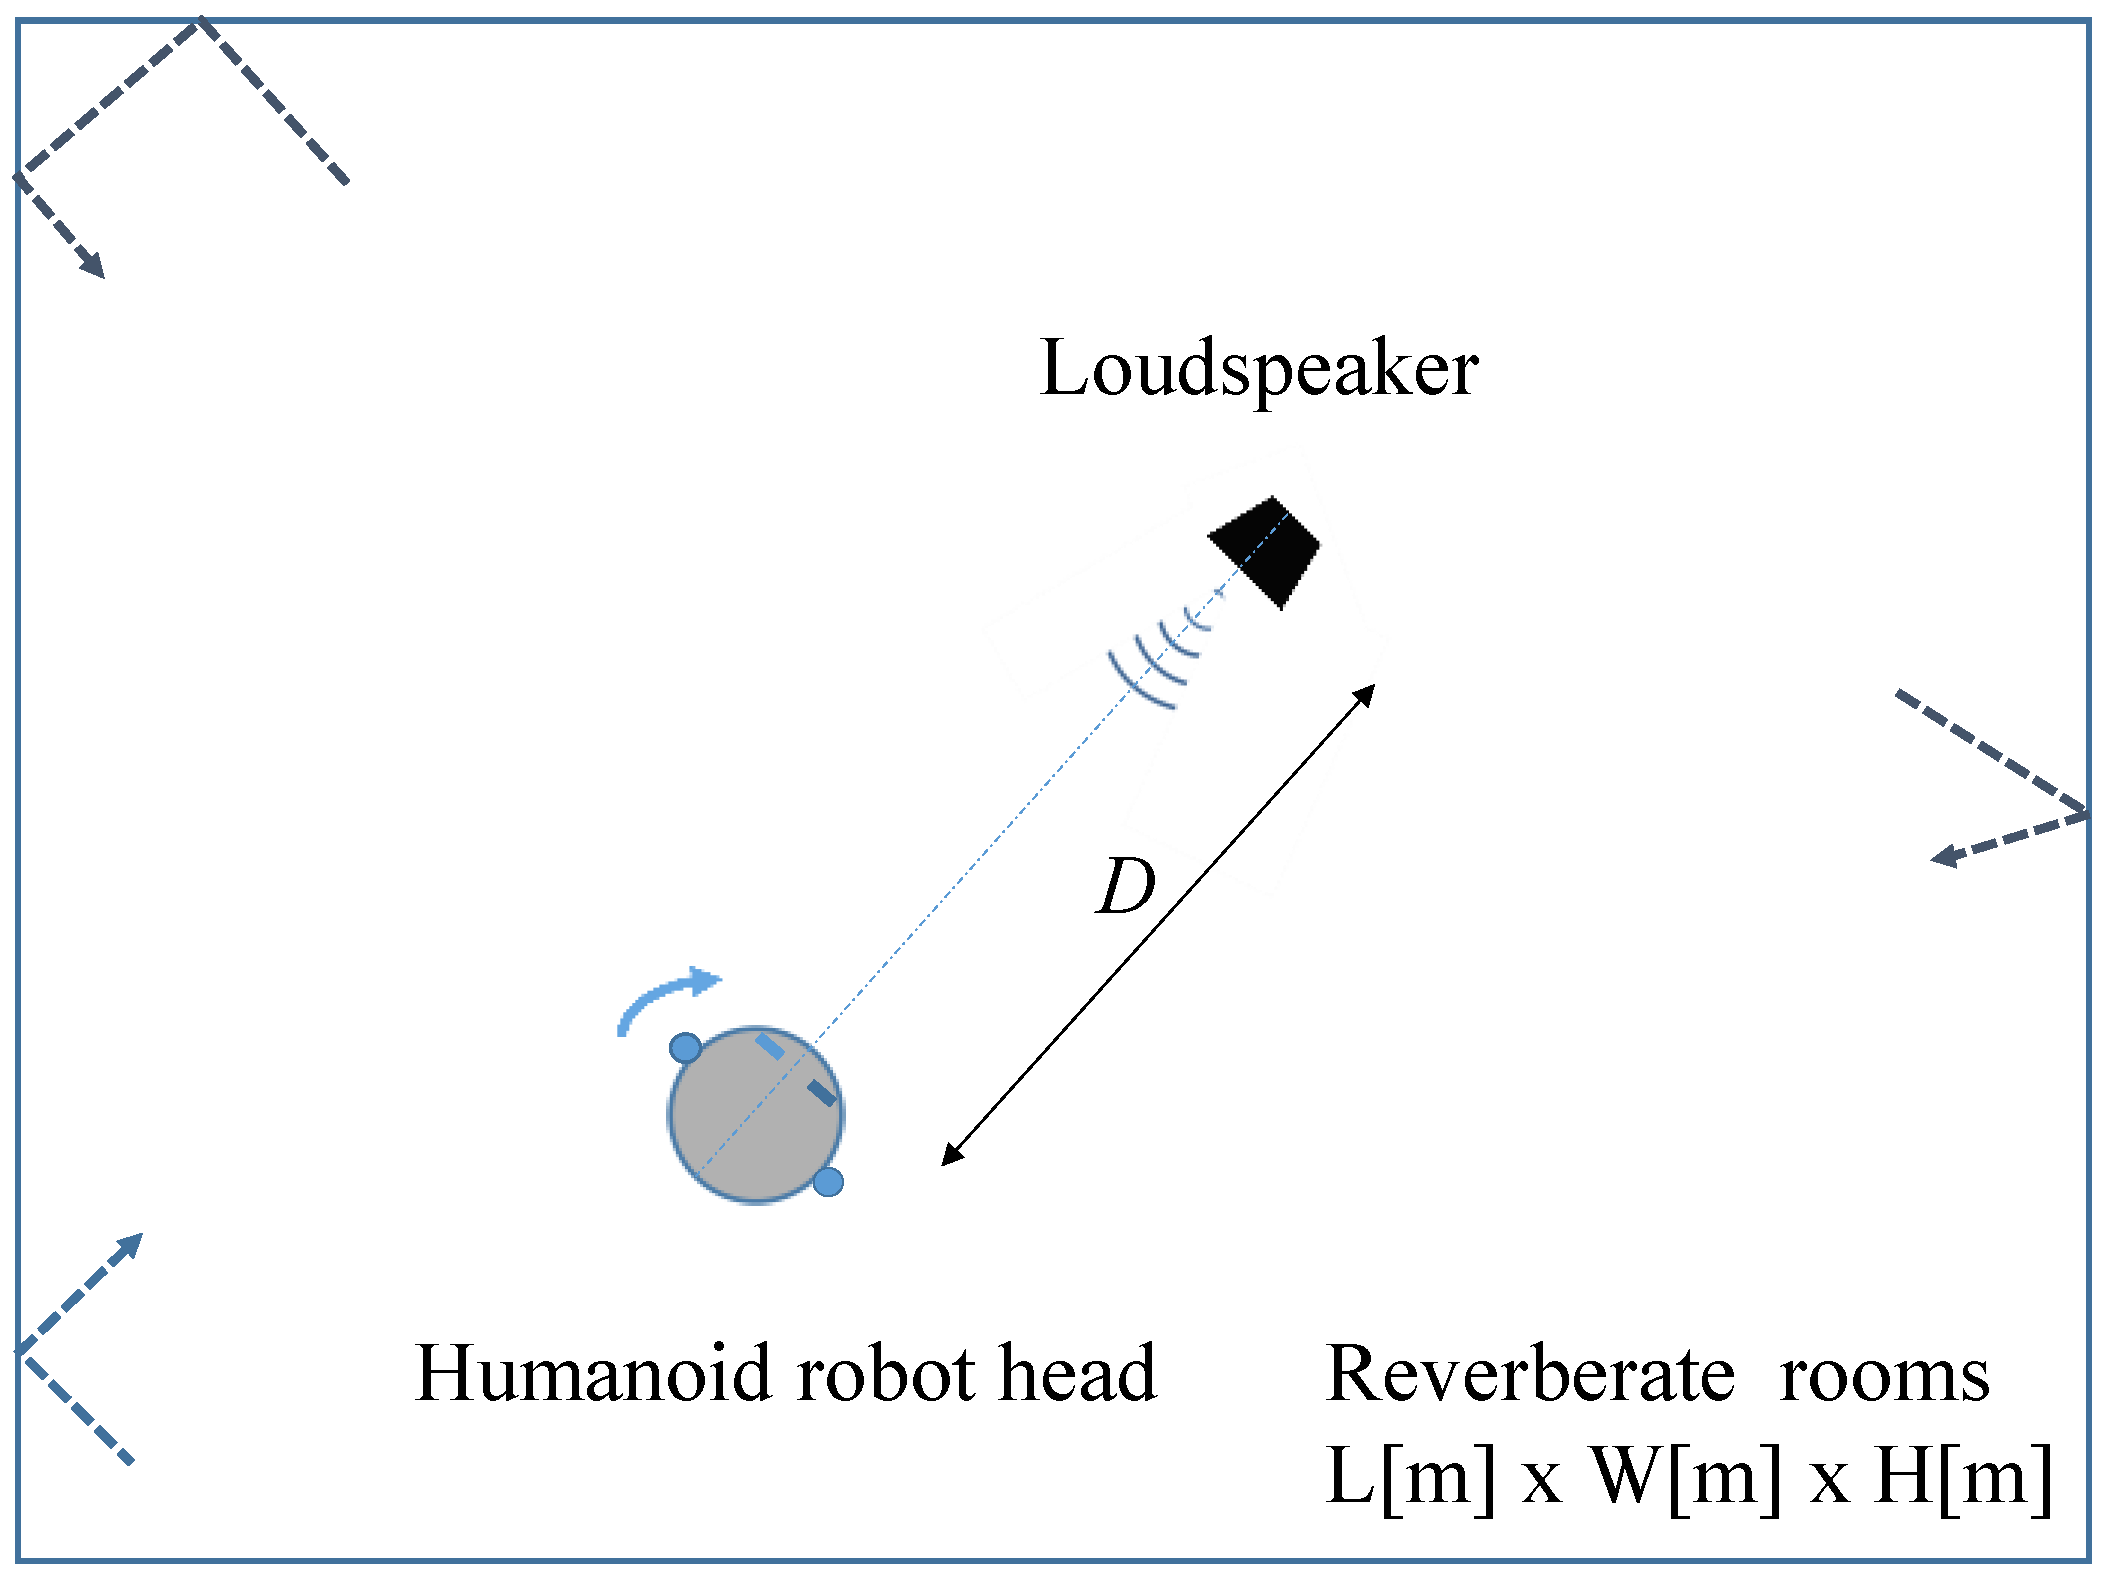
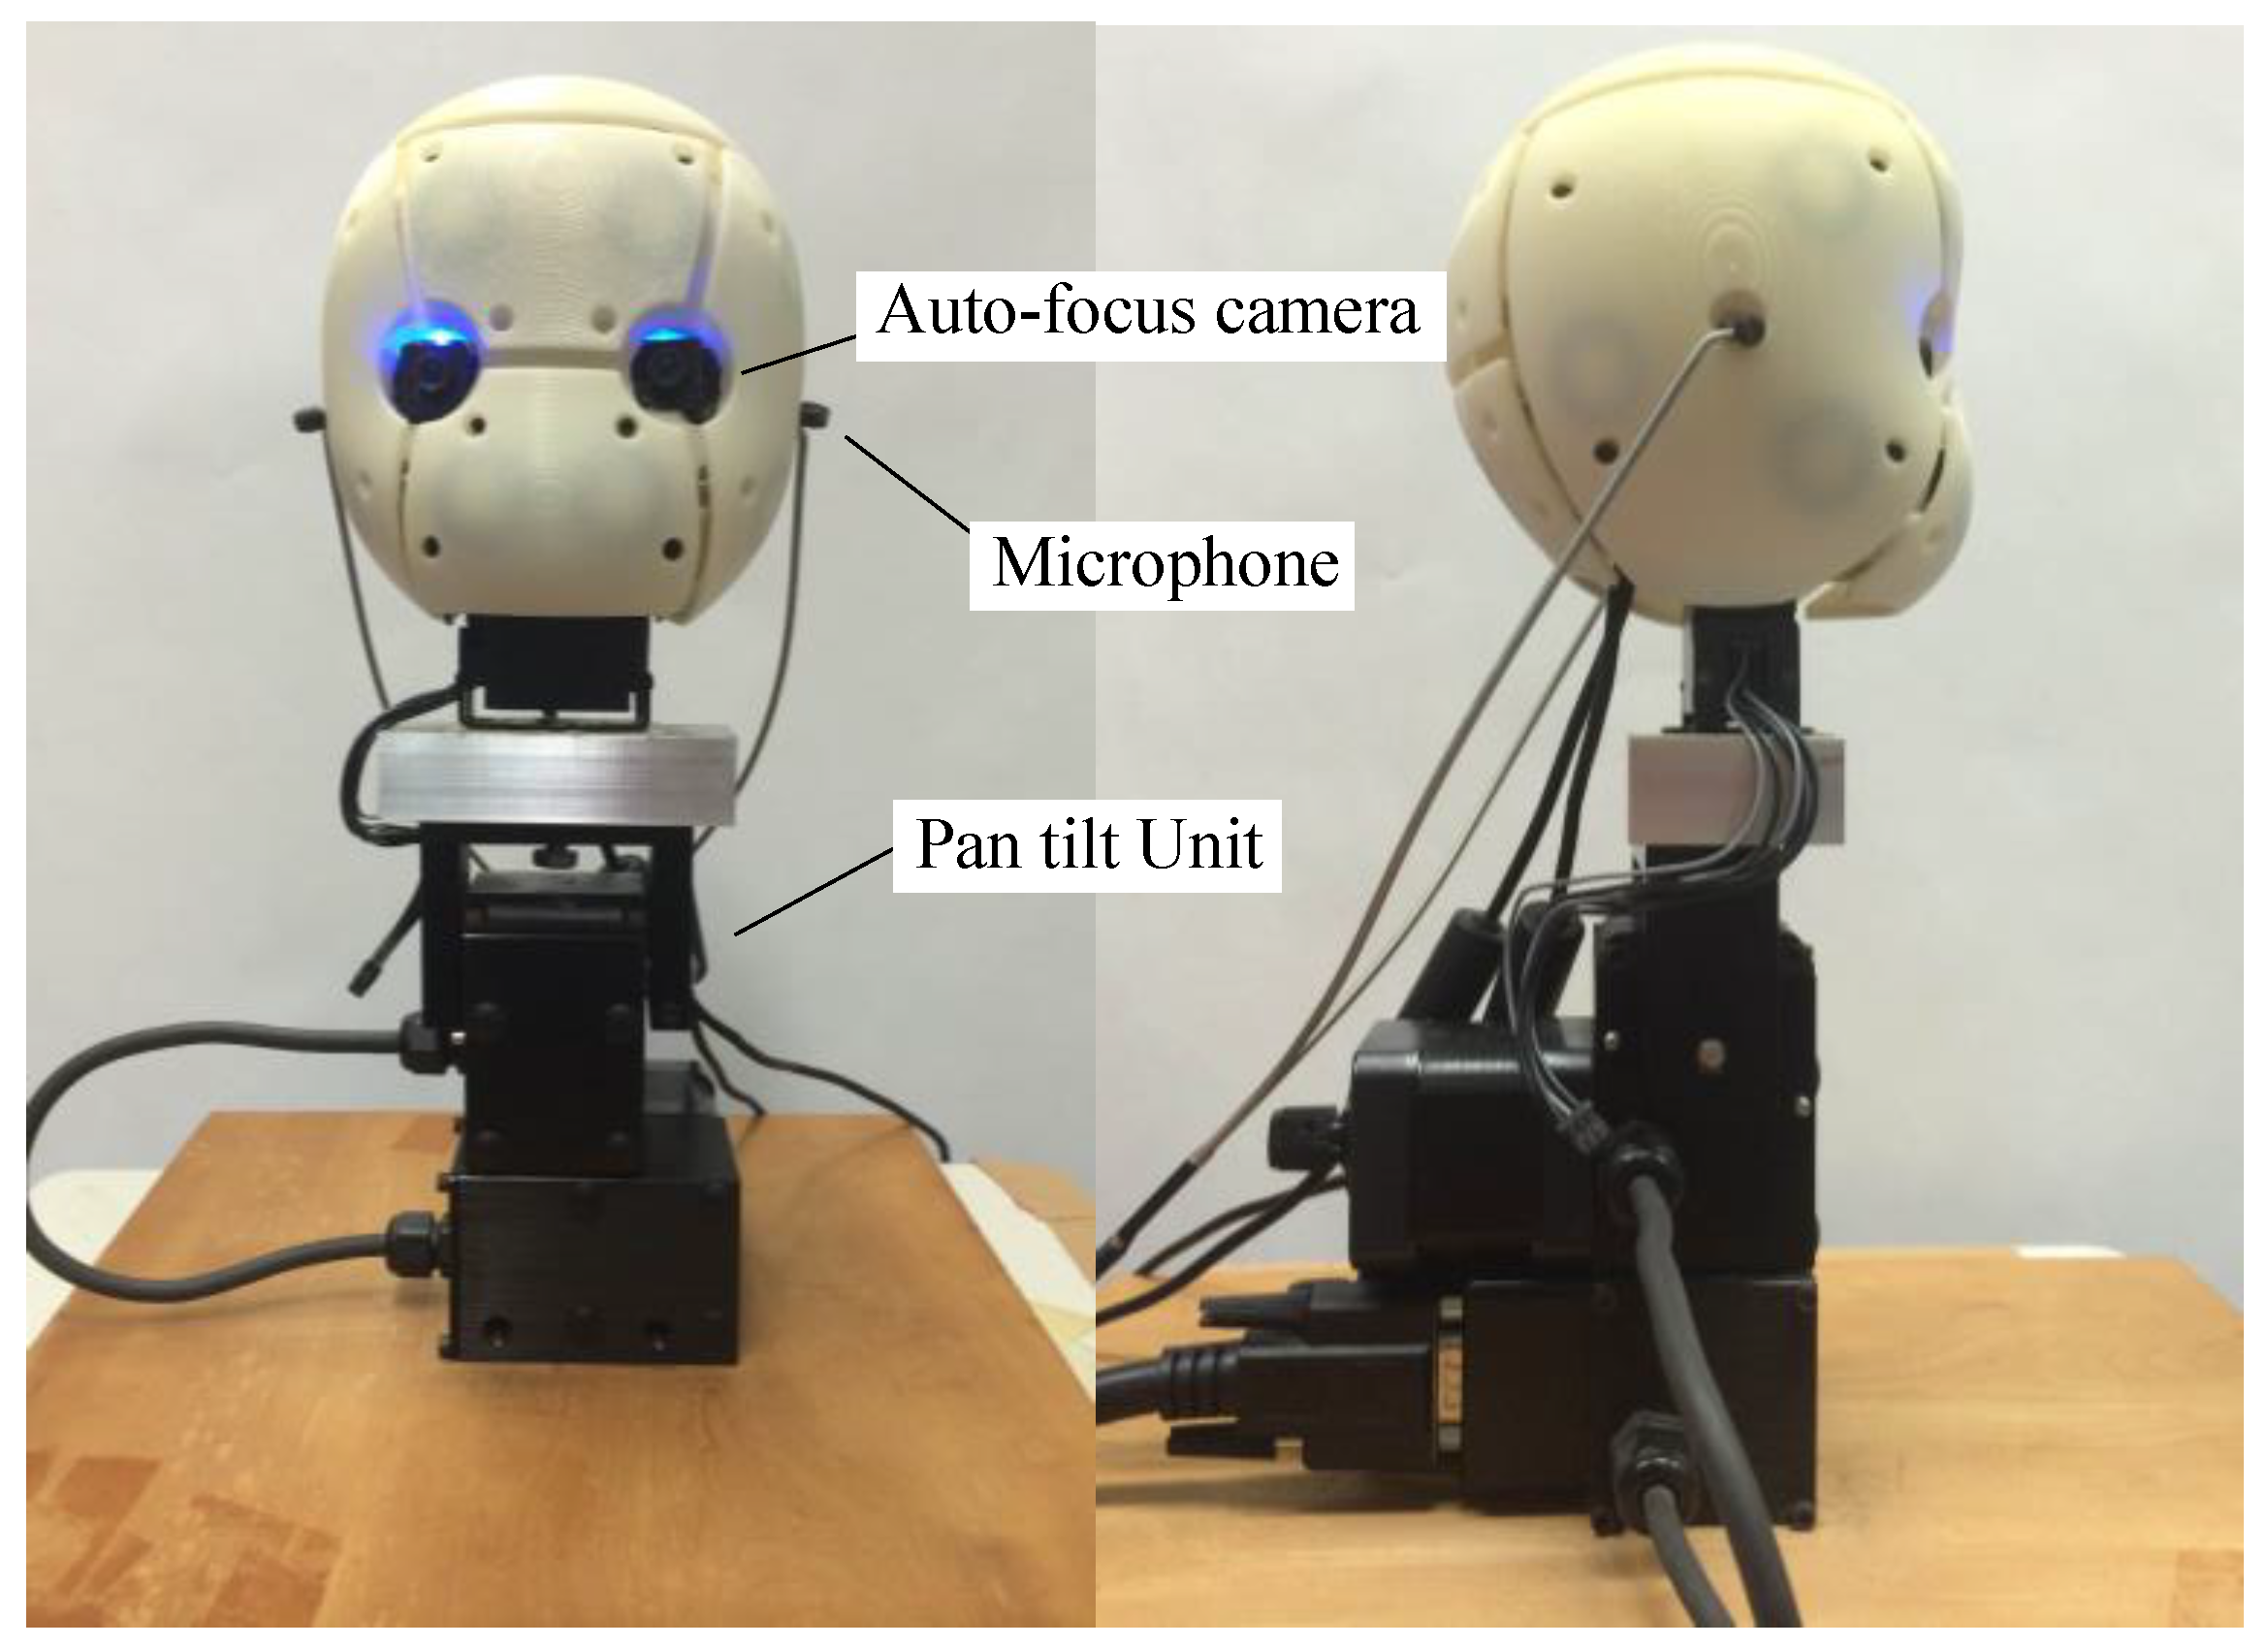
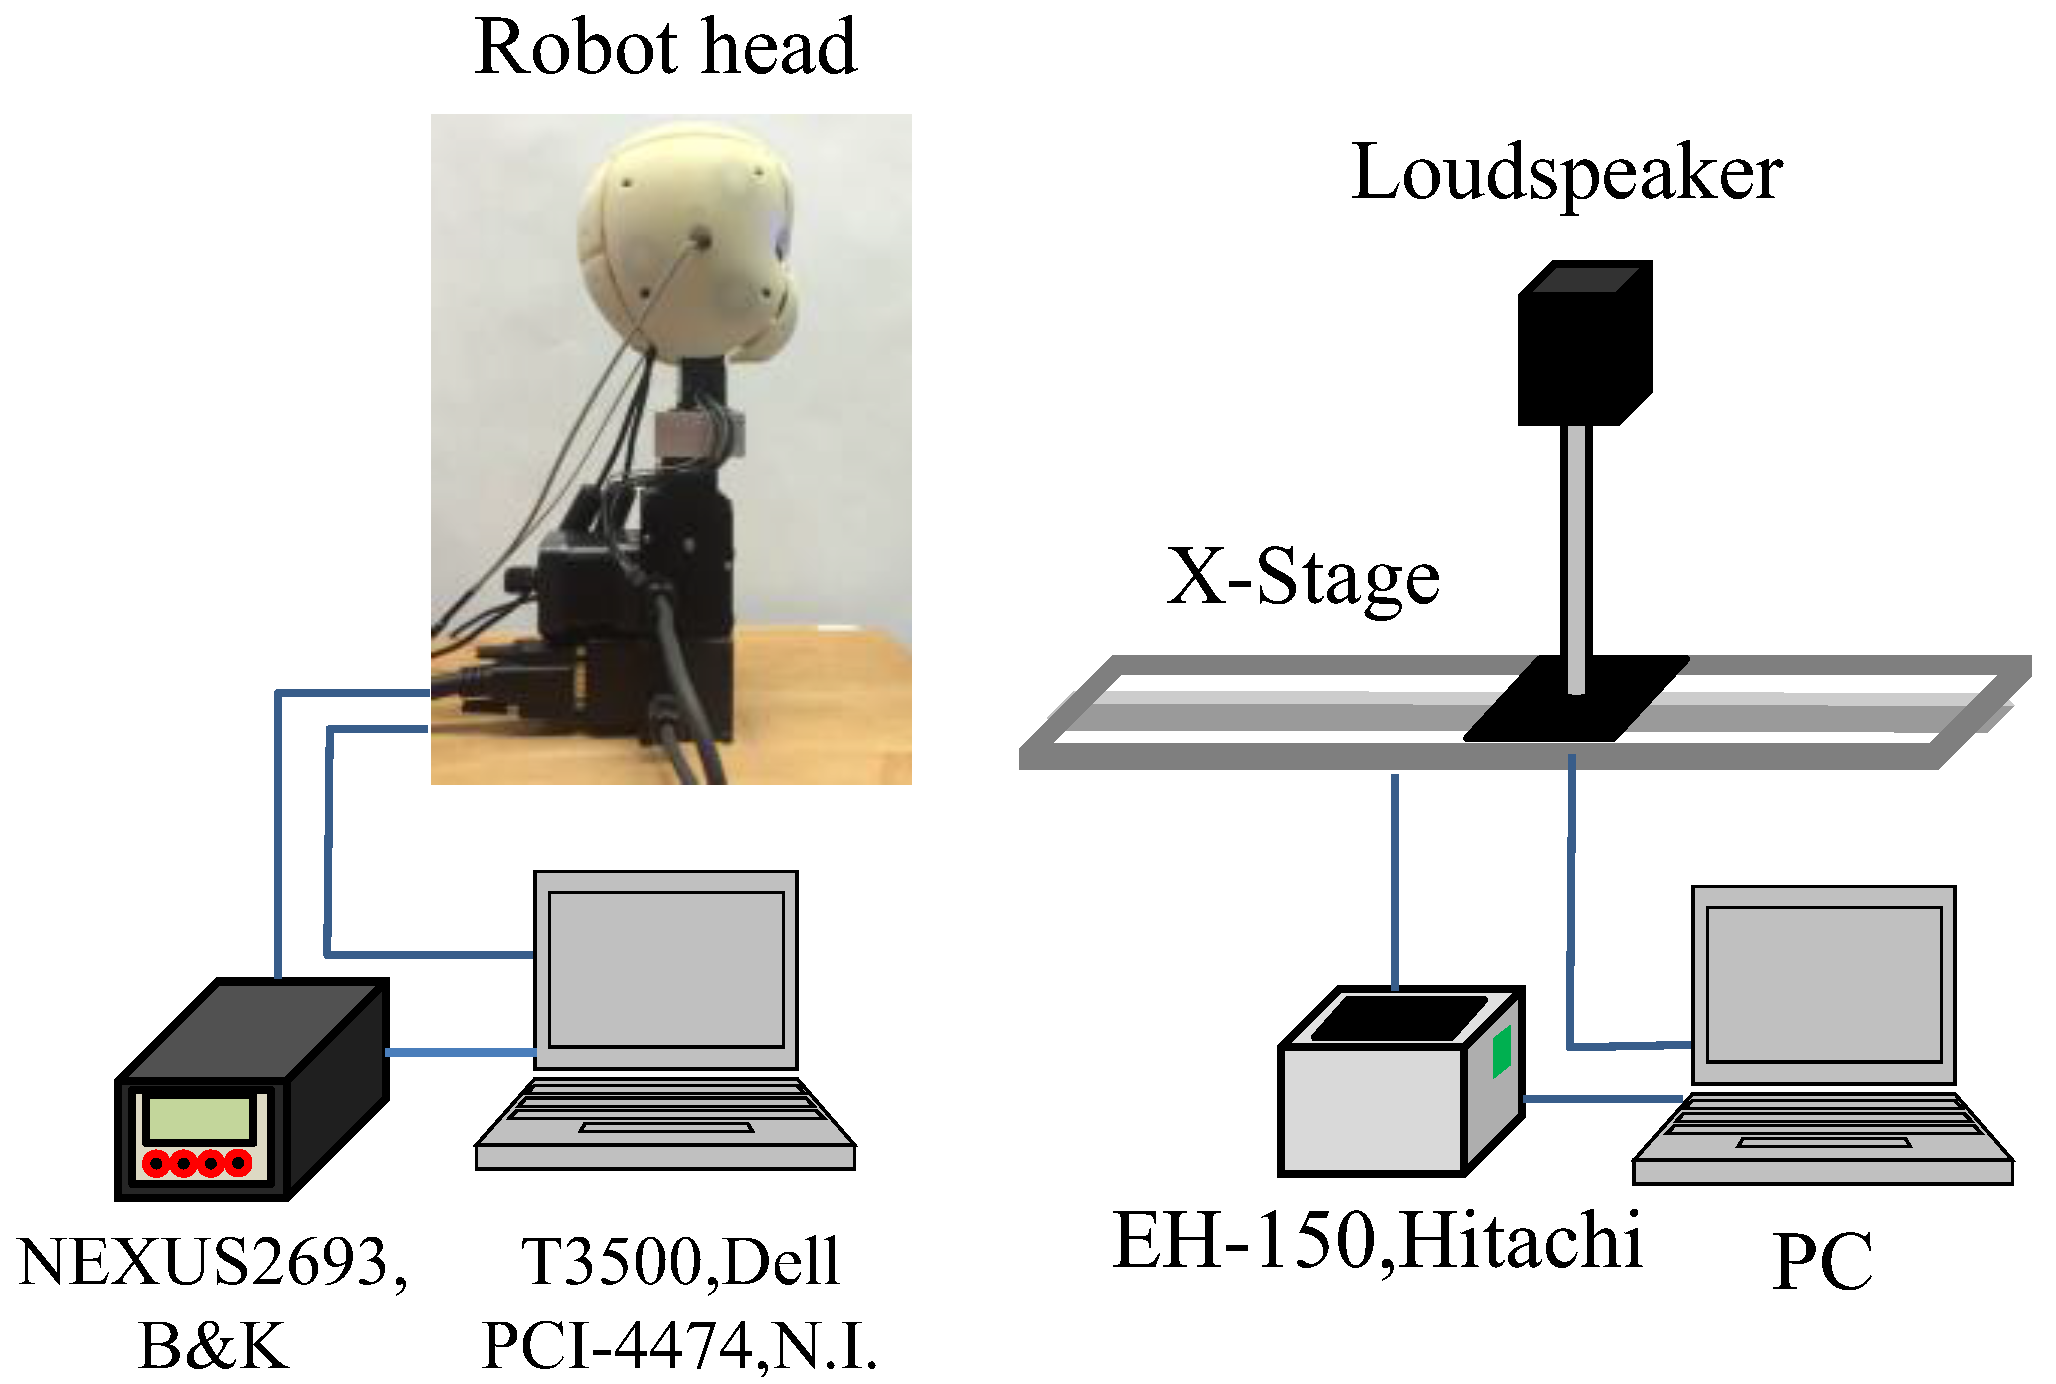
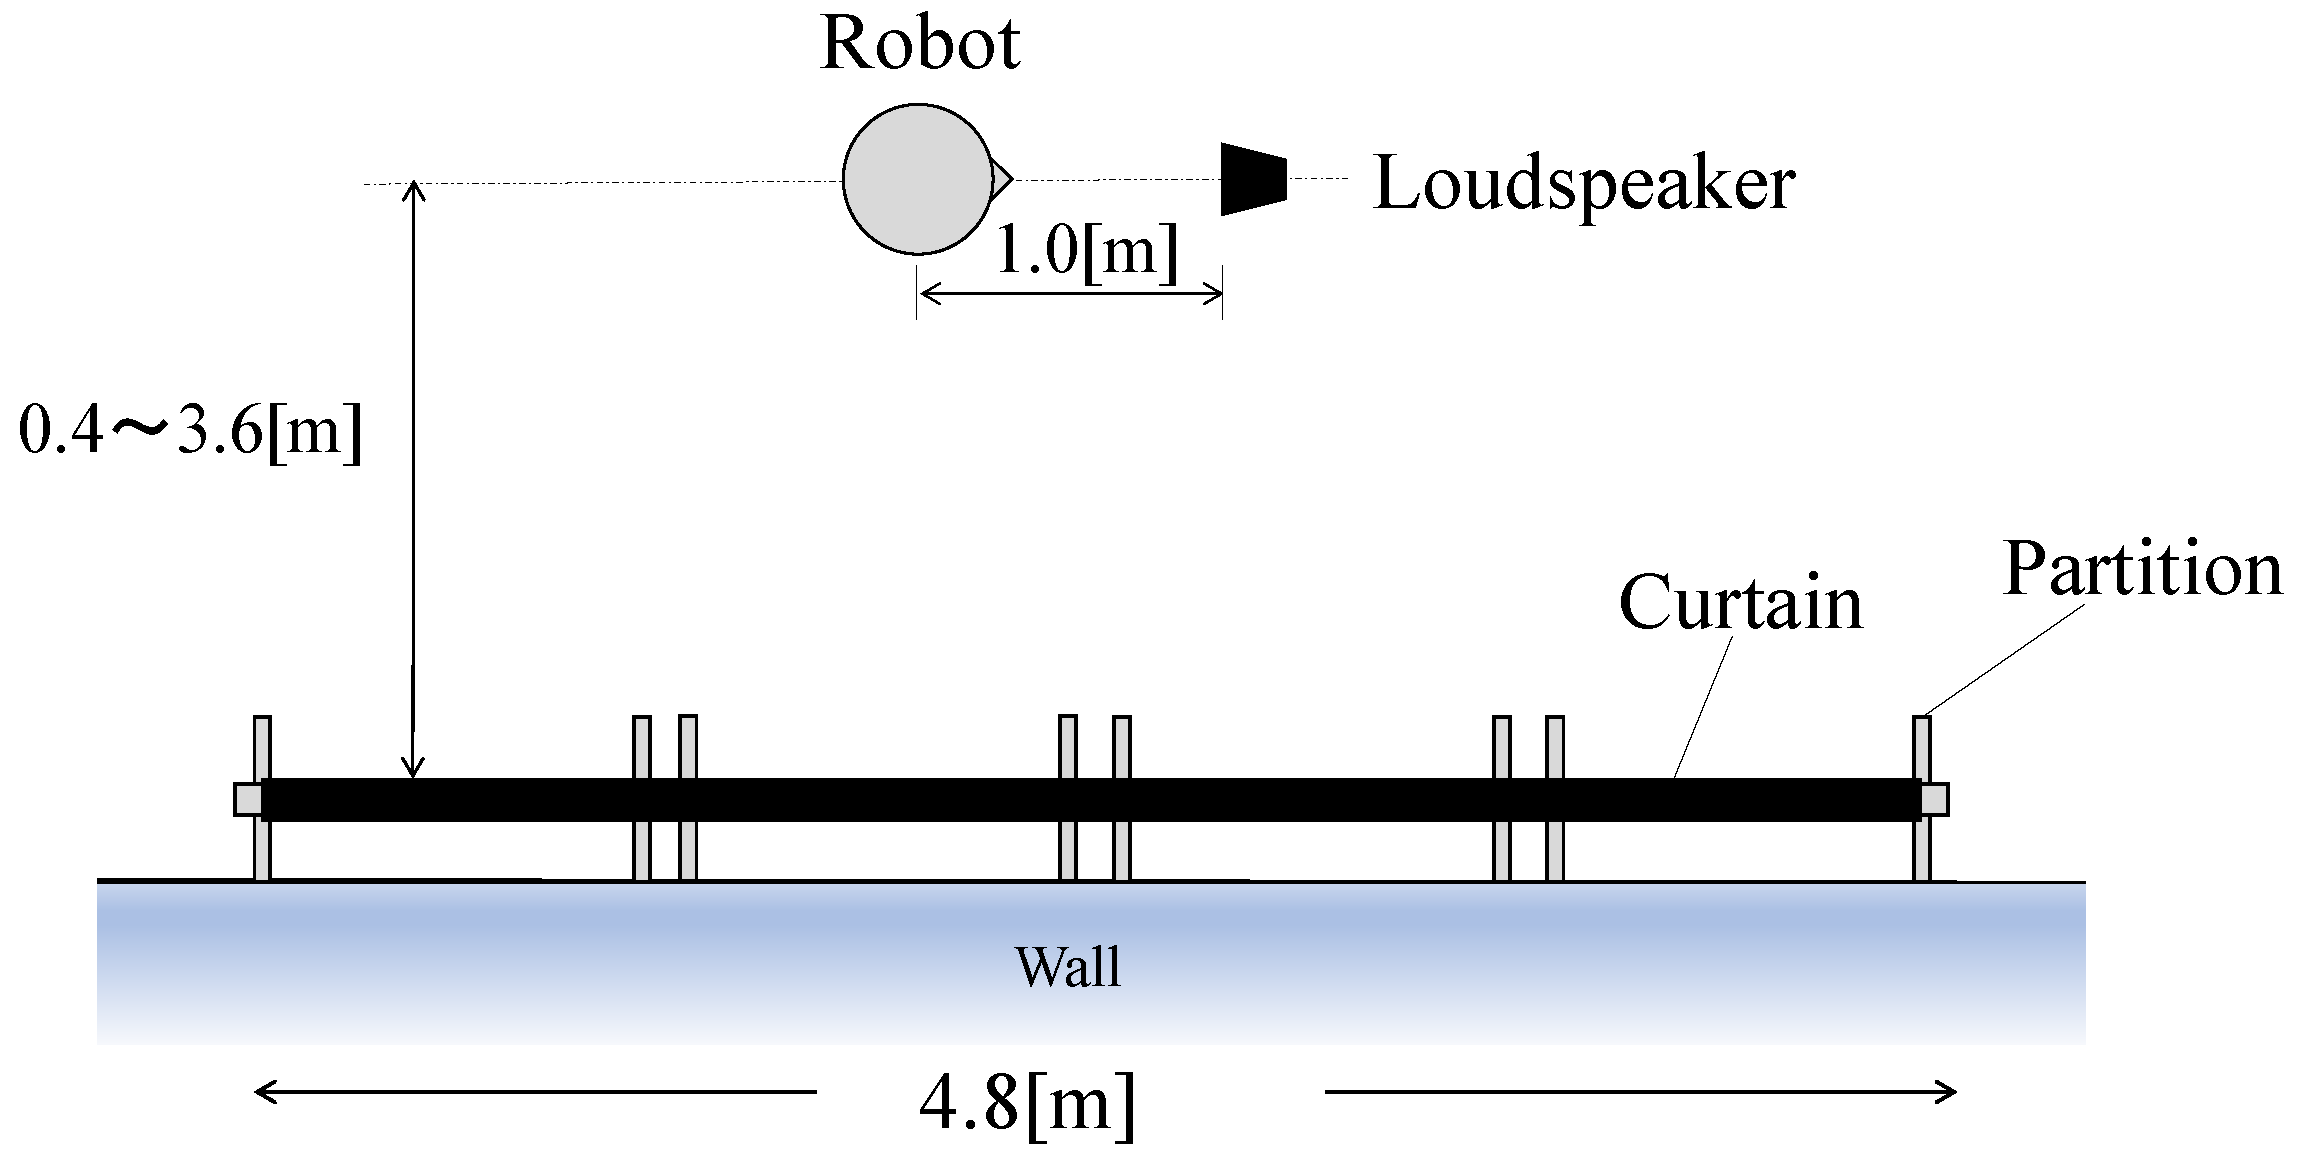
2.4. Experimental Measuring System

Figure 5 shows the appearance of the humanoid robot head (M3-Neony, Vstone). The robot head is approximated as a rotated ellipsoidal shell of 0.11 m (Length) × 0.05 m (Radius). An auto-focus camera (Q2F-00008, Microsoft) was mounted in each robot’s eye. The interval between the two cameras is approximately 0.05 m. Earphone-type microphones (Type 4101, Bruel & Kjӕr) were added for sound detection. The interval between the two microphones is approximately 0.10 m. The robot head was fixed on the pan tilt unit (PTU-46-17P70T, FLIR), in which motion is controlled by a workstation. The angular resolutions of rotating the pan tilt unit are 0.013 degrees in pan and 0.003 degrees in tilt.
The configuration of the experimental measuring system is shown in Figure 6.
The measurement and data processing of the acoustical signals were conducted on a workstation (T3500, Dell) equipped with a 24-bit resolution A/D converter (PCI-4474, N.I.). The sampling frequency was 24 kHz. One frame period was 0.2 s, which included 4800 data for each channel. This frame period is remarkably shorter than that adapted in the conventional methods. Broadband noise was radiated via the loudspeaker (0.19 m (H) × 0.11 m (W) × 0.13 m (D)), which was positioned at a height of 0.83 m. The loudspeaker on the speaker stand was fixed on the computer-controlled X-stage and the position was controlled by a sequencer (EH-150, Hitachi). The values of fmin to fmax shown in Figure 3b were set at 4 kHz and 11 kHz, respectively.
Table 1 shows the room measurements and volumes used for preparing the database. Each room volume was approximated using architectural drawings. Lecture rooms B and C were similar to each other in volume, and D and E were also similar to each other in volume.

3. Experimental Results

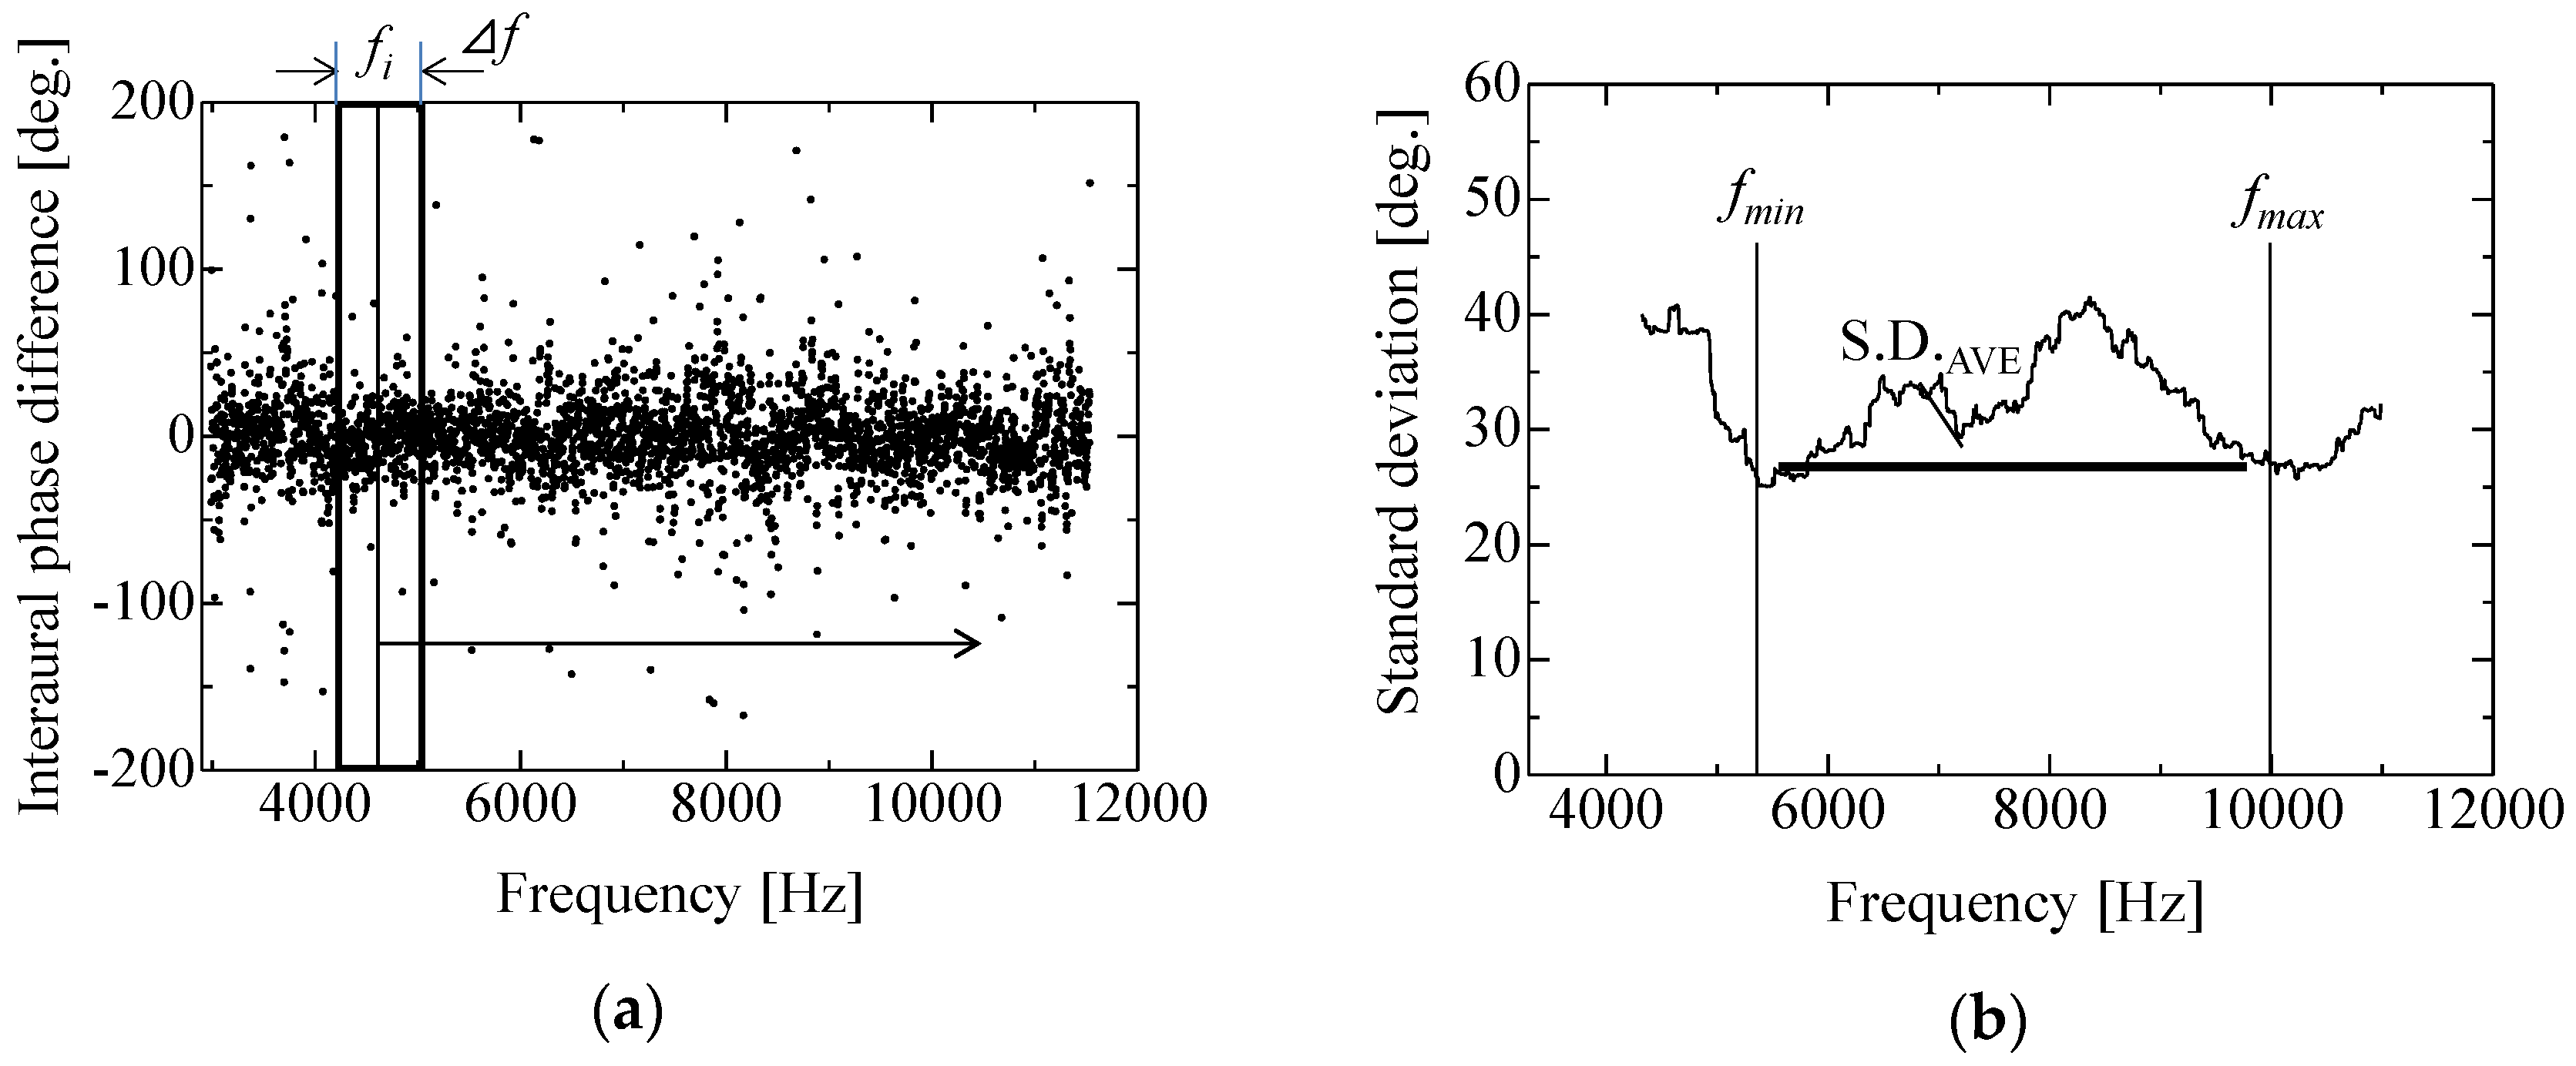
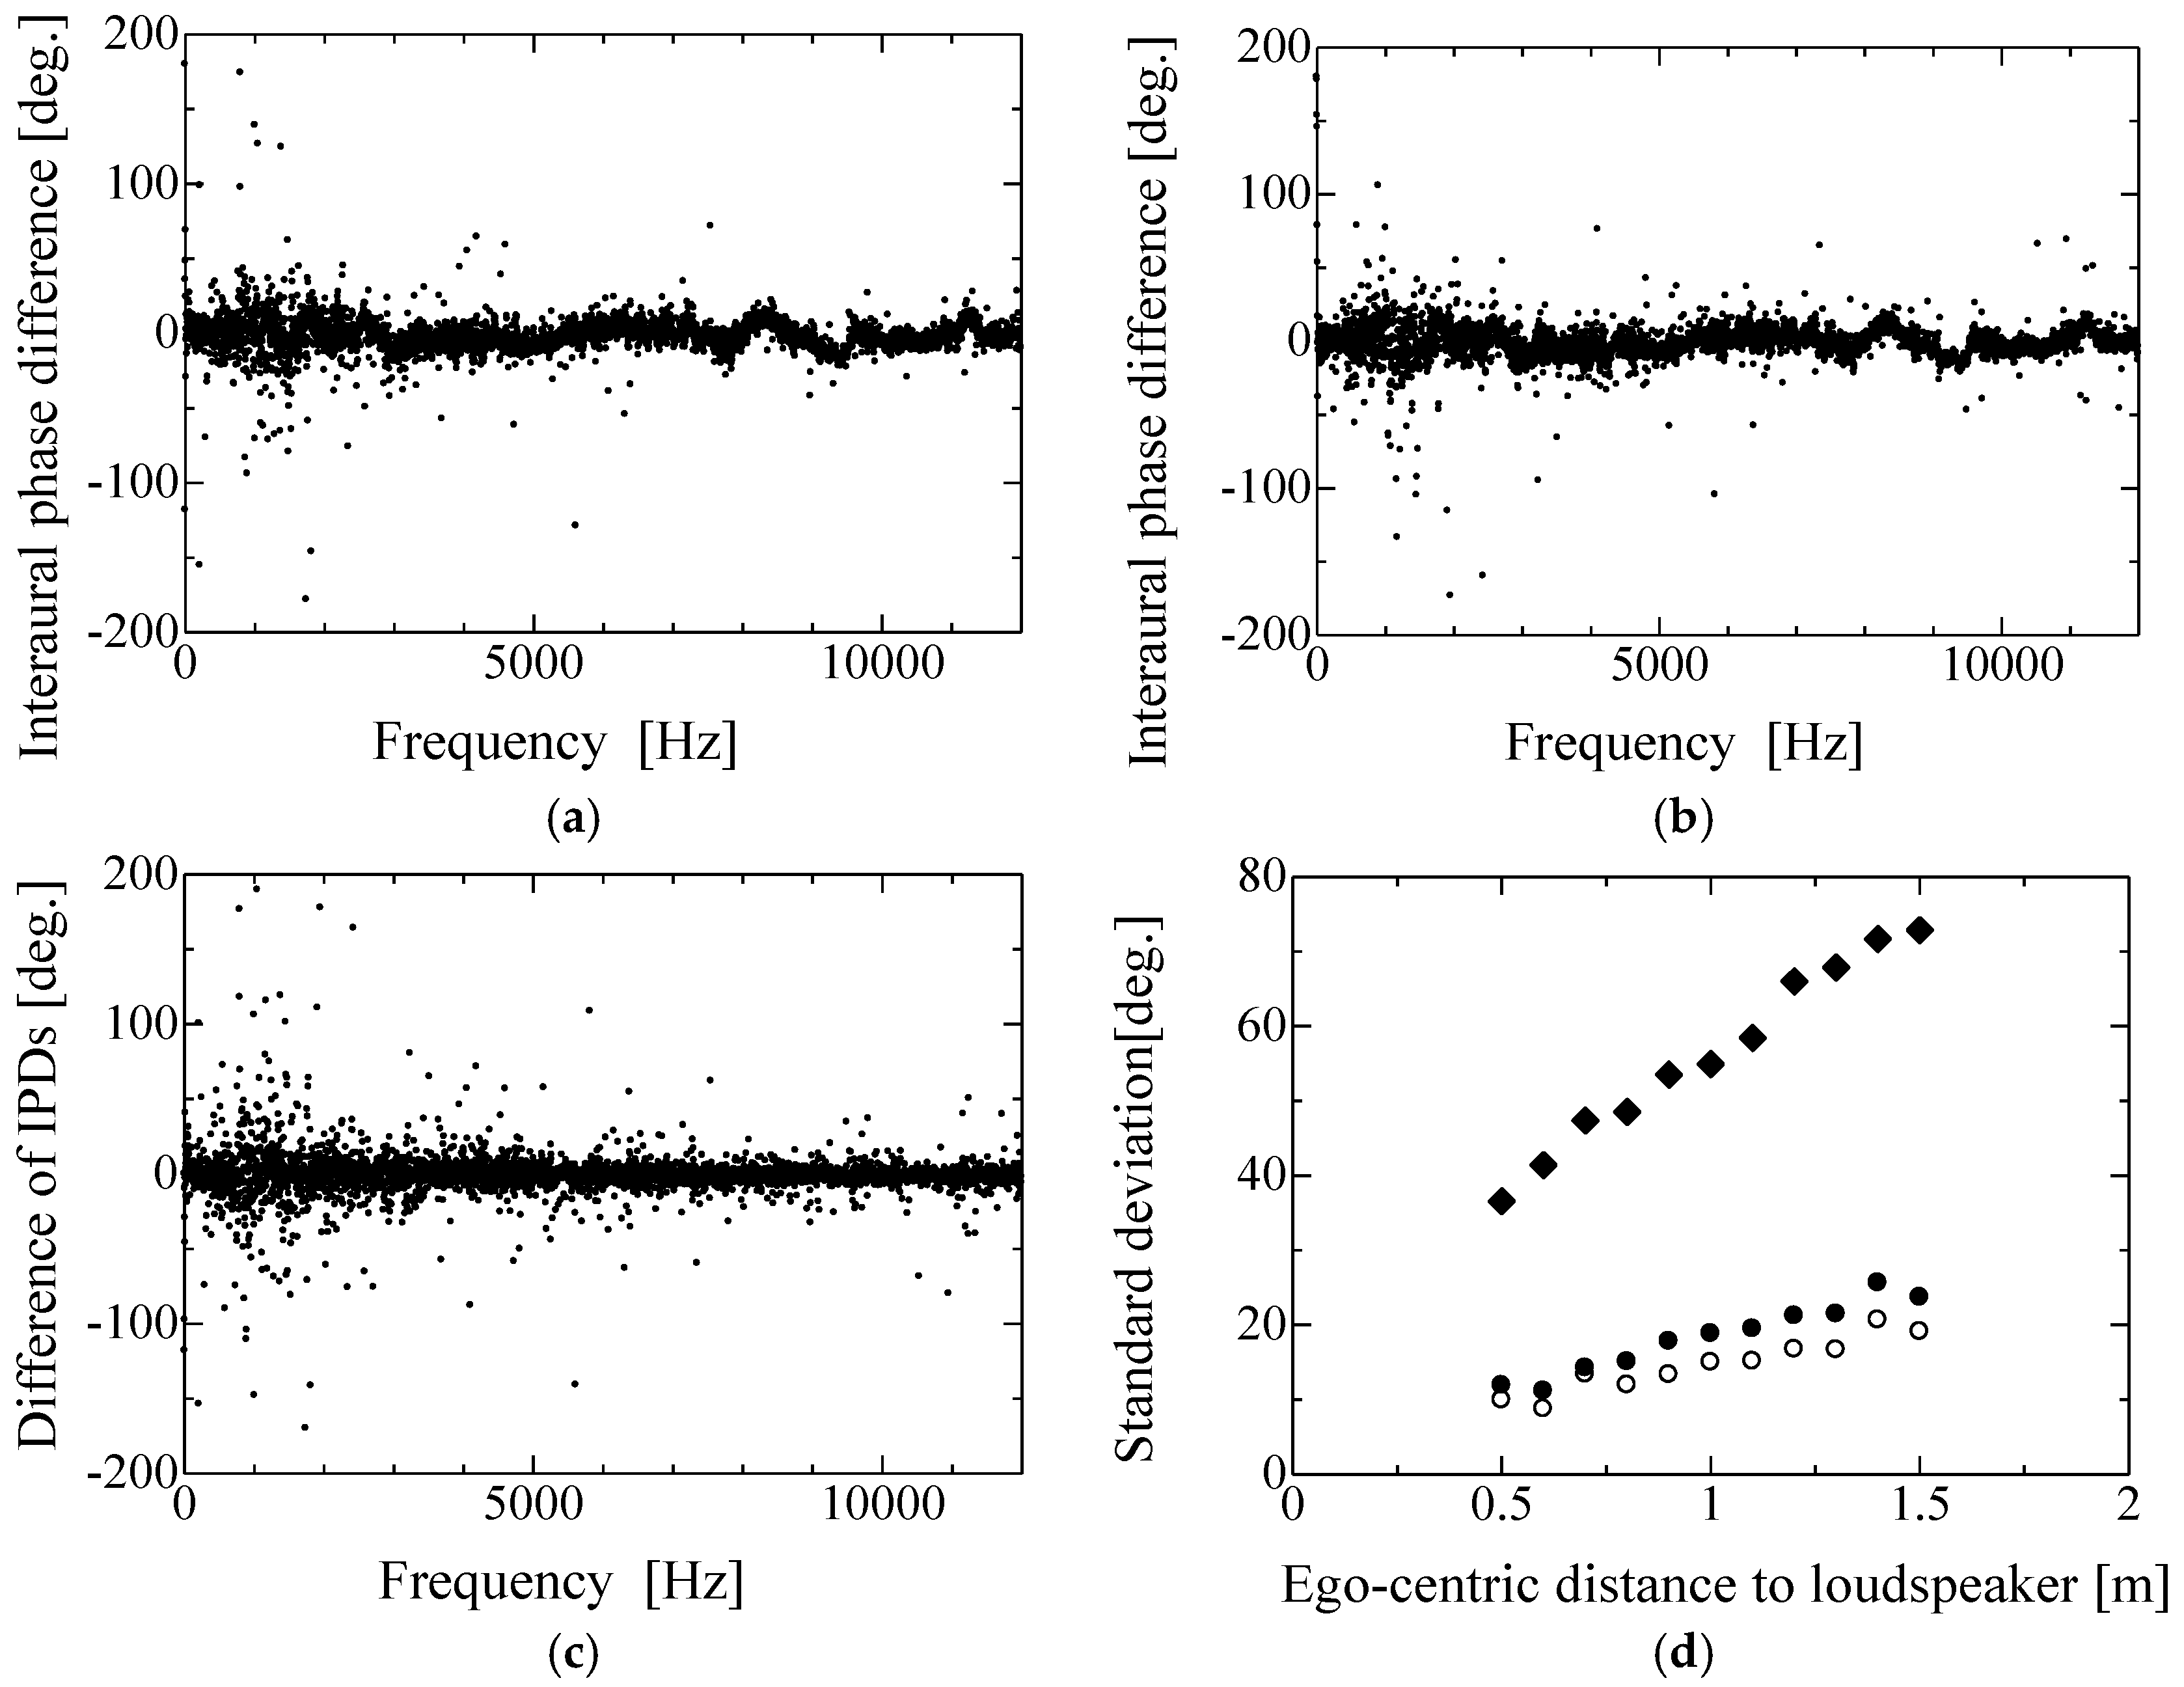
3.1. Statistic Properties of IPDs in Short-Term Frequency Analysis

The statistical properties of the IPDs of sound pressure in a short-term frequency analysis are next discussed. The short-term IPDs measured in the reverberation rooms fluctuate temporally [11,18]. One room and one distance were tested first. One loudspeaker was located at a distance 1 m from the robot head. Figure 7a,b show the two IPDs measured under the same conditions. Though they have almost the same properties, they are not identical. As shown in Figure 7c, which is a plot of the differences between the two IPDs, the differences fluctuated randomly over the full measuring frequencies. Three rooms and several distances were tested next. The standard deviation was introduced for quantizing the fluctuations. The relation between the standard deviation and the ego-centric distance according to the three room sizes is shown in Figure 7d. The standard deviation increased with decreasing room size and increasing distance of the source. This indicates that short-term IPDs are ambiguous, unrepeatable, and unreliable for a distant sound source.
Next, the repeatability of S.D.AVE calculated using Equation (6) is discussed. Figure 8 shows the relation between S.D.AVE and the ego-centric distance. The standard deviation of S.D.AVE, which was measured five times at each distance, was a maximum of 0.5 degrees at various distances from 0.5 m to 1.5 m. This value was markedly smaller than the fluctuation of IPDs shown in Figure 7d. This implies that S.D.AVE is more repeatable and reliable than IPD.
Figure 9 shows that the values of S.D.AVE were proportional to the ego-centric distance in the eight rooms of different volumes listed in Table 1. The slopes of S.D.AVE with respect to the ego-centric distance depended on the room volume. S.D.AVE values of the short-term IPDs increased with decreasing room size when the distance was held constant. The values of S.D.AVE were compared in eight rooms at distances 0.5 m, 1.0 m, and 1.5 m, when the IPDs were measured repeatedly under the same conditions. Taking account of the repeated measurement fluctuations, these rooms can be categorized into four room sizes for the relatively long (1.5 m) ego-centric distance from the loudspeaker: small (elevator room), middle (room F), intermediate (rooms D, E), large (gymnasium, and rooms A, B, and C). The corresponding room volumes were 70 m3, 113 m3, 347–367 m3, and 726 m3 and above according to the values of S.D.AVE. The room volumes are clearly distinguished in the smaller rooms (rooms D, E, F, and elevator hall) with a distant sound source due to sound reflection. Large rooms above 726 m3 (gymnasium, and rooms A, B, and C) volume were not as precisely distinguished by the present method.

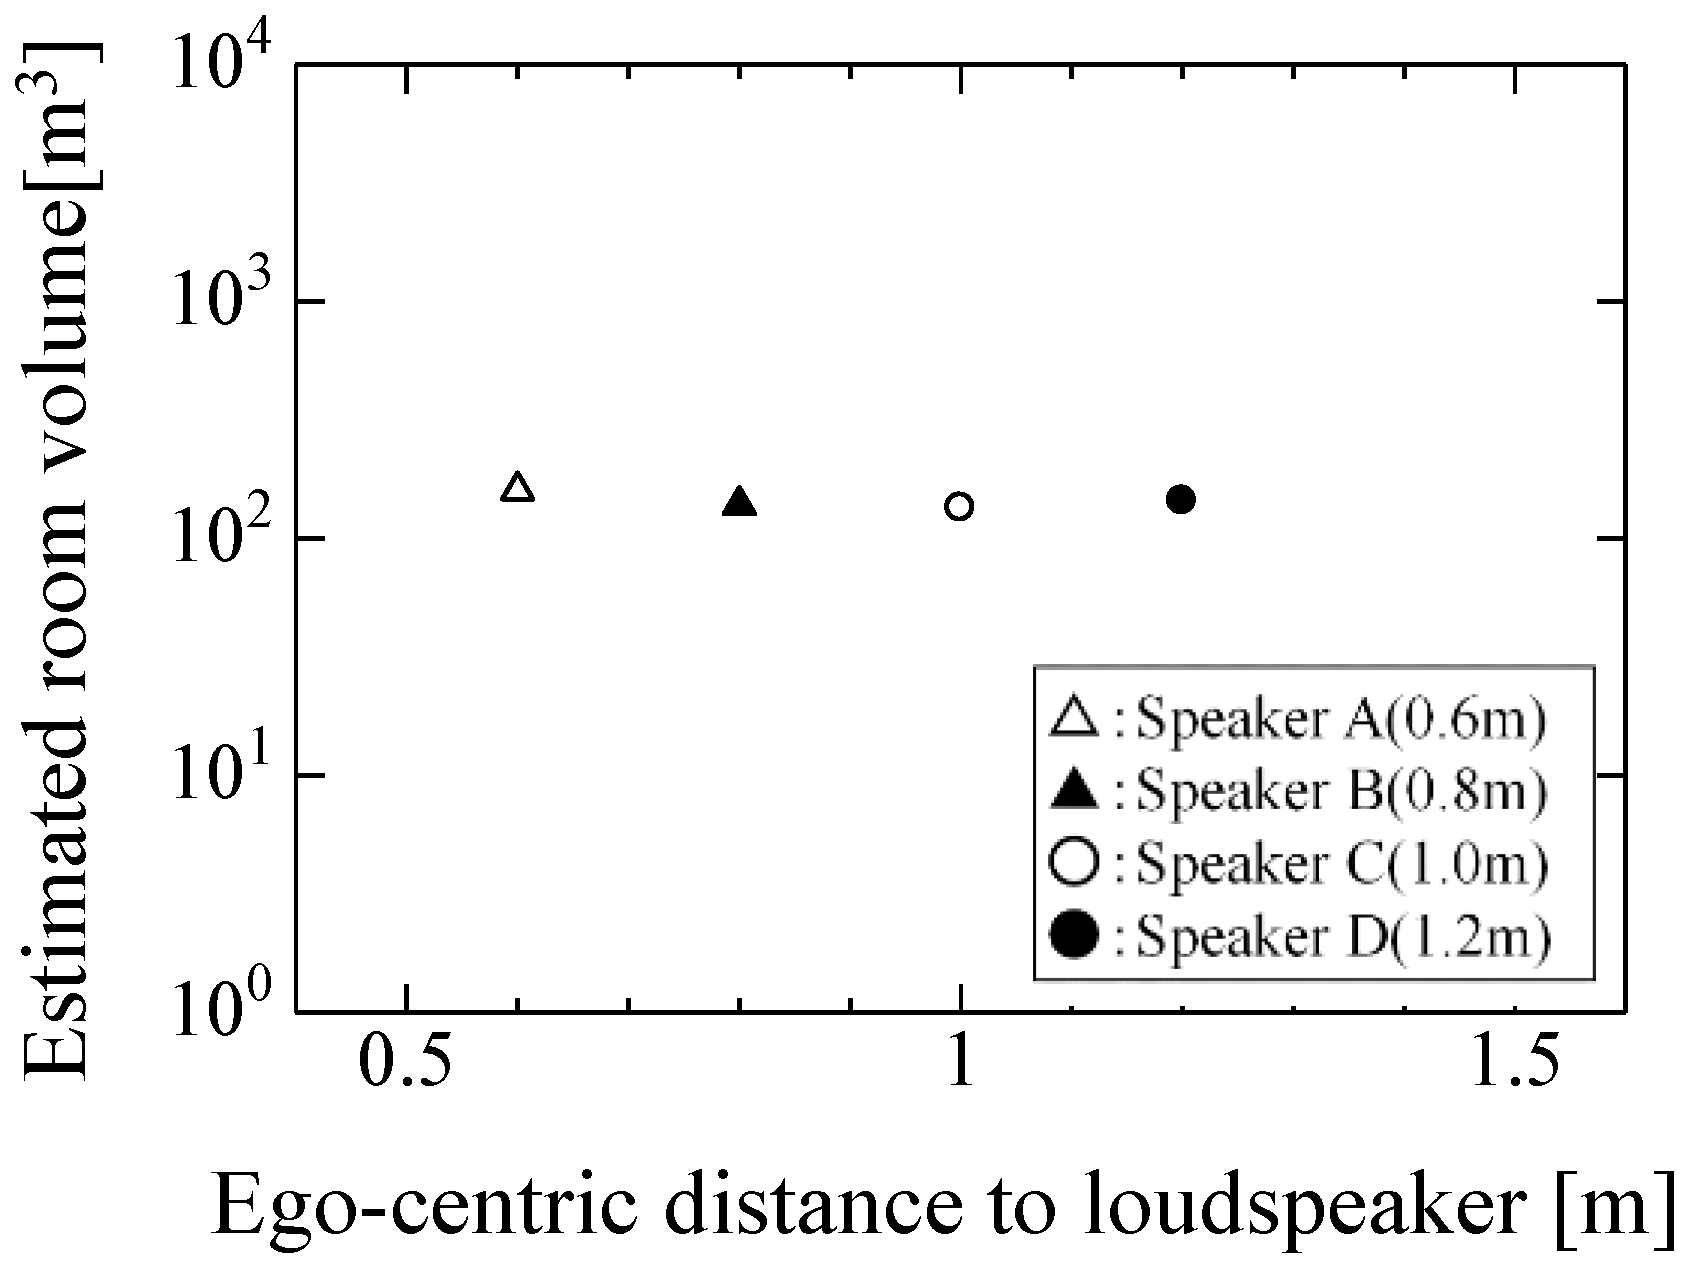
3.2. Estimation of Test Room Volume

Estimation of the room volume of test room G, which is not included in Table 1, is next discussed. Figure 10 shows a 3-D surface for interpolating the relations between the room volumes, the average standard deviations, and ego-centric distances that were experimentally obtained in the eight rooms shown in Table 1. The measurements were conducted in a relatively wide space at the center of each room, in which the desks and the chairs were moved to one wall. The height of rooms A to F and the elevator hall was approximately 3 m. The height of the binaural microphones of the robot head was 0.8 m. The distances to the side walls were longer than the distances to the floor or the ceiling in the measured rooms. The room volume in test room G was estimated by using the relations shown in Figure 10. The volume of test room G was calculated as 1108 m3, 21 m × 11 m × 4.8 m, from the design layout. The estimated room volume was 1113 m3, and the value of S.D.AVE was 10.3 degrees at a distance of 1 m to the loudspeaker. The estimated room volume was in good agreement with the volume calculated from the room design drawing. The maximum error rate of room volume estimation was 22% in the largest room beside the gymnasium, lecture room A, when the IPDs were measured repeatedly in the same room and under the same recording conditions. Since the magnitude of the slope of room volume versus S.D.AVE increases with increasing room volume, the error of the room volume estimation will decrease with decreasing room volume in same way as shown for S.D.AVE in Figure 9. The estimated room volumes approximately agreed with each other in several different rooms with the same actual volumes. Though the room volumes shown in Table 1 are different from each other, large rooms beyond 726 m3 were not as precisely distinguished, as mentioned in Section 3.1. The robot could acoustically categorize test room G as relatively large in terms of room volume.

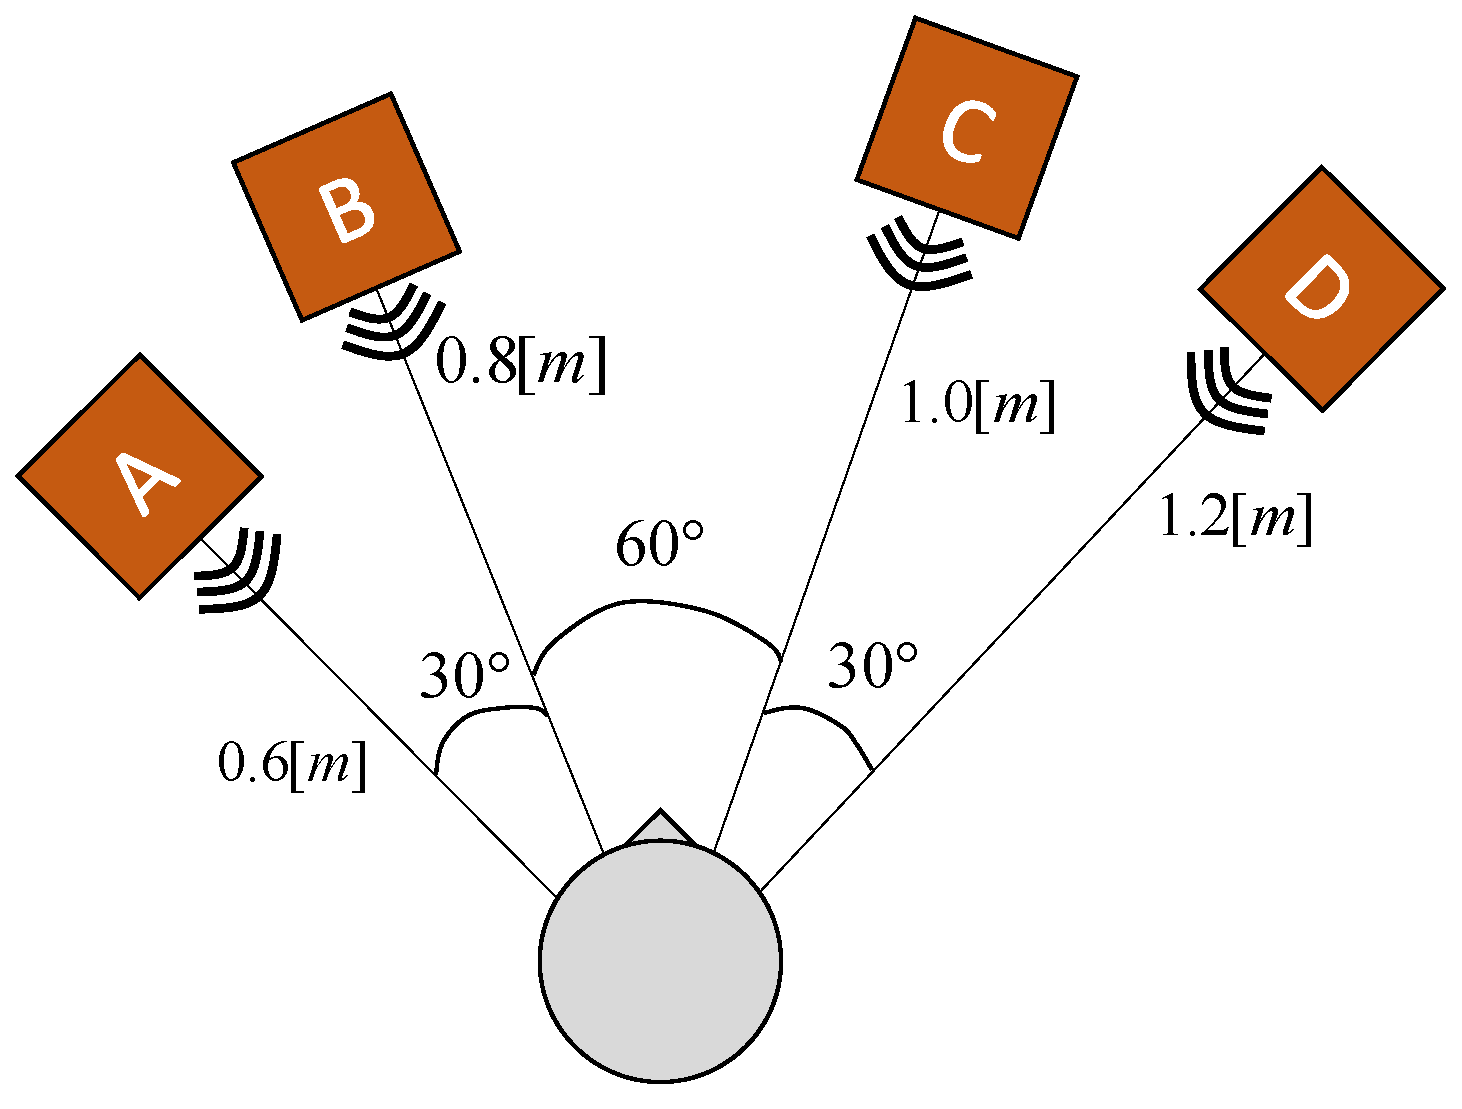
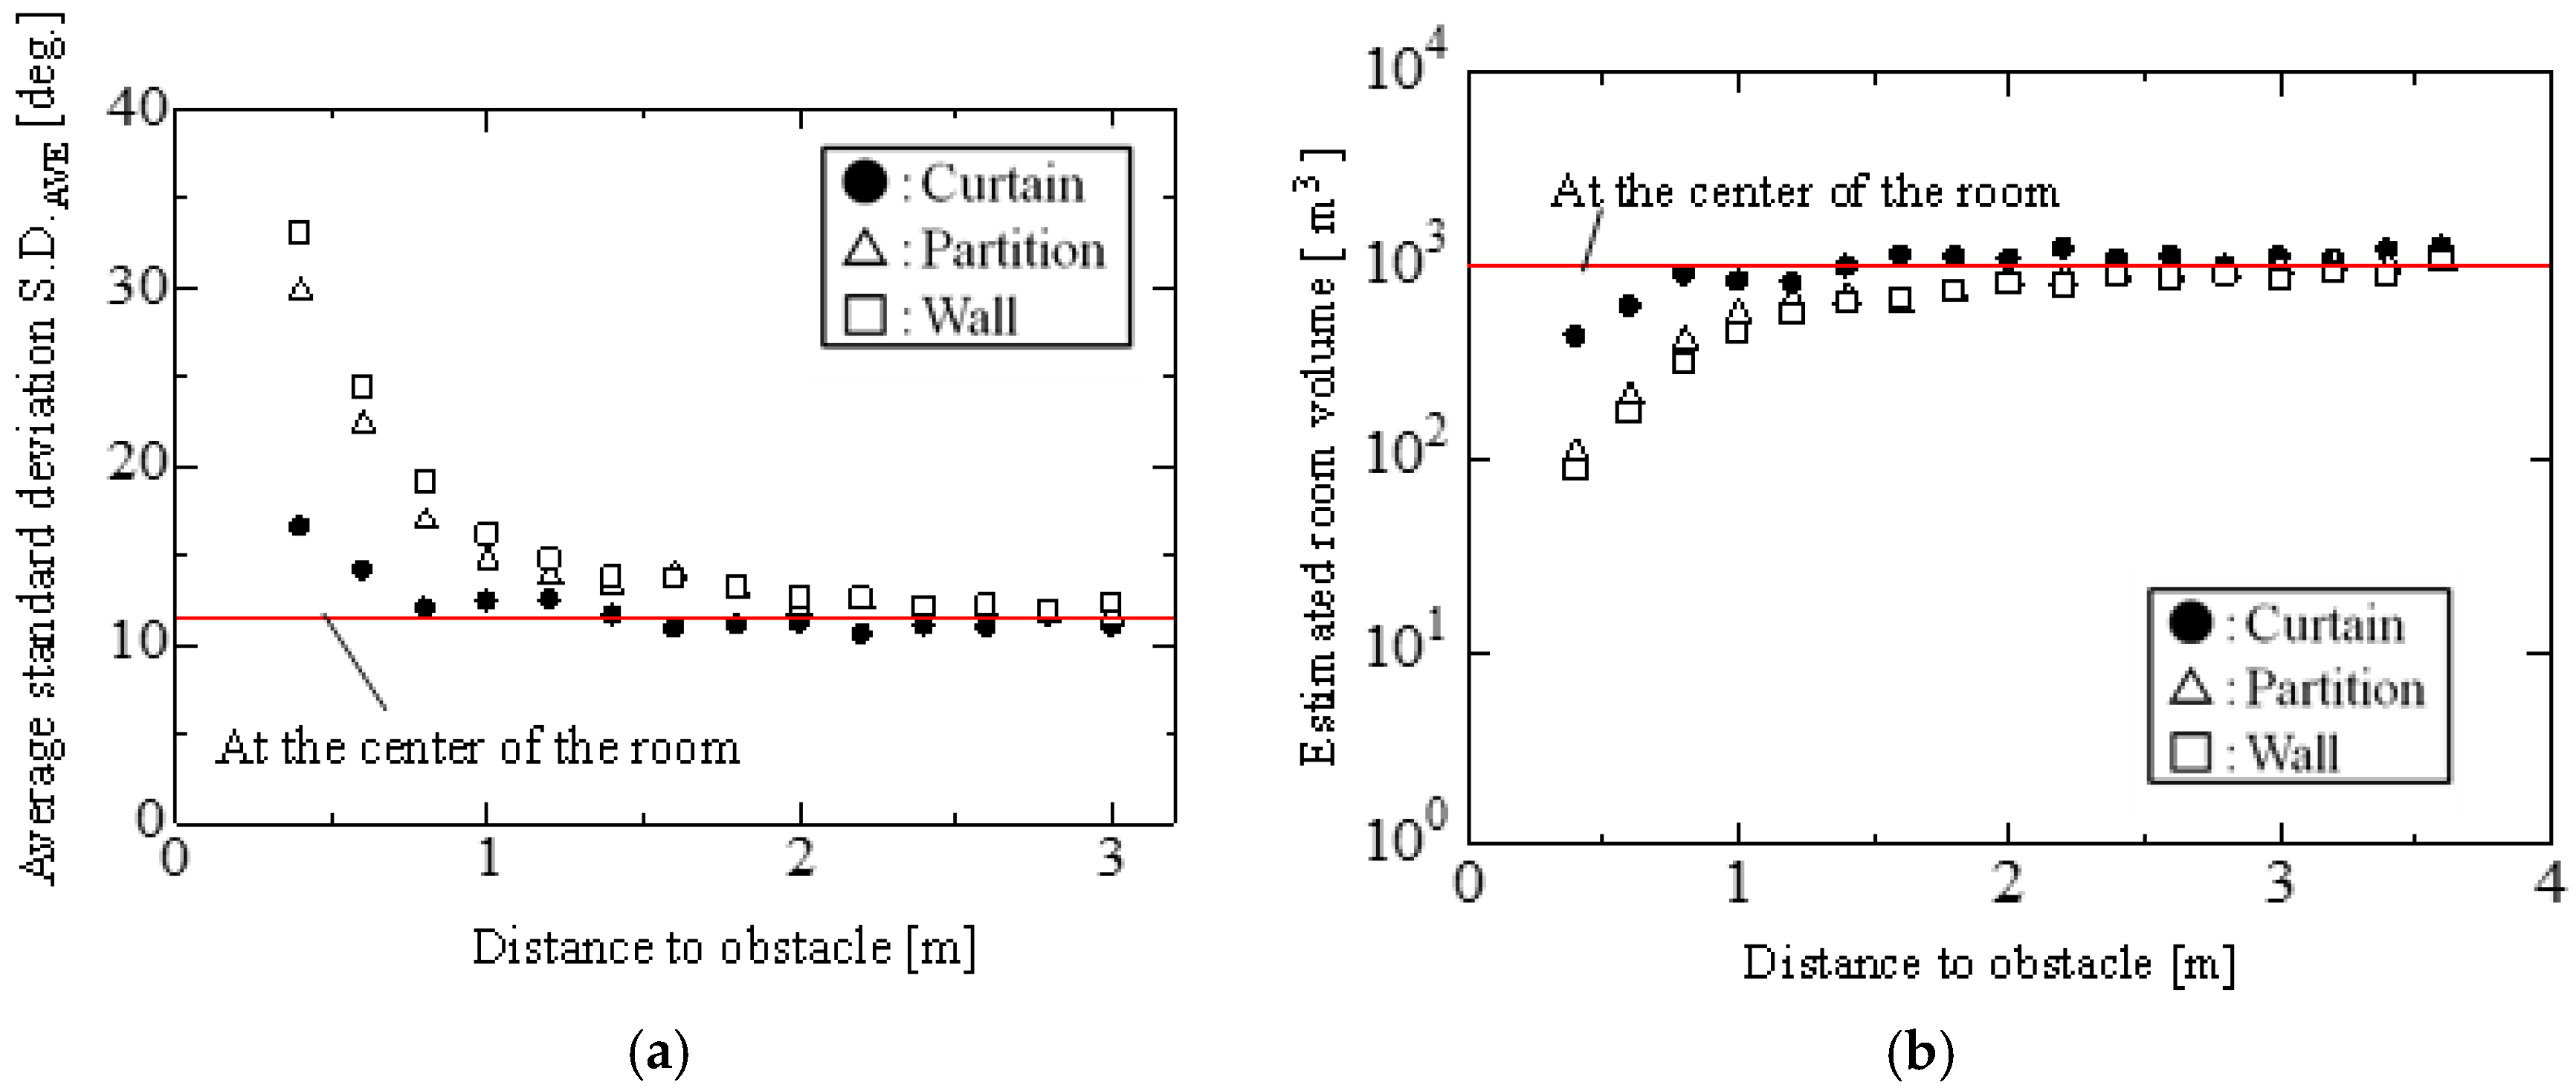
3.3. Effect of Surrounding Obstacles on the Room Volume Estimation

Several obstacles, such as furniture, desks, and chairs, are found in a real room. Sound reflects from their surfaces and diffracts around them. Curtains on windows may also absorb sound energy. The effect of obstacles on the present room volume estimation is discussed in this section. The kind, size, and location of furniture in a room vary, so the following two simple cases are discussed for the same room.
First is the case that no surrounding obstacles are set around the robot for a relatively wide space. The same loudspeaker was located at four positions from A to D at the center of the room, as shown in Figure 11. The absolute positions of the loudspeaker are different in the room, and each angle and ego-centric distance for the loudspeaker is different. The estimated room volumes are shown in Figure 12. The estimated room volume values were almost constant. The statistical properties of the short-term IPDs of sound pressure were not remarkably influenced by the sound reflected from the surrounding obstacles at the center of the room. This result supports that relative positions, not absolute positions, between the loudspeaker and robot are appropriate for estimating the room volume in the present method.
Second, the effect of surrounding obstacles, here a side wall, partitions, and a curtain, on the room volume estimation is discussed. The sound from the loudspeaker located near the wall, the partition, or the curtain was measured. The geometry of the robot, loudspeaker, and obstacles is shown in Figure 13. The loudspeaker was located at a distance of 1 m from the robot in parallel with one side wall. The room volume was estimated when the robot and the loudspeaker were located at various distances from the wall while keeping it parallel with the wall. The sounds were additionally measured in the two cases where four partitions (1.2 m (L) × 1.95 m (H)) were placed in front of the wall or all of the partitions were covered with a curtain.
Figure 14 shows: (a) the relations between the distance to the obstacle and the average standard deviation S.D.AVE; and (b) the relations between the distance to the obstacle and the estimated room volume.
As shown in Figure 14a, S.D.AVE increased with decreasing distance, when the distance to the side wall or the partitions was less than approximately 2 m. This result means that sound reflected from the surface of obstacles may affect S.D.AVE near the obstacles. S.D.AVE values versus the distances to the wall or the partitions have similar characteristics. In the case of the curtain, S.D.AVE increases with decreasing distance when the distance to the curtain was less than approximately 1 m, due to sound absorption by the curtain. When the partitions were covered with a thin curtain, S.D.AVE values were lower than those in the uncovered case. In the same manner, as shown in Figure 14b, the room volume was more underestimated when the loudspeaker and robot were located closer than approximately 2 m to the side wall or the partitions. The room volume was underestimated only when the distance to the curtain was less than approximately 1 m. The room volume value was the same as that in the center of the room when the obstacles were farther than approximately 2 m from the robot and the sound source. Especially, the effect of the curtain was negligible when the curtain was located farther than approximately 1 m due to its sound absorption.
These results imply that the effect of sound reflected from the surface of an obstacle is not negligible in the present room volume estimation. The room volume is underestimated when an obstacle is located close to the loudspeaker and robot.

4. Discussion

In this section, the results of the present paper are discussed in comparison with the results in the references. To the best of our knowledge, room volume has never been estimated passively by using a binaural robot head in conventional methods. We adapted the binaural cue IPDs, which are ITDs transformed from the time domain to the frequency domain. The IPDs are intrinsically the same as the ITDs.
The binaural cues, such as ILDs, ITDs, and the interaural coherence (IC), have been investigated for auditory detection of spatial characteristics (distance, reverberation, and angle of sound source). These binaural cues are affected by the reverberant energy as a function of the listener’s location in the room and the source location relative to the listener [11,22]. Thus, the relations between these binaural cues and the absolute location of the microphones and the source have been a point of contention. Hartmann et al. measured the ICs of sound pressures in various rooms using a binaural head and torso in four rooms smaller than 210 m3 and one room of 3800 m3 [22]. They reported that the ICs markedly depended on the distance between the loudspeaker and microphones and on their absolute locations.
A specific feature of the present method is the short time frame for calculating the DFT. The time frame was set at 0.2 s. In conventional methods, the time frame is set longer than 1 s, since a shorter time frame leads to lower performance [10,11]. Though short-term IPDs are ambiguous, unrepeatable, and unreliable for long-distance sound sources, we found that the average standard deviation value of short-term IPDs was more repeatable and reliable than the IPDs even in reverberation rooms, as mentioned in Section 3. Another feature is the adjustable frequency range, as shown in Figure 3b in Section 2. The average value of the spectral standard deviation depends on this frequency range. An adequate frequency range that is most sensitive to the change of room volume can be selected. When the frequency range was adjusted adequately, average standard deviation is proportional to each ego-centric distance to the source, as shown in Figure 8 and Figure 9 in Section 3. Conventional research using spectral standard deviation provides no solution for setting the frequency range. Georganti et al. reported that the standard deviation values of binaural room transfer functions (BRTFs) followed a distance-dependent behavior [13]. As shown in Figure 10 in Section 3, we found that the average standard deviation of short-term IPDs depended on not only the ego-centric distance to the source but also the room volume. Consequently, the adjusted average standard deviation of short-term IPDs depended only on the relative locations of the source and microphones, not on their absolute locations, as shown in Figure 12 in Section 3. In the present paper, a binaural cue that depends only on the relative locations of the sound source and the microphones and not on their absolute locations is utilized by using short-term IPDs.
The effect of surrounding obstacles such as a side wall, partitions, or a curtain on the average standard deviation of short-term IPDs was discussed in Section 3. The effect of the sound reflected from the surface of the obstacle was not negligible in the present room volume estimation. The room volume was underestimated when the obstacle was located close to the loudspeaker and robot. Both the microphones mounted on the robot head and the loudspeaker were set at a height of 0.8 m from the flour. The distance from the microphones to the ceiling was approximately 2.2 m in lecture rooms B, C, D, and E. The average standard deviations may be affected by the shorter distance to the floor in these rooms, and not by the greater distance to the ceiling. On the other hand, the room volumes in lecture rooms B and C were twice those in lecture rooms D and E. Corresponding to the room volume, the average standard deviations in rooms D and E were almost twice those in rooms B and C at a distance 1.5 m, as shown in Figure 9 in Section 3. The heights of the ceiling were 11.7 m, 3.3 m, and 2.6 m in the gymnasium and lecture rooms A and F, respectively. It seems that the height of the ceiling may not greatly affect the average standard deviations in Figure 9, since the distance between the ceiling and the microphones was sufficient. These results indicate that the average standard deviation of short-term IPDs depends on the volume of the room. It should be emphasized that the effect of reflected sound from not only the floor and the ceiling but also from the far side wall may not be negligible for the average standard deviation.
Another realistic problem is background noise. It is very hard to find a room without people in it talking or other noise. This means that there are usually multiple sound sources in a room. If the sounds are sparse over time such as human voices, the robot can continue to measure S.D.AVE and wait for quiet intervals. The minimum value of S.D.AVE may indicate the room volume, since a distant sound source will give a high S.D.AVE. In the case of continuous noise, the performance of this method will be lower.
Why does the average standard deviation of short-term IPDs depend on the room volume? One of the reasons may be that the fluctuation of waves over time in an acoustical field corresponds to the shape and size of the room. Such a wave field is made by the synthesis of reflected waves and direct waves. An acoustical field may be similar to the water waves in a pool. The water surface with a floating object in the pool fluctuates in height over time. The height of the fluctuation may be higher in a small pool than in a large pool. 3-D simulations in room acoustics may provide an exact answer in the near future.

5. Conclusions

The room volumes of reverberation rooms were estimated from short-term IPDs by a binaural humanoid robot. The robot turned its head toward a sound source with binaural audition and recognized the object that was the sound source with robot vision. Then, the ego-centric distance to the object was estimated with stereovision. The average standard deviation was calculated using short-term IPDs obtained by binaural signals. The relations between the room volumes, the average standard deviations, and the ego-centric distances were experimentally obtained in eight rooms. The volume of a test room was estimated by interpolating these relations. The results are summarized as follows:
(1)
Short-term IPDs are ambiguous, unrepeatable, and unreliable for distant sound sources. Average standard deviation of short-term IPDs (S.D.AVE) is more repeatable and reliable than the IPDs even in reverberation rooms.
(2)
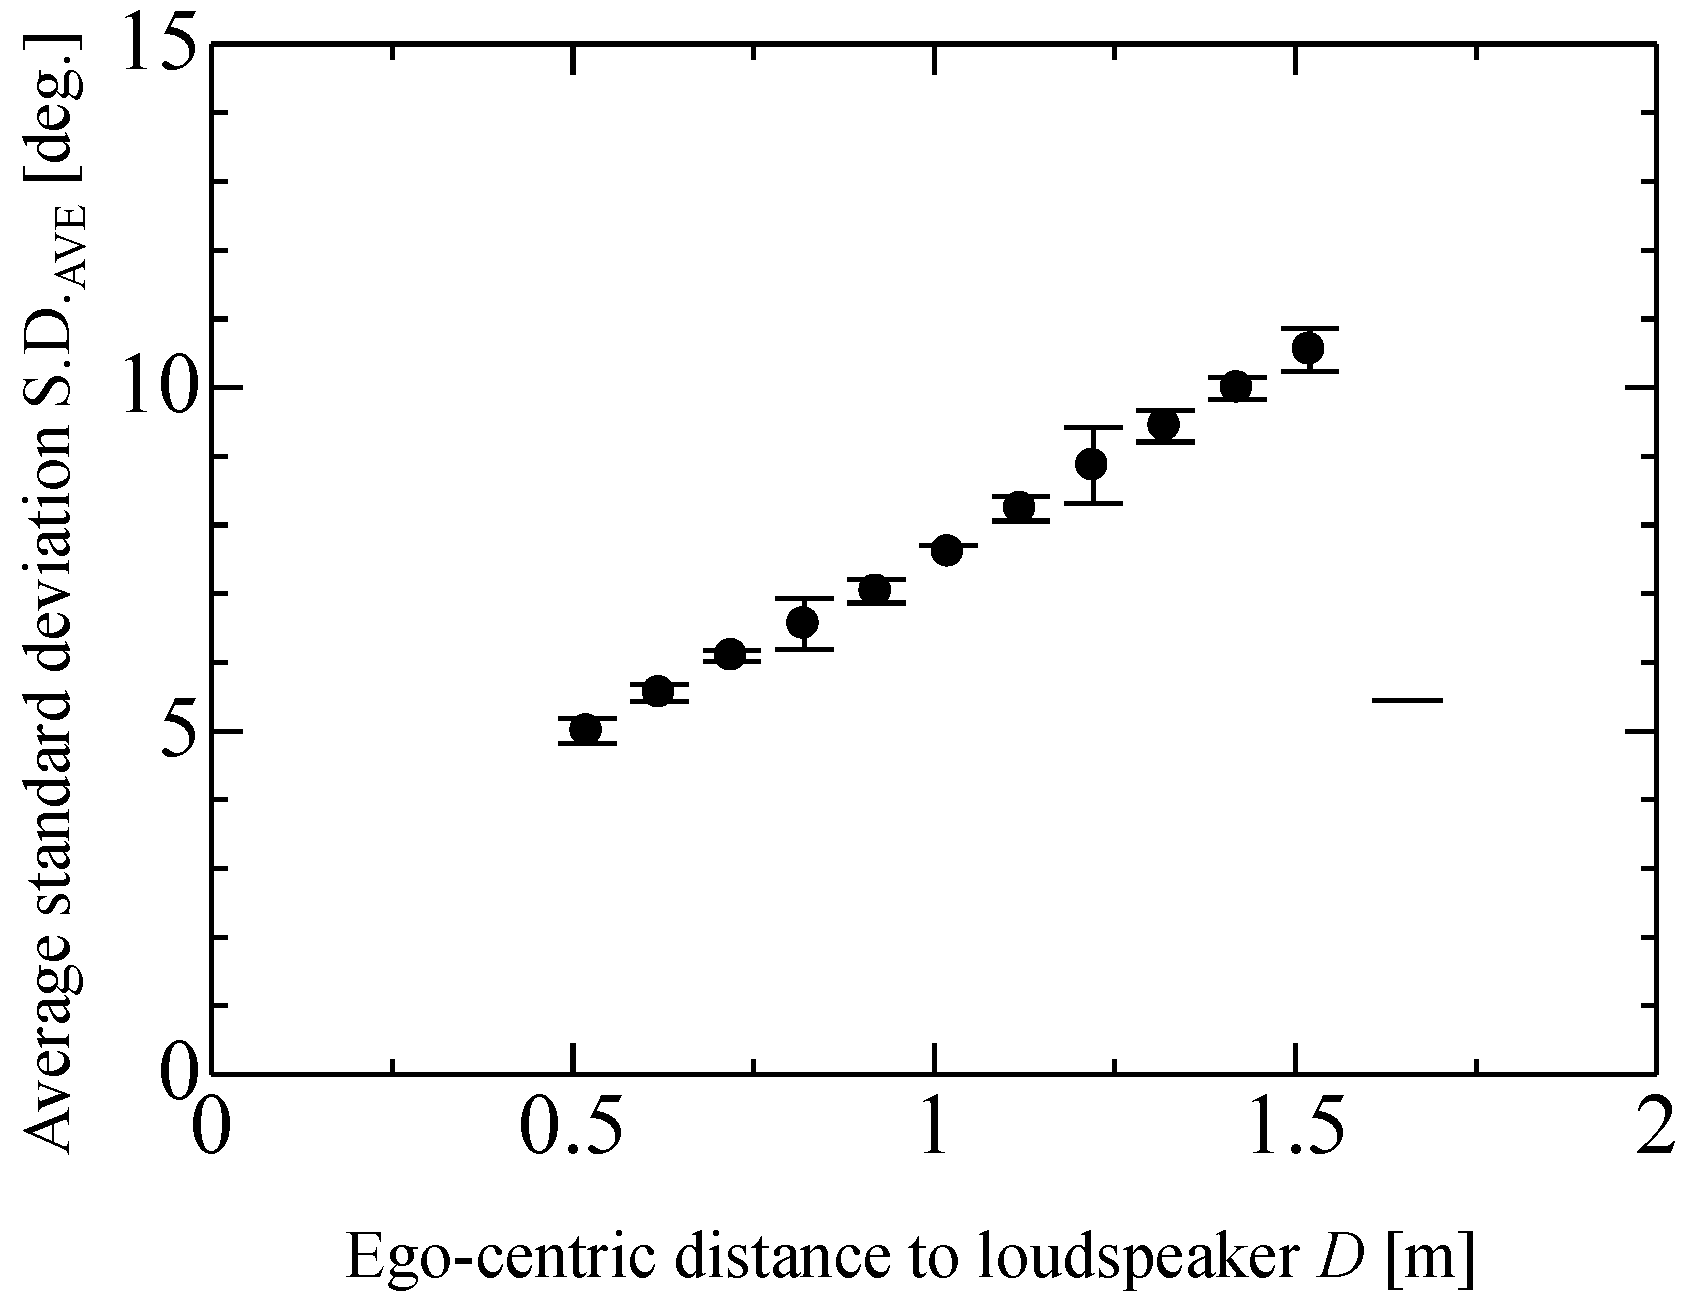
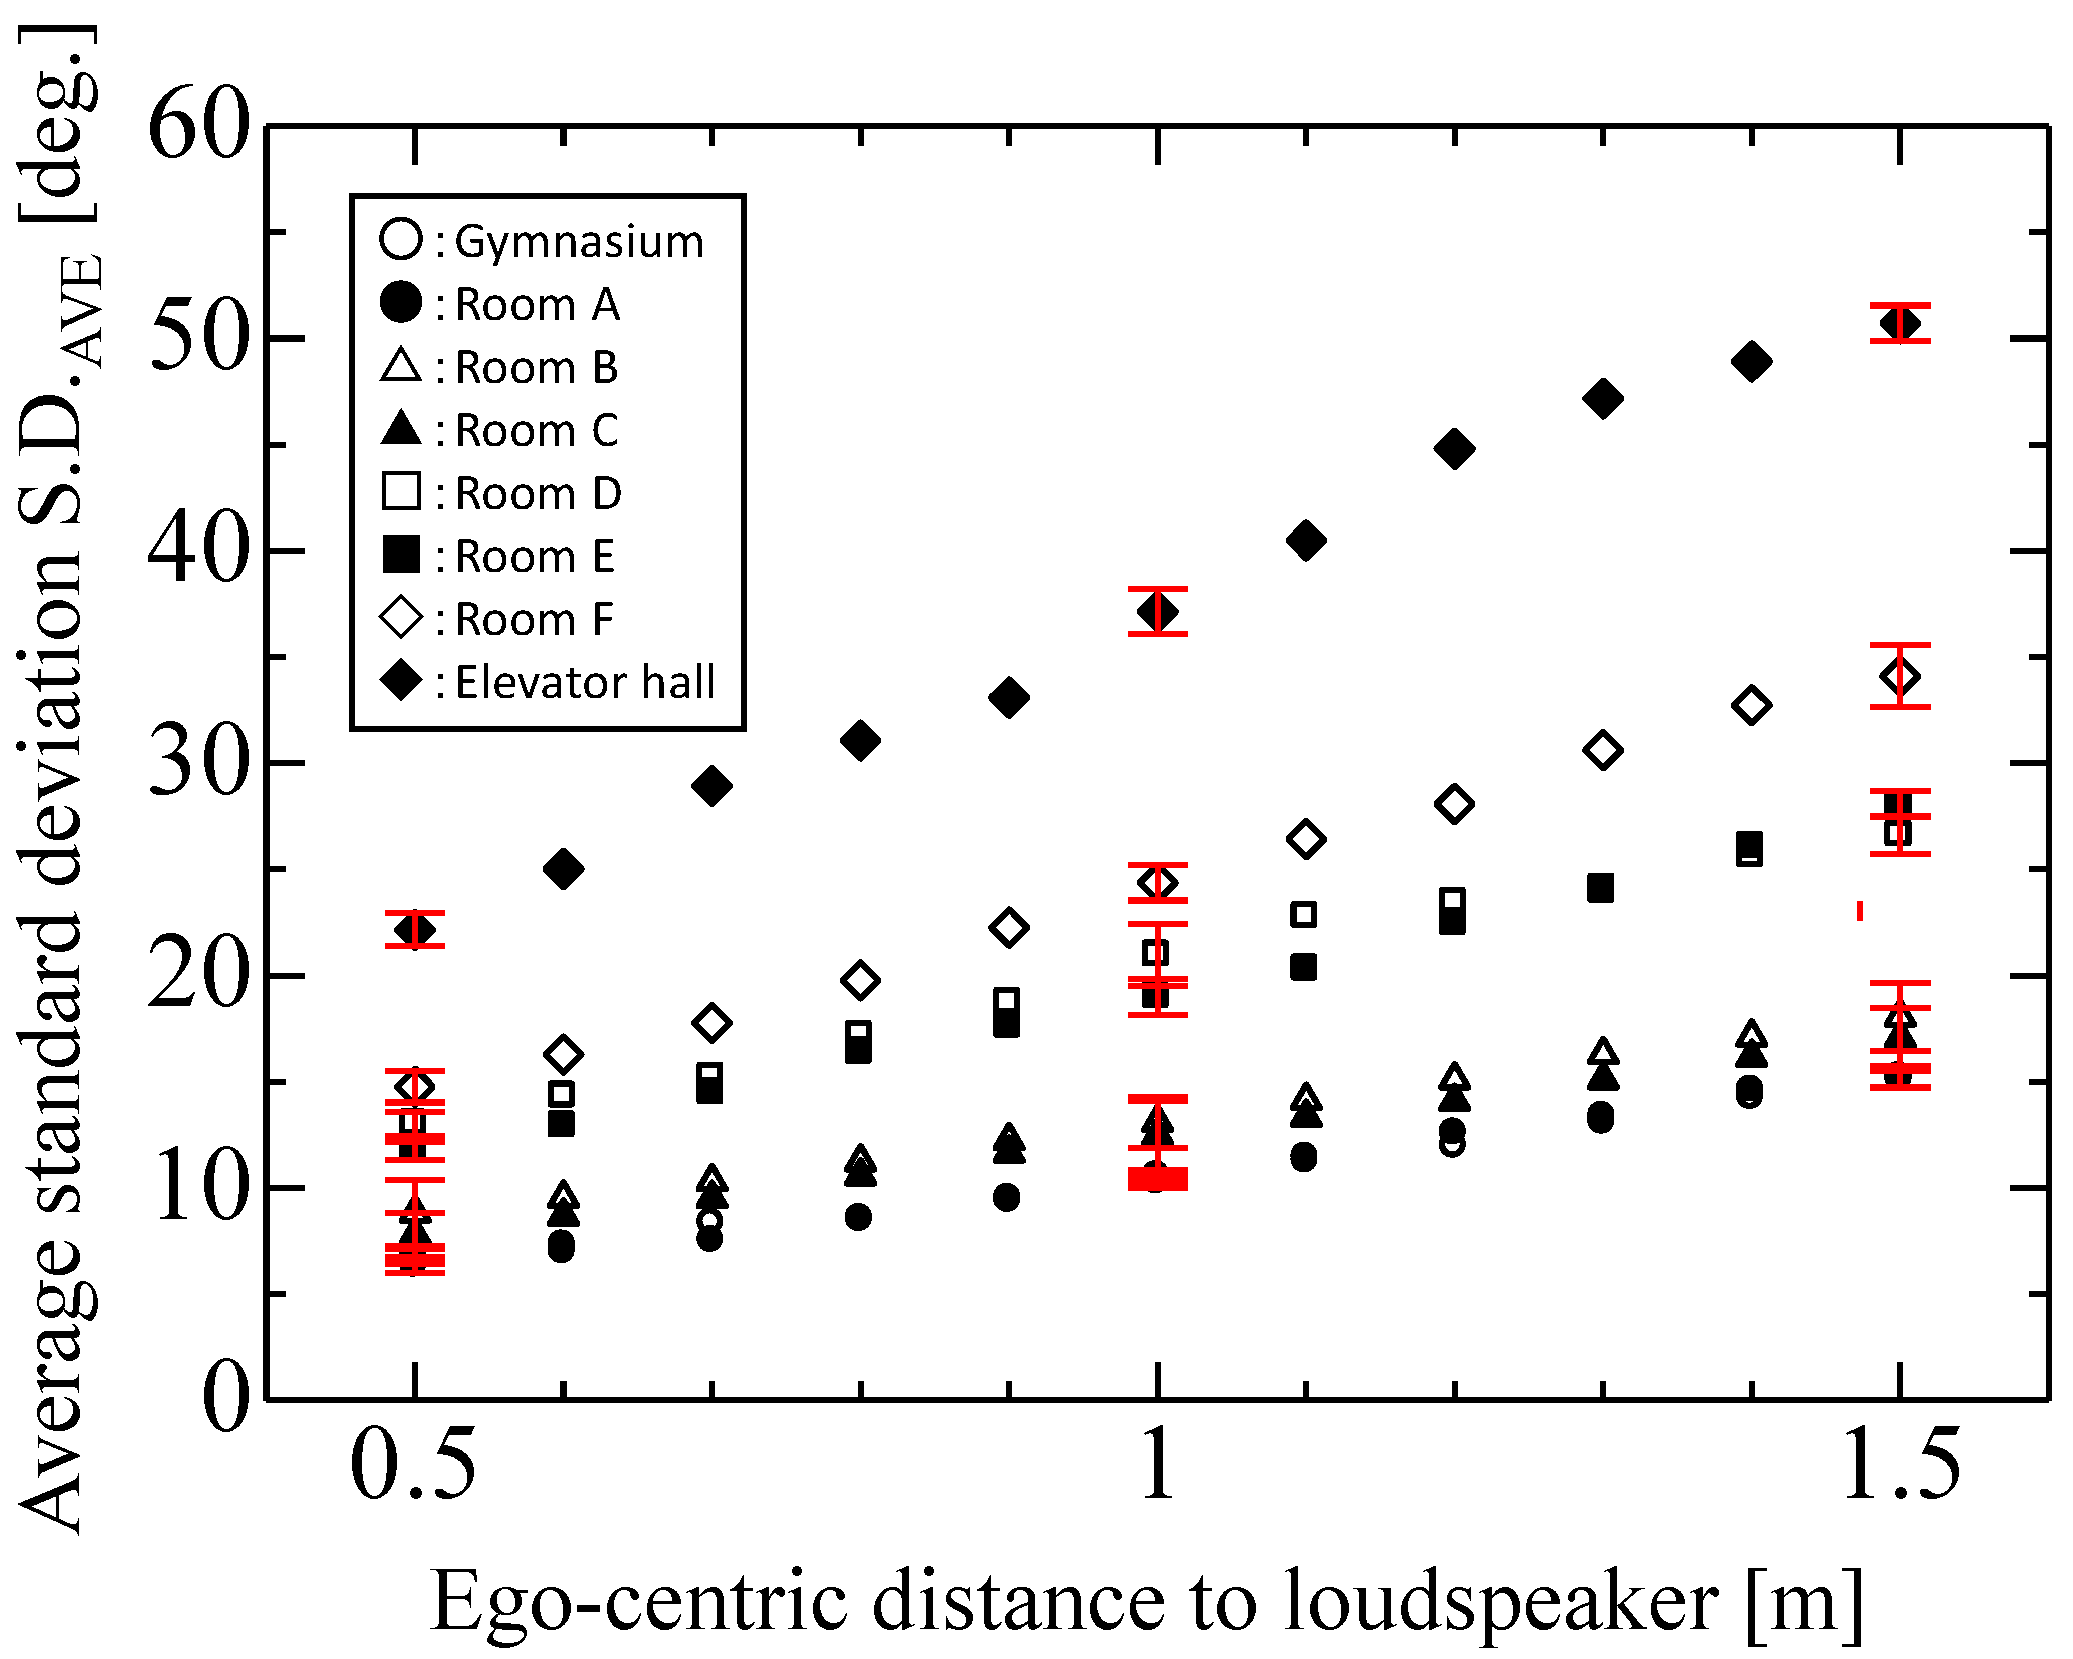
The proposed average standard deviation is proportional to the ego-centric distance to the sound source. The slope of S.D.AVE with respect to the ego-centric distance depends on the room volume.
(3)
The average standard deviation of short-term IPDs depends on the volume of the room. The effect of the reflected sound from not only the floor and the ceiling but also the far wall may not be negligible in the average standard deviation.
(4)
The average standard deviation of short-term IPDs increases with decreasing distance near surrounding obstacles, such as a side wall, partitions, or a curtain. Thus, the room volume is underestimated near the obstacles.
(5)
For eight rooms having different room volumes, the robot could categorize them into four sizes of rooms, namely, small, middle, intermediate, and large, using the average standard deviation values of short-term IPDs.
Several assumptions were necessary for estimating ego-centric distance to a sound source by stereovision, even when the object to be recognized was limited to one loudspeaker. The robot could not identify acoustically each of the eight rooms having different volumes. As is true for humans, the robot could only categorize the place where it was as a room of one of four sizes, namely, small, middle, intermediate, and large. The room volume was underestimated when an obstacle was located close to the loudspeaker and robot. This implies the possibility that a robot can acoustically detect the presence of an obstacle by the change of the estimated room volume when the robot moves toward the obstacle. Such ability may be limited in actual performance. Nevertheless, it will be an additional way for a robot to recognize its surrounding environment, since the robot cannot acoustically localize the position of an obstacle that radiates no sound.
Computer simulation of room acoustics will help to explain this phenomenon in more detail. Room volume estimation under multiple sound sources remains as future work.

Author Contributions

R.S. and R.F. conceived and designed the experiments; R.F. performed the experiments; R.S. and R.F. analyzed the data; R.F. contributed programing/making the robot head/analysis tools; and R.S. wrote the paper.

Conflicts of Interest

The authors declare no conflict of interest.

References

  1. Nakamura, K.; Nakadai, K.; Asano, F.; Hasegawa, Y.; Tsujino, H. Intelligent sound source localization for dynamic environments. In Proceedings of the 2009 IEEE/RSJ International Conference on Intelligent Robots And Systems, St. Louis, MO, USA, 10–15 October 2009; pp. 664–669.
  2. Asano, F.; Asoh, H.; Nakadai, K. Sound source localization using joint Bayesian estimation with a hierarchical noise model. IEEE Trans. Audio Speech Lang. Proc. 2013, 21, 1953–1965. [Google Scholar] [CrossRef]
  3. Shabtai, N.R.; Zigel, Y.; Rafaely, B. Estimating the room volume from room impulse response via hypothesis verification approach. In Proceedings of the 2009 IEEE/SP 15th Workshop on Statistical Signal Processing, Cardiff, UK, 31 August–3 September 2009; pp. 717–720.
  4. Kuster, M. Reliability of estimating the room volume from a single room impulse response. J. Acoust. Soc. Am. 2008, 124, 982–993. [Google Scholar] [CrossRef] [PubMed]
  5. Kearney, G.; Masterson, C.; Adams, S.; Boland, F. Approximation of binaural room impulse responses. Proc. ISSC 2009, 2009, 1–6. [Google Scholar]
  6. Jeub, M.; Schafer, M.; Vary, P. A binaural room impulse response database for the evaluation of dereverberation algorithms. In Proceedings of the 2009 16th International Conference on Digital Signal Processing, Santorini, Creece, 5–7 July 2009; pp. 1–5.
  7. Larsen, E.; Schmitz, C.D. Acoustic scene analysis using estimated impulse responses. Proc. Signals Syst. Comp. 2004, 1, 725–729. [Google Scholar]
  8. Shinn-Cunningham, B.G.; Kopco, N.; Martin, T.J. Localizing nearby sound sources in a classroom: Binaural room impulse responses. J. Acoust. Soc. Am. 2005, 117, 3100–3115. [Google Scholar] [CrossRef] [PubMed]
  9. Shabtai, N.R.; Zigel, Y.; Rafaely, B. Feature selection for room volume identification from room impulse response. In Proceedings of the 2009 IEEE Workshop on Applications of Signal Processing to Audio and Acoustics, New Paltz, NY, USA, 18–21 October 2009.
  10. Vesa, S. Binaural sound source distance learning in rooms. IEEE Trans. Audio Speech Lang. Proc. 2009, 17, 1498–1507. [Google Scholar] [CrossRef]
  11. Georganti, E.; May, T.; Par, S.V.D.; Mourjopoulos, J. Sound source distance estimation in rooms based on statistical properties of binaural signals. IEEE Trans. Audio Speech Lang. Proc. 2013, 21, 1727–1741. [Google Scholar] [CrossRef]
  12. Jetzt, J.J. Critical distance measurement of rooms from the sound energy spectral response. J. Acoust. Soc. Am. 1979, 65, 1204–1211. [Google Scholar] [CrossRef]
  13. Bronkhorst, A.W.; Houtgast, T. Auditory distance perception in rooms. Nature 1999, 397, 517–520. [Google Scholar] [CrossRef] [PubMed]
  14. Kuster, M. Estimating the direct-to reverberant energy ratio from the coherence between coincident pressure and particle velocity. J. Acoust. Soc. Am. 2011, 130, 3781–3787. [Google Scholar] [CrossRef] [PubMed]
  15. Georganti, E.; Mourjopoulos, J.; Par, S.V.D. Room statistics and direct-to-reverberant ratio estimation from dual-channel signals. In Proceedings of the 2014 IEEE International Conference on Acoustics, Speech and Signal Processing (ICASSP), Florence, Italy, 4–9 May 2014; pp. 42–47.
  16. Eaton, J.; Moore, A.H.; Naylor, P.A.; Skoglund, J. Direct-to-reverberant ratio estimation using a null-steered beamformer. In Proceedings of the 2015 IEEE International Conference on Acoustics, Speech and Signal Processing (ICASSP), South Brisbane, Austrelia, 19–24 April 2015; pp. 46–50.
  17. Hioka, Y.; Niwa, K. Estimating direct-to-reverberant ratio mapped from power spectral density using deep neural network. In Proceedings of the 2016 IEEE International Conference on Acoustics, Speech and Signal Processing (ICASSP), Shanghai, China, 20–25 March 2016; pp. 149–152.
  18. Hu, J.S.; Liu, W.H. Location classification of nonstationary sound sources using binaural room distribution patterns. IEEE Trans. Audio Speech Lang. Proc. 2009, 17, 682–692. [Google Scholar] [CrossRef]
  19. Nix, J.; Holmann, V. Sound source localization in real sound fields based on empirical statistics of interaural parameters. J. Acoust. Soc. Am. 2006, 119, 463–479. [Google Scholar] [CrossRef] [PubMed]
  20. Kido, K.; Suzuki, H.; Ono, T. Deformation of impulse response estimates by time window in cross spectral technique. J. Acoust. Soc. Jpn. (E) 1998, 19, 249–361. [Google Scholar] [CrossRef]
  21. Shimoyama, R.; Yamazaki, K. Computational acoustic vision by solving phase ambiguity confusion. Acoust. Sci. Tech. 2009, 30, 199–208. [Google Scholar] [CrossRef]
  22. Hartmann, W.M.; Rakerd, B.; Koller, A. Binaural coherence in rooms. Acta Acust. United Acust. 2005, 91, 451–462. [Google Scholar]
  23. Shimoyama, R.; Fukuda, R. Room volume estimation based on statistical properties of binaural signals using humanoid robot. In Proceedings of the 23rd International Conference on Robotics in Alpe-Adria-Danube Region (RAAD), Smolenice, Slovakia, 3–5 September 2014; pp. 1–6.
Figure 1. Geometry of humanoid robot head and loudspeaker in reverberative rooms (an overhead view). The robot turns its head toward the loudspeaker by binaural audition, recognizes the object, and then estimates Ego-centric distance D to the loudspeaker by stereovision. Short-term IPDs of binaural sound signals are utilized for identifying the room volume.
Robotics 05 00016 g001
Figure 2. Geometry of stereo cameras mounted in robot’s eye and the object as a sound source. Ego-centric distance D to the object is estimated from two visual angles.
Robotics 05 00016 g002
Figure 3. Method for evaluating statistical properties of binaural signals: (a) method for calculating the frequency spectrum of standard deviation from short-term IPDs of binaural signals; and (b) frequency spectrum of the standard deviation and its average value from fmin to fmax.
Robotics 05 00016 g003
Figure 4. Proposed algorithm.
Robotics 05 00016 g004
Figure 5. Appearance of humanoid robot head. An auto-focus camera was mounted in each robot’s eye. Earphone-type microphones are added for sound detection. The robot head was fixed on the pan tilt unit, in which motion is controlled by a workstation.
Robotics 05 00016 g005
Figure 6. Measuring system configuration.
Robotics 05 00016 g006
Figure 7. These figures show that the repeatability of short-term IPDs depends on the room volume. Standard deviation was proportional to ego-centric distance to loudspeaker: (a) first; (b) second; (c) Difference between (a) and (b); and (d) Standard deviation to distance. (a,b) The same room and recording conditions recorded during the first and second recordings, respectively.
Robotics 05 00016 g007
Figure 8. Relation between S.D.AVE and the ego-centric distance to loudspeaker. S.D.AVE is repeatable and steady for measurement repetitions under same conditions.
Robotics 05 00016 g008
Figure 9. Relation between S.D.AVE and the ego-centric distance to loudspeaker in the eight rooms of different volumes listed in Table 1.
Robotics 05 00016 g009
Figure 10. Relations between the room volumes, the average standard deviations, and ego-centric distances that were experimentally obtained in the eight rooms shown in Table 1. Room G, which was not included in Table 1, was a test room.
Robotics 05 00016 g010
Figure 11. One speaker located at four positions from A to D in the center of the room. The absolute positions in the room of the loudspeaker differed and the angles and ego-centric distances for the speaker also differed.
Robotics 05 00016 g011
Figure 12. Estimated room volumes. The estimated room volume values were almost constant. That is, the present room volume estimation may not depend on the absolute position of the loudspeaker.
Robotics 05 00016 g012
Figure 13. Geometry of the robot, loudspeaker, and obstacles: a wall, partitions, and partitions covered with a thin curtain.
Robotics 05 00016 g013
Figure 14. Effect of three types of obstacle: a wall, partitions, and the partitions covered with a thin curtain. (a,b) were measured in the same room: (a) the relation between S.D.AVE and distance to obstacle; and (b) the estimated room volume to distance to the obstacle. Red lines indicate the cases that the loudspeaker and robot were located far from the side wall in a relatively wide space. The effect of the obstacle increases with decreasing distance for obstacle less than approximately 2 m.
Robotics 05 00016 g014
Table 1. Room measurements and volumes.
RoomRoom Measurement
L[m]×W[m]×H[m]
Room Volume [m3]
Gymnasium26.0 × 39.0 × 11.7119 × 102
Lecture room A20.1 × 14.7 × 3.3971
Lecture room B14.3 × 17.6 × 3.0755
Lecture room C14.1 × 17.1 × 3.0726
Lecture room D9.0 × 13.6 × 3.0367
Lecture room E8.5 × 13.6 × 3.0347
Lecture room F5.7 × 7.6 × 2.6113
Elevator hall7.8 × 3.6 × 3.070

