
Sensor Fusion and Autonomy as a Powerful Combination for Biological Assessment in the Marine Environment


Abstract
:1. Introduction
2. Experimental Section
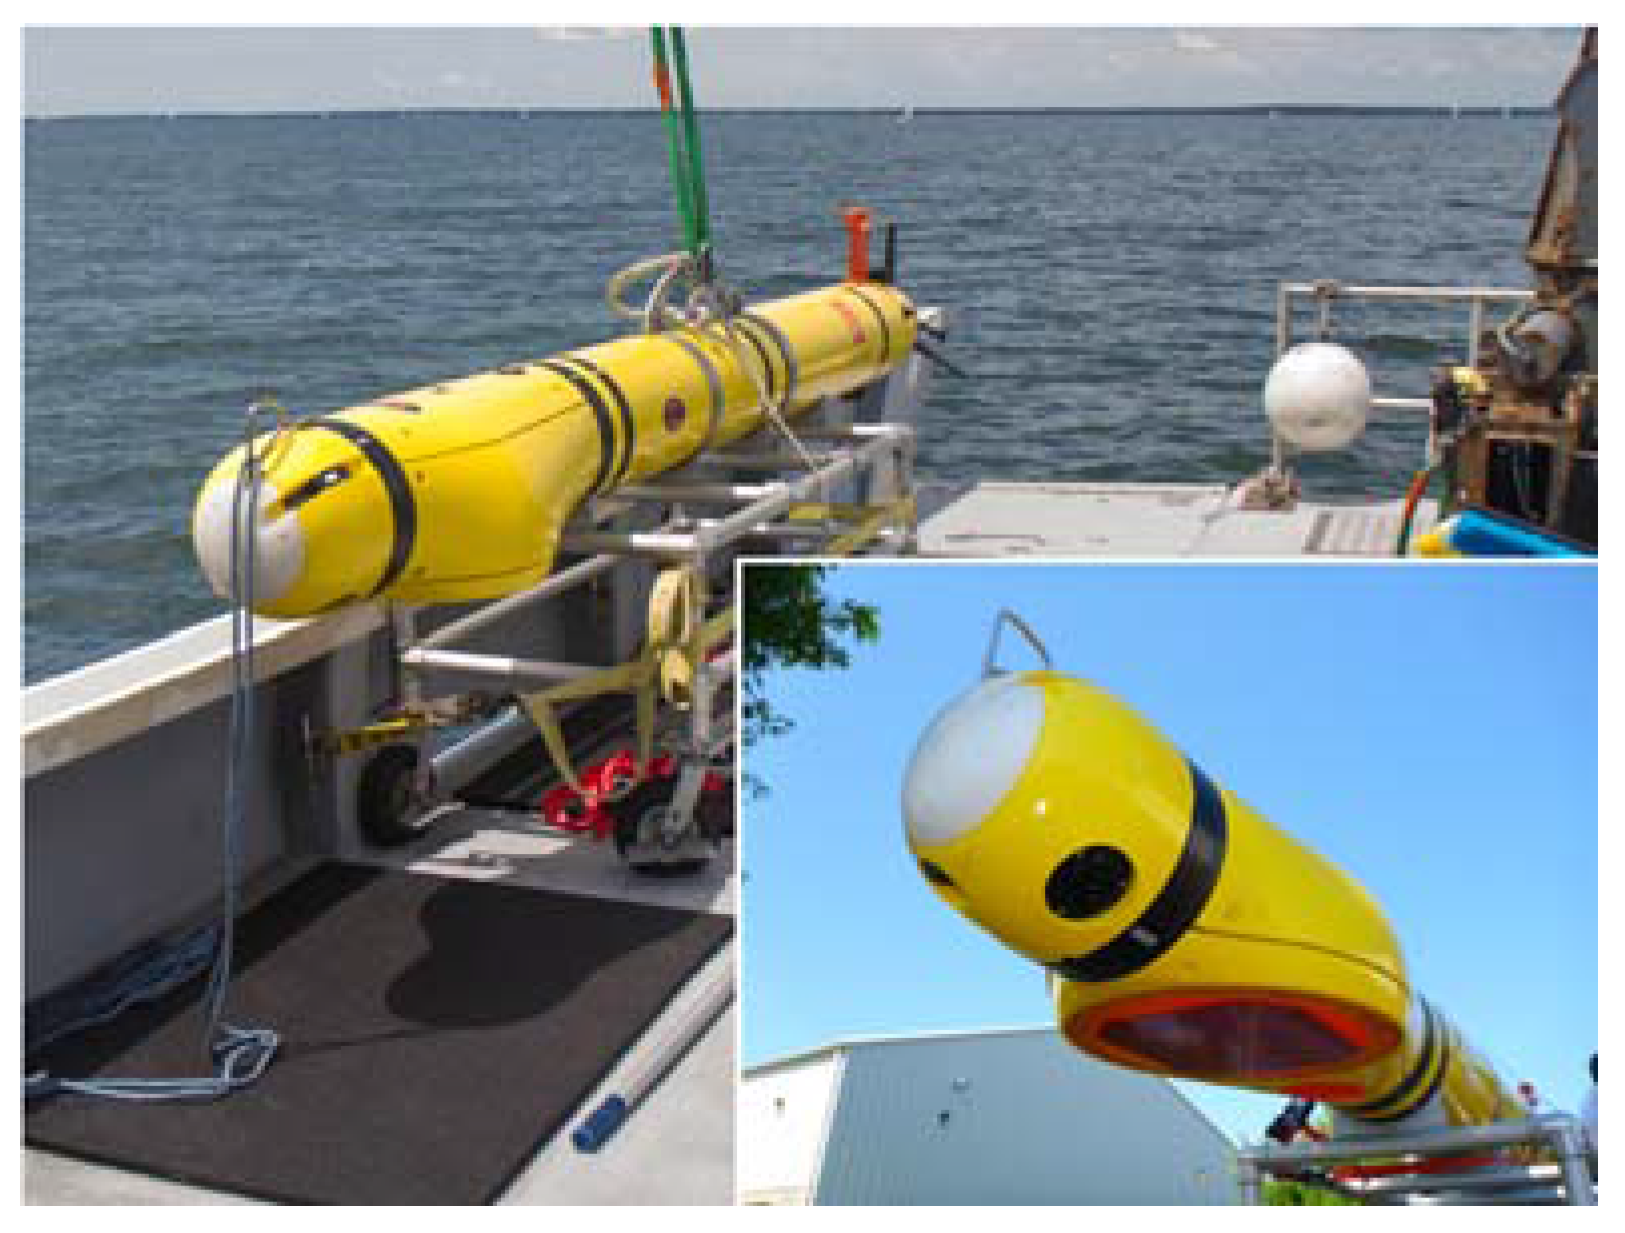
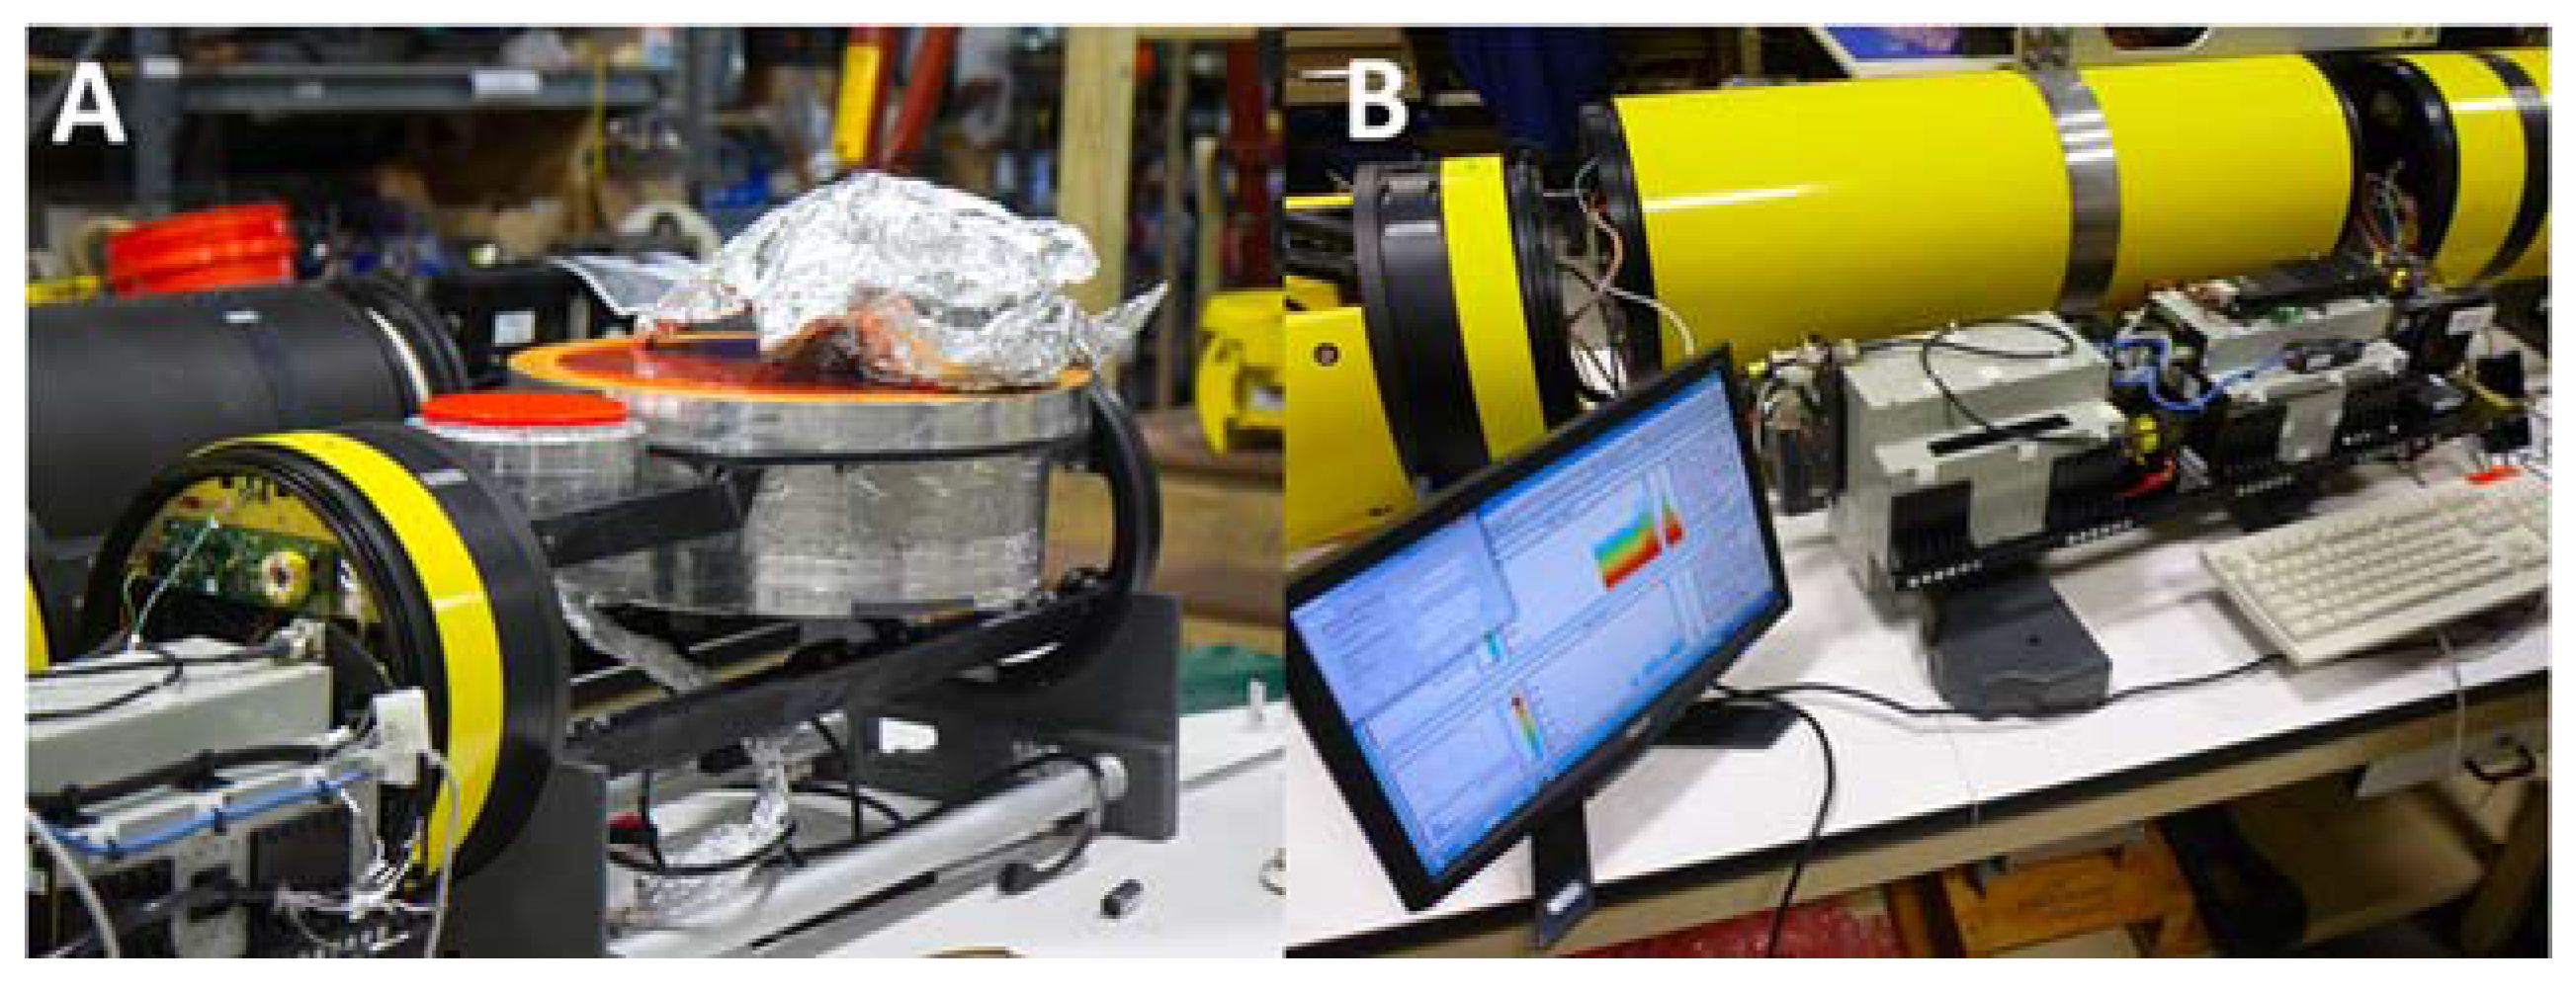
2.1. Integration of Scientific Echosounders into an Autonomous Underwater Vehicle

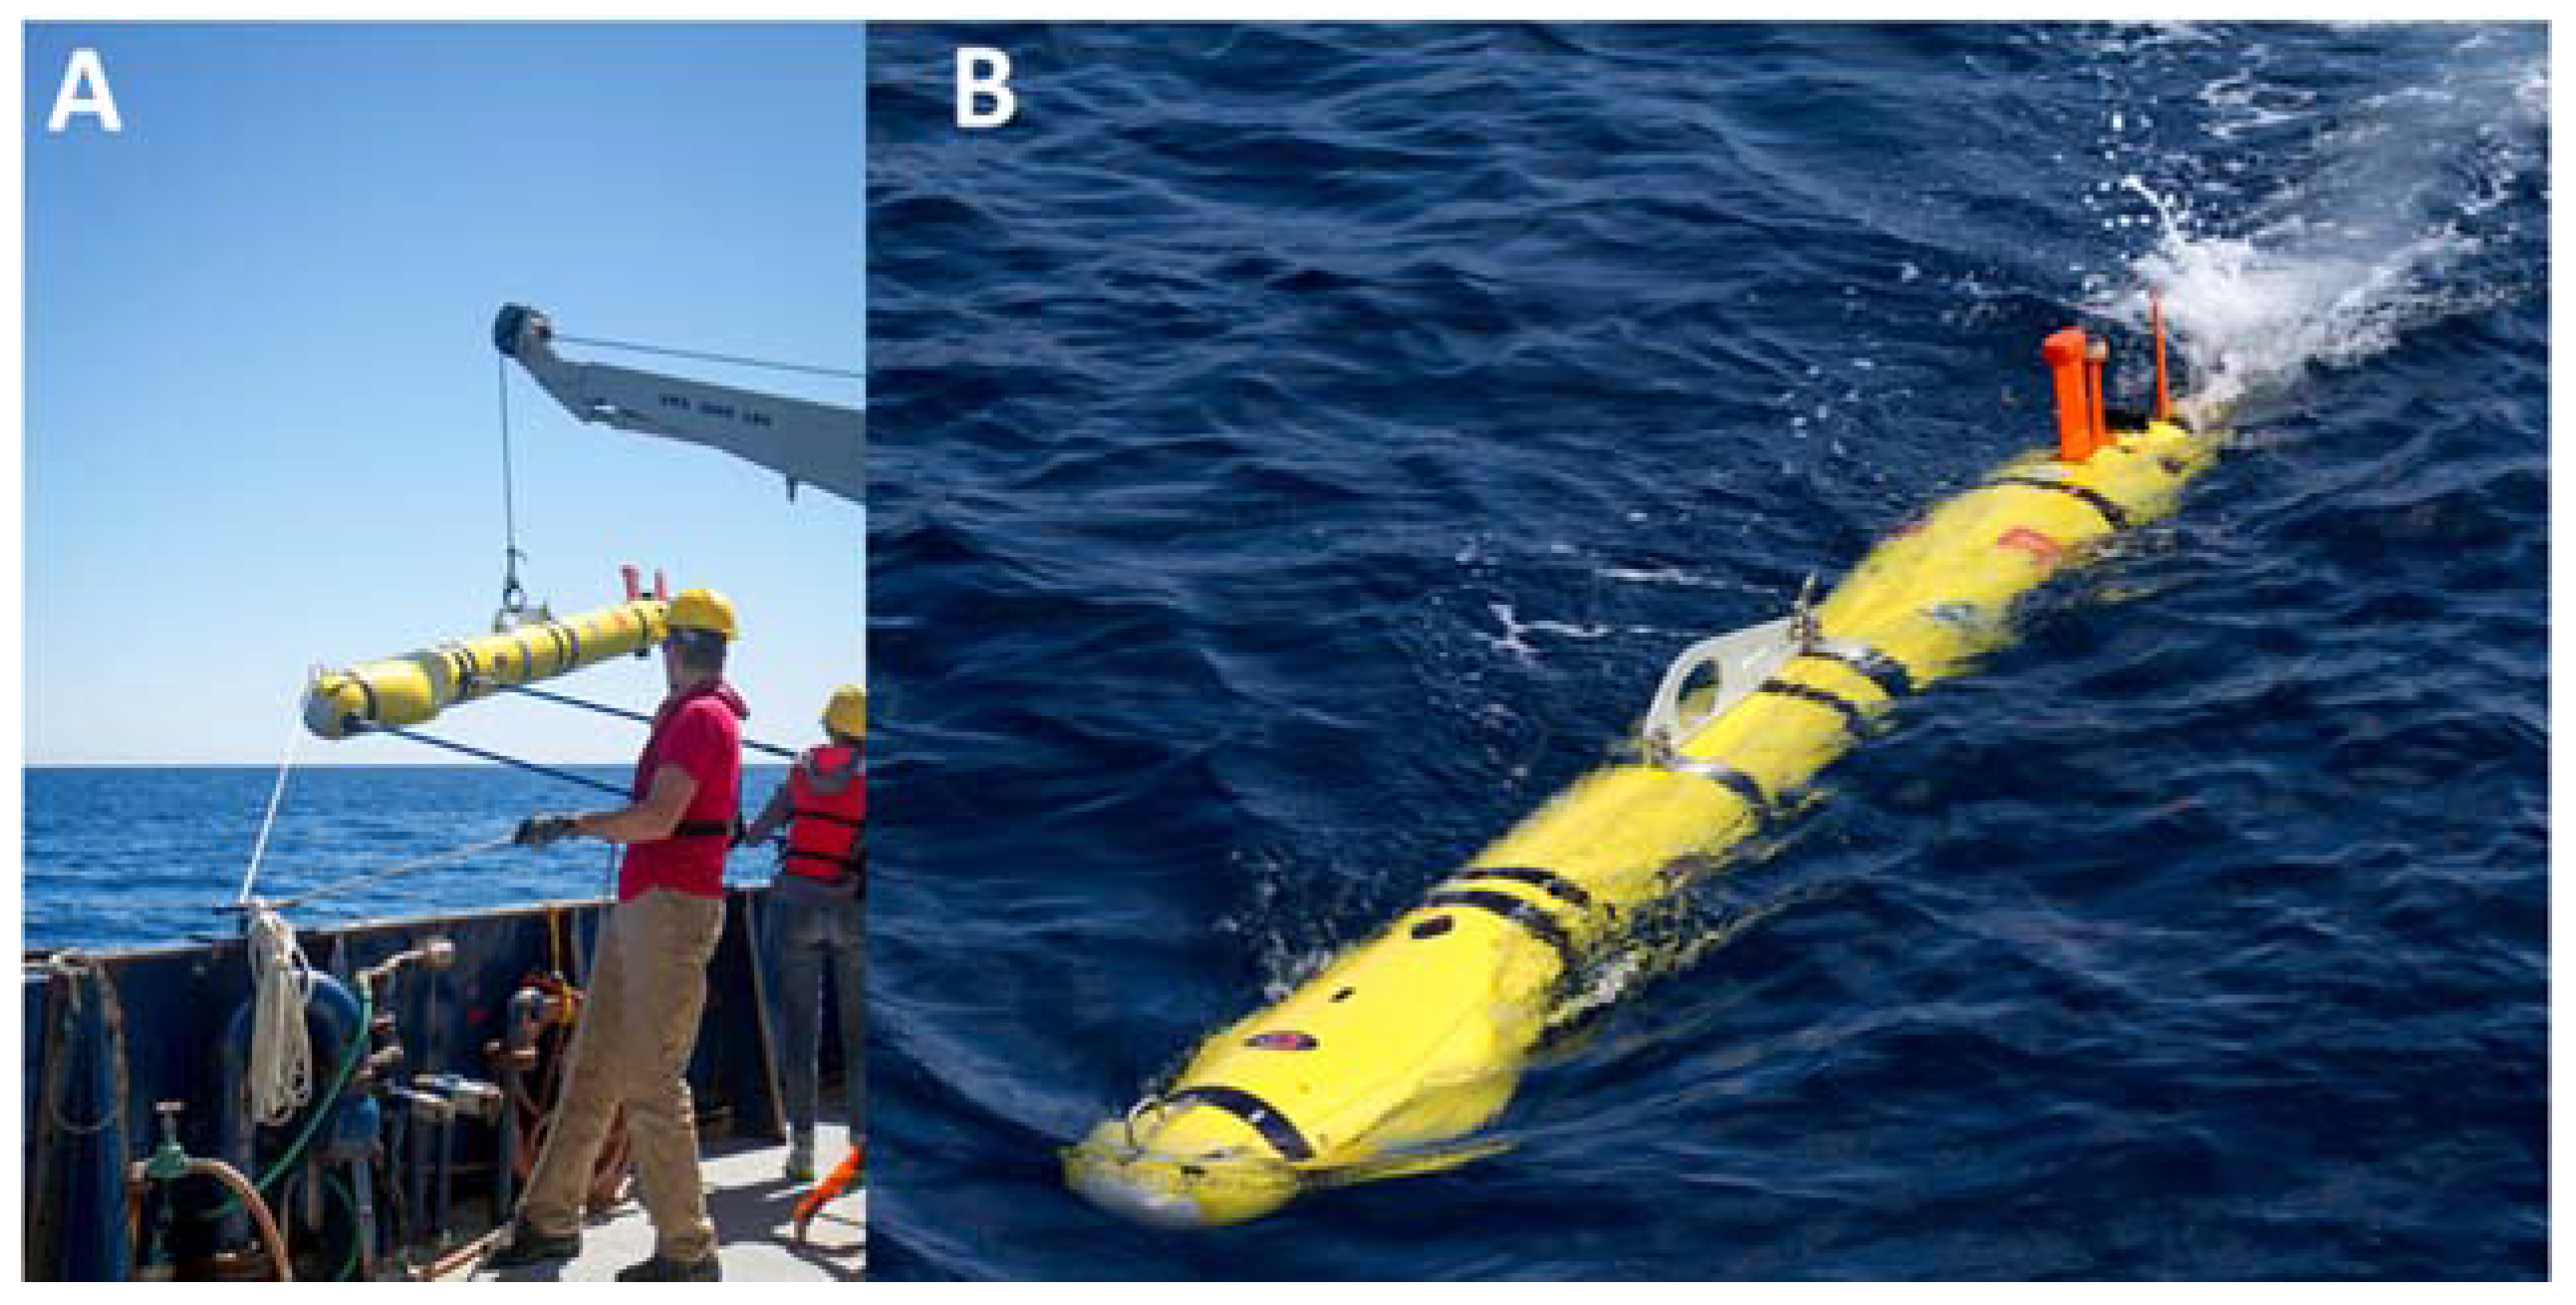
2.2. Advantages of Using an AUV as a Platform for Echosounders

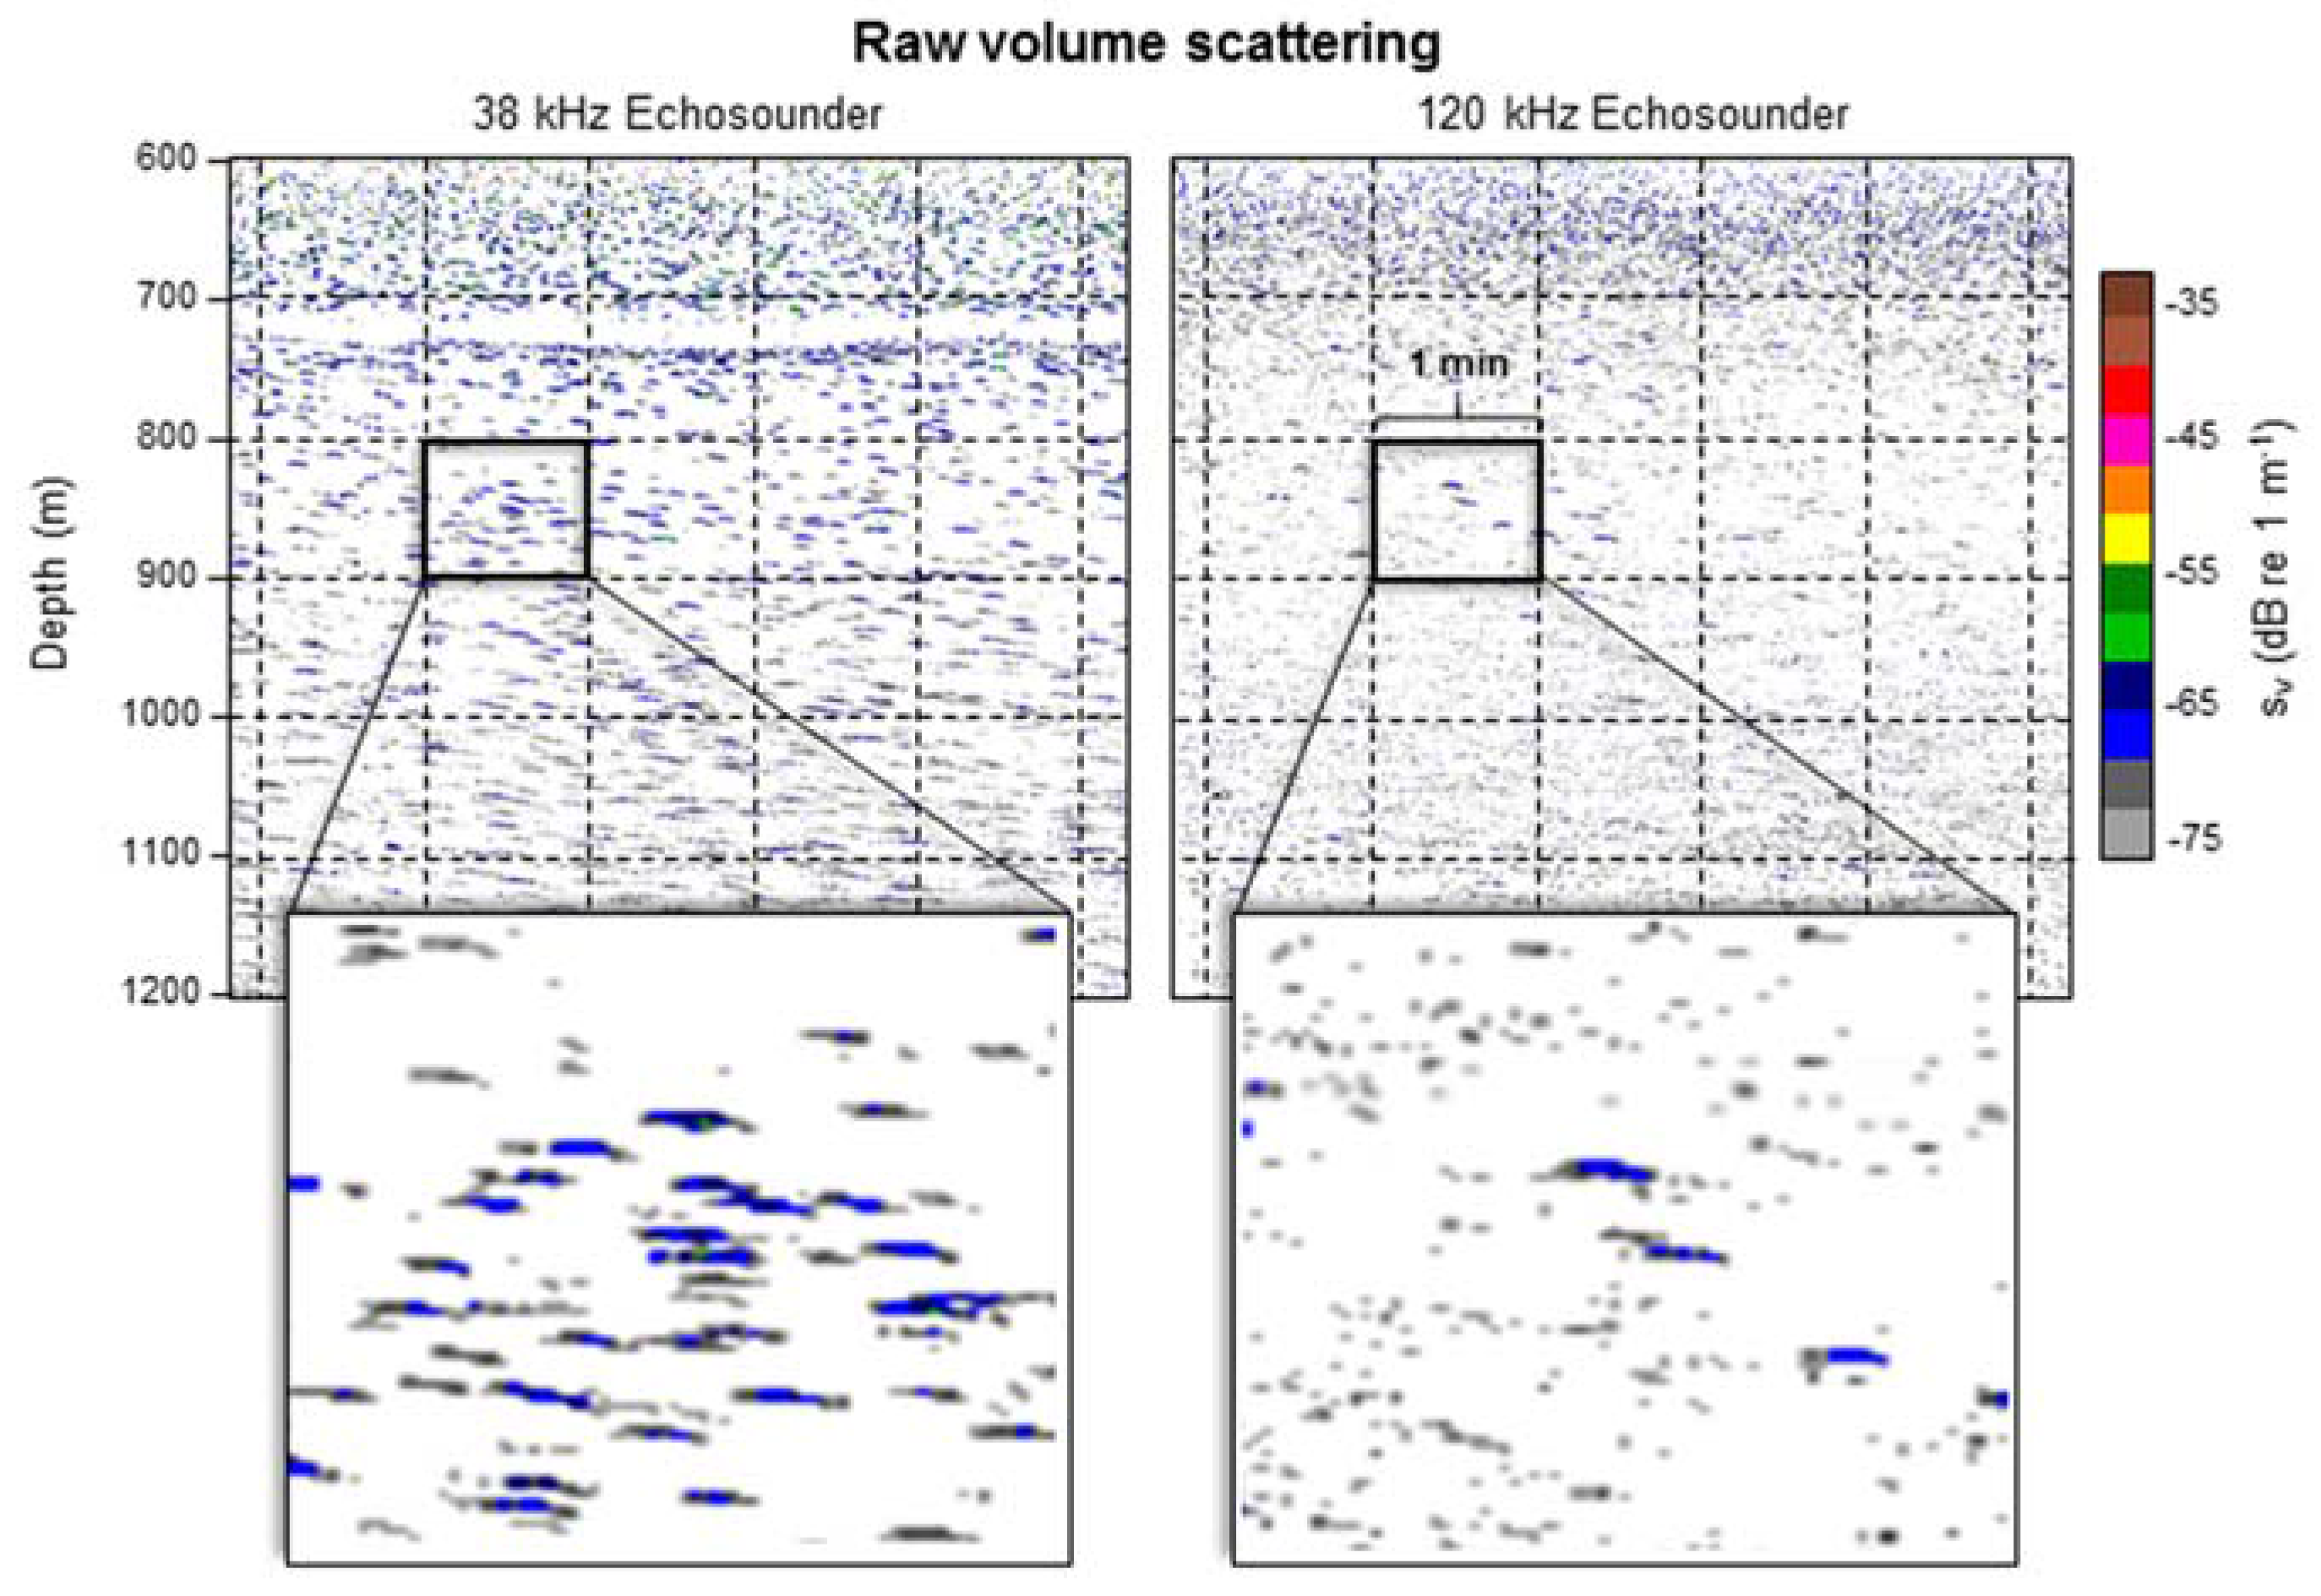
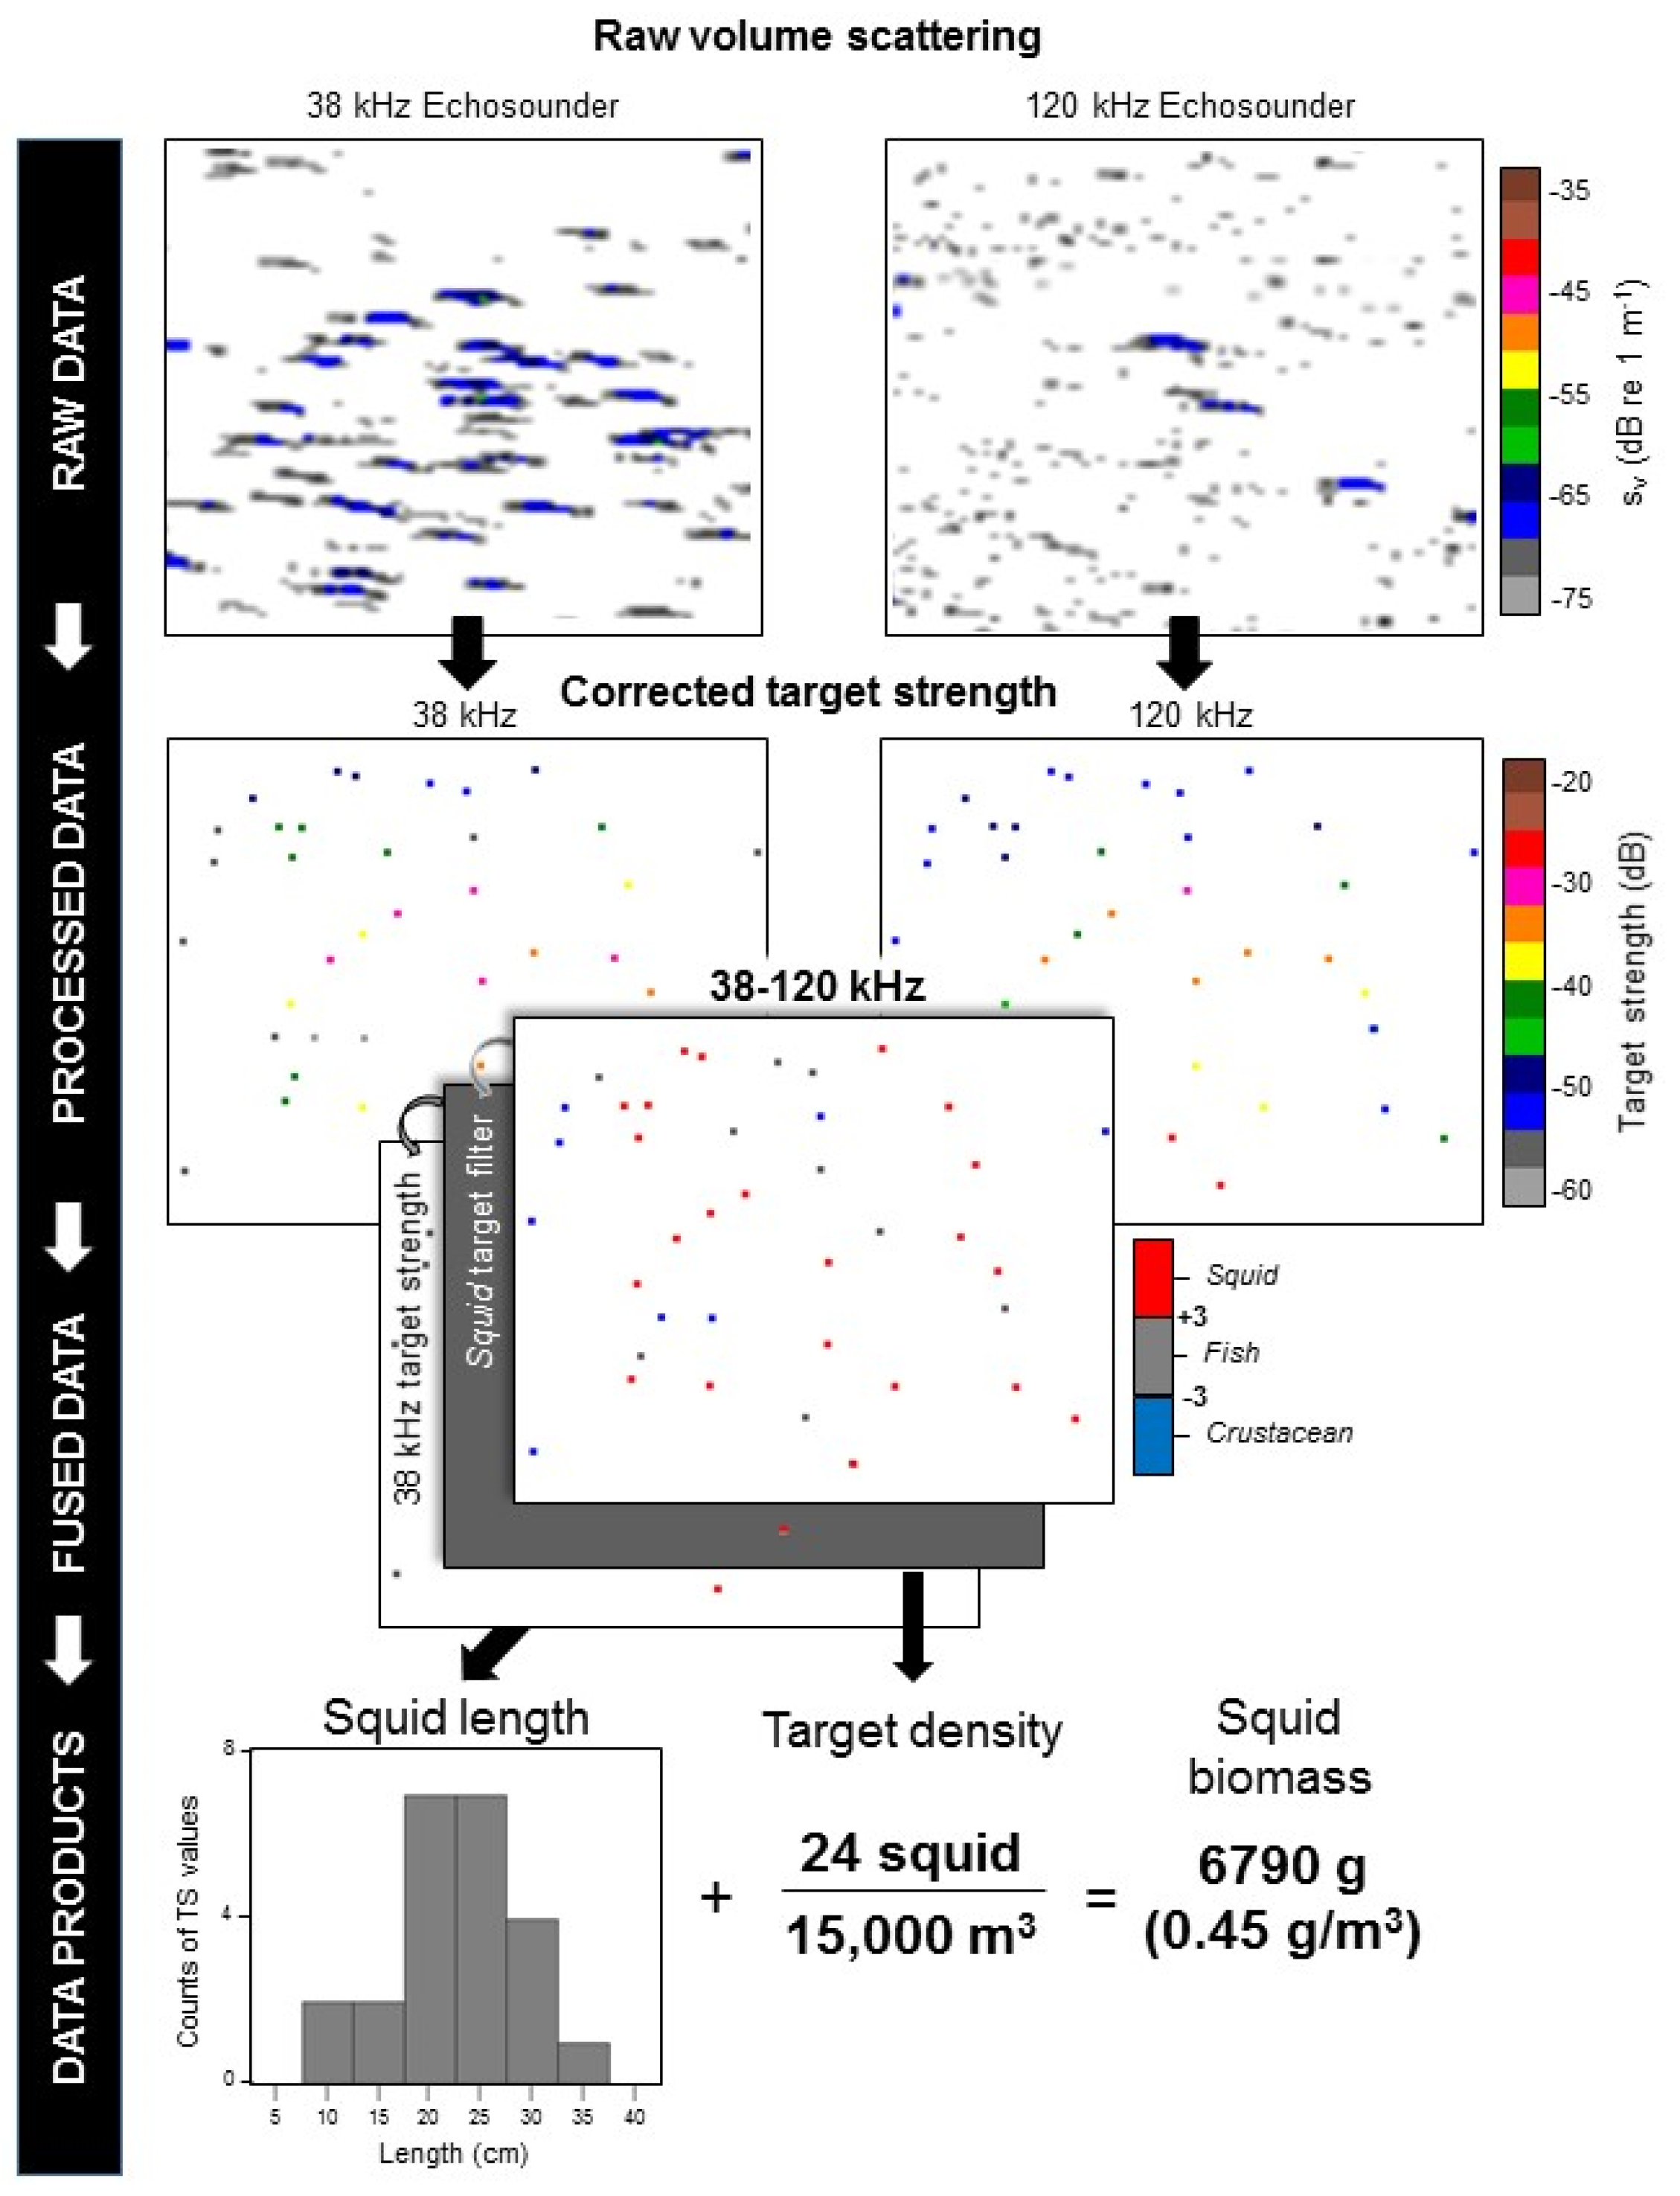
2.3. Data Processing and Analysis

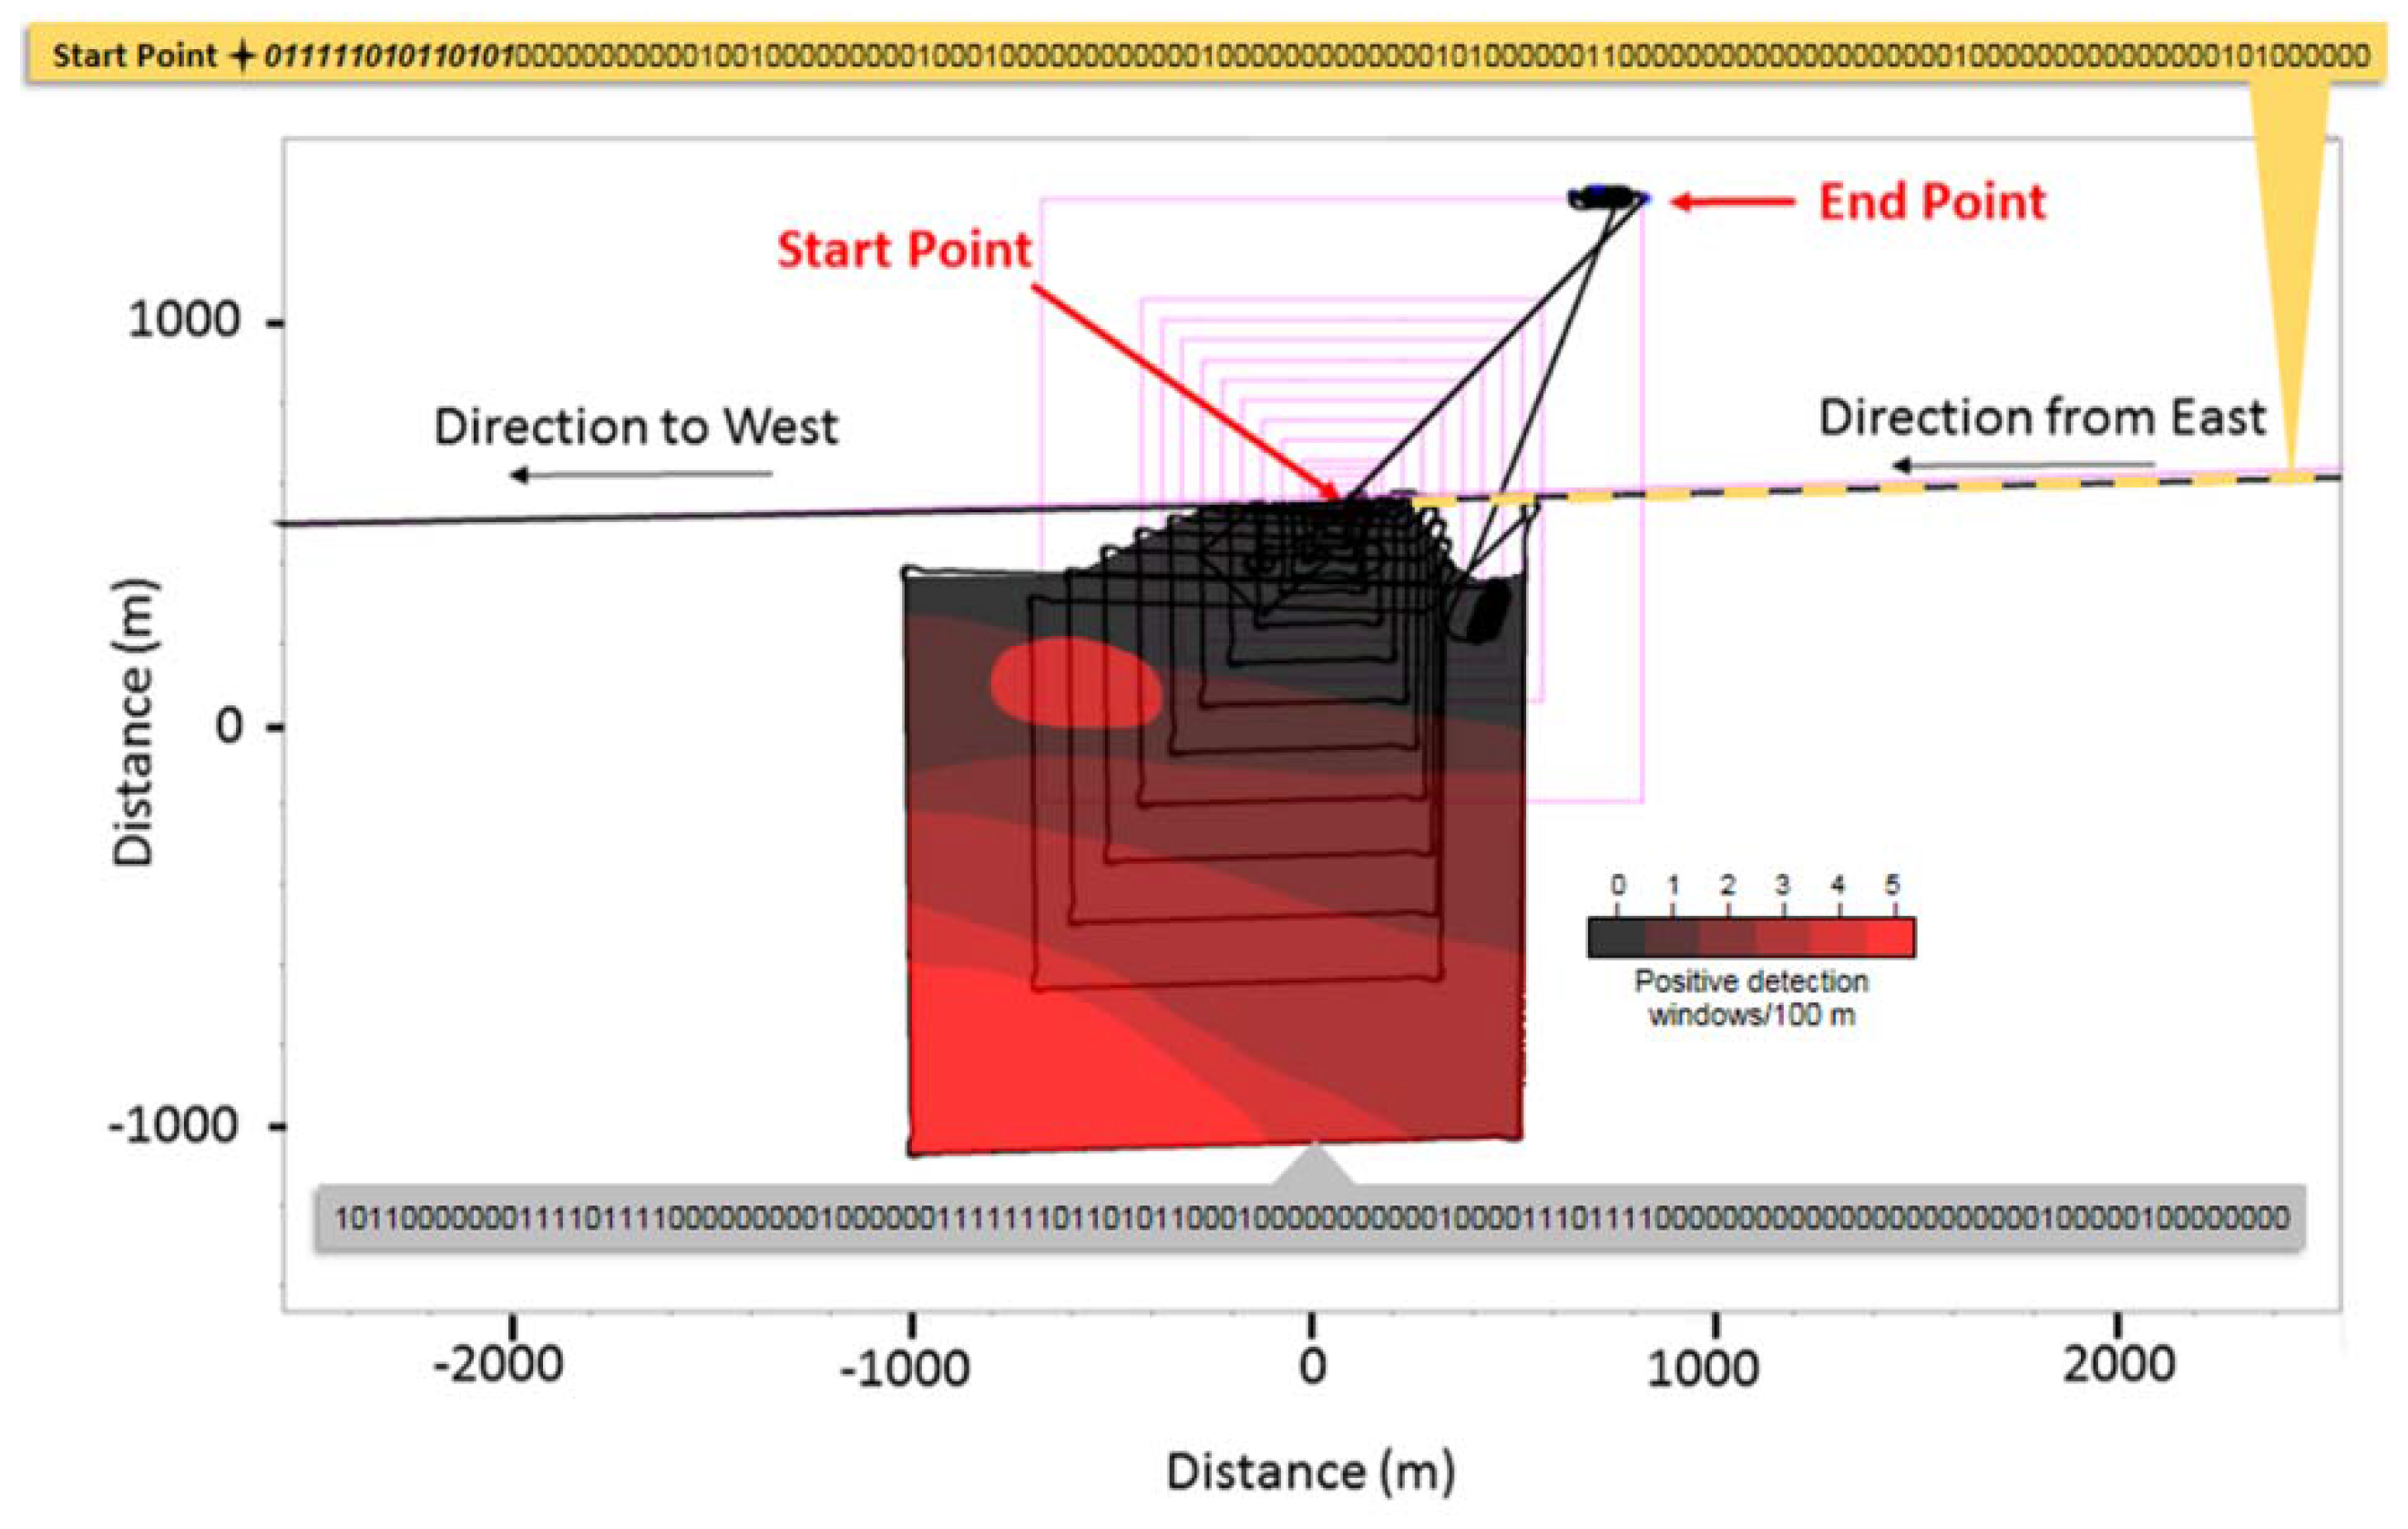
2.4. Autonomous Decision-Making

3. Results


4. Discussion
5. Conclusions
Acknowledgments
Author Contributions
Conflicts of Interest
References
- Alkire, M.B.; D’Asaro, E.; Lee, C.; Perry, M.J.; Gray, A.; Cetinić, I.; Briggs, N.; Rehm, E.; Kallin, E.; Kaiser, J.; et al. Estimates of net community production and export using high-resolution, lagrangian measurements of O2, NO3−, and POC through the evolution of a spring diatom bloom in the North Atlantic. Deep Sea Res. I 2012, 64, 157–174. [Google Scholar] [CrossRef]
- Mahadevan, A.; D’Asaro, E.; Lee, C.; Perry, M.J. Eddy-driven stratification initiates North Atlantic spring phytoplankton blooms. Science 2012, 337, 54–58. [Google Scholar] [CrossRef] [PubMed]
- Williams, R. Evaluating the new techniques for monitoring and assessing the health of Large Marine Ecosystems. In Evaluating and Monitoring the Health of Large-Scale Ecosystems; Rapport, D.J., Gaudet, C.L., Calow, P., Eds.; Springer-Verlag: Berlin/Heidelberg, Germany, 1995; pp. 257–272. [Google Scholar]
- Sarangi, R.K. Observation of Oceanic Eddy in the Northeastern Arabian Sea Using Multisensor Remote Sensing Data. Int. J. Oceanogr. 2012. [Google Scholar] [CrossRef]
- Dickey, T.D. The emergence of concurrent high-resolution physical and bio-optical measurements in the upper ocean and their applications. Rev. Geophys. 1991, 29, 383–413. [Google Scholar] [CrossRef]
- Dickey, T.D.; Itsweire, E.C.; Moline, M.A.; Perry, M.J. Introduction to the Limnology and Oceanography special issue on autonomous and Lagrangian platforms and sensors (ALPS). Limnol. Oceanogr. 2008, 53, 2057–2061. [Google Scholar] [CrossRef]
- Baumgartner, M.F.; Fratantoni, D.M. Diel periodicity in both sei whale vocalization rates and the vertical migration of their copepod prey observed from ocean gliders. Limnol. Oceanogr. 2008, 53, 2197–2209. [Google Scholar] [CrossRef]
- Au, D.; Perryman, W. Movement and speed of dolphin schools responding to an approaching ship. Fish. Bull. 1982, 80, 371–379. [Google Scholar]
- Diner, N.; Masse, J. Fish school behaviour during echo survey observed by acoustic devices. In Proceedings of the International Symposium of Fisheries Acoustics, Seattle, WA, USA, 22–26 June 1987.
- Dyndo, M.; Wiśniewska, D.M.; Rojano-Doñate, L.; Madsen, P.T. Harbour porpoises react to low levels of high frequency vessel noise. Sci. Rep. 2015, 5, 1–13. [Google Scholar] [CrossRef] [PubMed]
- Leonard, N.E.; Paley, D.; Lekien, F.; Sepulchre, R.; Fratantoni, D.M.; Davis, R.E. Collective motion, sensor networks, and ocean sampling. Proc. IEEE 2007, 95, 48–74. [Google Scholar] [CrossRef]
- Ramp, S.R.; Davis, R.E.; Leonard, N.E.; Shulman, I.; Chao, Y.; Robinson, A.R.; Marsden, J.; Lermusiaux, P.F.J.; Fratantoni, D.M.; Paduan, J.D.; et al. Preparing to predict: The second autonomous ocean sampling network (AOSN-II) experiment in the Monterey Bay. Deep Sea Res. II 2009, 56, 68–86. [Google Scholar] [CrossRef]
- Schofield, O.; Glenn, S.M.; Moline, M.A.; Oliver, M.; Irwin, A.; Chao, Y.; Arrott, M. Ocean observatories and information: Building a global ocean observing network. In Earth System Monitoring: Selected Entries from the Encyclopedia of Sustainability Science and Technology; Orcutt, J., Ed.; Springer Science + Business Media: New York, NY, USA, 2013; pp. 319–336. [Google Scholar]
- Das, J.; Py, F.; Maughan, T.; O’Reilly, T.; Messié, M.; Ryan, J.; Rajan, K.; Sukhatme, G.S. Simultaneous tracking and sampling of dynamic oceanographic Features with Autonomous Underwater Vehicles and Lagrangian Drifters. Exp. Robot. 2014, 79, 541–555. [Google Scholar]
- Kirkpatrick, G.J.; Millie, D.F.; Moline, M.A.; Schofield, O. Optical discrimination of a phytoplankton species in natural mixed populations. Limnol. Oceanogr. 2000, 45, 467–471. [Google Scholar] [CrossRef]
- Robbins, I.C.; Kirkpatrick, G.J.; Blackwell, S.M.; Hillier, J.; Knight, C.A.; Moline, M.A. Improved monitoring of HABs using autonomous underwater vehicles (AUV). Harmful Algae 2006, 5, 749–761. [Google Scholar] [CrossRef]
- Kirkpatrick, G.J.; Millie, D.F.; Moline, M.A.; Lohrenz, S.E.; Schofield, O.M. Automated, in-water determination of colored dissolved organic material and phytoplankton community structure using the optical phytoplankton discriminator. In Proceedings of the SPIE Ocean Sensing and Monitoring III, Orlando, FL, USA, 26–27 April 2011; pp. 1–9.
- Li, W.; Farrell, J.A.; Pang, S.; Arrieta, R.M. Moth-inspired chemical plume tracing on an autonomous underwater vehicle. IEEE Trans. Robot. 2006, 22, 292–307. [Google Scholar] [CrossRef]
- Zhang, Y.; McEwen, R.S.; Ryan, J.P.; Bellingham, J.G. Design and tests of an adaptive triggering method for capturing peak samples in a thin phytoplankton layer by an autonomous underwater vehicle. Ocean. Eng. 2010, 35, 785–796. [Google Scholar] [CrossRef]
- Clarke, M.E.; Tolimieri, N.; Singh, H. Using the seabed AUV to assess populations of groundfish in untrawlable areas (Ch. 20). In The Future of Fisheries Science in North America; Fish and Fisheries Series; Beamish, R.J., Rothschild, B.J., Eds.; Springer Science + Business Media: New York, NY, USA, 2009; pp. 357–372. [Google Scholar]
- Forney, C.; Manii, E.; Farris, M.; Moline, M.A.; Lowe, C.G.; Clark, C.M. Tracking of a tagged leopard shark with an AUV: Sensor calibration and state estimation. In Proceedings of the IEEE International Conference on Robotics and Automation (ICRA 2012), St. Paul, MN, USA, 14–18 May 2012.
- Lin, Y.; Kastein, H.; Peterson, T.; White, C.; Lowe, C.G.; Clark, C.M. A multi-AUV state estimator for determining the 3D position of tagged fish. In Proceedings of the IEEE Intelligent Robots and Systems (IROS), Chicago, IL, USA, 14–18 September 2014.
- Williams, S.B.; Pizarro, O.R.; Jakuba, M.V.; Johnson, C.R.; Barrett, N.S.; Babcock, R.C.; Kendrick, G.A.; Steinberg, P.D.; Heyward, A.J.; Doherty, P.J.; et al. Monitoring of benthic reference sites: Using an autonomous underwater vehicle. IEEE Robot. Autom. Mag. 2012, 19, 73–84. [Google Scholar] [CrossRef]
- Bellingham, J.G.; Rajan, K. Robotics in remote and hostile environments. Science 2007, 318, 1098–1102. [Google Scholar] [CrossRef] [PubMed]
- Rajan, K.; Py, F.; Barreiro, J. Towards deliberative control in marine robotics. In Marine Robot Autonomy; Seto, M.L., Ed.; Springer Science + Business Media: New York, NY, USA, 2013; pp. 91–174. [Google Scholar]
- Andersen, L.N. The new Simrad EK60 scientific echo sounder system. J. Acoust. Soc. Am. 2001, 109, 2336. [Google Scholar] [CrossRef]
- Au, W.W.L.; Benoit-Bird, K.J. Broadband backscatter from individual Hawaiian mesopelagic boundary community animals with implications for spinner dolphin foraging. J. Acoust. Soc. Am. 2008, 123, 2884–2894. [Google Scholar] [CrossRef] [PubMed]
- Benoit-Bird, K.J.; Gilly, W.F.; Au, W.W.L.; Mate, B. Controlled and in situ target strengths of the jumbo squid Dosidicus gigas and identification of potential acoustic scattering sources. J. Acoust. Soc. Am. 2008, 123, 1318–1328. [Google Scholar] [CrossRef] [PubMed]
- Moline, M.A.; Benoit-Bird, K.; O’Gorman, D.; Robbins, I. Integration of scientific echo sounders with and adaptable autonomous vehicle to extend our understanding of animals from the surface to the bathypelagic. J. Atmos. Ocean. Technol. 2015, 32, 2173–2186. [Google Scholar] [CrossRef]
- Kang, M.; Furusawa, M.; Miyashita, K. Effective and accurate use of difference in mean volume backscattering strength to identify fish and plankton. ICES J. Mar. Sci. 2002, 59, 794–804. [Google Scholar] [CrossRef]
- Korneliussen, R.J.; Ona, E. An operational system for processing and visualizing multi-frequency acoustic data. ICES J. Mar. Sci. 2002, 59, 293–313. [Google Scholar] [CrossRef]
- Ryan, J.; Greenfield, D.; Marin, R.; Preston, C.; Roman, D.; Jensen, S.; Pargett, D.; Birch, J.; Mikulski, C.; Doucette, G.; et al. Harmful phytoplankton ecology studies using an autonomous molecular analytical and ocean observing network. Limnol. Oceanogr. 2011, 56, 1255–1272. [Google Scholar] [CrossRef]
- Tusa, E.; Reynolds, A.; Lane, D.M.; Robertson, N.M.; Villegas, H.; Bosnjak, A. Implementation of a fast coral detector using a supervised machine learning and Gabor Wavelet feature descriptors. In Proceedings of IEEE Sensor Systems for a Changing Ocean (SSCO 2014), Brest, France, 13–17 October 2014.
- Das, J.; Py, F.; Harvey, J.B.J.; Ryan, J.P.; Gellene, A.; Graham, R.; Caron, D.A.; Rajan, K.; Sukhatame, G.S. Data-driven robotic sampling for marine ecosystem monitoring. Int. J. Robot. Res. 2015, 34, 1435–1452. [Google Scholar] [CrossRef]
- Ryan, J.P.; Johnson, S.B.; Sherman, A.; Rajan, K.; Py, F.; Thomas, H.; Harvey, J.B.J.; Bird, L.; Paduan, J.D.; Vrijenhoek, R.C. Mobile autonomous process sampling within coastal ocean observing systems. Limnol. Oceanogr. 2010, 8, 394–402. [Google Scholar] [CrossRef]
- Ryan, J.P.; McManus, M.A.; Kudela, R.M.; Lara Artigas, M.; Bellingham, J.G.; Chavez, F.P.; Doucette, G.; Foley, D.; Godin, M.; Harvey, J.B.J.; et al. Boundary influences on HAB phytoplankton ecology in a stratification-enhanced upwelling shadow. Deep Sea Res. II 2014, 101, 63–79. [Google Scholar] [CrossRef]
- Gorsky, G.; Ohman, M.D.; Picheral, M.; Gasparini, S.; Stemmann, L.; Romagnan, J.-B.; Cawood, A.; Pesant, S.; Garcia-Comas, C.; Prejger, F. Digital zooplankton image analysis using the ZooScan integrated system. J. Plankton Res. 2010, 32, 285–303. [Google Scholar] [CrossRef]
- Cowen, R.K.; Greer, A.T.; Guigand, C.M.; Hare, J.A.; Richardson, D.E.; Walsh, H.J. Evaluation of the In Situ Ichthyoplankton Imaging System (ISIIS): Comparison with the traditional (bongo net) sampler. Fish. Bull. 2013, 111, 1–12. [Google Scholar] [CrossRef]
- Li, J.; Johnson-Roberson, M. Multi-altitude multi-sensor fusion framework for AUV exploration and survey. In Proceedings of the IEEE Oceans, St. John’s, NL, Canada, 14–19 September 2014.
- Hagen, P.E.; Hegrenæs, Ø.; Jalving, B.; Midtgaard, Ø.; Wiig, M.; Hagen, O.K. Making AUVs truly autonomous. In Underwater Vehicles; Inzartsev, A.V., Ed.; InTech: Vienna, Austria, 2009; pp. 129–152. [Google Scholar]
© 2016 by the authors; licensee MDPI, Basel, Switzerland. This article is an open access article distributed under the terms and conditions of the Creative Commons by Attribution (CC-BY) license (http://creativecommons.org/licenses/by/4.0/).
Share and Cite
Moline, M.A.; Benoit-Bird, K. Sensor Fusion and Autonomy as a Powerful Combination for Biological Assessment in the Marine Environment. Robotics 2016, 5, 4. https://doi.org/10.3390/robotics5010004
Moline MA, Benoit-Bird K. Sensor Fusion and Autonomy as a Powerful Combination for Biological Assessment in the Marine Environment. Robotics. 2016; 5(1):4. https://doi.org/10.3390/robotics5010004
Chicago/Turabian StyleMoline, Mark A., and Kelly Benoit-Bird. 2016. "Sensor Fusion and Autonomy as a Powerful Combination for Biological Assessment in the Marine Environment" Robotics 5, no. 1: 4. https://doi.org/10.3390/robotics5010004
APA StyleMoline, M. A., & Benoit-Bird, K. (2016). Sensor Fusion and Autonomy as a Powerful Combination for Biological Assessment in the Marine Environment. Robotics, 5(1), 4. https://doi.org/10.3390/robotics5010004