1. Introduction
Nowadays, in daily activity, people are used to working with computers or machines to improve their quality of work. However, for some paralysis patients, armless persons [
1], older adults [
2] and locked-in syndrome patients, they face some barriers in controlling devices, because of their limitations. To solve this problem, people have tried to discover alternative ways to transmit and receive signals between humans and machines [
3].
One of the methods to handle this problem is through bio-signal technology for communication. There are many kinds of bio-signals, such as electromyography (EMG) [
4], electroencephalographic (EEG) [
5] and electrooculography (EOG) [
6]. This study used the EOG signal to connect human and machine.
EOG is recorded as a weak electric potential existing around the eye. This signal comes from eye activities, caused by the difference of the potential between cornea and retina, since cornea has a more positive polarity than retina [
7]. The advantage of EOG is the linearity between its potential and the gaze distance. Nevertheless, the range of linear area in the horizontal (±45°) was usually wider than vertical linearity (±30°) [
8]. Three basic parts in the human-machine interface using EOG were EOG amplifying and acquisition, EOG pattern recognition and the control command. Beside the linearity, compared to EEG, EOG was easy to detect, and the amplitude is relatively high [
9].
Many methods were generated by researchers to detect and recognize eye movement based on the EOG signal to control some applications. Carlos G Pinhero
et al. in his review [
3] provided some examples of EOG function, such as an alphanumeric/symbol/number writing system, cursor control and generating Morse code. Controlling robot movement using EOG had been reported by [
10].
Human and computer interface systems accessed by EOG were proposed to control functions in a monitor. In [
11], EOG was classified by a fuzzy algorithm into four basic directions (right, left, up and down). Operators could use this system to activate some functions, such as a game, TV, an eye test, and others. Although the condition of the operators also influenced the EOG signal, such as nervousness, blinking, exaggerated gestures and speech, this research verified that the horizontal movement had a wider range than vertical movement.
While, in [
12,
13], an artificial neural network using training samples had the ability to learn a nonlinear characteristic and to build a model of it, this advantage was used to develop a prosthetic eye moving with a natural action [
14]. A neural network was also used to classify EOG from people with good or bad health conditions [
15].
The threshold method also effectively distinguished EOG based on gaze motion distances. This method, reported by [
16,
17], successfully divided gaze motion into four thresholds, each in vertical and horizontal movement. Then, these were all associated with the velocities of the robot manipulator for each direction (right, left, up and down). The robot velocity was controlled by EOG with four different levels of speed using the four thresholds. The operator would blink to mark targets if the robot passed them.
EOG signals were easily interrupted by some interferences in real circumstance, and the waveforms belonging to the different trials and subjects were also changed. Many studies tried to solve this problem; one of them [
18] used the combination of spectral entropy, the LPCC coefficient and dynamic time warping (DTW). This method was also used to recognize seven actions of gaze motion (looking up, down, left and right; blinking twice, three times and four times).
Using EOG for assistive technology was also proposed. In [
19], a wheelchair was successfully controlled by EOG. In the linear region, the EOG potential varied between 50 and 3500 μV. Operators could use four commands to control the robot. The commands were to move forward, backward, turn right and turn left. In a similar function [
1], EOG was also useful in assisting the discrimination between three different distances between operators and objects. The operators also found that there was no difference between the signal when the operators sat down or stood up. In another study [
2], an eye-gaze input system became the favorite for adults compared to young people. They felt that the EOG signal was easier to generate than moving their hands to operate a computer, due to declined motor functions.
The EOG signal used in this study was not only developed to control a two-degrees of freedom (DoF) planar robot manipulator’s direction, but also its position. Operators looked at targets on a monitor; then, this robot moved to points in the real world belonging to the EOG potential. Therefore, there were conversions from gaze motion to the pixel coordinate, followed by the conversion from the pixel coordinate to the joint angle.
This research has developed a communication interface between human and robot using the EOG signal. Rotation matrixes are proposed in this research to improve the performance of the gaze motion tracking system using EOG in diagonal movements. The EOG signal controlled the analog movements of a robot manipulator in a two-dimensional area. This signal generated by eye movements was converted to the pixel coordinates on a monitor display. The gaze distance of the pixel was used to calculate the target positions. The positions in the pixel are converted to the robot coordinates to calculate the end-effector position of the robot. Using inverse kinematics, the angles of two joints were determined.
2. Electrooculography
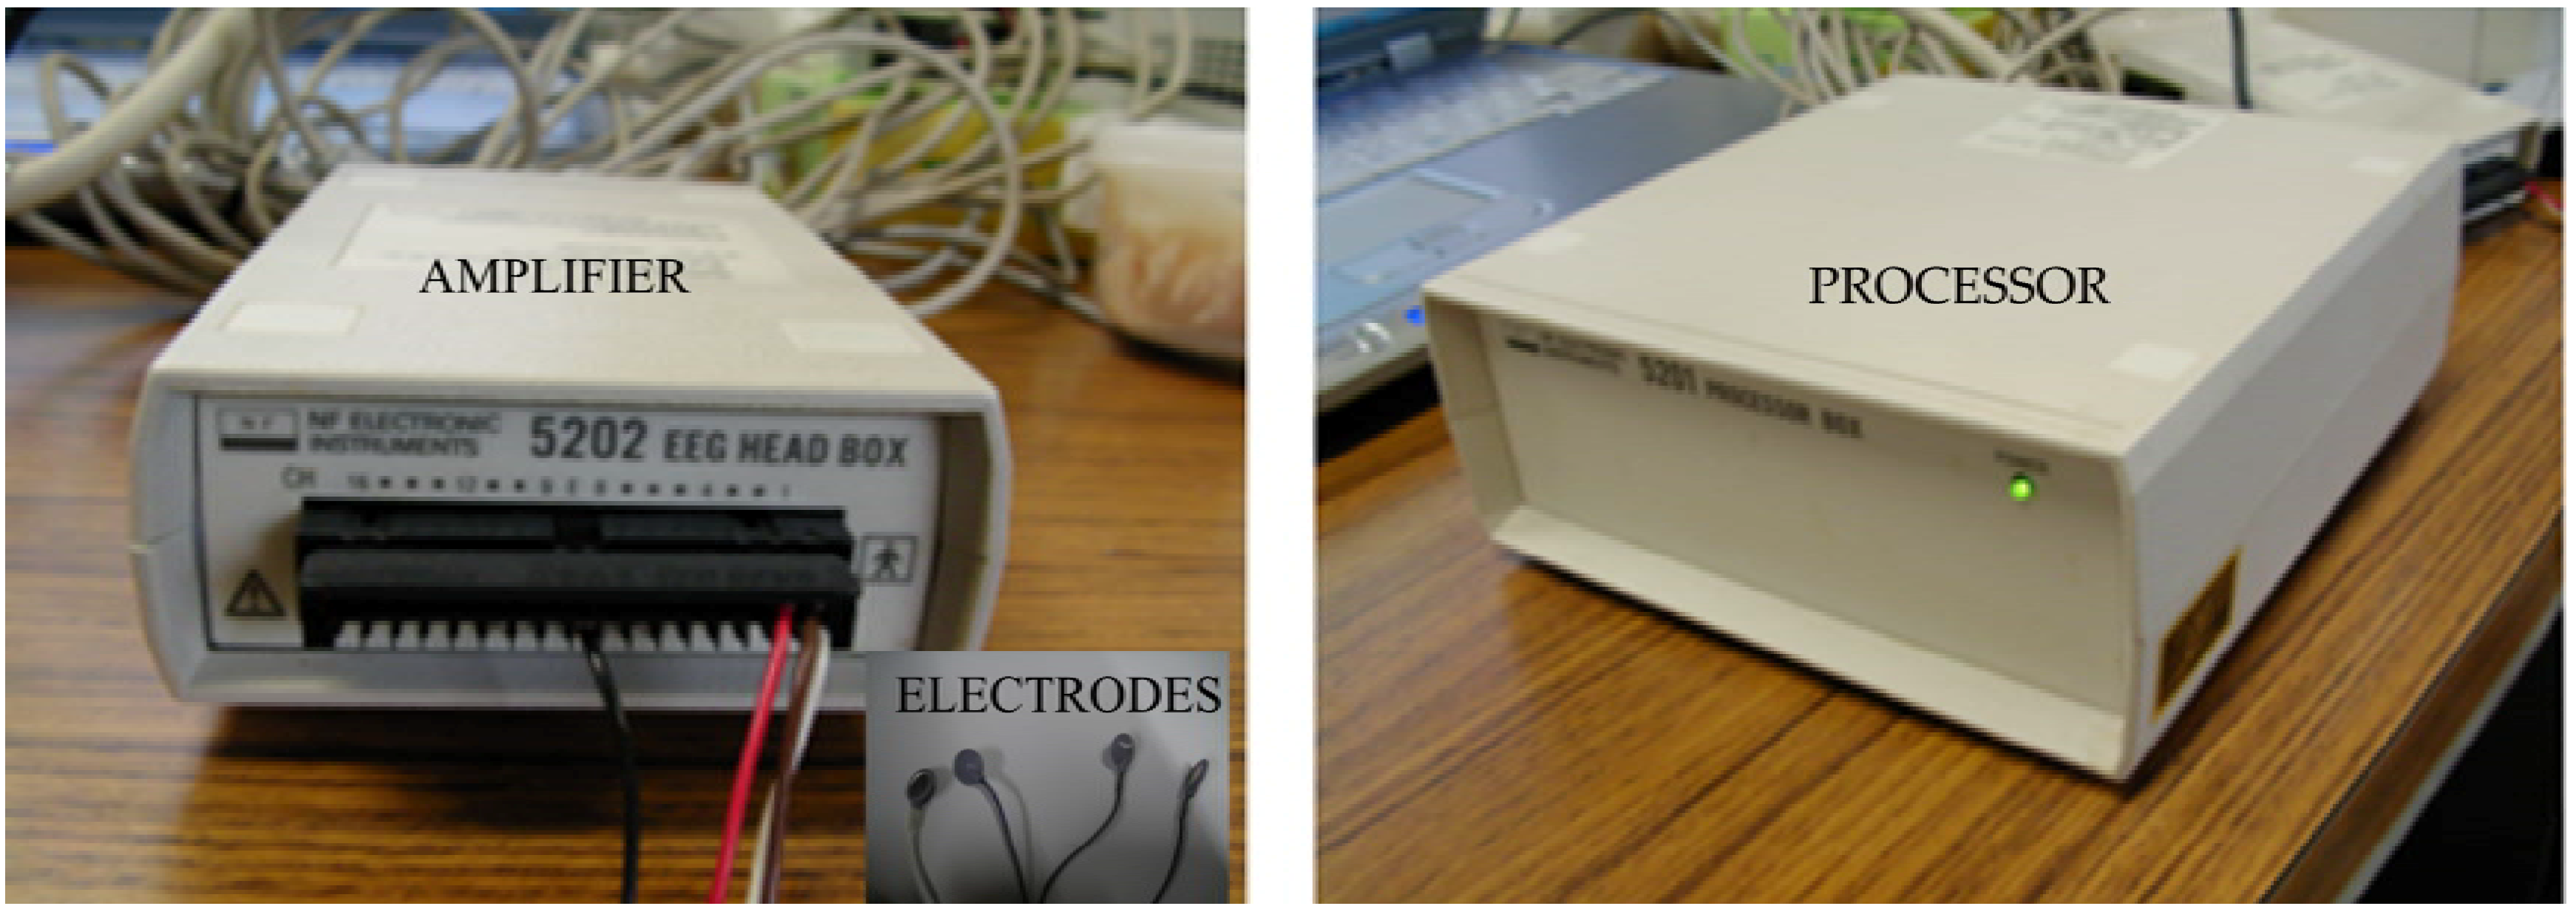
This study combines a bio-signal and a control system to move a flexible robot manipulator by using gaze motion. Therefore, in its simplest form, the input of the system is a bio-signal and the output is an end-effector movement. The bio-signal sensor was produced by NF Instrument and has an amplifier, a processor and four electrodes, as shown in
Figure 1. These electrodes consist of two positive channels (Ch1 and Ch2), a ground electrode and a reference electrode or minus channel.
In previous research [
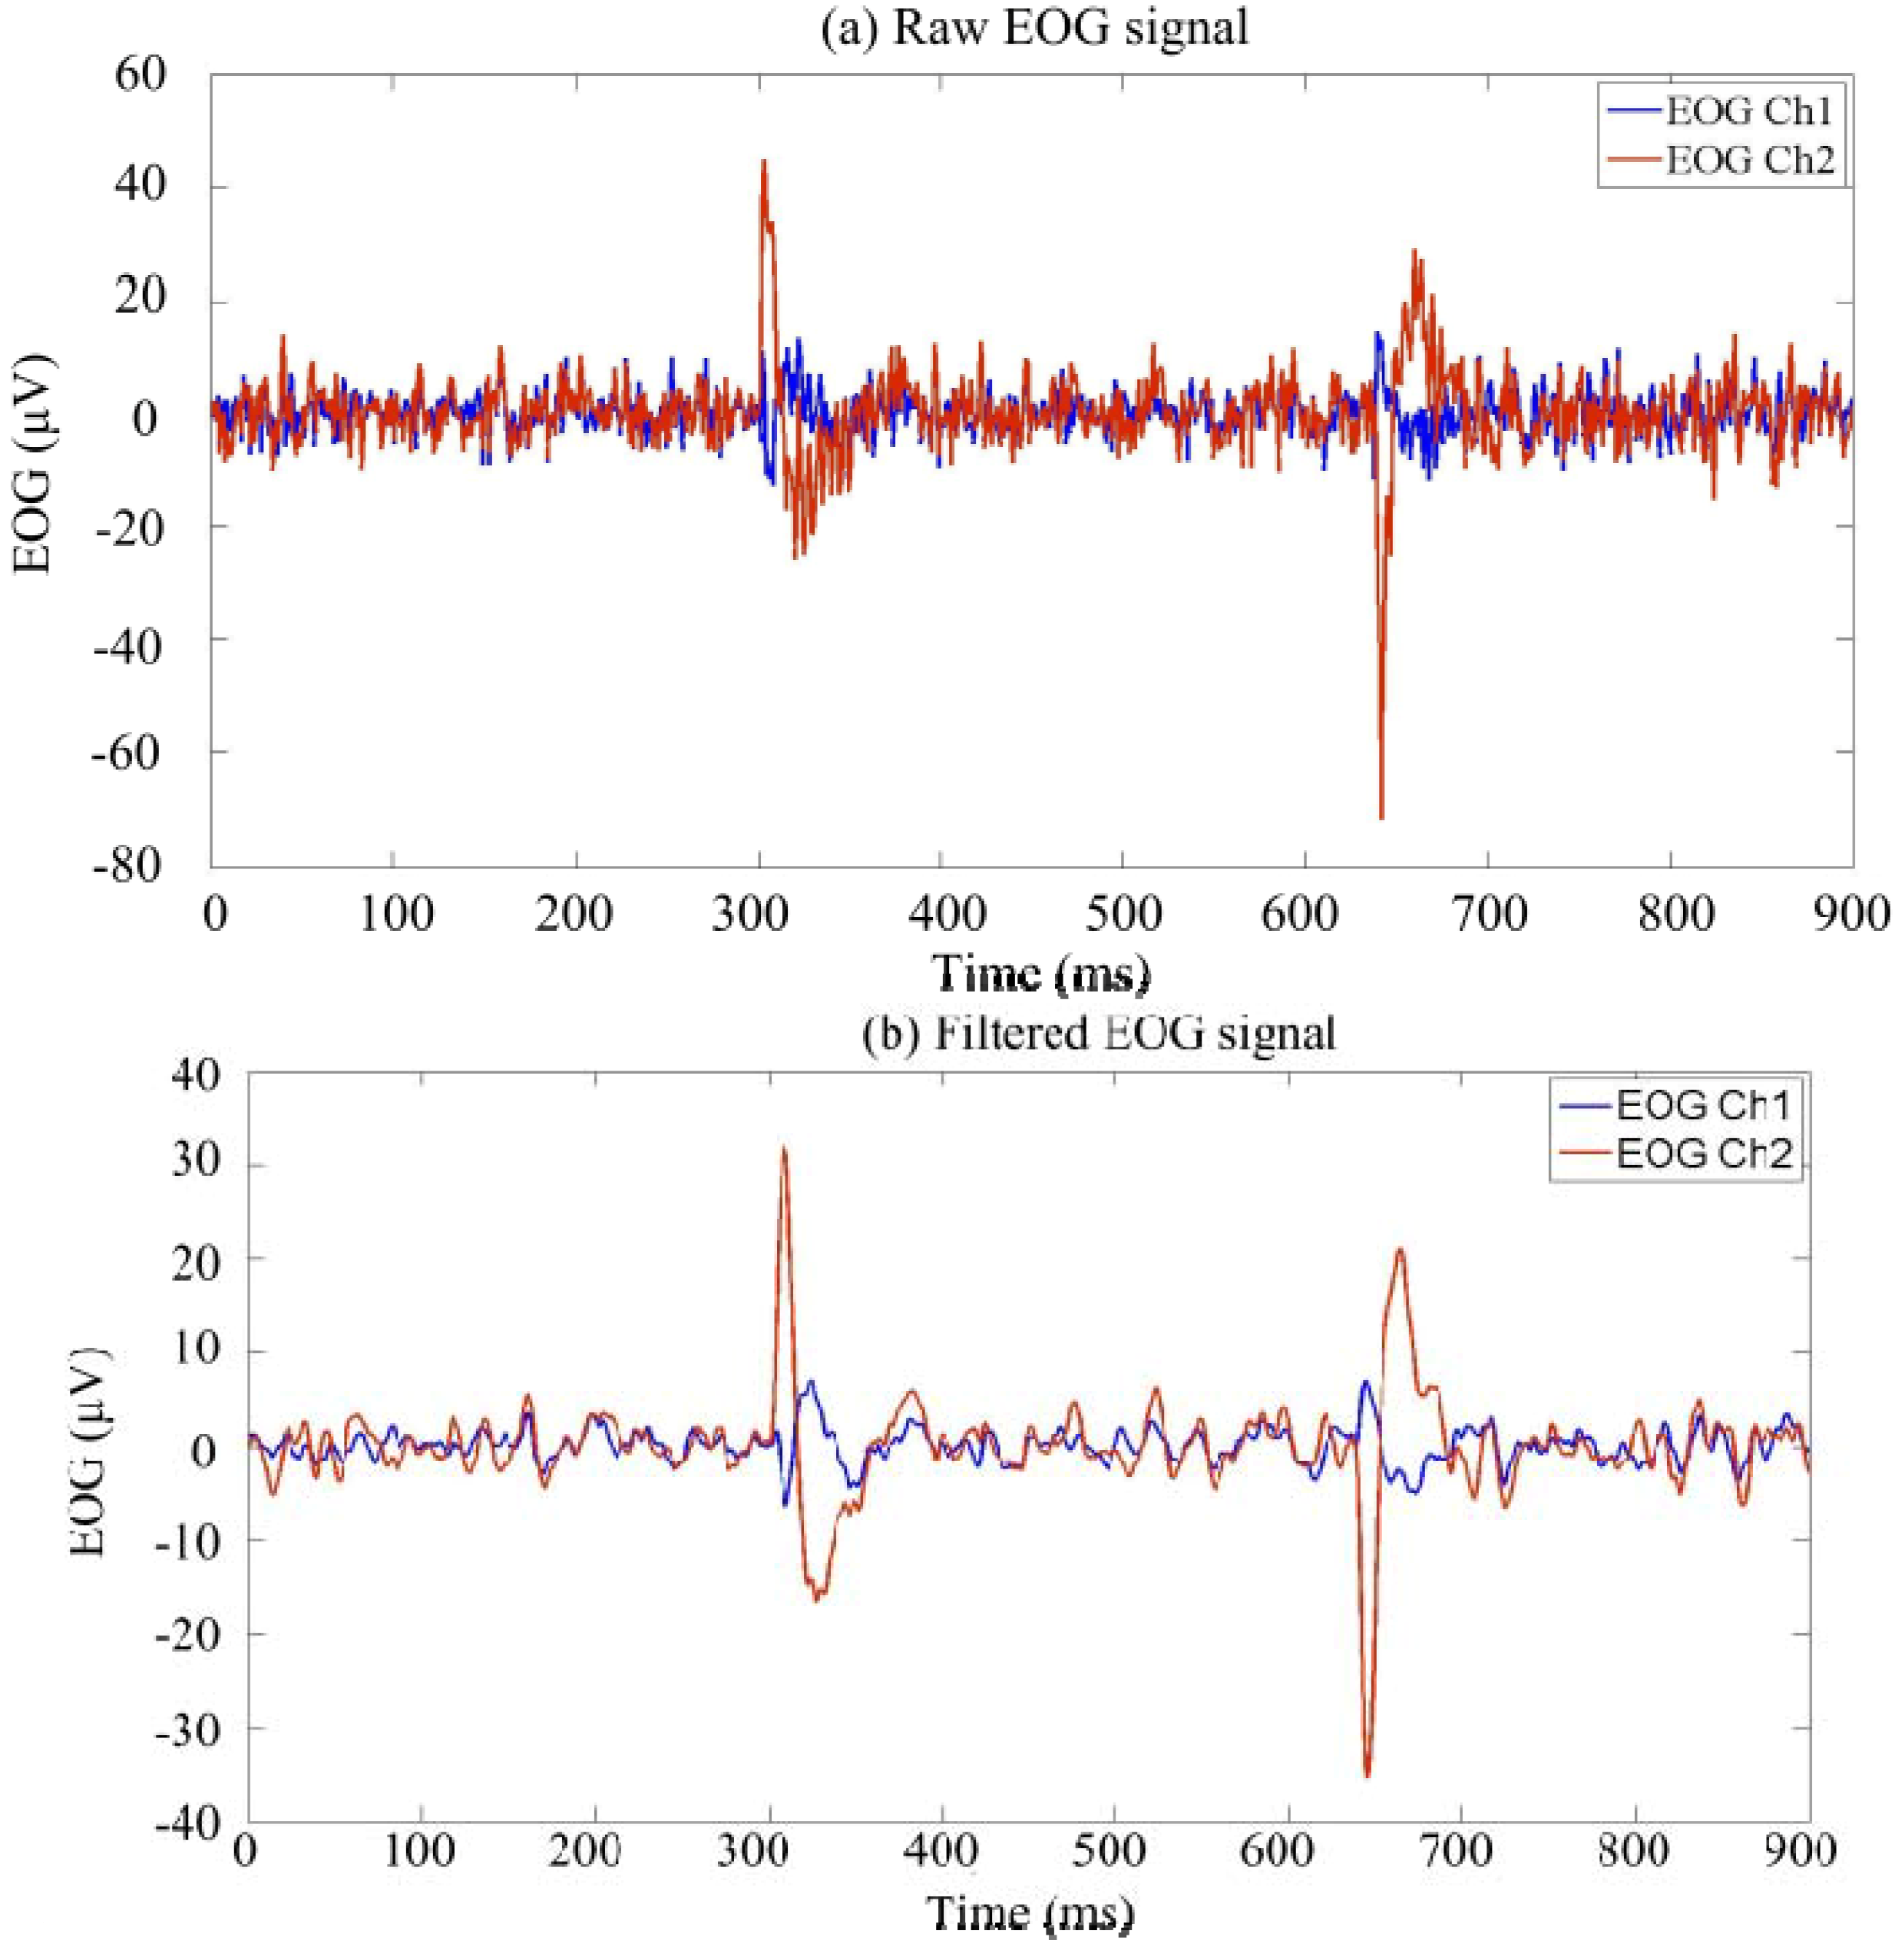
20], the processor had embedded filters inside. The filters were a 60-Hz low-pass filter, a 1.6-Hz high-pass filter and 60-Hz hum filter.
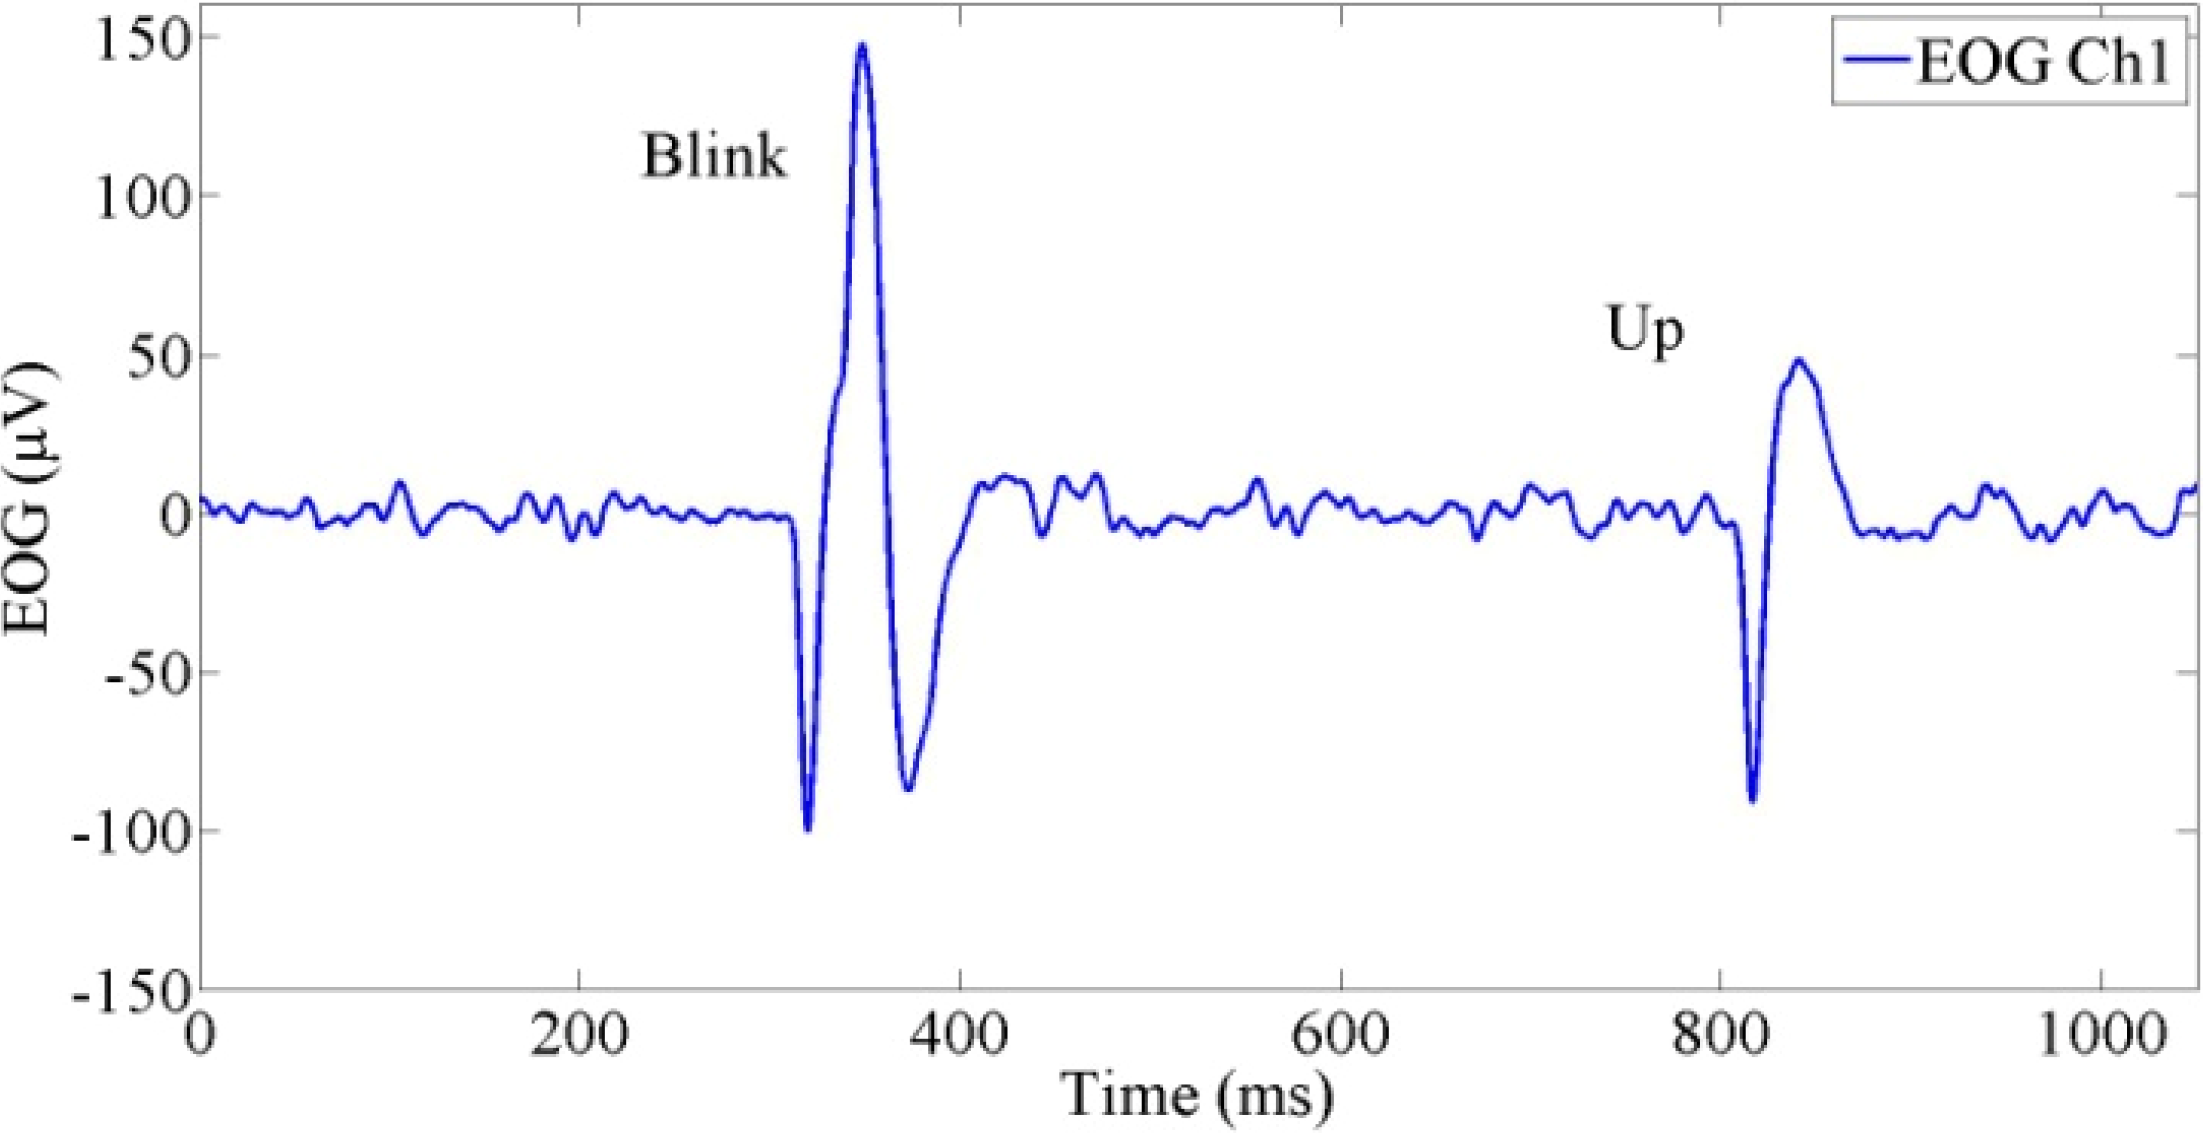
Figure 2 shows the signals before and after being filtered. The characteristics to differentiate the up gaze motion and blink signal were also introduced. The ratio between the maximum and absolute minimum value of EOG from Ch1 was used to ignore blink signals. This ratio for the blink signal is always greater than one. On the other hand, the ratio for the up gaze motion is smaller than one.
Figure 3 shows the signals for the blinking and up gaze motion.
Figure 1.
The NF Instrument as the electrooculography (EOG) sensor.
Figure 1.
The NF Instrument as the electrooculography (EOG) sensor.
Figure 2.
Example of the EOG signal: (a) before being filtered; (b) after being filtered.
Figure 2.
Example of the EOG signal: (a) before being filtered; (b) after being filtered.
Figure 3.
The EOG signal for the blinking and up gaze motion.
Figure 3.
The EOG signal for the blinking and up gaze motion.
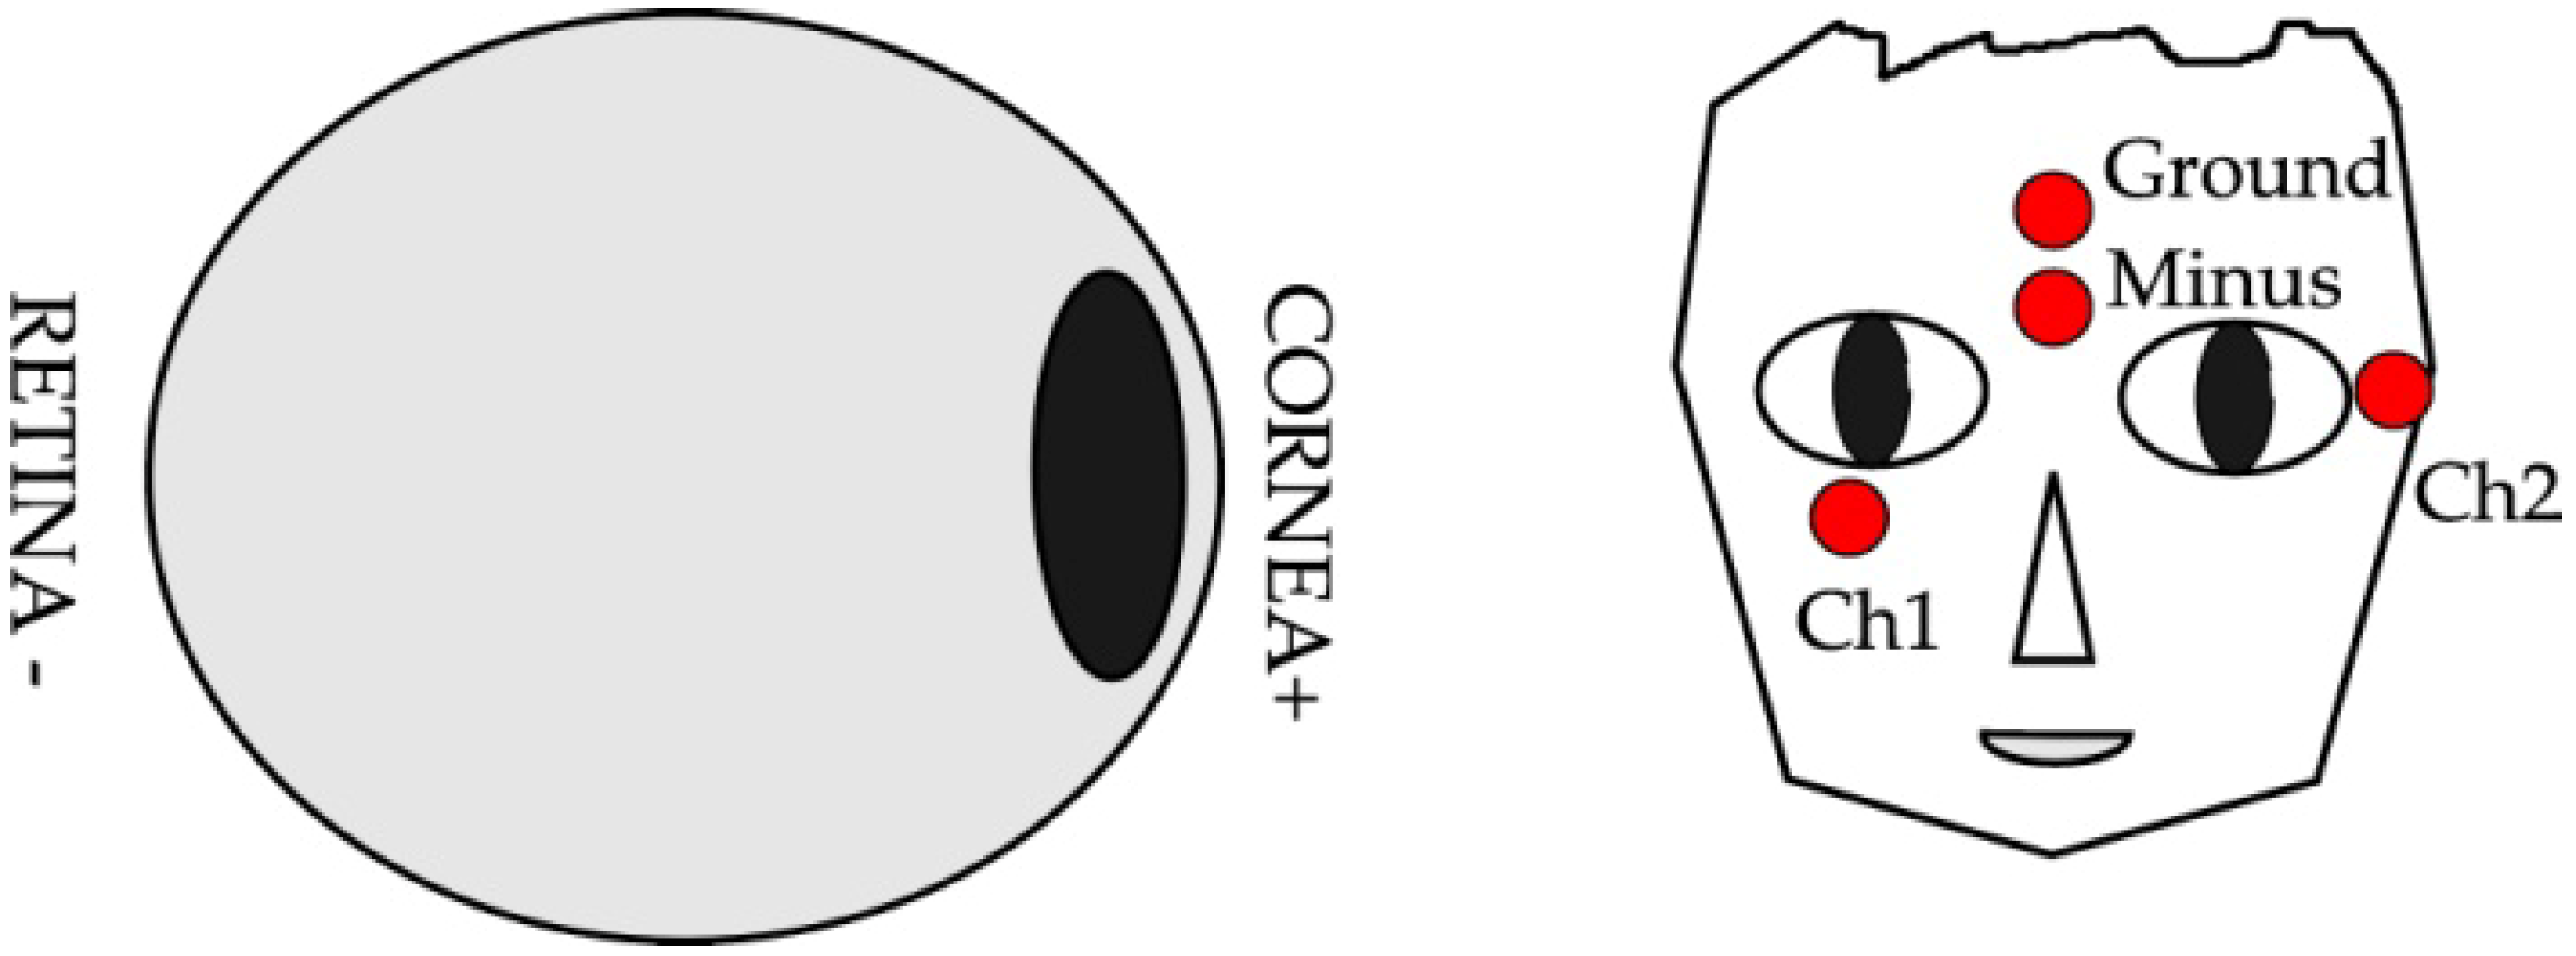
EOG is a weak signal that naturally occurs because of the potential difference between the cornea and retina. This distinction arises due to eye activities, as well as gaze motions [
21] and blinks [
22]. The EOG signal can be used in a dark environment, as long as there is eye activity distinguishing the electric potential between the two poles.
EOG is also a susceptible signal that is easily influenced by certain factors. Electrode positions are very important in this case, as well as the operator condition and the environment in which the research is being carried out [
20,
23]. Furthermore, unnecessary facial movements have impacts on the EOG value and pattern [
24].
Figure 4 illustrates the polarity of human eyes and the positions of electrodes.
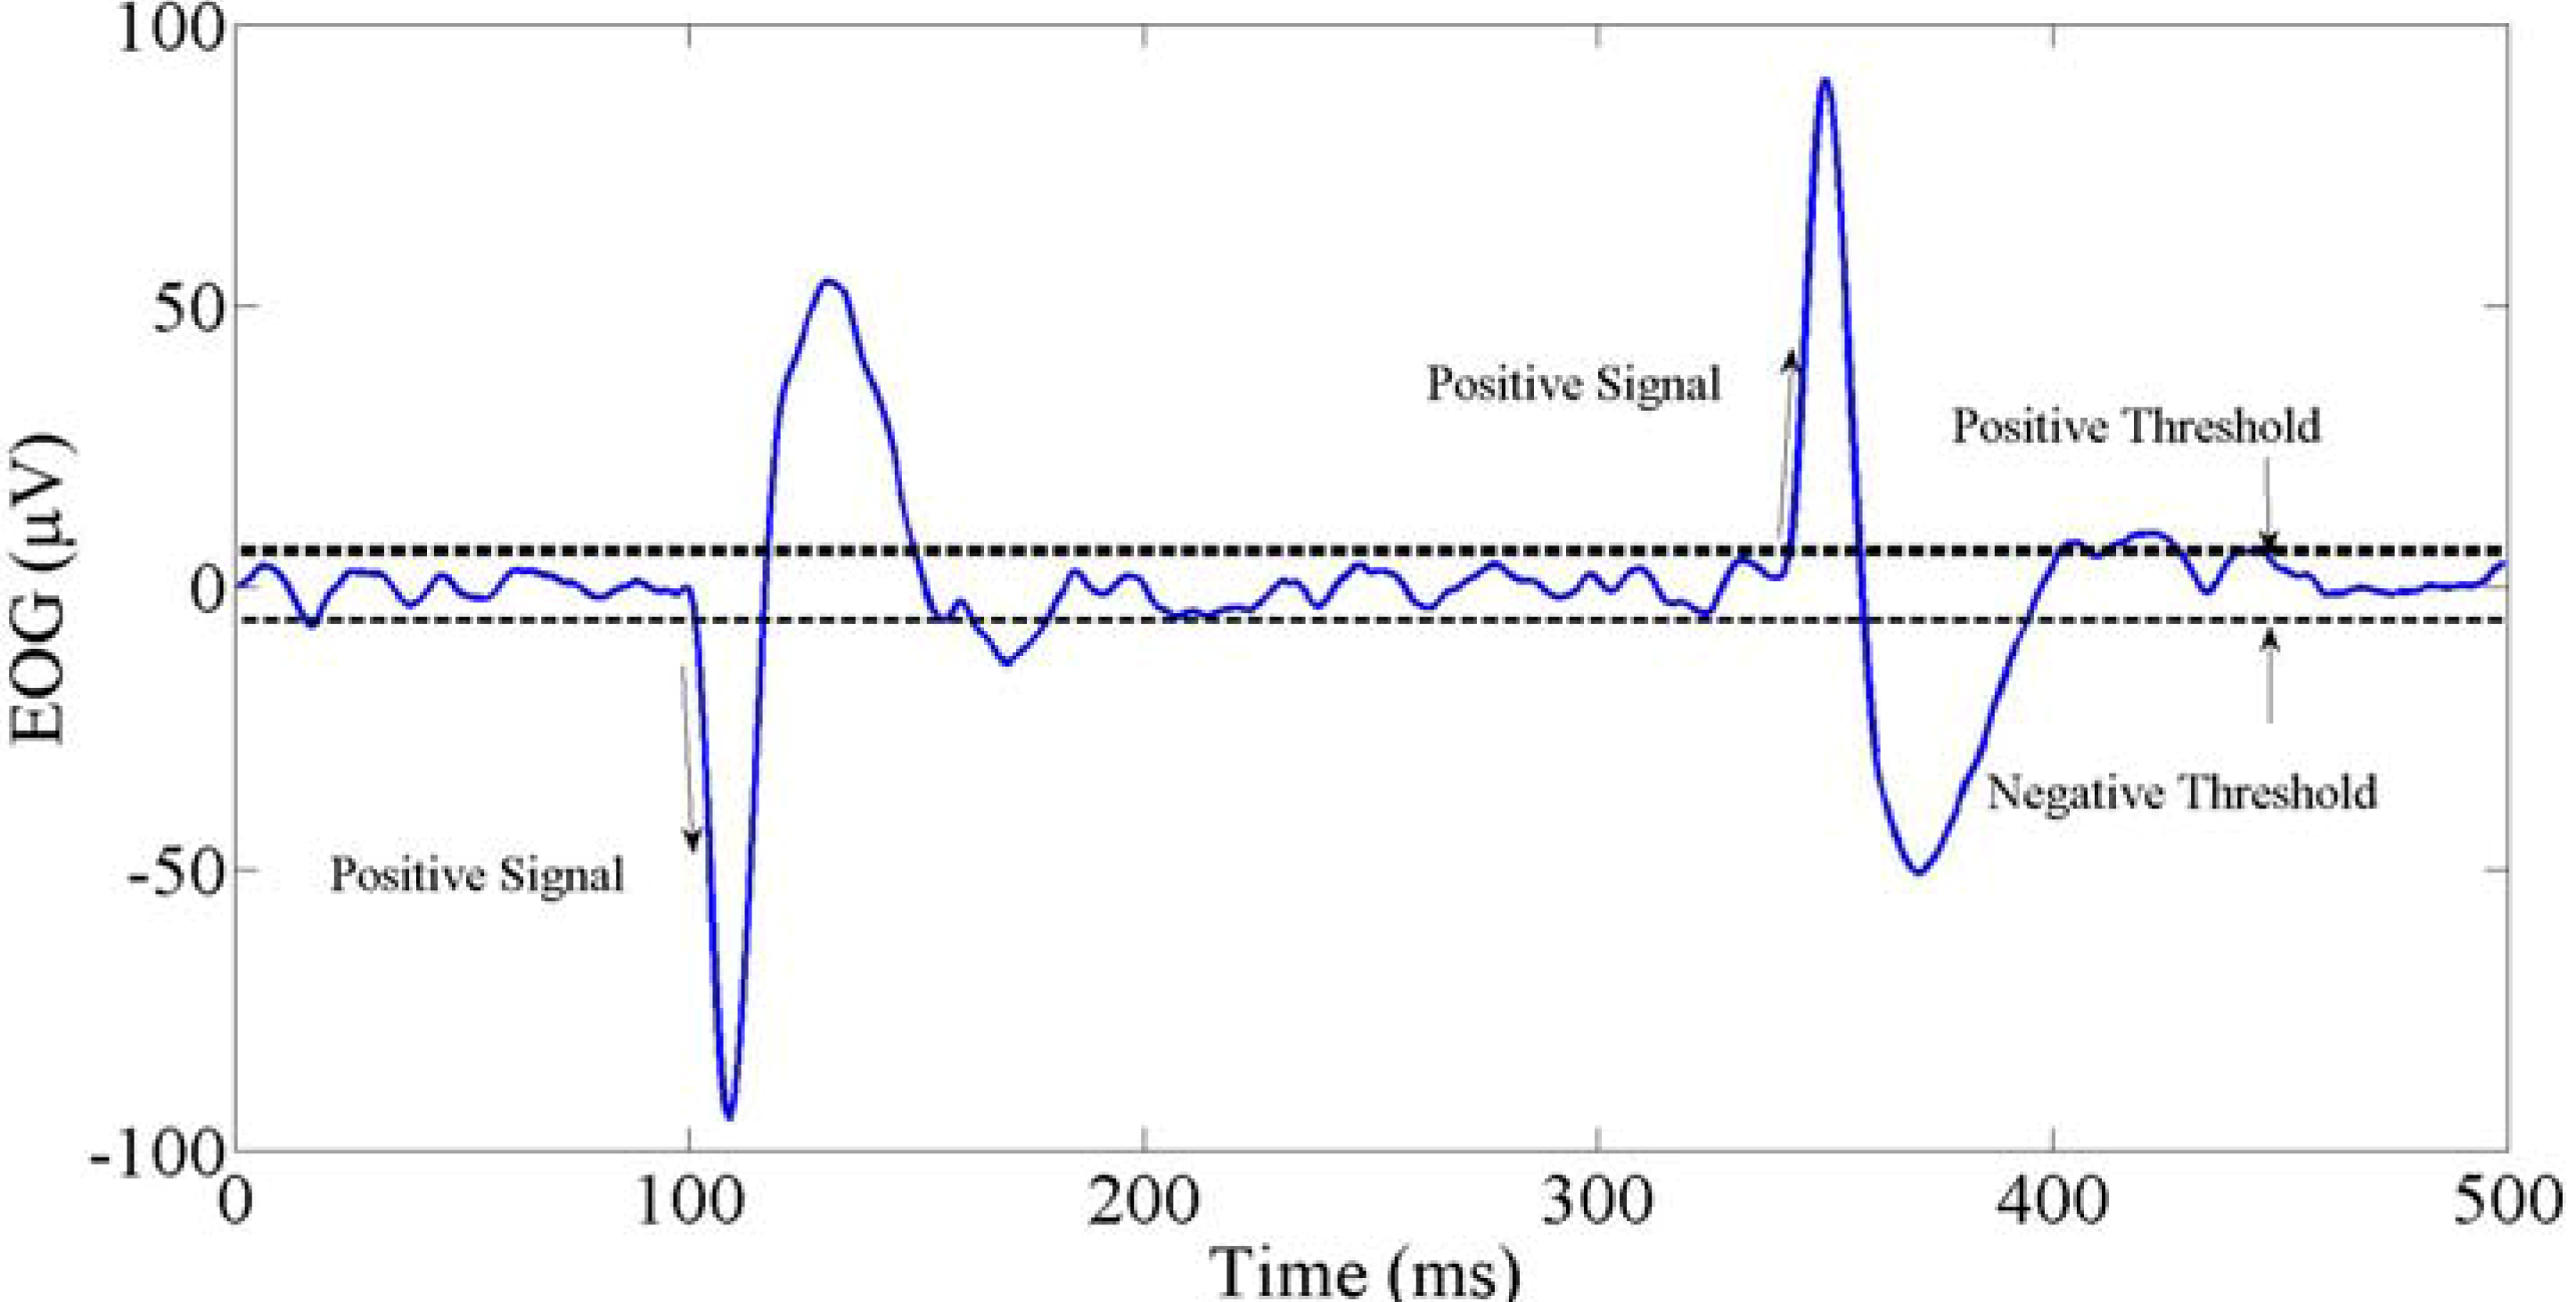
There are two patterns of EOG signals from the NF Instrument. These are a negative signal (−) and a positive signal (+), as shown in
Figure 5. Two thresholds were used to detect when a gaze motion occurred: a negative signal passed the negative threshold (th −) and a positive signal passed the positive threshold (th +). It was simple to detect gaze motions in four basic directions (right, left, up and down) using the signal pattern combinations from Ch1 and Ch2. As shown in
Table 1, there are four signal combinations from Ch1 and Ch2 to detect four directions. One is a left gaze motion if Ch1 has a negative signal and Ch2 has a positive signal. A contrary condition happens with the right gaze motion. In the same way, the up gaze motion and down gaze motion can be distinguished. These combinations will be explored later to detect the target points.
Figure 4.
Polarity of eye and the electrode positions.
Figure 4.
Polarity of eye and the electrode positions.
Figure 5.
Two patterns of EOG signal using the NF Instrument.
Figure 5.
Two patterns of EOG signal using the NF Instrument.
Table 1.
Signal combinations for basic directions.
Table 1.
Signal combinations for basic directions.
| Channel | Gaze Direction |
|---|
| Left | Right | Up | Down |
|---|
| Ch1 | (−) | (+) | (−) | (+) |
| Ch2 | (+) | (−) | (−) | (+) |
3. Design of a Two-DoF Robot Manipulator
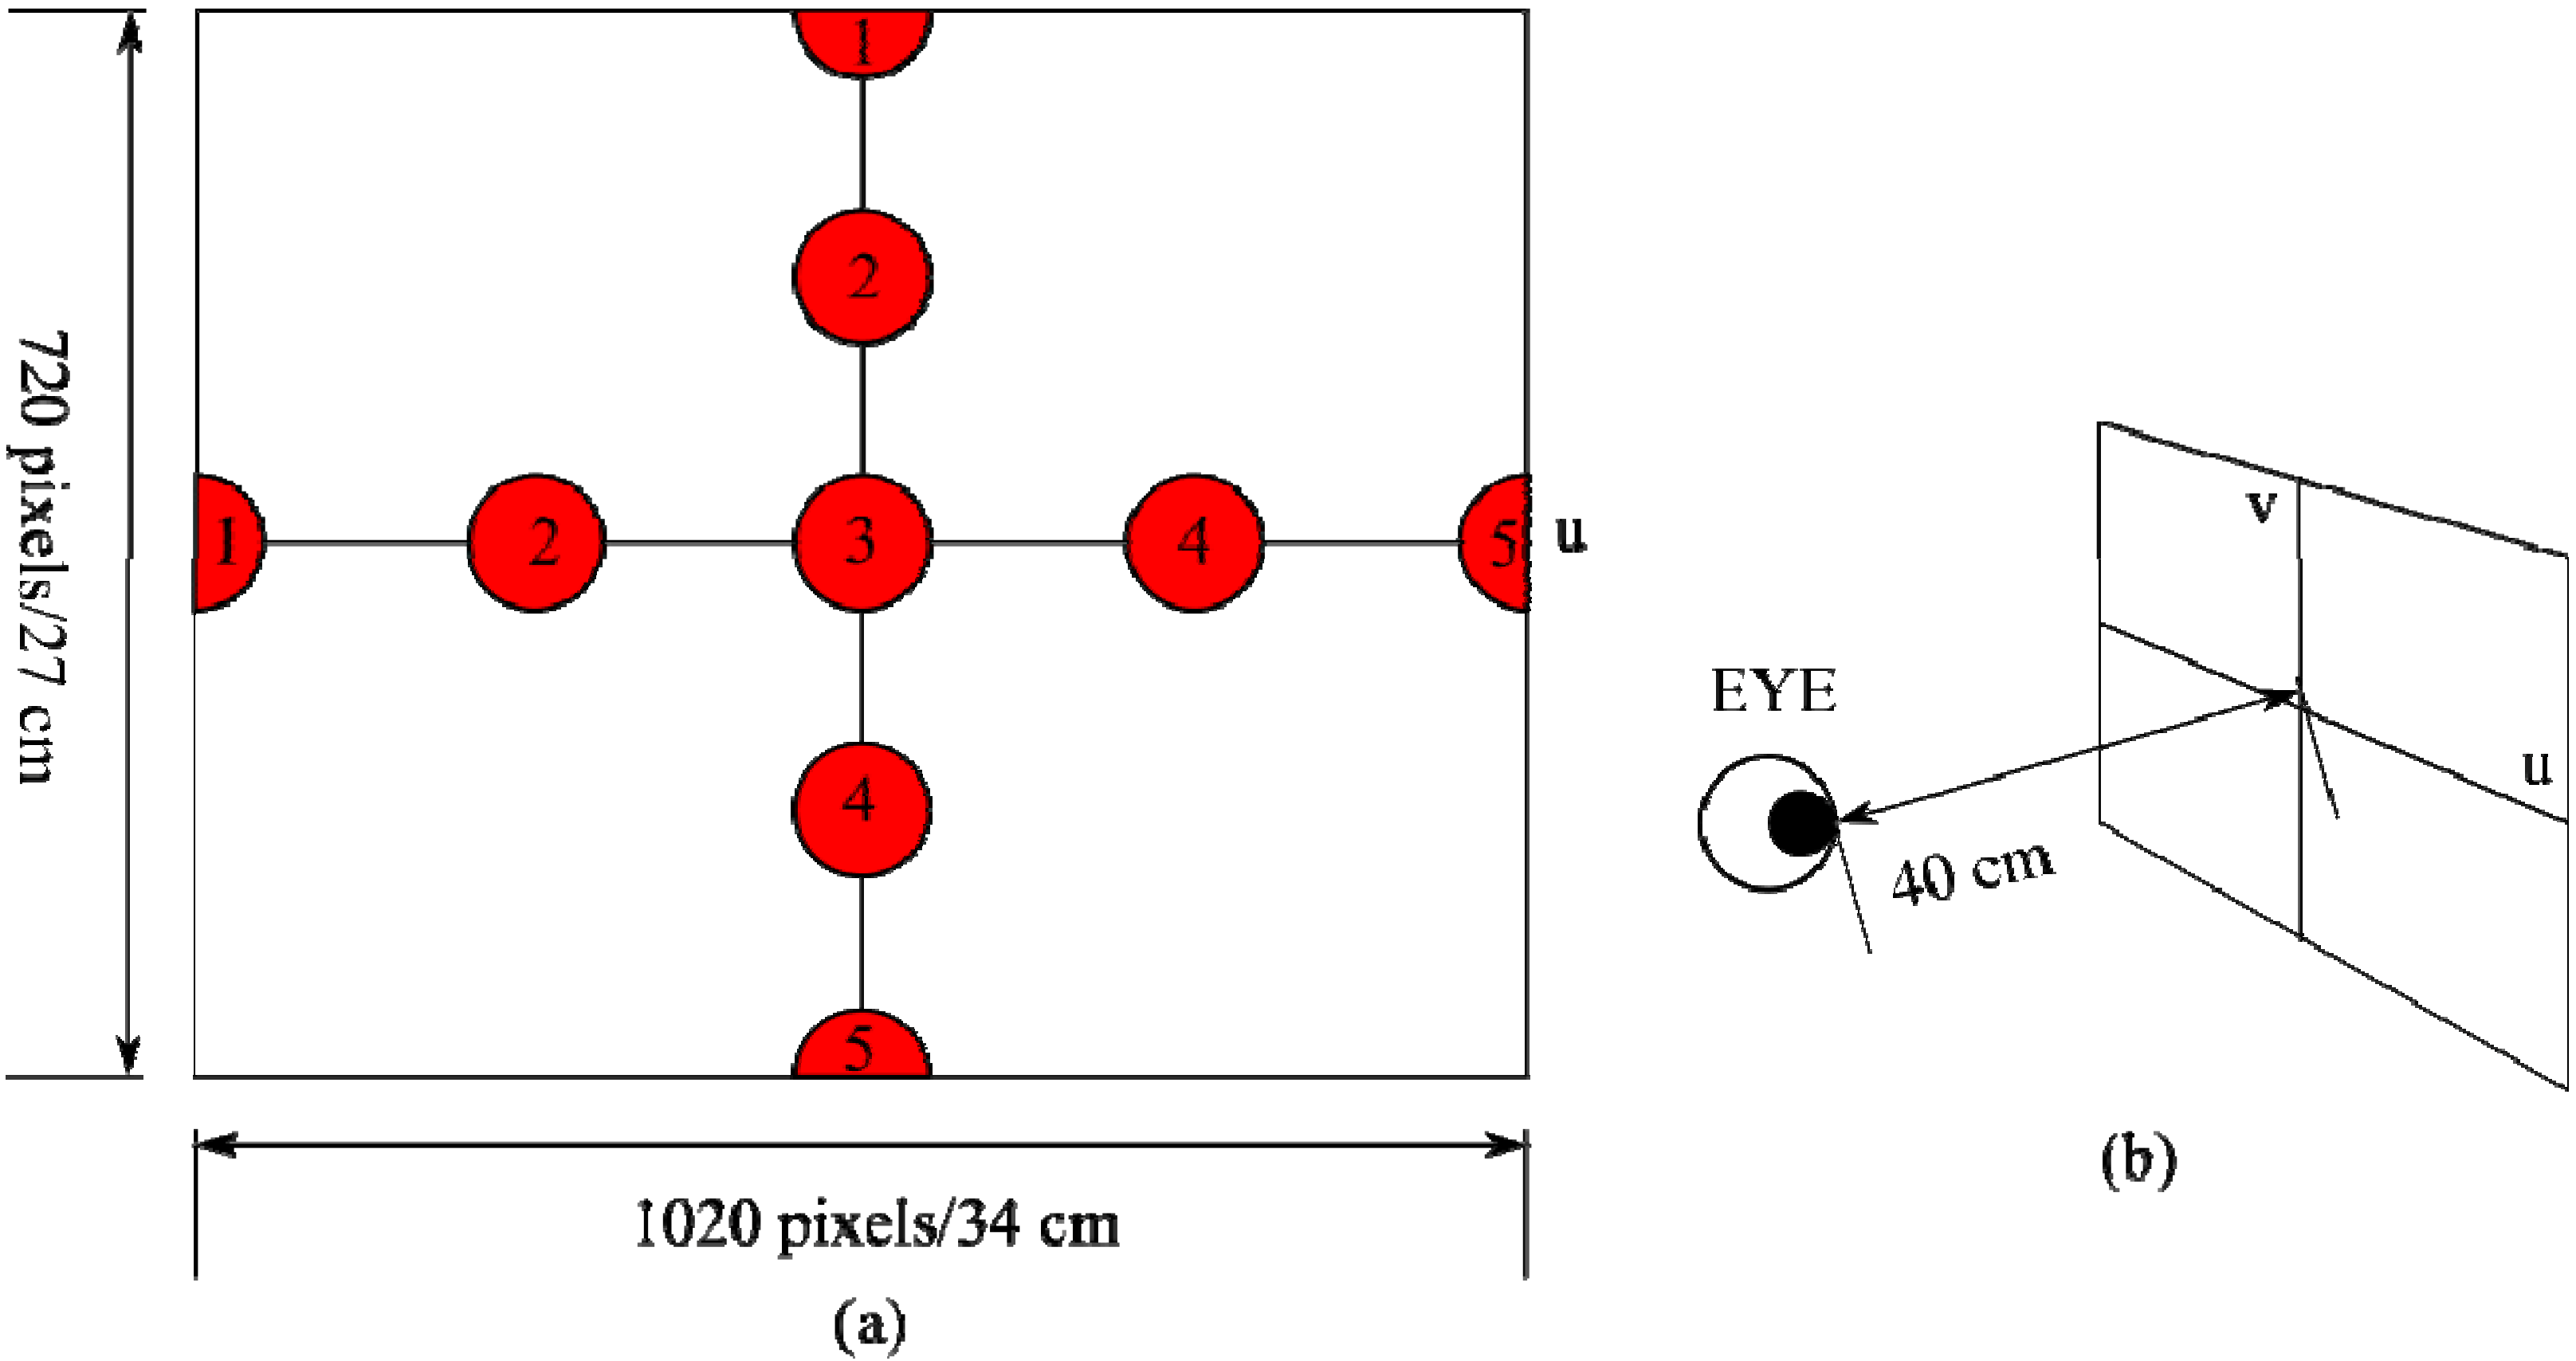
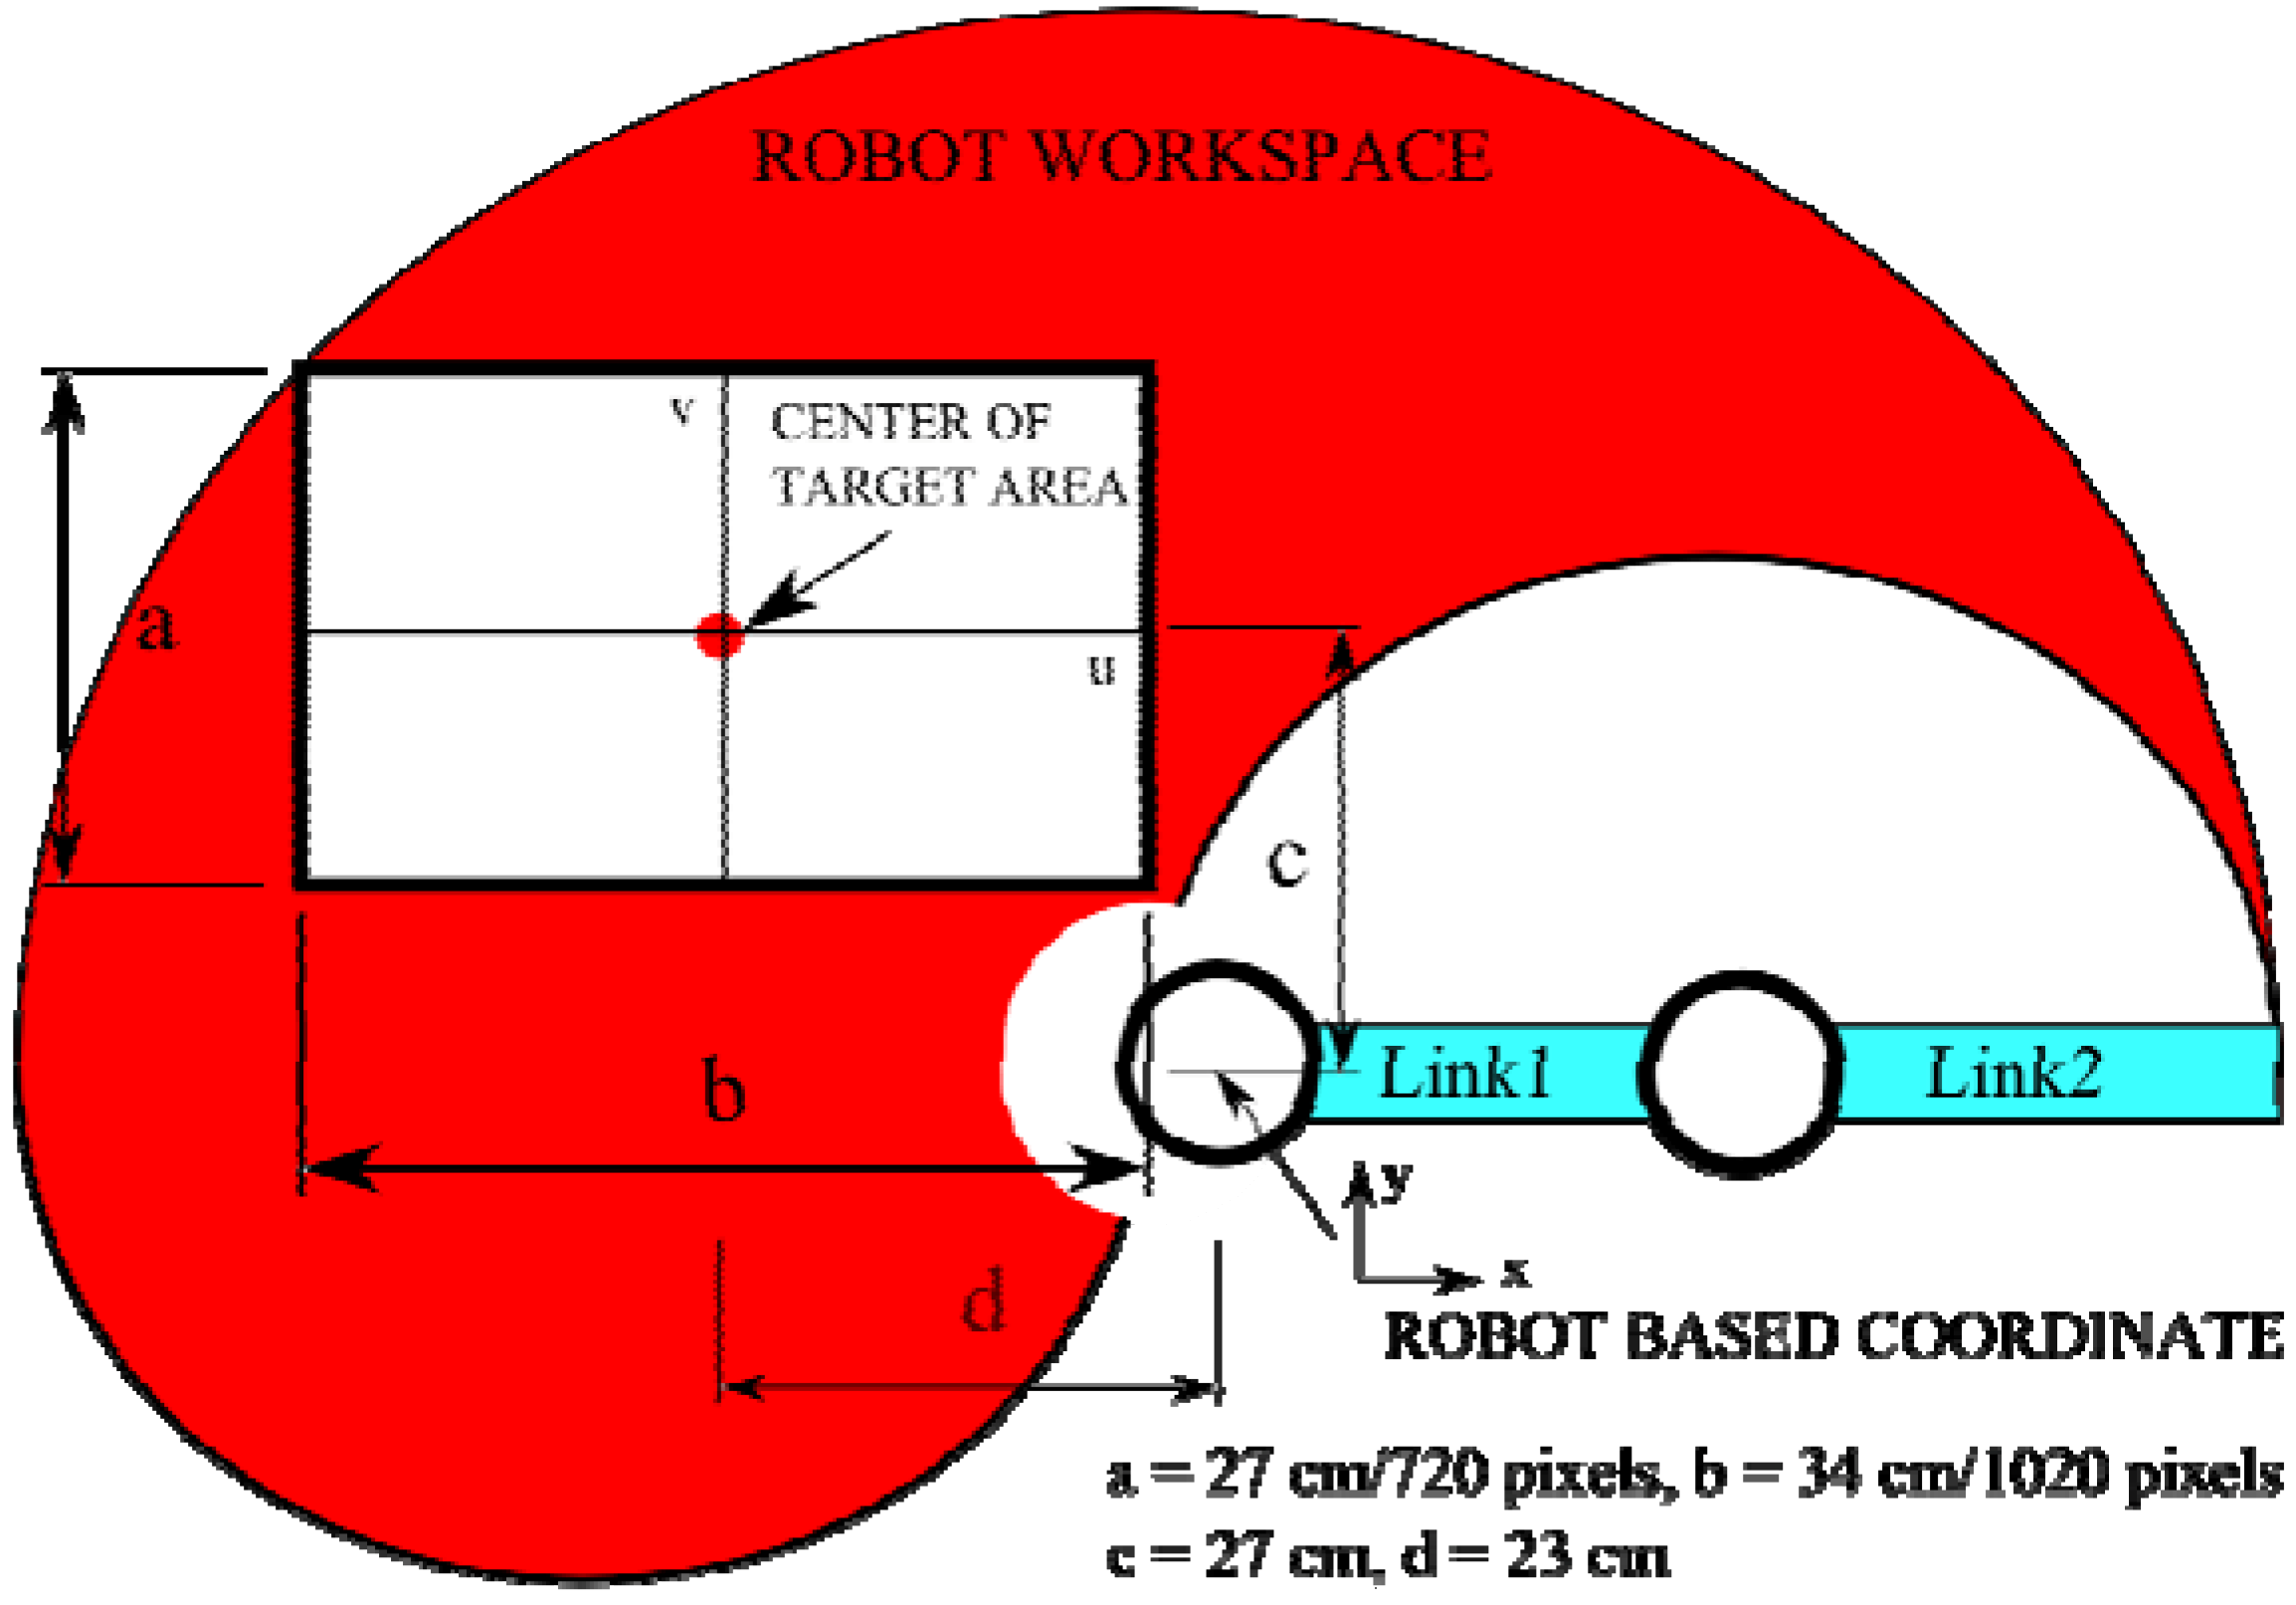
Operators drove the robot end-effector to some positions that they desired using gaze motion. Therefore, the working area of the robot was designed to cover the target area. To assess the accuracy of the system, some targets were spread on a monitor display. The target positions were called actual positions, and the positions generated from the EOG were called desired positions. The size of the monitor was 34 cm (horizontal) × 27 cm (vertical) or 1020 pixels × 720 pixels.
Figure 6 shows the location of the target area based on the robot workspace.
Figure 6.
Target area and robot workspace.
Figure 6.
Target area and robot workspace.
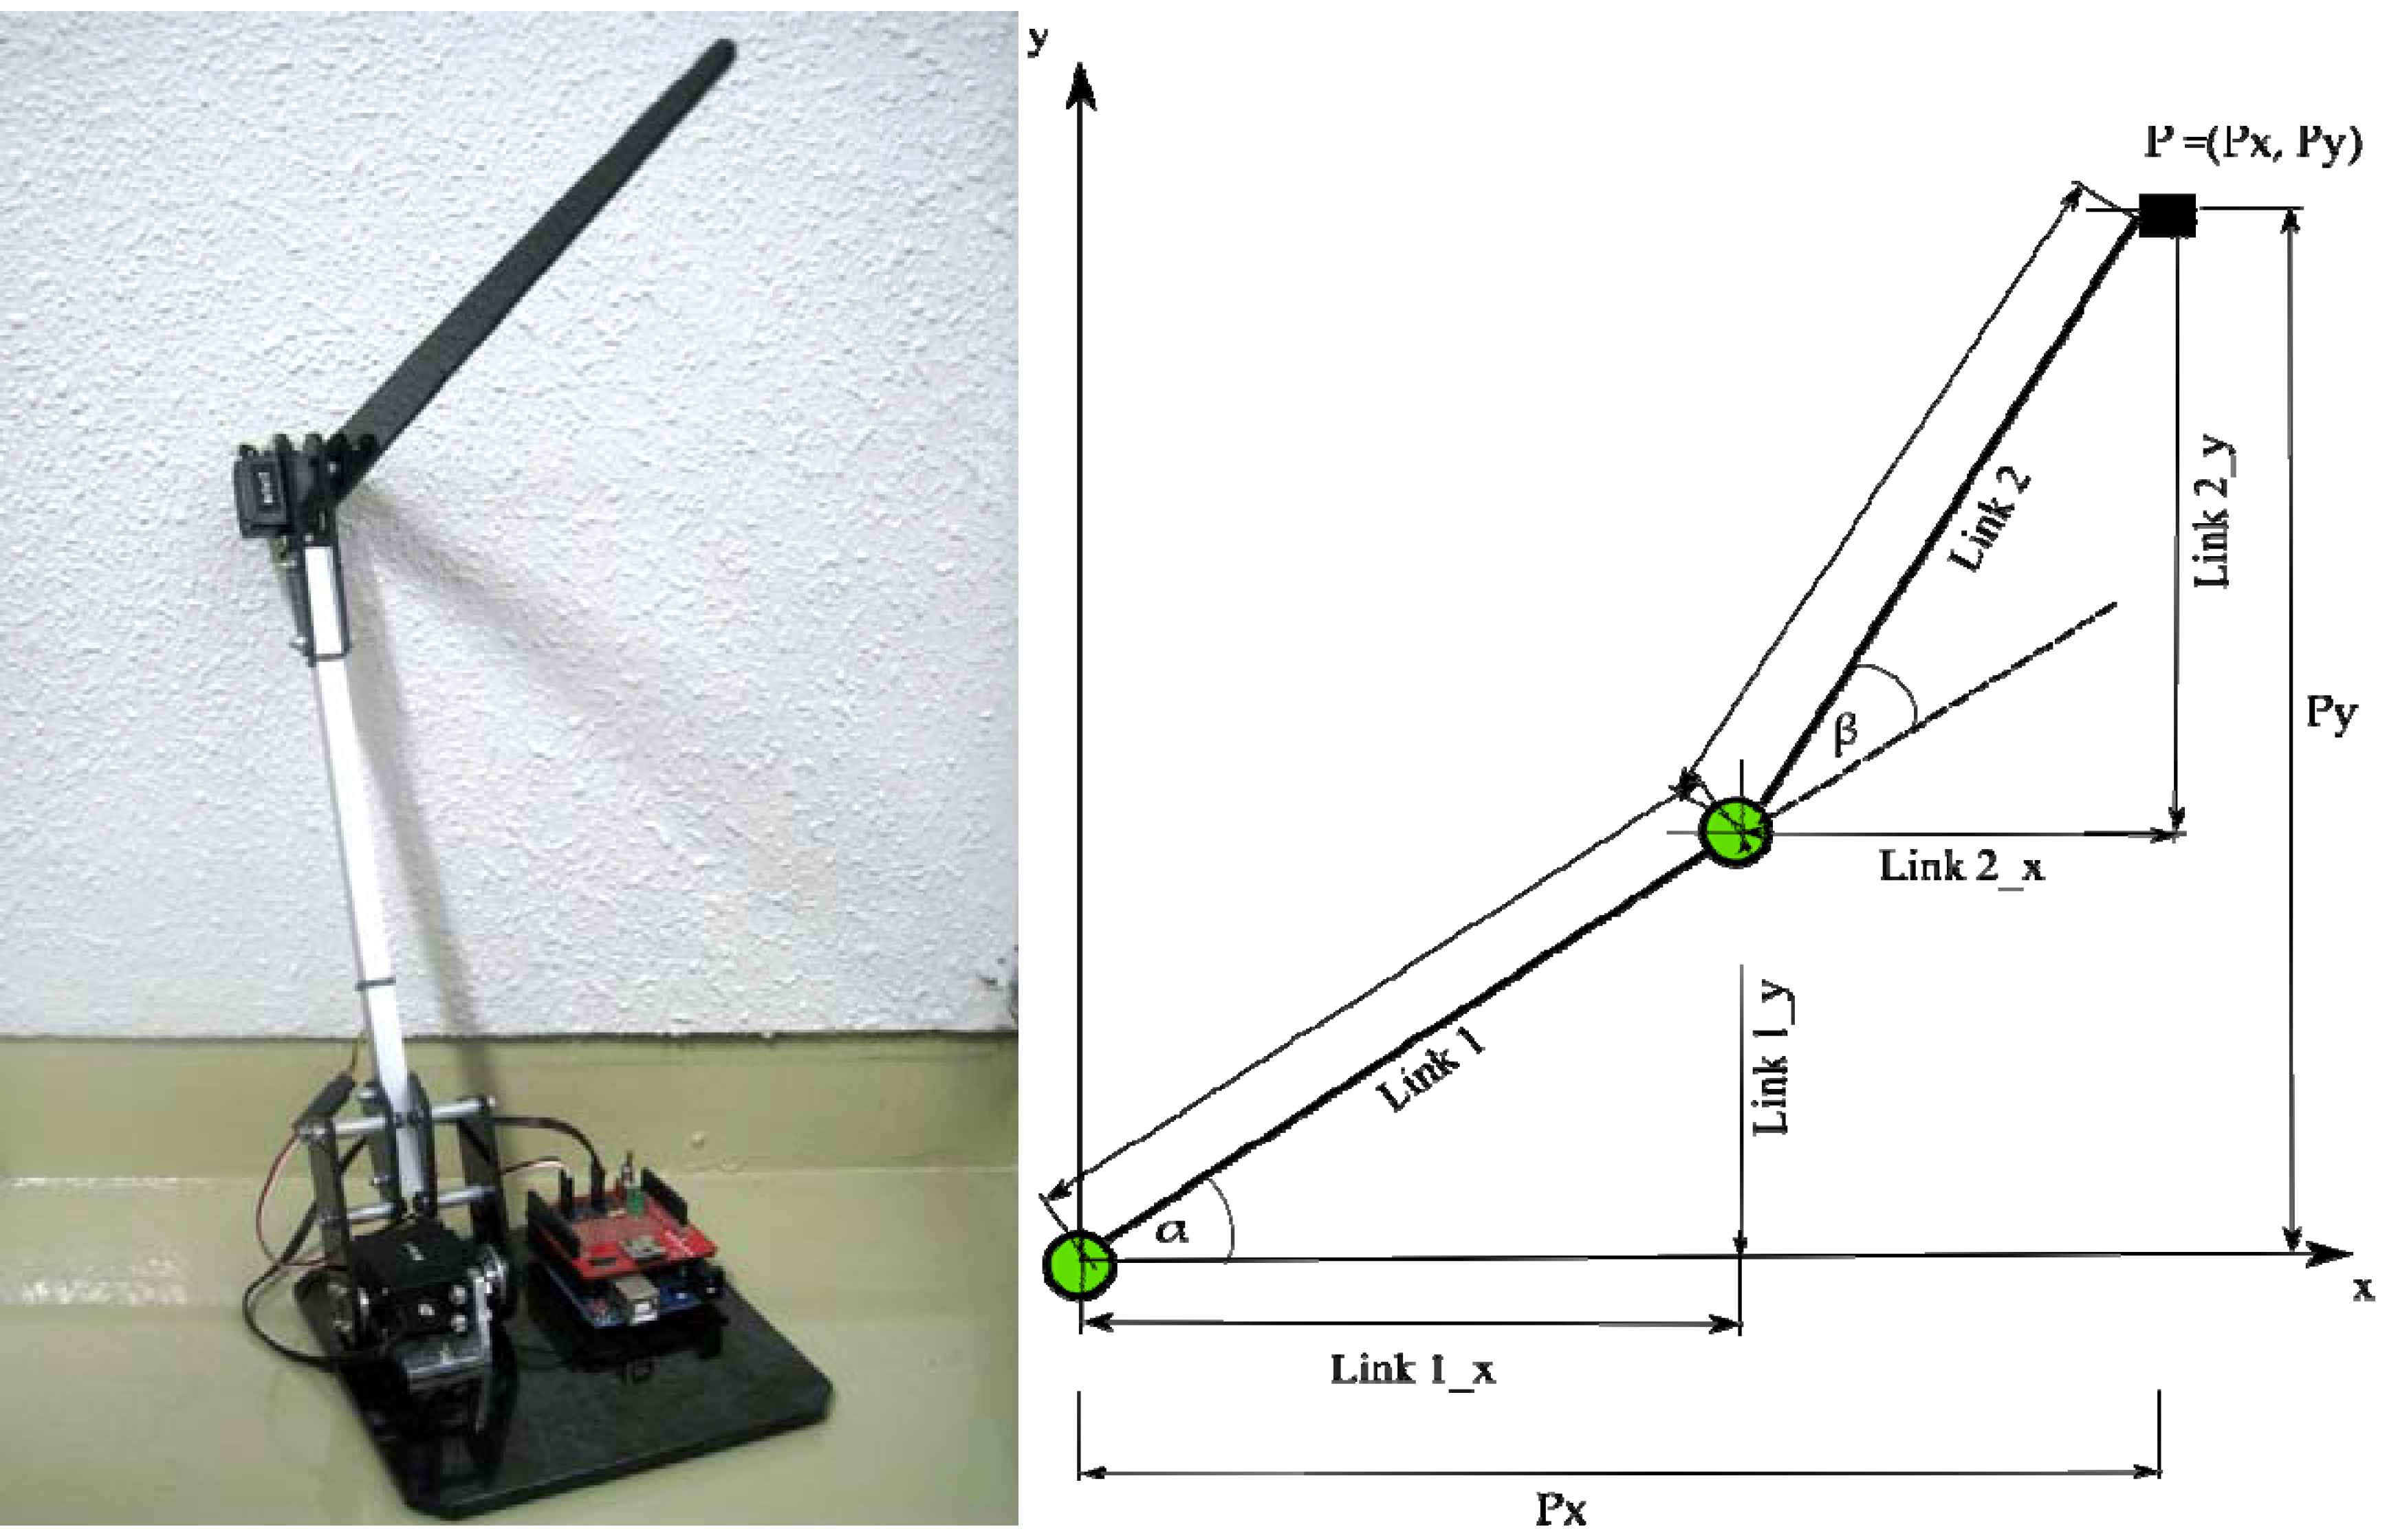
A two-DoF planar robot manipulator was already designed to cover this area. This robot had two joints and two links. The length of each links was 30 cm. The first joint had a 0° to 180° rotation angle and the second joint a rotation angle of 0° to 120°. Considering the torque of the end effector, the HSR-5980SG motor, which had 24 kg/cm of torque and a weight of 70 g, was chosen as the first joint and the HS-5085MG motor as the second joint had 3.6 kg/cm of torque and a weight of 21.9 g. The joints were controlled by an Arduino microcontroller and connected by serial communication to an EOG computer.
The output from the EOG was the pixel coordinates (u, v) of the gaze motion. Then, these pixels were converted into (Px, Py) in robot coordinates. Every pixel in u and v could be calculated as cm by using Equations (1) and (2). Offset coordinates also occurred, since the center of the target area is not exactly the same as the robot-based coordinates. The effects of the offset in the horizontal direction were 23 cm and 27 cm in the vertical direction.
The end-effector of the robot moved to the target position (
Px,
Py).
Px was the end-effector position in the
x-axis, and
Py was the end-effector position in the y-axis. The correlation between the end-effector position (
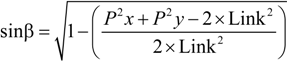
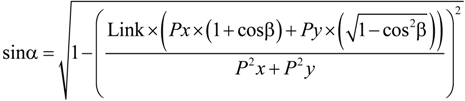
Px,
Py) and the joint angles (α and β
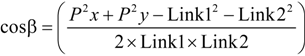
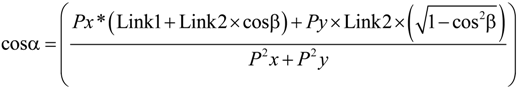
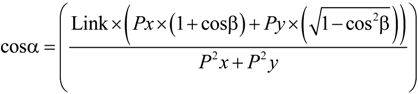
) was determined by inverse kinematics. Joint 1 rotated with the α angle, and Joint 2 rotated with the β angle. The link lengths were Link1 and Link2, which were equal, so that they were named as “Links”. Consequently, the angles of Joint 1 and Joint 2 for the end-effector position (
Px,
Py) are given by Equations (3–10), for which, sin α and sin β were calculated by the trigonometry property,
![Robotics 03 00289 i001]()
.
Figure 7 shows the robot and its joint coordinates.
Figure 7.
End-effector position, P = (Px, Py).
Figure 7.
End-effector position, P = (Px, Py).
4. Methodology
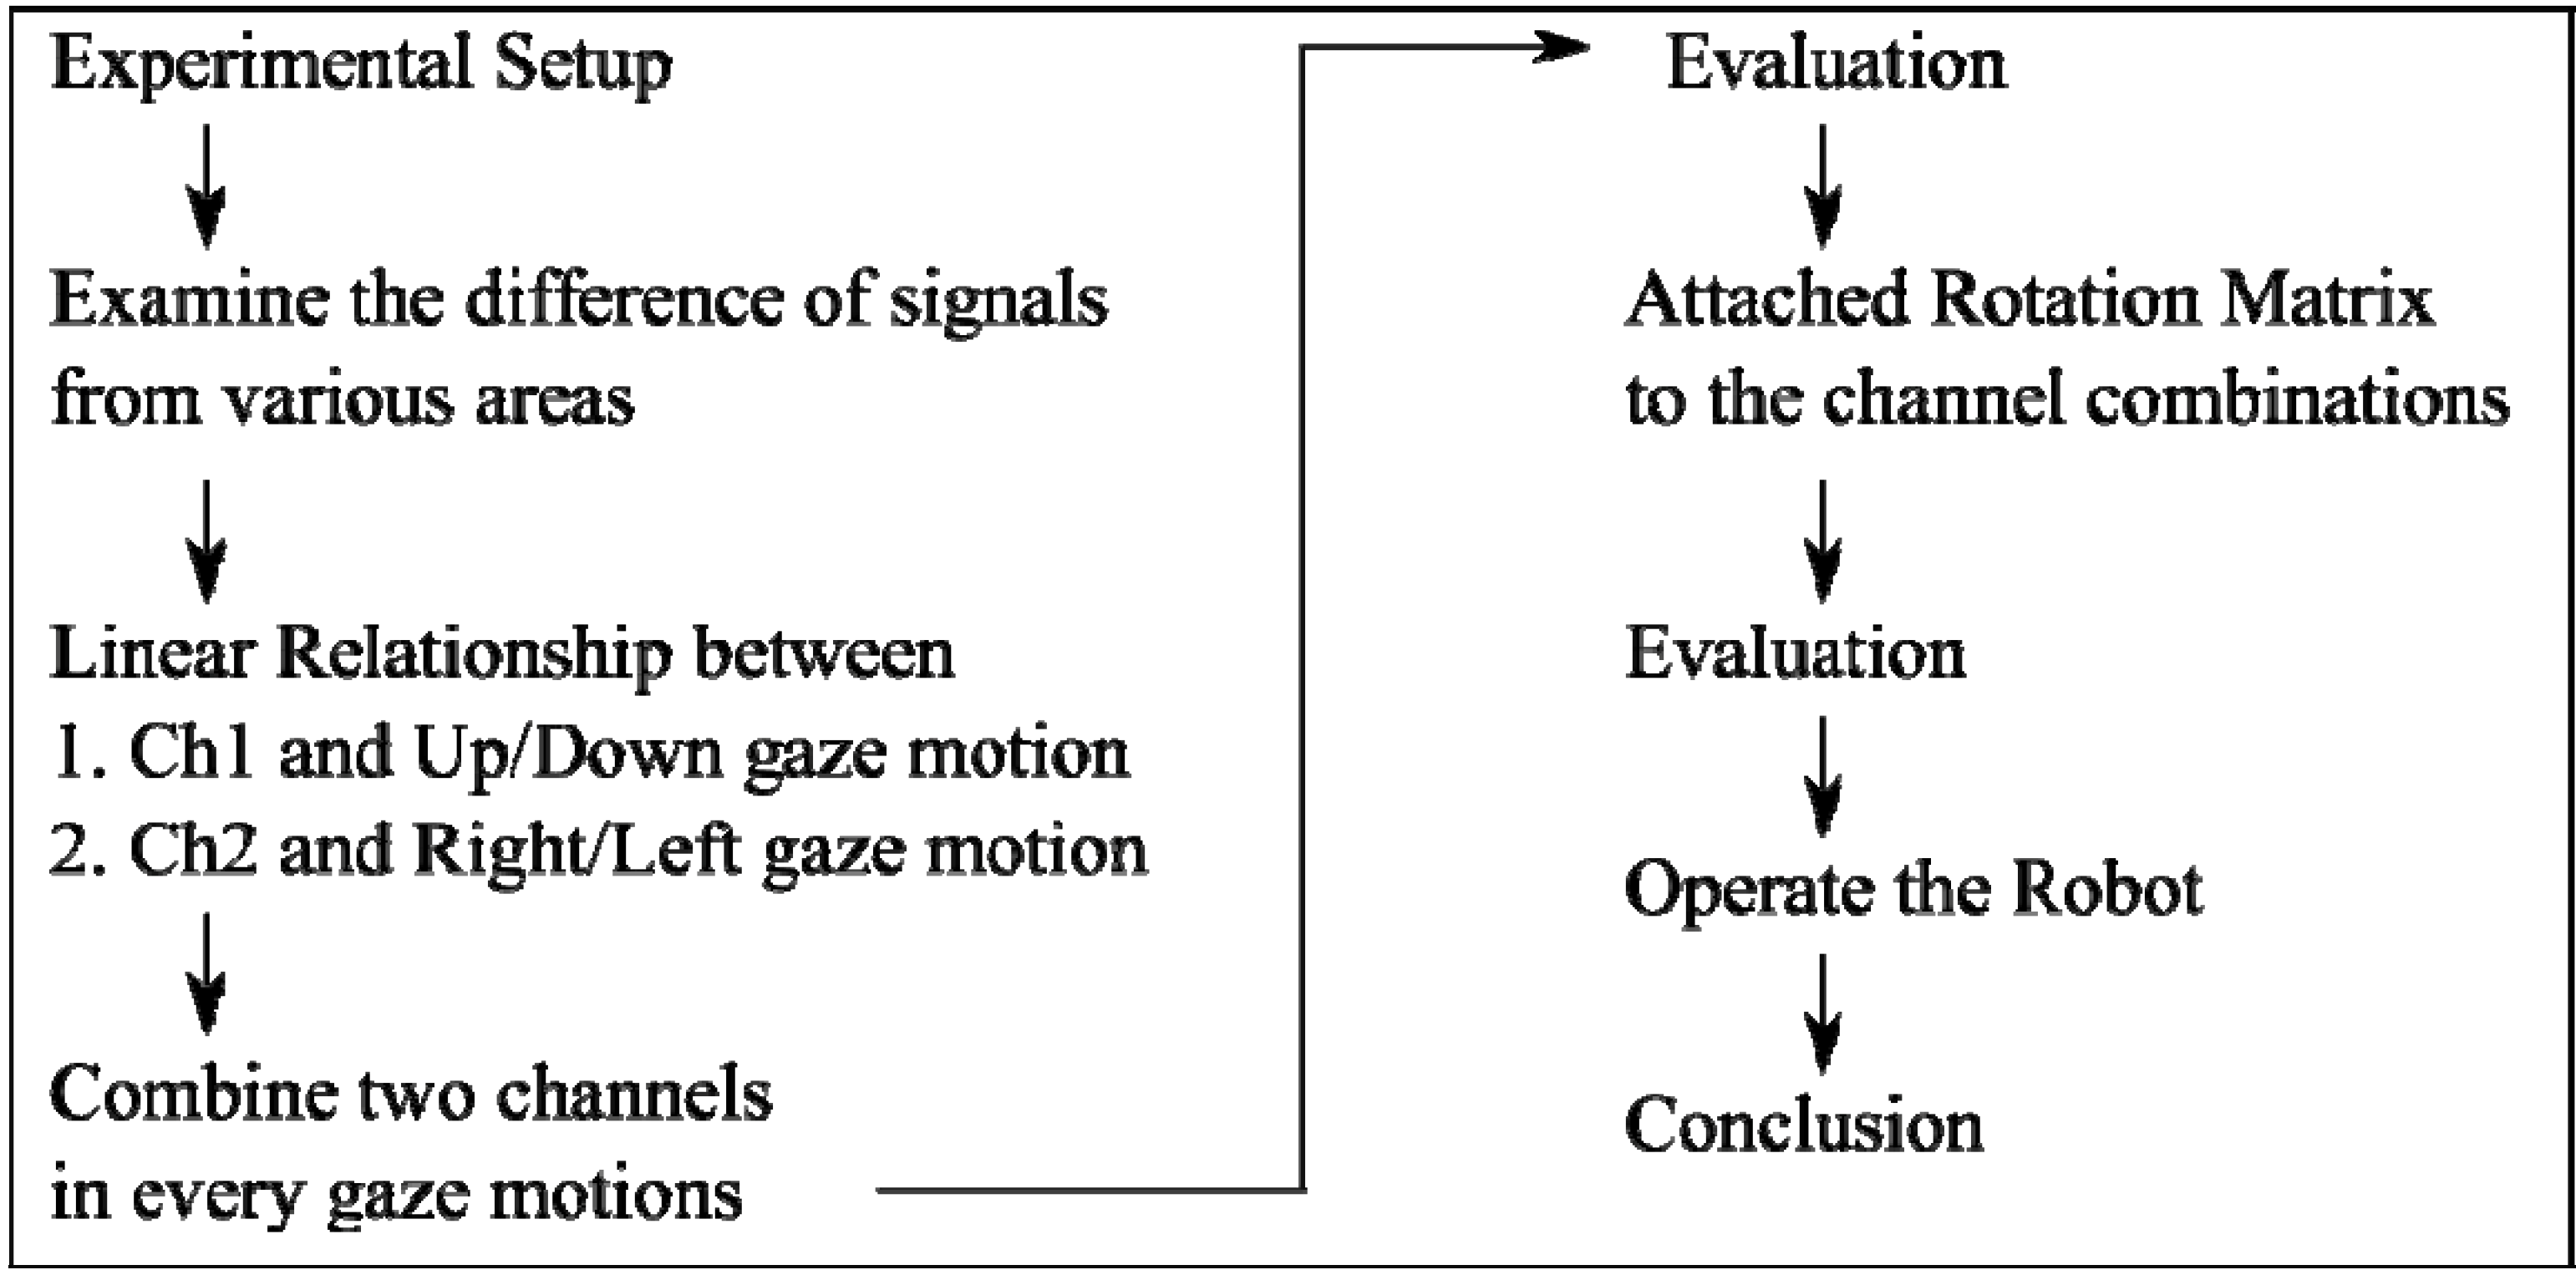
After discussing the EOG sensor and the robot manipulator, this section explains the experiment setup, which includes the position of the operators and the positions of the targets for training. First, the similarity of EOG signals in four areas each for horizontal and vertical gaze motions was checked for each operator. Then, a preliminary experiment was done to get the relationship between the vertical gaze motion and the EOG signal from Ch1, as well the relationship between the horizontal gaze motion and the EOG signal from Ch2. This step gave the linear equations of EOG. The products of these equations were the pixel positions of the targets. Based on the signal combinations, these equations were improved by rotation matrixes, so that the system was well operated, not only in horizontal or vertical direction, but also in the diagonal gaze motion for a free gaze motion distance. Finally, three healthy operators tried to operate the robot using their EOG signal.
Figure 8 briefly shows the main process for achieving the goal.
Figure 8.
The main process of the research.
Figure 8.
The main process of the research.
There were ten training targets in total, 40 cm in front of the operators, which were five training targets in the horizontal line and five training targets in the vertical line, as shown in
Figure 9a,b. The training targets were used to determine the linear relationships between the EOG and the gaze motion. The training targets were numbered from 1 to 5. Target Number 3 was exactly located in the middle of display. This point was a reference point for the head position. This position was fixed to reduce the noise from the head movement. The normal distance between the operator and the target area is 40 cm, as shown in
Figure 9b.
Figure 9.
A monitor in front of operator as the target location. (a) Target points for training. (b) The normal distance between eyes and the target.
Figure 9.
A monitor in front of operator as the target location. (a) Target points for training. (b) The normal distance between eyes and the target.
Linear Relationship between EOG and Gaze Motion
The training experiments depended on directions, distances and areas. The directions were up, down, right and left. There were four gaze distances, each in the horizontal and vertical directions. The distances were grouped into 1-point, 2-point, 3-point and 4-point gaze motions. In the vertical case, the shortest distance was 180 pixels, whereas the longest distance was 720 pixels. On the other hand, the shortest distance in the horizontal direction was 255 pixels, and the longest distance was 1020 pixels, as shown in
Table 2. In this experiment, the area for horizontal movement was approximately ±46°, and the area for the vertical movement was approximately 38°.
Table 2.
The distance for four types of movement distances.
Table 2.
The distance for four types of movement distances.
| Direction | Gaze Distance |
|---|
| 1-Point | 2-Point | 3-Point | 4-Point |
|---|
| Vertical | 180 pixels/9° | 360 pixels/19° | 540 pixels/28° | 720 pixels/38° |
| Horizontal | 255 pixels/12° | 510 pixels/23° | 765 pixels/35° | 1020 pixels/46° |
The gaze distances had some different working areas: 1-point movement had four areas; 2-point movement had three areas; 3-point movement had two areas; and 4-point movement had only one area. Area 1 for the 1-point gaze distance was
1–2, which refers to the gaze motions from training Target 1 to training Target 2 or
vice versa.
Table 3 summarizes the working area types.
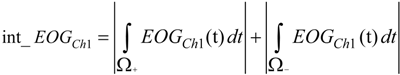
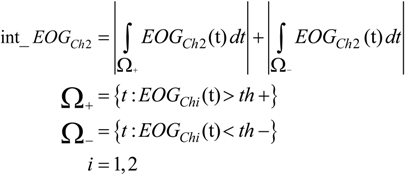
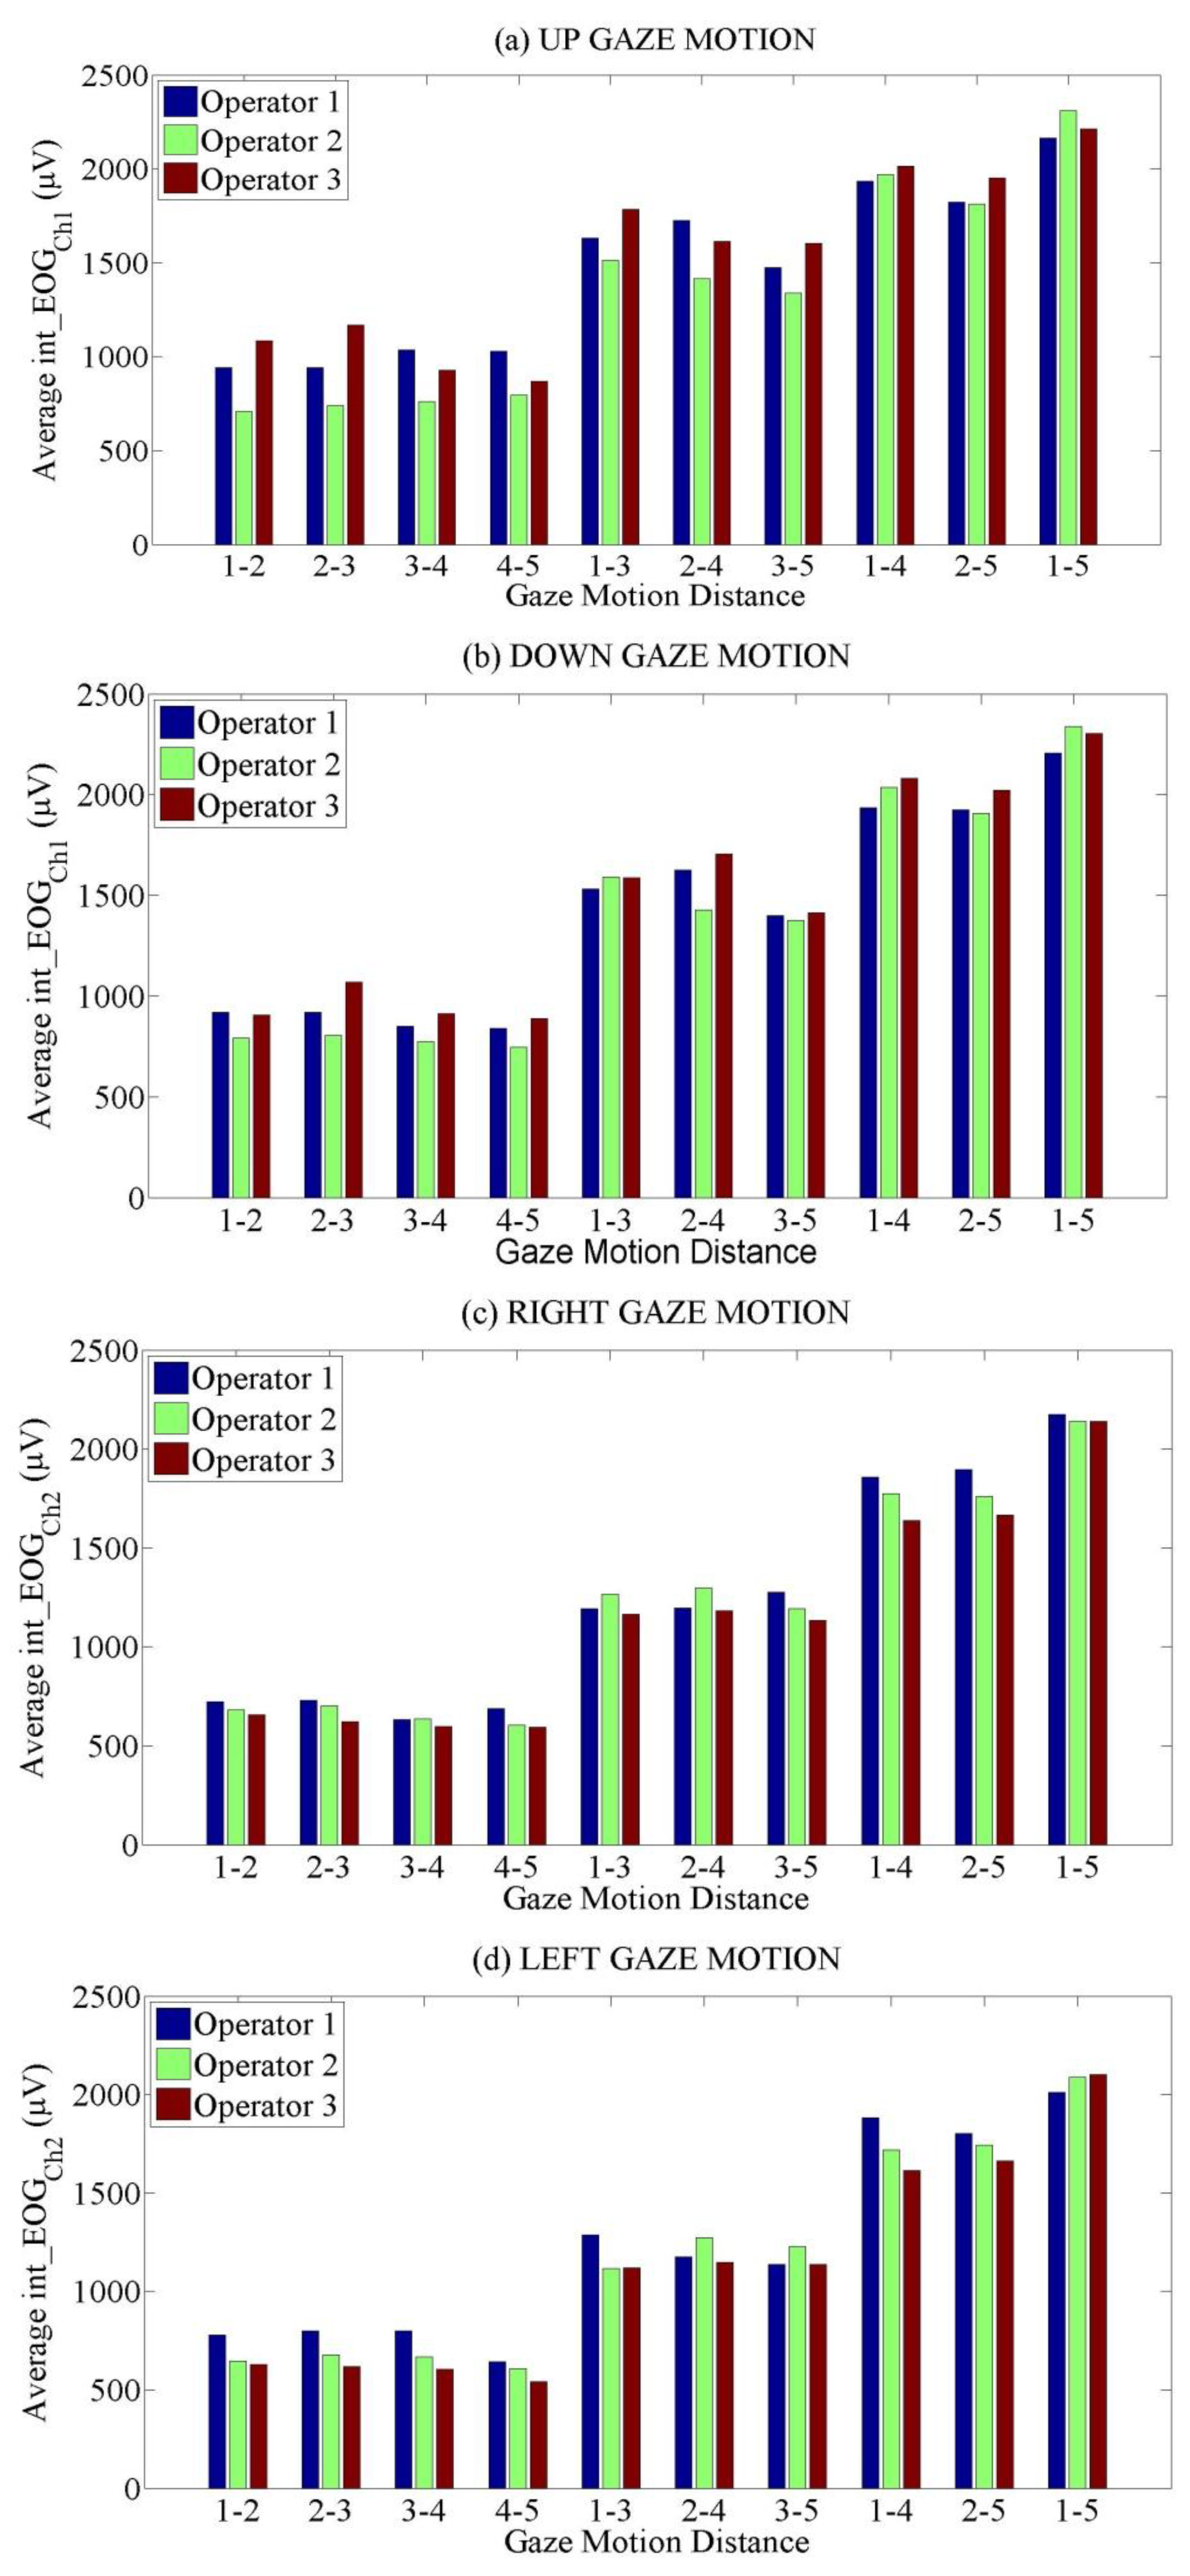
The feature of the EOG that was used in this research was the absolute integral of EOG (int_EOGChi,i=1,2), formulated by Equations (11) and (12). This variable was needed to establish the relationships between EOG and gaze distance (pixel). It was counted first when there was a signal bigger than the positive threshold (th +) or smaller than the negative threshold (th −), until the full wave was formed. The integral value from Ch1 belonged to up or down gaze motions, and Ch2 was concerned with the right or left gaze motions.
Table 3.
Types of working areas.
Table 3.
Types of working areas.
| Gaze Distance | Area | Pixel Distance (u,v) |
|---|
| 1 | 2 | 3 | 4 | Horizontal | Vertical |
|---|
| 1-point | 1–2 | 2–3 | 3–4 | 4–5 | (255, 0) | (0, 180) |
| 2-point | 1–3 | 2–4 | 3–5 | | (510, 0) | (0, 360) |
| 3-point | 1–4 | 2–5 | | | (765, 0) | (0, 540) |
| 4-point | 1–5 | | | | (1020, 0) | (0, 720) |
The Ch1 signal was only associated with vertical gaze motion, and the signal from Ch2 was for the horizontal gaze motion. Operators performed all possibilities for the movements belonging to the training targets.
Figure 10a–d shows the average of the absolute integral of EOG signals for up, down, right and left gaze motions.
Before making a conclusion about the linear relationship between gaze motion and the EOG, checking the signal difference for all areas, especially in 1-point movement, was necessary. This step was just to make sure that the EOG signals in the same gaze motion distances had equal values for those areas, so that all of the areas could be used to examine the linear relationship with the gaze motion distance.
An ANOVA was used to compare the signals in four areas for the 1-point gaze motion distance. The level of confidence was 95% or α = 0.05, and the null hypothesis was that there was no difference between the EOG signals from Area 1, Area 2, Area 3 and Area 4 or that the EOG signal from Area 1 was equal to Area 2, Area 3 and Area 4. There were three operators, and they looked 20 times to 1-point right and 20 times to 1-point left in each area in the horizontal case, as well as to up and down for the vertical test.
Table 4 shows that all of the values of
F_crit were smaller than
F. That means that there was no difference between the EOG signal among the four areas as long as the gaze motion distances were the same. Therefore, if an operator looked to any target points in all possible areas, the values of the EOG were not different as long as the gaze distances were same. This evidence showed that the EOG signal from these operators could be used for further experiments.
Figure 10.
Target points for training and normal distance between eyes and target.
Figure 10.
Target points for training and normal distance between eyes and target.
Table 4.
ANOVA for the EOG signal for vertical and horizontal gaze motions among four areas in the 1-point gaze motion distance.
Table 4.
ANOVA for the EOG signal for vertical and horizontal gaze motions among four areas in the 1-point gaze motion distance.
| Vertical | Operator | Up | Down |
| F | p-value | F_crit | F | p-value | F_crit |
| Operator 1 | 0.112 | 0.952 | 3.239 | 1.935 | 0.165 | 3.239 |
| Operator 2 | 0.675 | 0.577 | 3.072 | 0.720 | 0.554 | 3.239 |
| Operator 3 | 1.364 | 0.274 | 2.947 | 2.79 | 0.063 | 3.028 |
| Horizontal | Operator | Right | Left |
| F | p-value | F_crit | F | p-value | F_crit |
| Operator 1 | 1.013 | 0.412 | 3.239 | 1.720 | 0.216 | 3.490 |
| Operator 2 | 1.783 | 0.174 | 2.960 | 1.032 | 0.397 | 3.028 |
| Operator 3 | 2.483 | 0.0888 | 3.0725 | 1.834 | 0.172 | 3.072 |
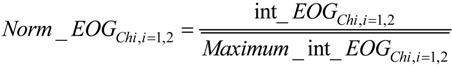
After examining the similarity of the signal in all areas, the linear relationship between gaze motion and distance was determined. Although there was no difference between signals in the same distance, the EOG values among the operators were varied. Therefore, the normalization of integral EOG (
Norm_
EOGChi,i=1,2), as shown by Equation (13), was used in this system. It could be calculated by dividing the absolute integral of the EOG signal (int_
EOGChi,i=1,2) by the average of the maximum integral EOG (
Maximum_int_EOGChi,i=1,2).
Table 5 provides the average maximum of the integral EOG for right, left, up and down from three operators. Finally, the linear relationship between the normalized EOG and the pixel are shown by Equations (14–17). The constant variables of those equations (
A,
B,
C,
D,
E,
F,
G,
H,
F and
G) are provided in
Table 6.
Table 5.
Maximum_int_EOGChi,i=1,2 from three operators.
Table 5.
Maximum_int_EOGChi,i=1,2 from three operators.
| Gaze Direction | Maximum_int_EOGChi,i=1,2 |
|---|
| Operator 1 | Operator 2 | Operator 3 |
|---|
| Up | 2,462 | 2,417 | 2,288 |
| Down | 2,237 | 2,368 | 2,368 |
| Right | 2,207 | 2,044 | 2,393 |
| Left | 2,151 | 1,986 | 2,402 |
Table 6.
Constant variables from three operators to complete Equations (10–13).
Table 6.
Constant variables from three operators to complete Equations (10–13).
| Operator | Vertical (Ch1) | Horizontal (Ch2) |
|---|
| Up | Down | Right | Left |
|---|
| A | B | C | D | E | F | G | H |
|---|
| 1 | 976 | −299 | −876 | 199 | 1,092 | −108 | −1,091 | 104 |
| 2 | 938 | −309 | −816 | 175 | 1,124 | −185 | −1,142 | 207 |
| 3 | 956 | −292 | −878 | 204 | 1,241 | −121 | −1,113 | 101 |
5. Rotation Matrix
The rotation matrix had an important role in this study, since it corrected linear pixel differences between desired targets and actual gaze motions. Some tests were needed to get the rotation matrixes. These tests were almost the same as the experiments, which obtained the four linear equations. The experiments were done in one day, and the operators gazed 20 times at the training targets for every single session. A session depended on the directions, areas and distances. The difference was if, in the previous experiment, Ch1 was just involved in the vertical gaze motion and Ch2 was only used for the horizontal gaze motion, now both of them worked together for all gaze motions. Therefore, in the case that the operators gazed at a point, the system must consider the signal combinations as mentioned early in the Electrooculography section.
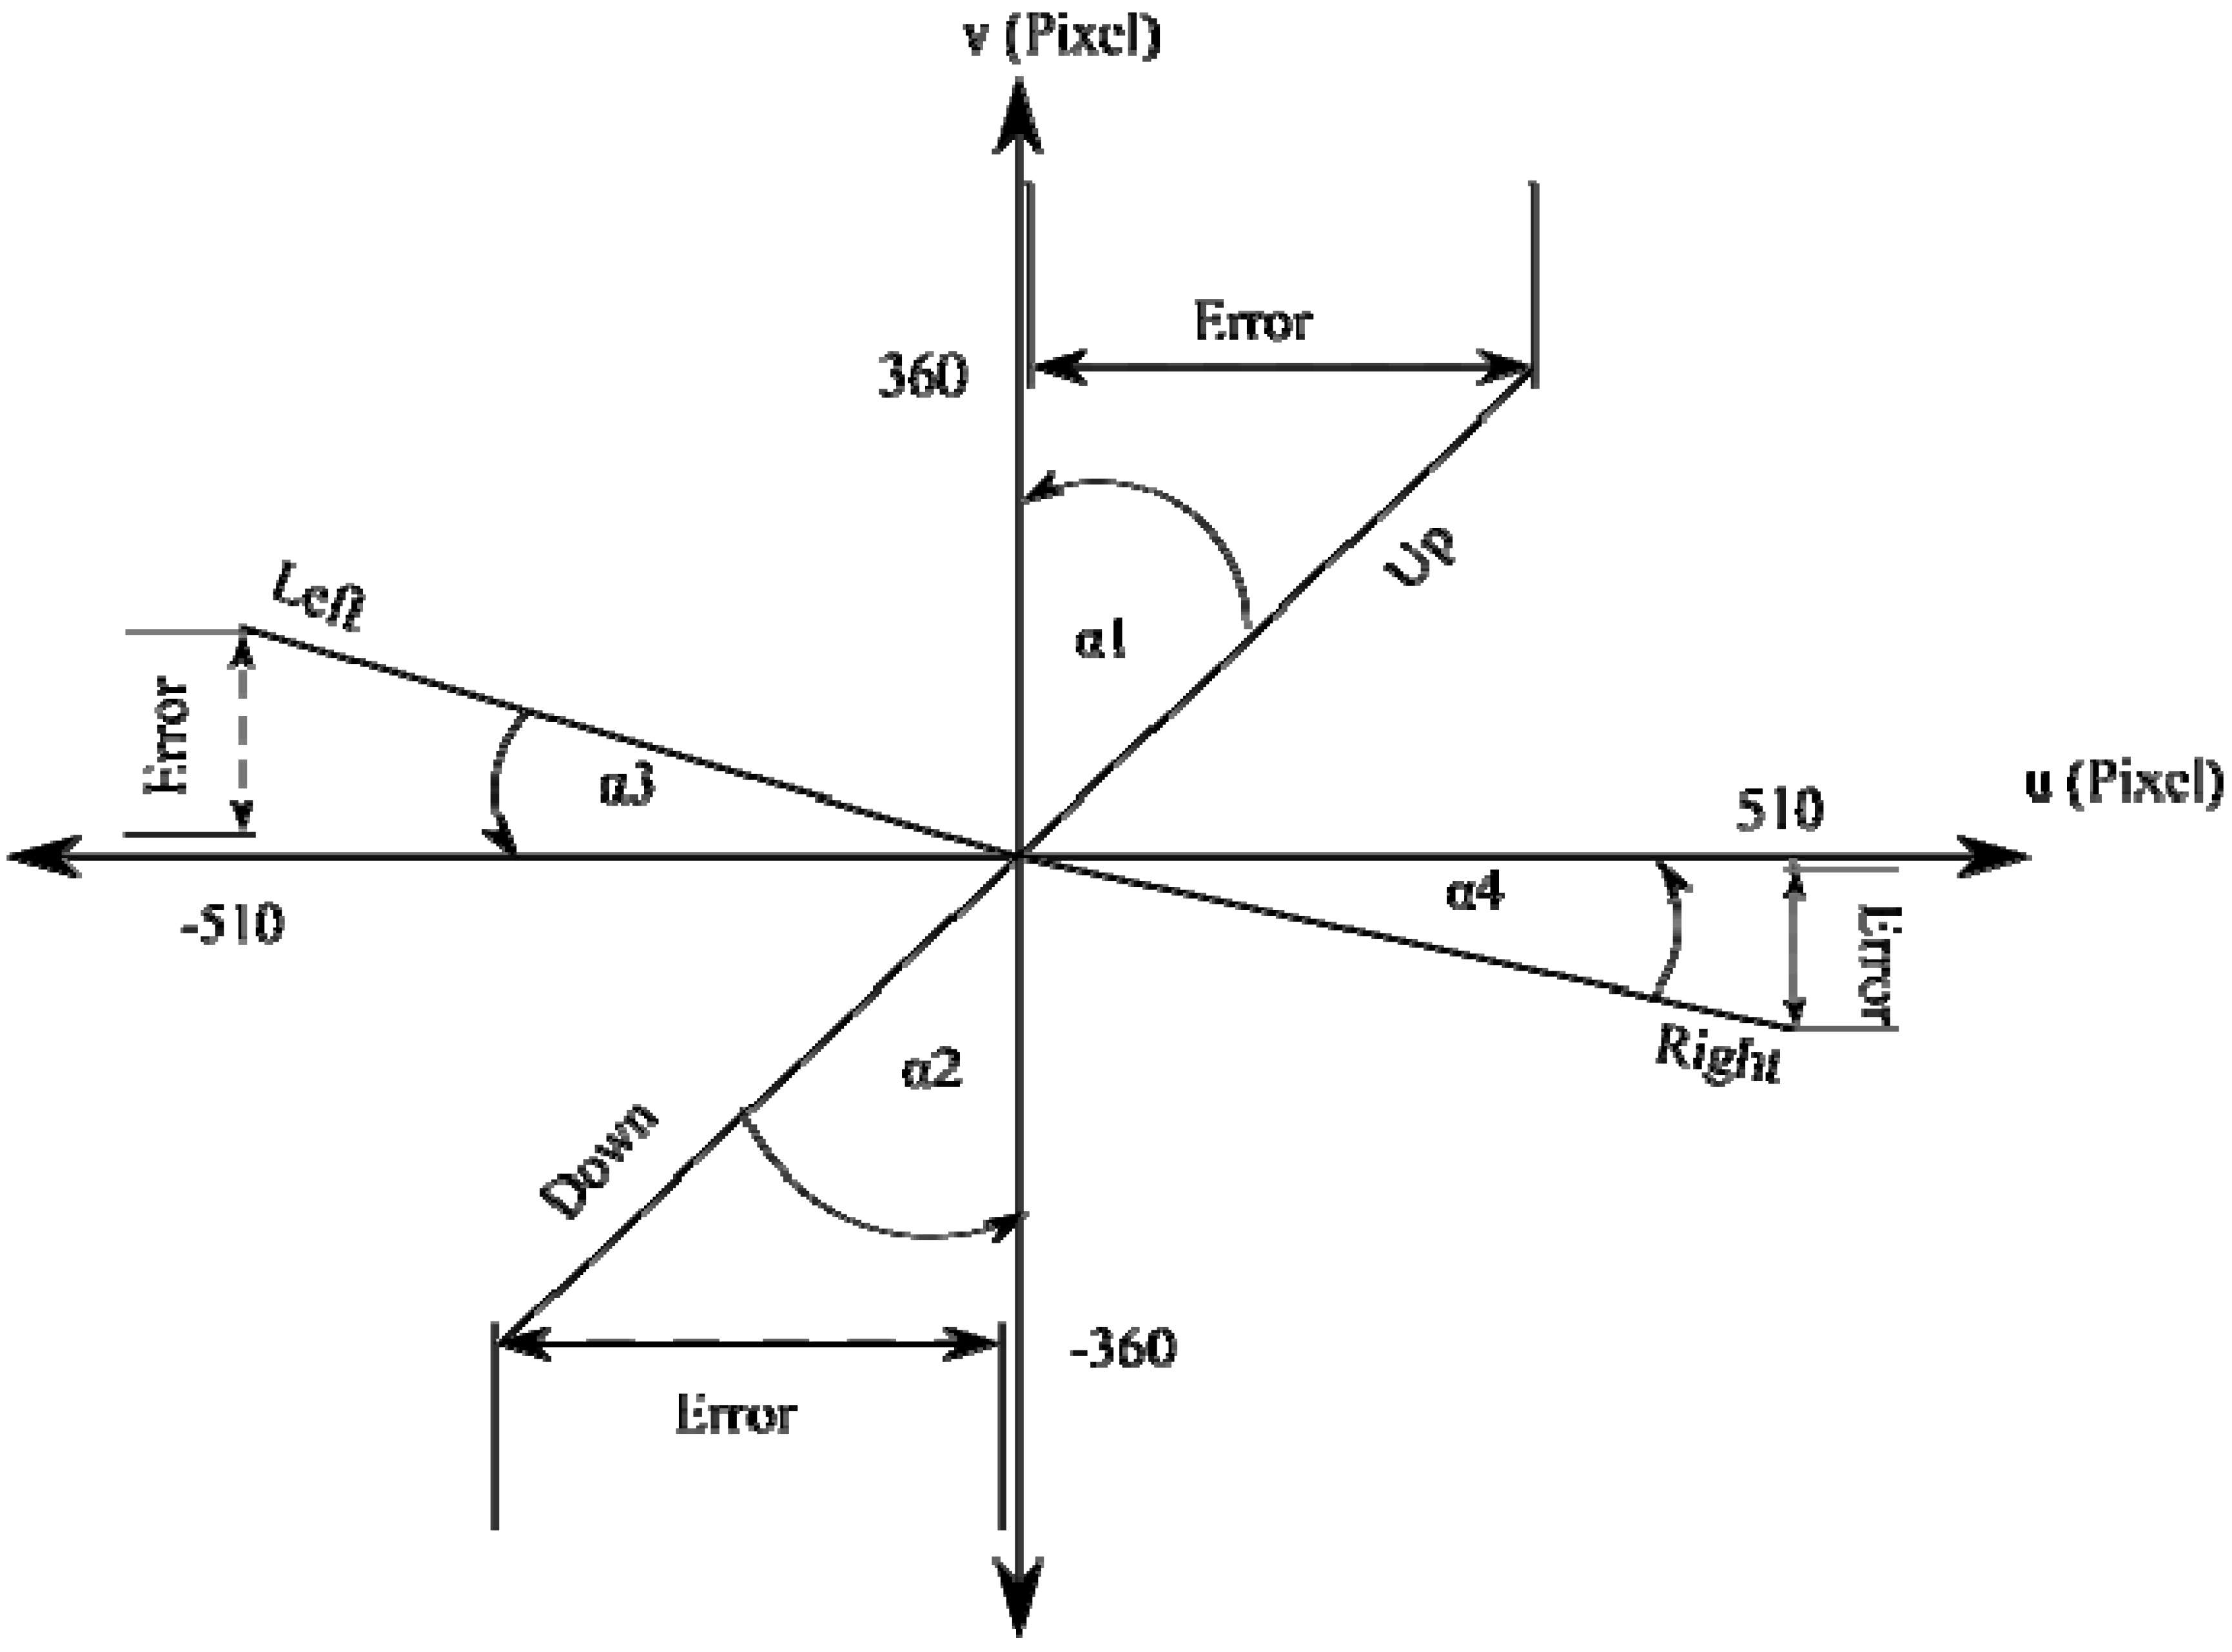
There were still some undetermined signals when the operators looked at a point. There was a signal from Ch1 that indicated down movement when the operators actually only performed a left gaze motion. Ch1 produced a negative EOG signal that indicated an up gaze motion when the operators only gazed to the right. In the vertical case, the undetermined signals came from Ch2. The offset position in the vertical axis for right and left gaze motion, as well the offset position in the horizontal axis for up and down movement were called errors.
Figure 11.
Illustration of the error pixels in the four basic gaze motion directions.
Figure 11.
Illustration of the error pixels in the four basic gaze motion directions.
The errors produced slopes between the four lines (up, down, right and left) and the axis, as shown in
Figure 11.
Table 7 shows the values of
α1,
α2,
α3 and
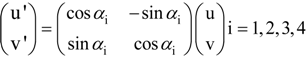
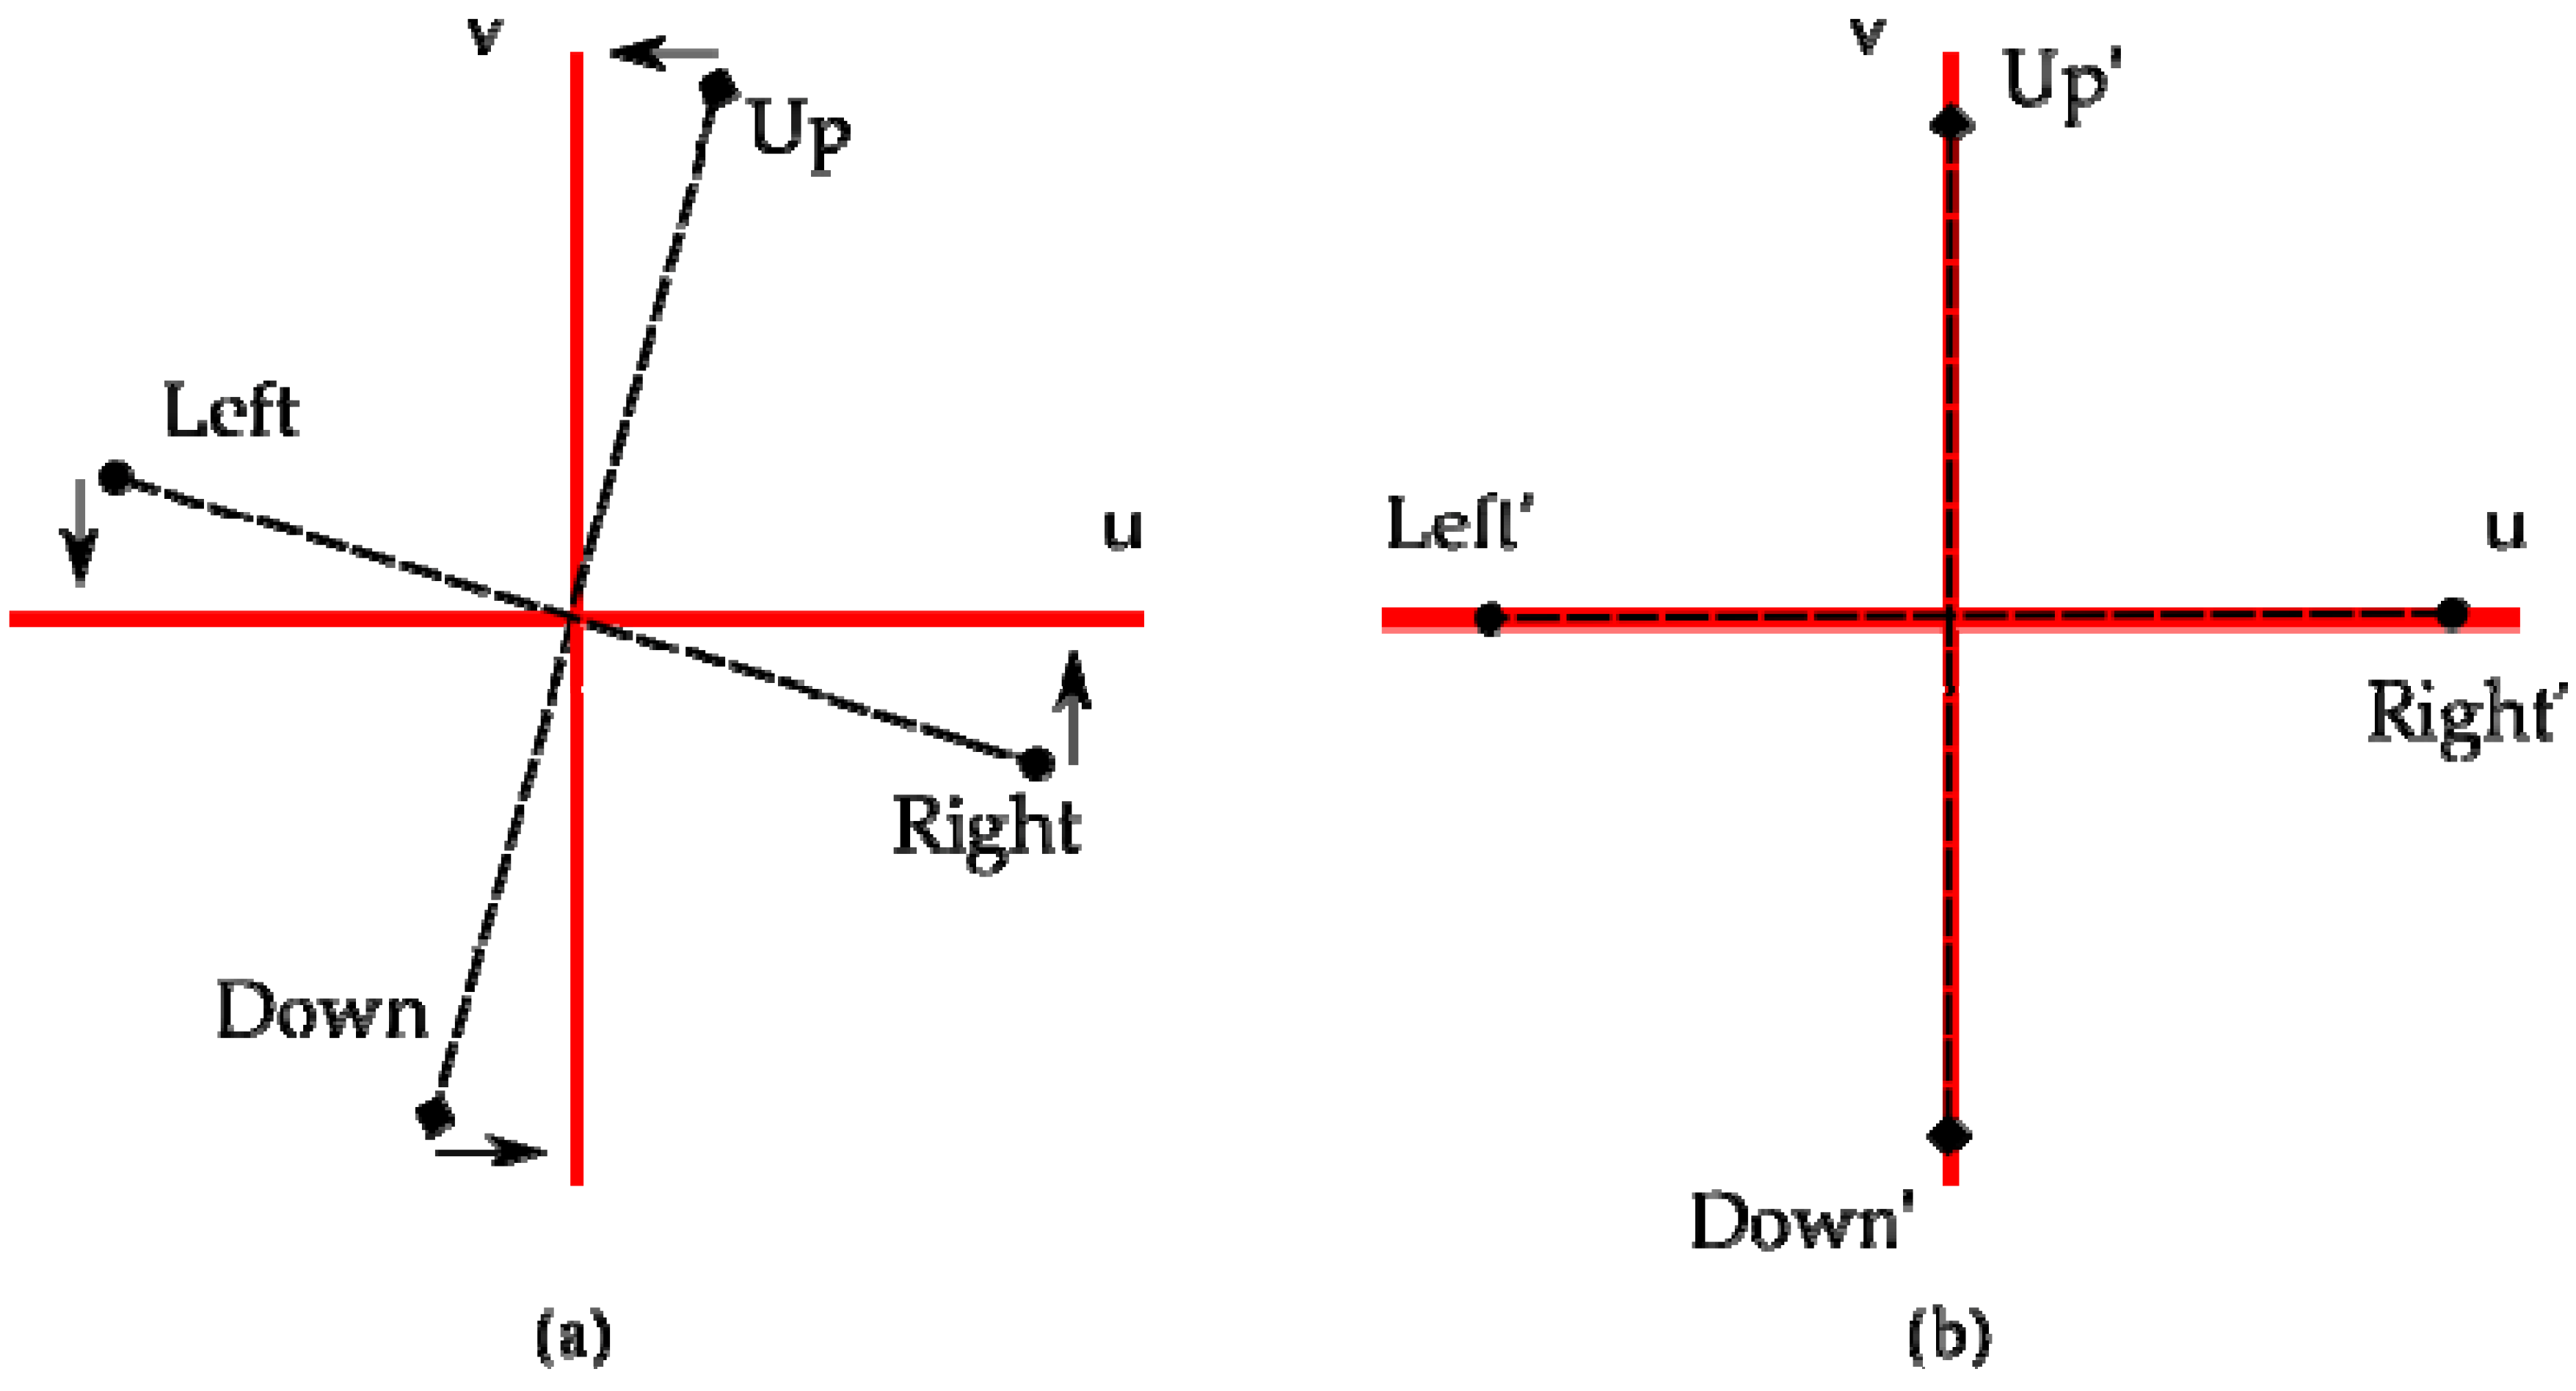
α4 from three operators. Those values varied by subject. Rotating the four lines (up, down, right and left) in a counter-clockwise direction using Equation (18) was investigated in this research. The goal was to bring the up and down line exactly on the v-axis, as well as the left and right line on the u-axis. These methods are illustrated by
Figure 12.
Table 7.
The angles of rotation matrixes for the up, down, right and left gaze motions.
Table 7.
The angles of rotation matrixes for the up, down, right and left gaze motions.
| Operator | α1 | α2 | α3 | α4 |
|---|
| 1 | 41.48° | 42.25° | 18.48° | 18.89° |
| 2 | 42.25° | 46.99° | 19.12° | 18.19° |
| 3 | 52.78° | 51.57° | 31.16° | 33.16° |
Figure 12.
The positions of pixels. (a) Before rotation process. (b) After the rotation process.
Figure 12.
The positions of pixels. (a) Before rotation process. (b) After the rotation process.
Table 8 shows some examples of average data for gaze motions from the (0, 0) pixel to the four desired positions. For the right or left gaze motion, there were some errors, especially on the v-axis, because of the signal coming from Ch1. These errors were successfully reduced by rotation matrixes from −147 pixels to 30 pixels on the right gaze motion and 255 pixels to −27 pixels on the left gaze motion. On the other hand, the errors for vertical gaze motions coming from Ch2 on the u-axis were reduced from 207 pixels to 43 pixel in the up gaze motion and from −180 pixels to −35 pixels in the down gaze motion. After the rotation process, the errors were approximately ±25 pixels (u) and ±30 pixels (v) for horizontal gaze motion. For the vertical gaze, the errors were approximately ±40 pixels (u) and ±30 pixels (v). Comparing this error to the total pixels in the horizontal (1020 pixels) and the vertical (720 pixels) directions, the errors were around 3% for the u-axis and 4% for the v-axis.
Table 8.
Pixel positions before and after rotation for some gaze motions from the (0, 0) pixel to the desired pixels.
Table 8.
Pixel positions before and after rotation for some gaze motions from the (0, 0) pixel to the desired pixels.
| | Signal | Desired Pixel | Actual Pixel before Rotation | Actual Pixel after Rotation |
|---|
| Norm_EOGch1 | Norm_EOGch2 | ud | vd | u | v | u’ | v’ |
|---|
| Right | 0.42 | 0.52 | 510° | 0° | 461° | −147° | 483° | 30° |
| Left | 0.59 | 0.53 | −510° | 0° | −476° | 255° | −530° | −27° |
| Up | 0.73 | 0.36 | 0° | 360° | 207° | 332° | 43° | 389° |
| Down | 0.69 | 0.26 | 0° | −360° | −180° | −296° | −35° | −340° |
6. Results and Discussion
A sequence of tests was already done after all parts of the rotation matrix were established. That means that the EOG part, the robot and the gaze motion distance algorithm were connected well.
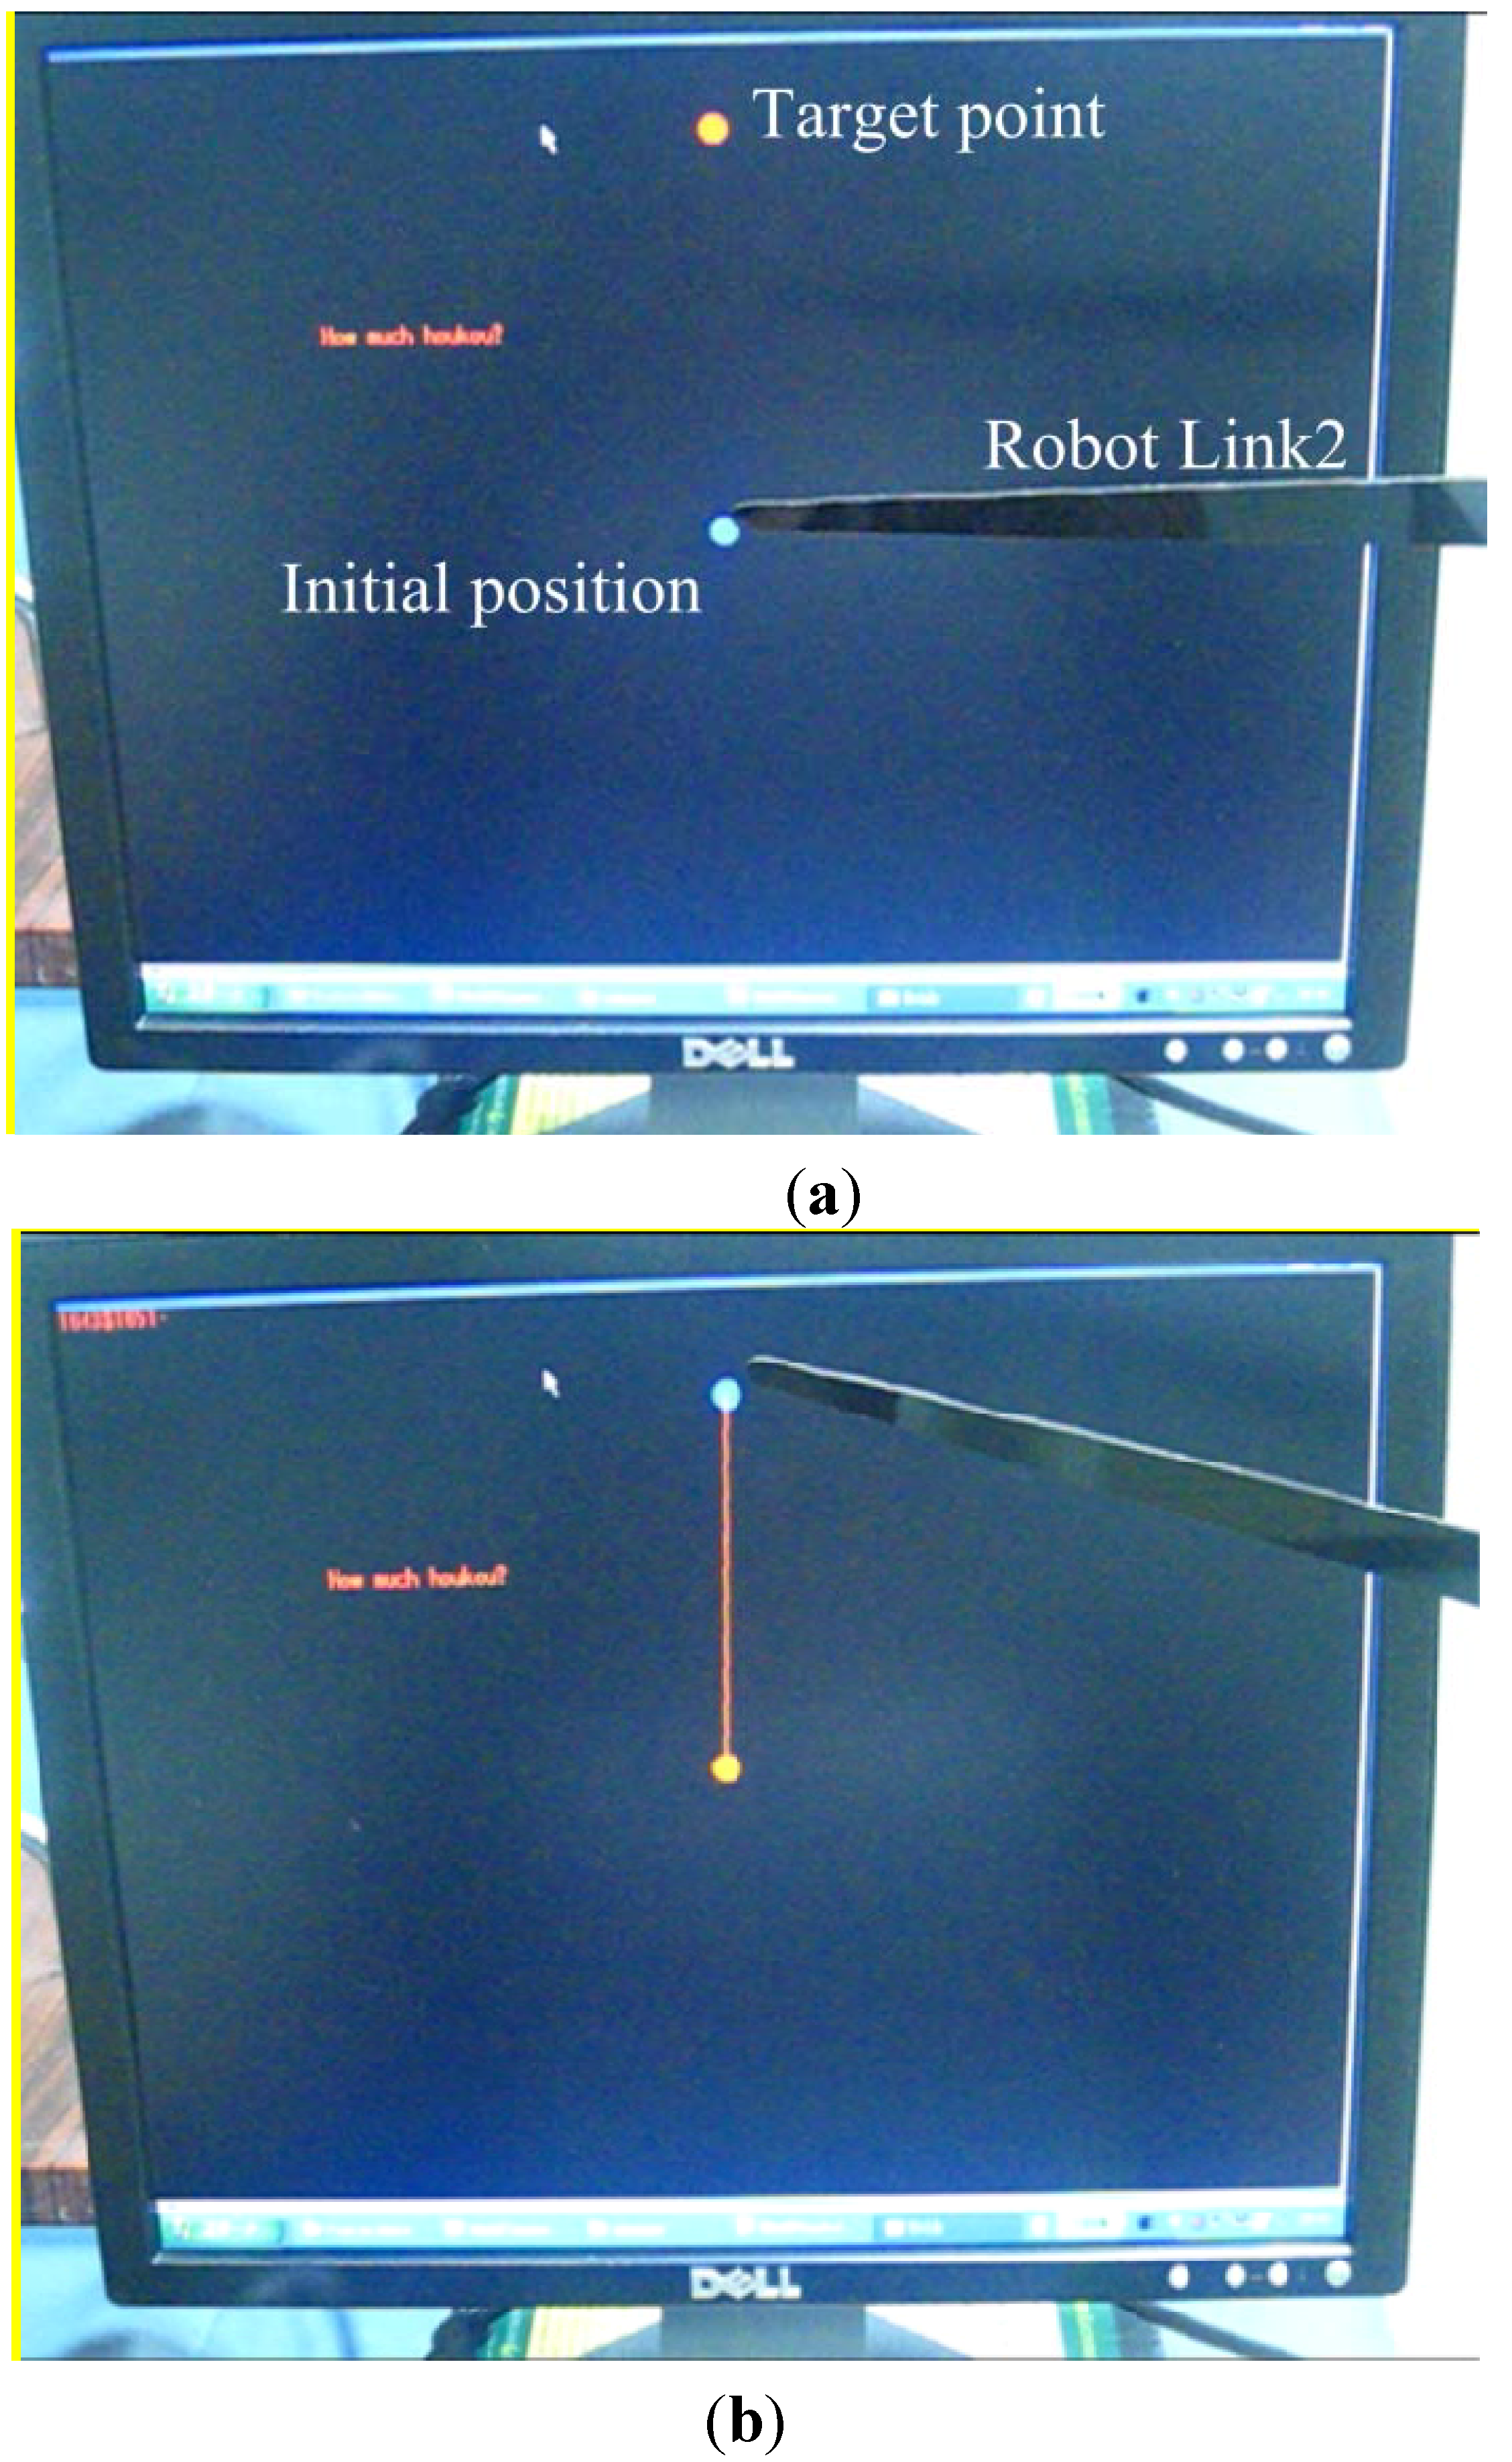
Figure 13a shows the display on the monitor when the testing process was being started. There was a piece of the robot manipulator in front of the screen, which was Link2. The blue dot was the initial eye position, and the red dot was the target point. Operators started their gaze motion from the blue dot, then moved to the red dot. This movement was tracked by the robot, as shown by
Figure 13b. At this time, the target point in the
Figure 13a became the eye position or blue dot. The red line connecting the two points illustrates the pathway of the end-effector. In this case, there were no error pixels, either on the u-axis or the v-axis.
Figure 13.
The display for testing the tracking of a 2D analog object using EOG. (a) Initial position for the end-effector of robot and the position of target. (b) The end-effector follows the gaze motion.
Figure 13.
The display for testing the tracking of a 2D analog object using EOG. (a) Initial position for the end-effector of robot and the position of target. (b) The end-effector follows the gaze motion.
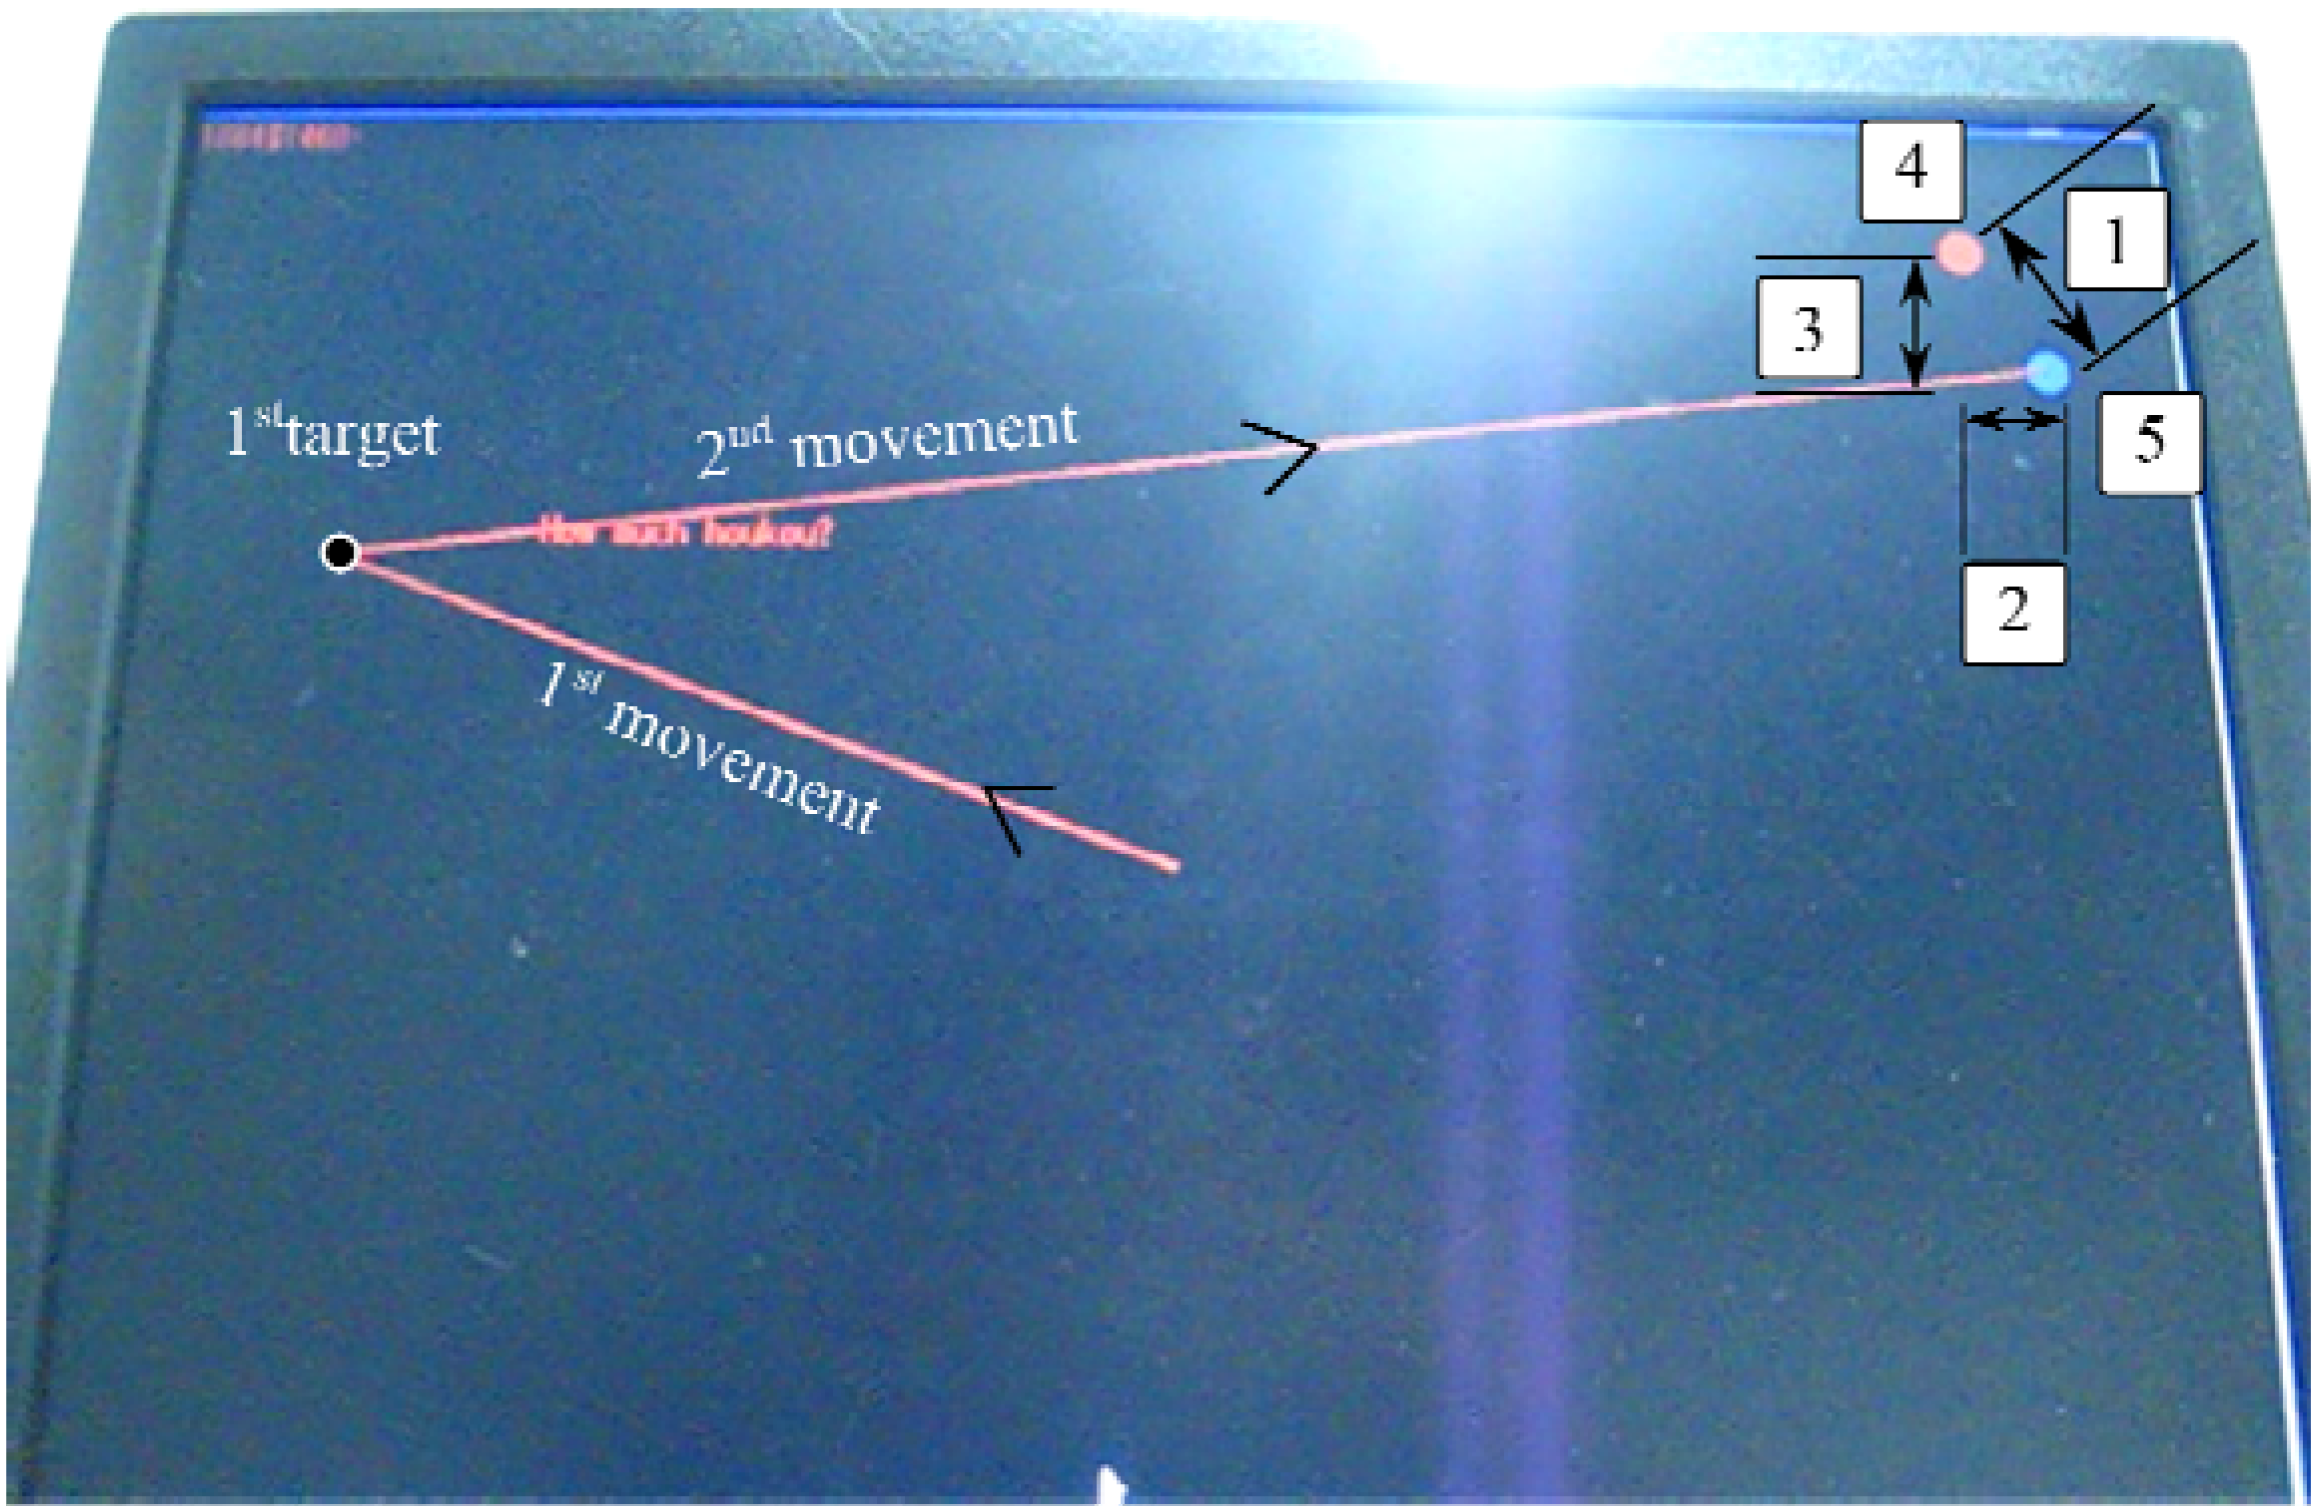
Another example of tracking points is shown in
Figure 14. There were two sequences of gaze motions in this example. The first gaze was diagonal in the left-up direction, and the second gaze motion was diagonal in the right-up direction. After the second gaze motion, the actual eye position (blue dot) was not exactly at the same position as the target point (red dot). This difference was called the . The error pixel in horizontal is calculated by Equation (19) and the error pixel in vertical was shown by Equation (20), The was the Euclidian distance between the desired pixel position and the actual pixel position. It is calculated by Equation (21).
Figure 14.
The error pixel between the desired pixel position and the actual pixel position (1 = Error_Distance, 2 = u_Error, 3 = v_Error, 4 = desired position, 5 = actual position).
Figure 14.
The error pixel between the desired pixel position and the actual pixel position (1 = Error_Distance, 2 = u_Error, 3 = v_Error, 4 = desired position, 5 = actual position).
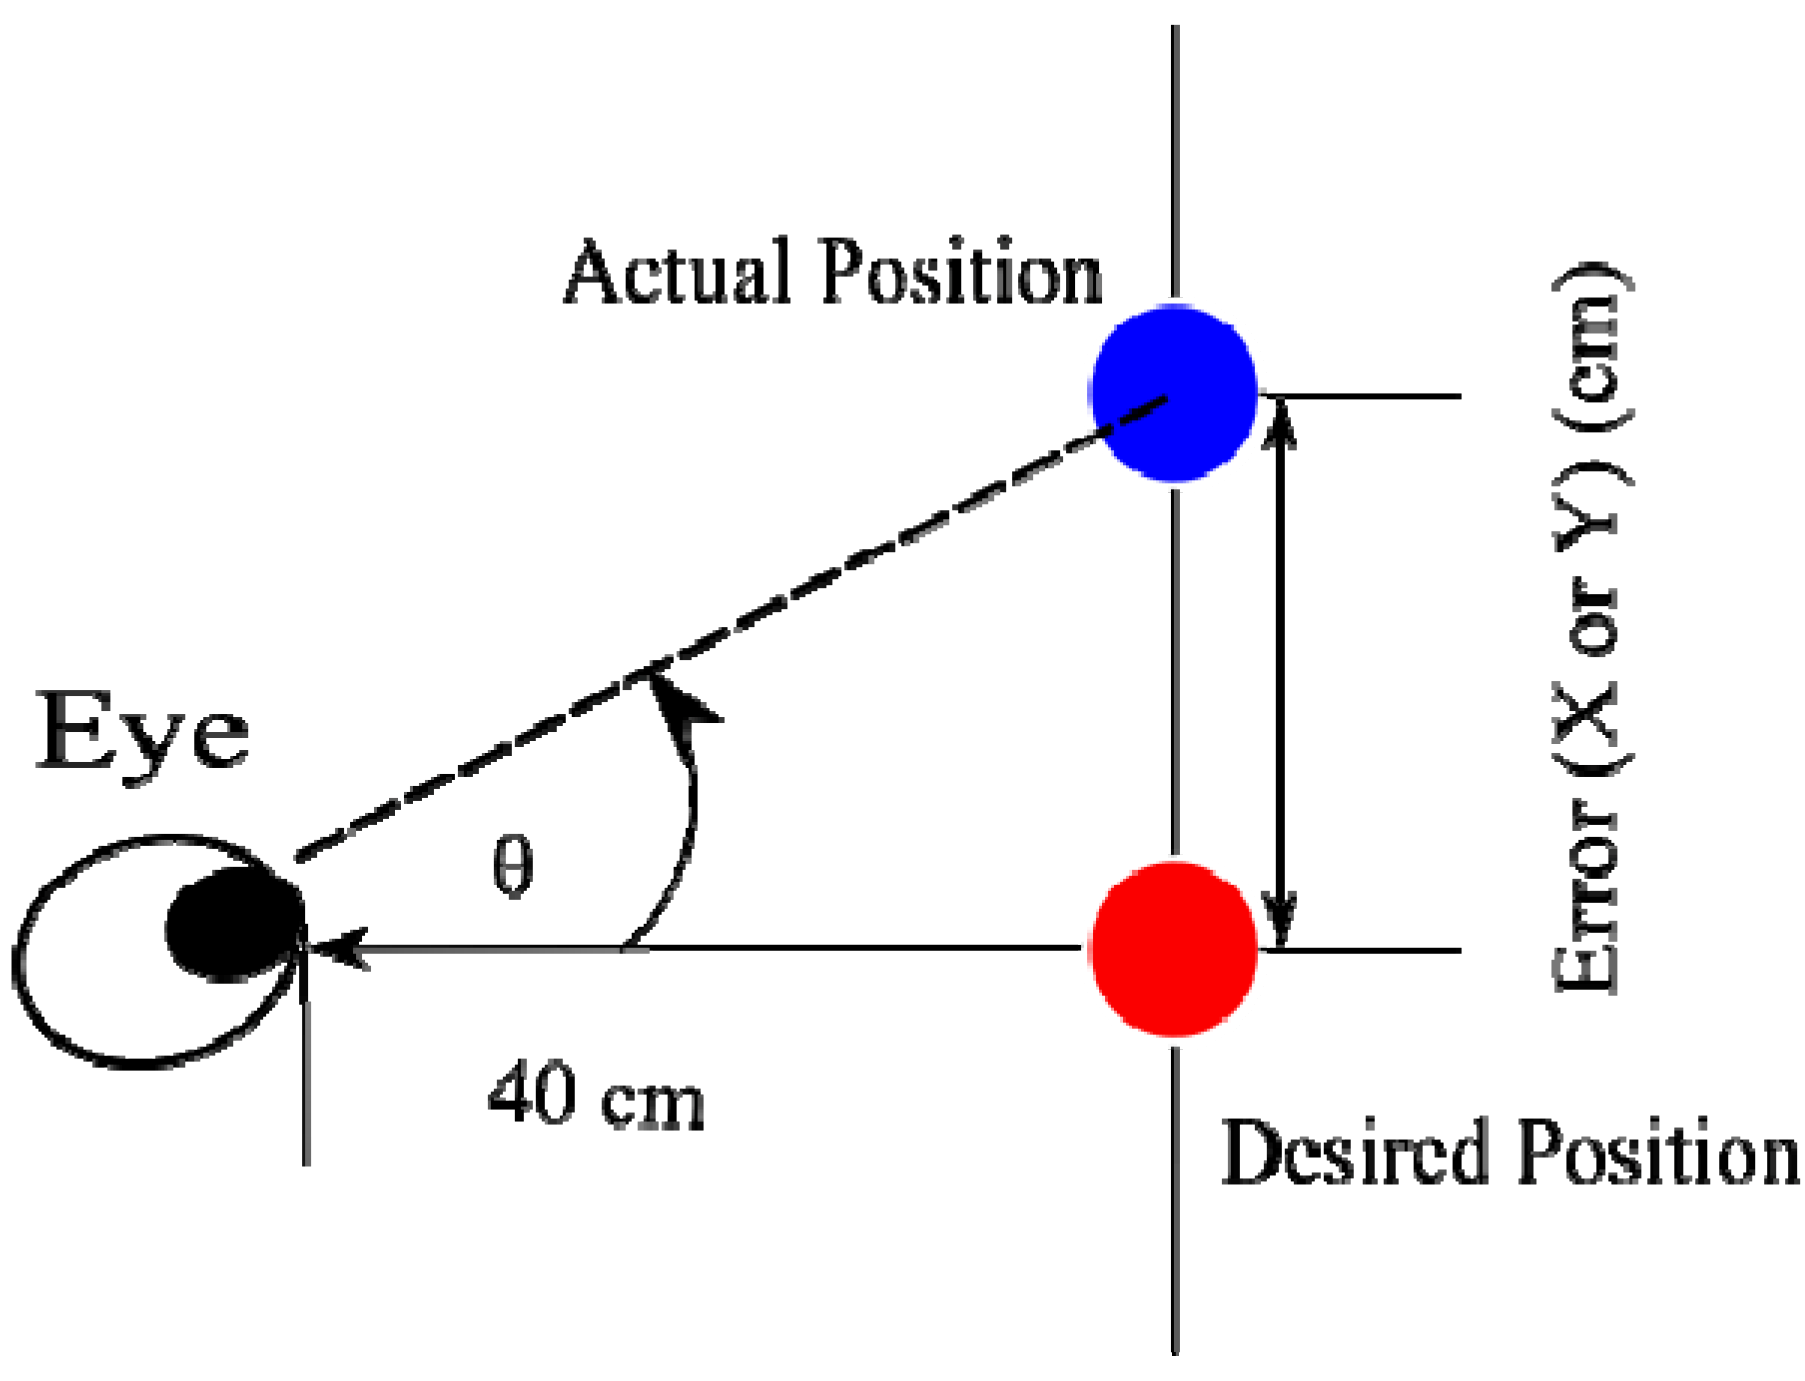
A sequence of experiments was done by three operators. Three operators gazed in total 20 times to track 20 random points. Based on (1), every pixel in the horizontal direction was equal to 0.0333 cm, since the length of the monitor was 34 cm or 1020 pixels. Calculated by Equation (2), every pixel in the vertical direction was equal to 0.0375 cm, because the monitor height was 27 cm or 720 pixels. The is given in pixels and cm, as shown by
Table 9. As long as the distance between operators and the display was 40 cm, the angle errors, as shown in
Figure 15, were also available for horizontal and vertical gaze motion. The errors in degrees are given in
Table 10.
Figure 15.
The error gaze motion in degrees.
Figure 15.
The error gaze motion in degrees.
Table 9.
Average error (mean ± standard deviation) from three operators in pixels and cm.
Table 9.
Average error (mean ± standard deviation) from three operators in pixels and cm.
| | Operator | x_error | y_error | Error_Distance |
| Pixel | 1 | 54 ± 19 | 51 ± 14 | 76 ± 17 |
| 2 | 48 ± 17 | 44 ± 23 | 69 ± 19 |
| 3 | 50 ± 18 | 48 ± 21 | 70 ± 17 |
| cm | 1 | 1.80 ± 0.65 | 1.94 ± 0.53 | 2.71 ± 0.60 |
| 2 | 1.60 ± 0.57 | 1.67 ± 0.88 | 2.44 ± 0.69 |
| 3 | 1.67 ± 0.61 | 1.68 ± 0.79 | 2.48 ± 0.64 |
Table 10.
Average error (mean ± standard deviation) from three operators in degrees..
Table 10.
Average error (mean ± standard deviation) from three operators in degrees..
| Operator | Degree |
|---|
| θx_error | θy_error |
|---|
| 1 | 2.57° ± 0.94° | 2.77° ± 0.76° |
| 2 | 2.30° ± 0.89° | 2.39° ± 1.25° |
| 3 | 2.40° ± 0.87° | 2.40° ± 1.14° |
At a glance, the average error in the u-axis was almost the same as that in the
y-axis. The average error in the u-axis was 50 pixels ± 18 pixels, and the average error in the v-axis was 47 pixels ± 20 pixels. However, there was a conversion coordinate from pixel (u, v) to robot coordinates (
x,
y) in cm. In the robot coordinates, the average maximum error pixels in the
x-axis were 2.31 cm and 2.50 cm in the
y-axis. The maximum error distances from Operators 1, 2 and 3 were 3.31 cm, 3.14 cm and 3.13 cm. Overall, the maximum average error distance was around 3.20 cm.
Table 9 gives the data for the average error in degrees. The average angle error in the horizontal direction was around 2.42° ± 0.87° and 2.52° ± 1.50° in the vertical direction. These results show that the linear EOG equations in the horizontal direction have a slightly better performance than the vertical direction. Horizontal gaze motion has a higher accuracy than vertical gaze motion. Horizontal gaze motion is slightly more stable than vertical gaze motion based on the standard deviation value.
This system successfully gives an alternative method of a tracking system using EOG. In [
17], ten random targets were tracked by three operators and the operator’s blinked their eye when the robot reached a target. Using rotation matrixes, the robot directly moved to the target when a gaze action was performed. This ability can avoid errors that occur due to the process of blinking detection. The maximum error using rotation matrixes was approximately 3.1 cm. This system was also more stable based on the standard deviation.
7. Conclusions
This test was performed with a fixed head position with a maximum angle to the horizontal axis of 46° and a maximum gaze motion in the vertical axis of 38°. An EOG system that was used to drive the two-DoF planar robot manipulator for the analog tracking of an object was developed not only for direction but also for distance. The direction was not only the vertical and horizontal axes, but also the diagonal gaze motion. There were five targets, each in a horizontal line and a vertical line, to check the similarity of the EOG in each axis. The results showed that there were no differences among the EOG potential values, as long as the gaze motions were performed in the same axis and at an equal distance.
To reduce pixel error, the rotation matrix was attached to the process based on the four basic directions. This system was tested by three operators on 20 random points. The test shows that this system successfully tracked objects indicated by the monitor display and the robot movement. The level of accuracy in the u-axis is slightly better than the v-axis, since the maximum angle error in the u-axis was 3.31° and that in the v-axis was 3.58°. This system, with good accuracy, is acceptable to be further developed. By attaching a gripper at the end-effector, the developed EOG-based robot control system could help disabled people handle materials, such as a glass, books, or to point to an object that they want to access.
Although this system could track freely moving objects with a good level of accuracy, there are still many challenges to improve it. One of them is its robustness, because EOG values are varied not only across different people, but also, each individual can produce a different EOG signal for the same gaze motion distance at two different times. These situations need to be standardized in order to develop EOG for more general applications.


 . Figure 7 shows the robot and its joint coordinates.