Abstract
This study presents an assessment scheme for haptic interaction systems based on Hamiltonian energy prediction, which contributes to procedures applied to neurorehabilitation. It focuses on robotic systems involving human participation in the control loop, where uncertainty may compromise both stability and task performance. To address this, a regression-based model is proposed to predict total mechanical energy using the robot’s position and velocity signals during active interaction. Synthetic data generated via TimeGAN are used to enhance model generalization. Advanced machine learning techniques—particularly Gradient Boosting—demonstrate outstanding accuracy, achieving an MSE of and . These results validate the use of synthetic data and passive-mode-trained models for assessing motor performance in active settings. The method is applied to a patient diagnosed with Guillain-Barré Syndrome, using the Hamiltonian function to estimate energy during interaction and objectively assess motor performance changes. The results obtained show that our proposal is of great relevance since it solves a current field of opportunity in the area.
1. Introduction
Guillain-Barré Syndrome (GBS) [1] is a severe neurological disorder that demands early and accurate detection for proper treatment. In recent years, there has been a growing interest in the application of machine learning techniques to enhance the accuracy in diagnosing and classifying the various GBS subtypes. A study conducted in 2021 focused on using clinical data from mexican patients and various classification techniques, including Random Forest and SVM classifiers, to effectively identify GBS subtypes without resorting to invasive complementary methods. Recent surveys confirm that data augmentation using generative models is a key strategy to overcome data scarcity in rehabilitation robotics [2]. This study achieved promising results, particularly in the high accuracy of Miller-Fisher subtype classification [3]. In [4], the protocol of a double-blind randomized clinical trial aimed at evaluating the efficacy of robot-assisted therapy in upper limb motor recovery in patients with GBS is presented. Another study explored 15 individual classifiers in two scenarios: classifying the four GBS subtypes and one-versus-all classification (OvA). Performance was assessed through 10-fold cross-validation, identifying the best classifiers for each case and providing valuable insights into the most effective tools for GBS classification [5]. Moreover, in a study by Hernandez Torruco et al. [6], clinical, serological, and nerve conduction test data from GBS patients were utilized to develop a predictive model. This study underscored the importance of classification techniques such as KNN and SVM in identifying GBS subtypes with high accuracy. Research reported in [7] focused on validating a model in an international cohort, with a particular focus on improving regional specificity and providing valuable insights into GBS prognosis. The application of sampling techniques and the use of multiple classifiers, such as SVM and C45 [8], or the study of segmented linear regression methods, has demonstrated a statistically significant relationship between GBS cases and the presence of arboviruses [9], a topic associated with the ecology and vulnerability to dengue and Zika viruses in Mexico. These studies represent significant advancements in the application of machine learning techniques and data analysis for the diagnosis, classification, and prediction of Guillain-Barré Syndrome. They contribute to the current knowledge of this neurological disease, offering valuable tools to improve early detection and patient treatment. In this work, we aim to establish a prediction model and conduct a comparative study of three methods (linear regression, random forest, and artificial neural networks) to provide an objective metric for GBS treatment using a human–robot physical interaction system (HRpI). For this purpose, we employ haptic devices based on impedance and butler-type models [10], featuring six degrees of freedom for applying motion patterns associated with clinical protocols. The purpose is to verify, through energy, the level of training in patients with motor limitation. The energy in question refers to the total mechanical energy of the system, which consists of both kinetic energy (related to the motion of the robot) and potential energy (associated with the position of the robot’s joints). The relationship between energy and training lies in the fact that, as the patient improves their motor control and ability to guide the robot during tasks, the total energy required by the system decreases. This reduction in energy serves as an objective measure of the patient’s progress, aligning with findings where metrics like metabolic cost are used to quantify user adaptation, validating that optimized robotic assistance reduces physical effort [11,12,13]. The foundational haptic interface is described in [10]; our work builds upon it by introducing the novel computational framework for energy prediction and synthetic data generation detailed herein. These findings highlight the limitations of traditional clinical approaches and protocols, which often involve subjectivity in diagnosis and present uncertainty in treatment [14]. In this context, we advocate for the use of human–robot physical interaction systems, which enable not only objective measurement of a patient’s progress but also adjustment of the rehabilitation task according to their performance. The proposal is based on the use of guided haptic interfaces, employing a specific clinical protocol (PDMS-2) as the foundation for interaction. To address the necessary variability and adaptability, an intelligent control system is implemented, supported by second-generation artificial neural networks, wavelet transforms, and IIR filters [15]. The article presents two haptic interaction approaches, one for exploration and another for guidance, both designed to enhance hand-eye coordination in the neurorehabilitation process. This work significantly extends our prior research [16] by addressing data scarcity and improving prediction accuracy. The key contributions are: the novel application of a customized TimeGAN architecture to generate physically coherent synthetic trajectories for neurorehabilitation [17,18], and the validation of superior predictive models, for energy estimation.
2. Human–Robot Physical Interaction Systems in Neurorehabilitation Procedures
2.1. HRpI System Based on Haptic Interaction
Consider a HRpI system equipped with one haptic robotic device, one per left and right hand, that exhibits a high-end electromechanical performance, such as low friction, backdrivability and low inertia, with a high bandwidth to display force, whose nonlinear dynamic model is [15]
where is used to indicate left l or right r haptic device, are the generalized position and velocity joint coordinates, respectively; denotes a symmetric positive definite inertial matrix, represents the Coriolis and centripetal forces, models the gravity loads from earth gravitation field, and stands for the torque input. Term stands for joint friction, where are positive definite matrices modelling viscous damping and the dry friction respectively and its coefficient . When the human operator is grasping the haptic device through placing its fingertip into its thimble, the dynamics changes remarkably due to human exerts a human torque into the haptic robotic device:
2.2. Problem Statement and Proposed Solution
In robotic guidance tasks aimed at training or kinesthetic stimulation of the upper limb, nonlinear control strategies for robots have been proposed [19,20], taking into account the human operator’s dynamics within the control loop. In the case of robot-assisted physiotherapy applications, convergence criteria in motion (operational position and velocity) associated with the clinical protocol are considered to assess performance, and establish a diagnostic criterion related to physical disability in the upper limb, or resulting from a cerebrovascular accident. A performance index based on the extended error (position and velocity errors) is considered when robust control is employed in the tracking task [15]. Under these conditions, the information derived from the interaction between the patient and the robot or haptic device is insufficient as a diagnostic metric. Therefore, the total energy that the robotic system expends to stabilize the user along the protocol trajectory is considered an appropriate metric to describe the level of motor training. The total energy model representing the human–robot interaction system in closed-loop with a control scheme is established as follows [21]:
where represents the total energy function, dependent on the kinetic energy , and the potential energy . The time series associated with the energy predominantly exhibits positive instantaneous values, particularly within the motion planning region. Zero crossings are associated with movements occurring below the work plane and are generally evident during the exploration task, when the human operator interacts voluntarily with the virtual environment. When operating under passive haptic guidance (i.e., motion control involving the human in the loop), the total energy H demanded by the robot during training tends to decrease as the human operator’s performance enhances. While the kinetic energy remains positive definite, variations in potential energy can cause H to change sign. Hence, the root mean square (RMS) of H is considered to characterize the training trend (). Consider that operates on the interval , the initial energy condition in training is , always in the vicinity of . In this sense, we say that a neurorehabilitation condition is established, as a consequence of the training, if . Equation (3) provides a means to directly compute the Hamiltonian H; nevertheless, this is only applicable under passive conditions, where every external and internal force acting on the system is measurable. Under active conditions, the voluntary contribution of the patient introduces an unobservable human torque (), which makes direct computation infeasible. Accordingly, our method involves training a regression model on data collected in passive mode to capture the deterministic physical mapping between kinematic parameters—position and velocity—and the system’s energy. The trained model can then predict the energy signature of the patient’s voluntary movements in active mode, serving as a robust proxy for motor performance. The exceptionally high accuracy () achieved is expected, as the model is approximating this underlying, deterministic physical function. A prediction model for total energy, based on joint position and velocity, is therefore proposed. The overall framework of the proposed approach is illustrated in Figure 1.
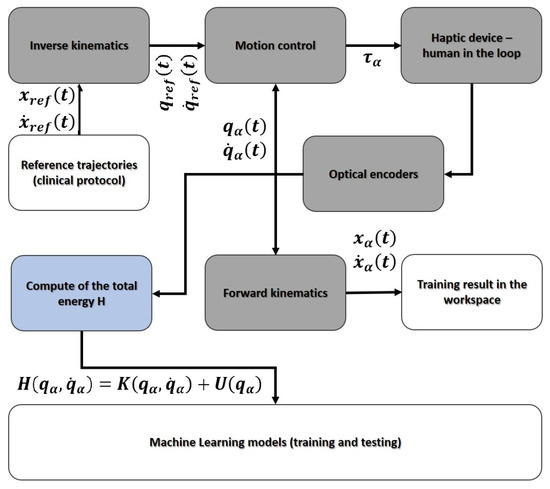
Figure 1.
Framework for obtaining the prediction model for total energy based on machine learning.
2.3. Haptic and Virtual Stimulation
The biofeedback used, based on a Human–Robot Physical Interaction System (HRpI), to establish kinesthetic and visual stimulation on the human (patient), considers two haptic devices with 6 degrees of freedom in a cooperative configuration, linked with plugins and scripts in Unity 3D, which allows representing the behavior of the end effectors of both haptic devices (right and left) in a virtual reality environment (Figure 2).
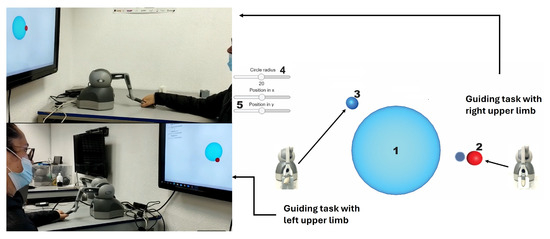
Figure 2.
HRpI cooperative system for training and neurorehabilitation.
The haptic device (Geomagic Touch [10]) is a mechanism of joined links, with low inertial dynamics and low joint friction; which allows easy manipulation and perception of forces associated with the interaction that the patient has with the virtual reality environment (calculated in real time from position and velocity). The reference trajectories (position and velocity) are defined by the geometric locus of a circle (clinical protocol), the parametric equations in the cartesian space of the robot are described as: xref(t) = h + r cos, yref(t) = k + r sin, , and ; where, C(h, k) represents the center at the origin and r = 0.06 m the radius (points 4 and 5 in the Figure 2 represent the modification of these geometric parameters in real time). To compute the inverse kinematics of position and velocity, the models described in [10] are used.
2.4. Description of the Experimental Task
The haptic interface operates in two modes: (i) active haptic exploration (active mode) and, (ii) passive haptic guidance (passive mode). In active mode, the task is controlled by the patient, the haptic device is used only as an instrumentation device. Phases 1 and 3 are defined in this mode with the purpose of identifying if a training condition was established. In passive mode, motion control is carried out by the robot, who guides the patient in the reference trajectory. In both cases there is visual stimulation.
- Active mode 1: the patient’s first experience in the solution of the trajectory. Position and velocity reading for energy model training.
- Passive mode: the patient is guided in the trajectory with the haptic device as a robot, who corrects the patient. In this case learning and training are established. Position and velocity are instrumented to compute the energy required by the robot.
- Active mode 2: the last phase allows the learning and training to be verified and is comparable with the preliminary result obtained in phase 1.
The reported performance and subsequent analysis are based on a complete experimental protocol for a single patient diagnosed with Guillain-Barré Syndrome. The protocol consisted of 5 trials for each of the three experimental phases (Active 1, Passive, and Active 2), performed with both the left and right upper limbs. In each case, position and velocity instrumentation is performed at a sampling time of 1 ms. The time series are stored in matrix arrays. for position and for velocity, arrangements from regular samples . y are position and velocity on time . In each phase, tests are carried out with both upper limbs. Considering n time intervals in each trial and m repetitions, the total amount of data captured for position and velocity is given by the formula nm, where the factor of 2 accounts for the separate position and velocity data streams. Giving a total of 28,000 observations to process the training. The total amount of data obtained is determined by the number of time intervals, the number of repetitions and the alternation between hands. This data will form the basis for further analysis and development of machine learning models.
3. Synthetic Data Generation
Synthetic data were generated corresponding to the active mode of the human–robot system, in which the patient controls the movement of the haptic device [16]. The original data are represented as:
where:
- : is a multivariate sample of position and velocity at time t.
These samples were recorded during 5 exercises for each combination of hand and configuration (active 1 or active 2), resulting in a total of 20 independent training sets. Several variants of generative adversarial networks (GANs), such as DCGAN or WGAN, were initially considered. However, since these approaches do not explicitly incorporate temporal dependencies in their architecture, they presented limitations when generating trajectories with physically coherent continuity [22,23]. Consequently, the TimeGAN model was adopted due to its ability to preserve the temporal dynamics of the data through a hybrid supervised and adversarial architecture, with specific adaptations oriented toward the domain of human–robot movement [24].
3.1. TimeGAN Architecture
The TimeGAN model aims to generate synthetic time series that preserve both statistical and temporal coherence through five modules that encode and reconstruct sequences: Embedder (E), Recovery (R), Generator (G), Supervisor (S) and Discriminator (D). Its training relies on a composite loss function where each component serves a specific role: ensures reconstruction fidelity, drives realism, enforces temporal smoothness, maintains the biomechanical relationship between position and velocity, and prevents mode collapse by encouraging variety:
- Reconstruction (): evaluates the fidelity between the original data and its reconstruction from the encoded feature space.where
- –
- T is the sequence length,
- –
- is the reconstruction generated by the autoencoder.
- Temporal Consistency (): ensures that the sequence evolution follows a coherent dynamic.
- Physical Consistency (): imposes constraints that respect biomechanical relationships of the movement.where
- –
- X denotes real data,
- –
- enotes generated data,
- –
- is a physical transformation applied to the trajectories.
- Diversity (): penalizes the generation of redundant or overly similar trajectories.where
- –
- K is the number of generated trajectories,
- –
- is a similarity measure between sequences. In our implementation, we used Pearson correlation, which is computationally efficient and effectively captures the linear relationships between the temporal profiles of the generated trajectories.
- Sup (): forces the supervisor to correctly predict the transition in the encoded feature space.where
- –
- S is the supervisor module,
- –
- is encoded representation at time t.
- –
- is the prediction for the next time step.
- Adversarial (): trains the generator to deceive the discriminator, corresponding to adversarial training.where
- –
- The generator attempts to produce encoded representations that are indistinguishable from the real ones , from the perspective of the discriminator D.
Finally, the total generator loss function is defined as:
3.2. Training Strategy
The training process was conducted in three phases:
- Autoencoder pre-training (): optimizing , , and jointly.
- Supervised training of the supervisor (S): applying to learn the temporal dynamics in the encoded feature space.
- Joint adversarial training (): using the adversarial loss along with the other components to preserve both fidelity and realism.
Although the general structure is based on the architecture proposed by Yoon et al. [24], several modifications were introduced to adapt it to human–robot interaction data. The main variations include:
- Inclusion of physical consistency loss (), diversity loss () and temporal loss also within the autoencoder, reinforcing continuity at multiple levels.
- Updating the autoencoder throughout the entire training process, not only during the initial phase, to maintain representation quality.
For each of the 20 real-world active trajectories (one for each unique combination of exercise, hand, and active condition), the trained TimeGAN model generated nine new synthetic trajectories:
This resulted in a 9:1 ratio of synthetic to real data for each specific condition, yielding 180 synthetic trajectories in total. This approach allowed for a significant increase in the volume of training data for subsequent modeling phases while ensuring that the generated data was highly specific to the patterns of the original seed trajectory.
4. Training and Comparison of Prediction Models
4.1. Models
To evaluate the impact of the generated synthetic dataset, five prediction models were trained and compared to estimate the energy value H from the observations x. These models were trained exclusively using data from the passive mode, in which the device movement is guided by the robot rather than the patient, also distinguishing between the left and right hand. Three models previously used in the prior study [16] were included: Random Forest (RF), Artificial Neural Networks (ANN) and Linear Regression (LR). Additionally, two boosting-based techniques were incorporated.
4.1.1. Gradient Boosting (GB)
Gradient Boosting is an ensemble algorithm that fits decision trees on residual errors to progressively improve prediction. Each tree is trained to correct the errors of the previous ensemble, with a learning rate that regulates its impact [25]. In the context of this study, where the input variables are position and velocity , the model predicts the scalar energy value as:
where is the concatenation of the position and velocity vectors at time i. This representation allows the model to capture non-linear relationships between the physical features and the energy feature space.
4.1.2. HistGradientBoosting Regressor (HGB)
HistGradientBoosting is an optimized implementation of the boosting algorithm that discretizes the input variables using histograms before building the trees [25]. This technique improves training speed without sacrificing accuracy.
where is the ensemble of trees trained on the concatenated representation . The models were evaluated using the same standard metrics adopted in the previous study [16], namely the Mean Squared Error (MSE) and the Coefficient of Determination (), defined identically as:
4.2. Prediction of H in Real and Synthetic Active Data with Comparison
The predictive models, trained on passive-mode data for each hand, were applied to estimate the energy value H from both real and synthetic active trajectories. This step assessed whether TimeGAN-generated data preserved the dynamic relationships required for accurate energy prediction. For each condition (Active 1 and Active 2), the concatenated input vectors were used to compute: Real Active Data: and Synthetic Active Data: . Here, denotes the trained regression model. Comparing both predictions enabled evaluation of the structural and functional fidelity of the synthetic sequences and their usefulness for model training and validation.
5. Experimental Results
5.1. Evaluation of Generated Synthetic Data
The experimental platform employed to evaluate the case study is presented in the video provided as Supplementary Material. The setup comprises two haptic interfaces, each dedicated to one upper limb, enabling bilateral kinesthetic force feedback, and a virtual reality environment that provides visual stimuli to characterize user performance during the execution of the clinical protocol. Nine synthetic trajectories were generated for each exercise–hand–condition combination (180 total). Figure 3 shows Active 2, right hand, Exercise 4 (9 samples). The average correlation with real data was 0.881 and the diversity 0.674. Synthetic trajectories retained structural coherence and realistic velocity profiles; the slightly noisier velocity is typical of generative models and did not harm downstream prediction.
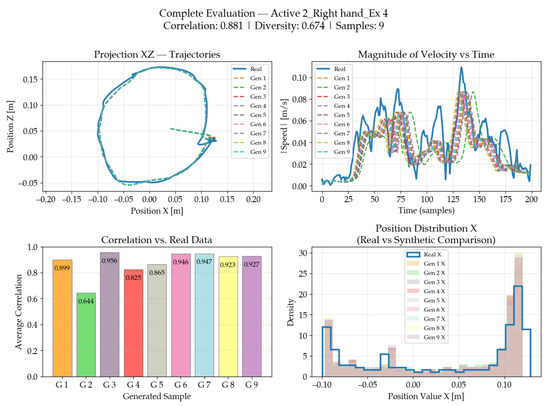
Figure 3.
Comparison of results (synthetic vs. real) for a specific exercise.
Additionally, by averaging the results across all 20 combinations of exercise, active condition, and side, the following aggregate metrics were obtained, as shown in Figure 4.
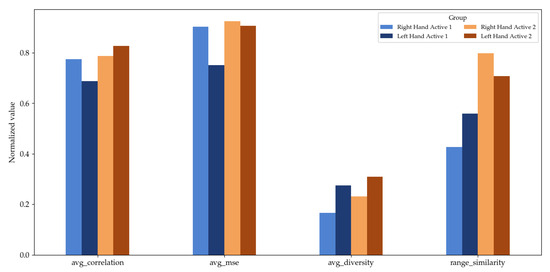
Figure 4.
Comparison of average metrics by group.
The best overall results were observed in the Active 2, left-hand group, which achieved the highest correlation and diversity, and the second-best rank similarity.
5.2. Comparison of Supervised Models for Predicting H
The results in terms of mean squared error (MSE) and coefficient of determination (R2) are summarized in Table 1.

Table 1.
Comparison of supervised models for both hands (RH = Right Hand, LH = Left Hand).
As shown, Gradient Boosting achieved the best overall performance for both left and right hands, slightly outperforming Random Forest.
5.3. Real vs. Synthetic Comparison in H Prediction
Using the best supervised model, the energy value H was predicted on the generated synthetic trajectories. Figure 5 compares the predicted energy values for real and synthetic data across the different active conditions and both sides. The following observations were made:
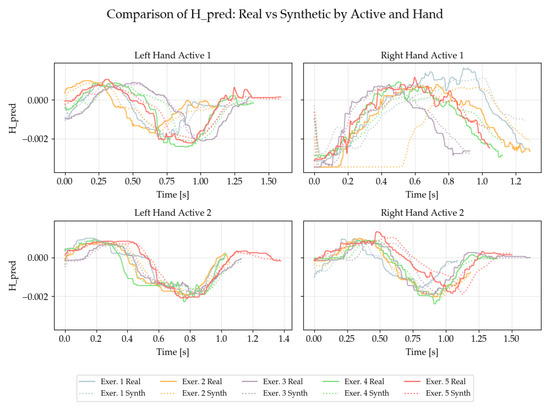
Figure 5.
Predicted energy value (real vs. synthetic).
- General agreement in the shape of the energy curves.
- Preservation of energy peaks and temporal patterns.
- Minimal errors between both predictions, validating the functional fidelity of the synthetic data.
A Principal Component Analysis (PCA) was applied to the H predictions from both real and synthetic data. Figure 6 each subplot shows the projected distribution onto the first two principal components for a specific combination of active condition (1 or 2) and side (left or right):
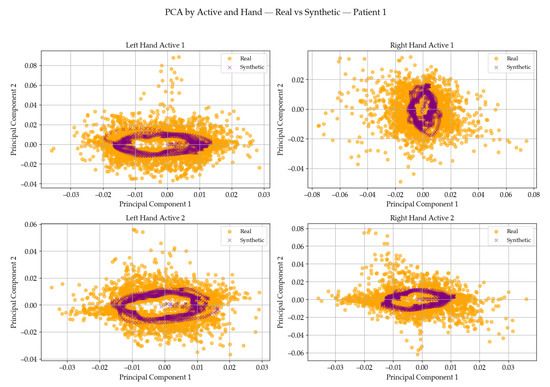
Figure 6.
PCA of predicted H for real and synthetic data.
- Dense clustering of real data points (in purple), clearly differentiated yet overlapping with synthetic data points (in orange), indicating strong structural similarity.
- Despite greater variability and spread, synthetic trajectories envelop the real data cloud, suggesting good replication of the underlying energy behavior.
- Active 1 Right: shows the best overlap between real and synthetic trajectories with aligned elliptical shapes, indicating high structural fidelity of the generative and predictive models.
- Active 2 Left: although more dispersed, synthetic data retains overall shape coherence with real data, demonstrating consistent robustness in the prediction of H.
To quantify rehabilitation progress, the root mean square of the predicted Hamiltonian energy () was compared between active phases. A decrease from Active 1 to Active 2 indicates improved motor efficiency. As shown in Table 2, the patient demonstrated a notable improvement after the robotic intervention, especially with the right hand, where the average across exercises decreased by approximately 30%. These data are consistent with the findings previously reported in [16].
Table 2.
Average values for Active 1 and Active 2 phases (RH = Right Hand, LH = Left Hand).
5.4. Limitations
This study is based on data from a single patient, which limits the generalizability of the findings. The analysis was performed offline, so the end-to-end latency for real-time biofeedback was not measured. Furthermore, the model’s performance was evaluated at a fixed 1 kHz sampling rate; its robustness to different rates remains to be investigated.
6. Conclusions
Diagnosing patients with motor impairments due to neurological injury is made possible through technologies that assess fine and gross motor skills under structured clinical protocols. A passive haptic guidance system is particularly valuable in establishing neurorehabilitation conditions and enabling real-time diagnosis. In this context, the total energy required by a robot during training and the energy exerted by a patient during a rehabilitation task offer a meaningful metric to evaluate performance from a patient-centered perspective.
This study proposes a regression-based approach for predicting total mechanical energy based solely on position and velocity signals from a human–robot interaction system (HRpI). The Hamiltonian function is used to model the system’s energy behavior, providing insights into the patient’s motor ability and training progress. By comparing training data (passive guidance) and voluntary interaction (active phases), the model assesses the patient’s effort and recovery.
Synthetic data generated via TimeGAN was used to augment training sets, enabling more robust and generalizable machine learning models. Three models—Linear Regression, Random Forest, and Artificial Neural Network—were initially tested and compared using mean squared error (MSE) and coefficient of determination () as evaluation metrics. Based on these results, advanced ensemble models such as Gradient Boosting and HistGradientBoosting were selected, demonstrating superior performance with minimal error () and excellent predictive power () on both real and synthetic datasets.
The generated synthetic trajectories showed high correlation with real ones (average correlation ), good inter-sample diversity, and preserved temporal dynamics. PCA analysis confirmed that synthetic data replicates the structure of real data in the energy feature space. Notably, subjects in Active Phase 2 displayed greater similarity to real measurements and lower prediction errors, suggesting measurable improvement following robotic intervention.
Clinically, this energy prediction model provides therapists with an objective way to monitor rehabilitation progress, personalize robotic assistance based on patient effort, and identify performance plateaus that require timely adjustments.
In conclusion, this study validates the use of supervised models trained on passive-mode data for accurately predicting Hamiltonian energy, even in active rehabilitation scenarios. The integration of synthetic data and ensemble learning techniques enables reliable, real-time energy diagnostics in haptic systems, paving the way for adaptive, patient-specific neurorehabilitation strategies—particularly in the early treatment of conditions such as Guillain–Barré Syndrome.
Supplementary Materials
The experimental platform, and the case study cited in this work, is presented in a video as supplementary material to this article, at: https://youtu.be/IVUiUwCWxL0 (accessed on 29 October 2025).
Author Contributions
Conceptualization, H.P.P.-A. and O.A.D.-R.; methodology, H.P.P.-A., R.V.-S. and O.A.D.-R.; software, H.P.P.-A. and J.Y.E.-S.; validation, H.P.P.-A., R.V.-S. and J.F.L.-N.; formal analysis, H.P.P.-A. and R.V.-S.; investigation, H.P.P.-A., J.Y.E.-S. and J.F.L.-N.; resources, O.A.D.-R. and J.F.L.-N.; data curation, J.Y.E.-S. and H.P.P.-A.; writing—original draft preparation, H.P.P.-A.; writing—review and editing, H.P.P.-A., O.A.D.-R. and R.V.-S.; visualization, H.P.P.-A. and J.Y.E.-S.; supervision, O.A.D.-R.; project administration, H.P.P.-A. and O.A.D.-R.; funding acquisition, O.A.D.-R. All authors have read and agreed to the published version of the manuscript.
Funding
This research was carried out within the framework of the institutional research project PIIF-2310, whose contribution made this study possible.
Data Availability Statement
The original contributions presented in this study are included in this article; further inquiries can be directed to the corresponding author.
Acknowledgments
The authors would like to express their sincere gratitude to the Escuela Politécnica Nacional (EPN), Quito, Ecuador, for its continuous academic and institutional support. This research was carried out within the framework of the institutional research project PIIF-2310, whose contribution made this study possible. The second and third authors acknowledge the support of the National System of Researchers (SNI) of Mexico.
Conflicts of Interest
The authors declare no conflict of interest.
References
- Manju, M.; Kapoor, D.; Dogra, V.D.; Singh, G.; Harita. Guillain–Barre’ Syndrome: Clinical Profile. J. Curr. Med. Res. Opin. 2019, 2, 378–382. [Google Scholar] [CrossRef]
- Mennella, C.; Maniscalco, U.; De Pietro, G.; Esposito, M. Generating a Novel Synthetic Dataset for Rehabilitation Exercises Using Pose-Guided Conditioned Diffusion Models: A Quantitative and Qualitative Evaluation. Comput. Biol. Med. 2023, 167, 106665. [Google Scholar] [CrossRef] [PubMed]
- Alarcón-Narváez, D.; Hernández-Torruco, J.; Hernández-Ocaña, B.; Chávez-Bosquez, O.; Marchi, J.; Méndez-Castillo, J. Toward a Machine Learning Model for a Primary Diagnosis of Guillain-Barré Syndrome Subtypes. Health Inform. J. 2021, 27, 1–13. [Google Scholar] [CrossRef] [PubMed]
- Martino Cinnera, A.; D’Arienzo, M.; Piatti, D.; Casagrande Conti, L.; Deledda, P.; Tenore, A.; Paolucci, S.; Grasso, M.G. Robot-Assisted Therapy in Guillain–Barrè Syndrome: Systematic Review of Primary Evidence and Study Protocol for a Randomized Clinical Trial. J. Clin. Med. 2024, 13, 7153. [Google Scholar] [CrossRef] [PubMed]
- Canul-Reich, J.; Frausto-Solís, J.; Hernández-Torruco, J. A Predictive Model for Guillain-Barré Syndrome Based on Single Learning Algorithms. Comput. Math. Methods Med. 2017, 2017, 8424198. [Google Scholar] [CrossRef] [PubMed]
- Hernandez-Torruco, J.; Canul-Reich, J.; Frausto-Solis, J.; Mendez-Castillo, J. Towards a Predictive Model for Guillain-Barré Syndrome. In Proceedings of the 2015 37th Annual International Conference of the IEEE Engineering in Medicine and Biology Society (EMBC), Milan, Italy, 25–29 August 2015. [Google Scholar] [CrossRef]
- Doets, A.Y.; Lingsma, H.F.; Walgaard, C.; Islam, B.; Papri, N.; Davidson, A.; Yamagishi, Y.; Kusunoki, S.; Dimachkie, M.M.; Waheed, W.; et al. Predicting Outcome in Guillain-Barré Syndrome. Neurology 2022, 98, e518–e532. [Google Scholar] [CrossRef] [PubMed]
- Torres-Vásquez, M.; Chávez-Bosquez, O.; Hernández-Ocaña, B.; Hernández-Torruco, J. Classification of Guillain–Barré Syndrome Subtypes Using Sampling Techniques with Binary Approach. Symmetry 2020, 12, 482. [Google Scholar] [CrossRef]
- Arriaga-Nieto, L.; Hernández-Bautista, P.F.; Vallejos-Parás, A.; Grajales-Muñiz, C.; Rojas-Mendoza, T.; Cabrera-Gaytán, D.A.; Grijalva-Otero, I.; Cacho-Díaz, B.; Jaimes-Betancourt, L.; Padilla-Velazquez, R.; et al. Predict the incidence of Guillain Barré Syndrome and arbovirus infection in Mexico, 2014–2019. PLoS Glob. Public Health 2022, 2, e0000137. [Google Scholar] [CrossRef] [PubMed]
- Jarillo-Silva, A.; Dominguez-Ramirez, O.A.; Parra-Vega, V.; Ordaz-Oliver, J.P. PHANToM OMNI Haptic Device: Kinematic and Manipulability. In Proceedings of the 2009 Electronics, Robotics and Automotive Mechanics Conference (CERMA), Cuernavaca, Mexico, 22–25 September 2009; pp. 193–198. [Google Scholar] [CrossRef]
- Yu, F.; Liu, Y.; Wu, Z.; Tan, M.; Yu, J. Adaptive Gait Training of a Lower Limb Rehabilitation Robot Based on Human–Robot Interaction Force Measurement. Cyborg Bionic Syst. 2024, 5, 0115. [Google Scholar] [CrossRef] [PubMed]
- Vianello, L.; Lhoste, C.; Küçüktabak, E.B.; Short, M.R.; Hargrove, L.; Pons, J.L. Deep-Learning Control of Lower-Limb Exoskeletons via Simplified Therapist Input. arXiv 2024, arXiv:2412.07959. [Google Scholar] [CrossRef]
- Antonellis, P.; Ranganathan, R.; Ueda, J. Metabolically Efficient Walking Assistance Using Optimized Exoskeleton Assistance Patterns. Sci. Robot. 2022, 7, eabh1925. [Google Scholar] [CrossRef] [PubMed]
- Fareh, R.; Elsabe, A.; Baziyad, M.; Kawser, T.; Brahmi, B.; Rahman, M.H. Will Your Next Therapist Be a Robot?—A Review of the Advancements in Robotic Upper Extremity Rehabilitation. Sensors 2023, 23, 5054. [Google Scholar] [CrossRef] [PubMed]
- Ramirez-Zamora, J.D.; Dominguez-Ramirez, O.A.; Ramos-Velasco, L.E.; Sepulveda-Cervantes, G.; Parra-Vega, V.; Jarillo-Silva, A.; Escotto-Cordova, E.A. HRpI System Based on Wavenet Controller with Human Cooperative-in-the-Loop for Neurorehabilitation Purposes. Sensors 2022, 22, 7729. [Google Scholar] [CrossRef] [PubMed]
- Paz-Arias, H.P.; Dominguez-Ramirez, O.A.; Ramirez-Zamora, J.D.; Garcia-Blancas, J.; Gonzalez-Islas, J.C. Hamiltonian prediction as a diagnostic metric in the upper limb using assistive robotics. In Proceedings of the 2024 XXVI Robotics Mexican Congress (COMRob), Torreón, Mexico, 13–15 November 2024; pp. 6–13. [Google Scholar] [CrossRef]
- Yang, Z.; Li, Y.; Zhou, G. TS-GAN: Time-Series GAN for Sensor-Based Health Data Augmentation. ACM Trans. Comput. Healthc. 2023, 4, 12. [Google Scholar] [CrossRef]
- Hadley, A.J.; Pulliam, C.L. Enhancing Activity Recognition After Stroke: Generative Adversarial Networks for Kinematic Data Augmentation. Sensors 2024, 24, 6861. [Google Scholar] [CrossRef] [PubMed]
- Mounis, S.Y.A.; Azlan, N.Z.; Sado, F. Assist-as-needed control strategy for upper-limb rehabilitation based on subject’s functional ability. Meas. Control 2019, 52, 1354–1361. [Google Scholar] [CrossRef]
- Novak, D.; Riener, R. Control Strategies and Artificial Intelligence in Rehabilitation Robotics. AI Mag. 2015, 36, 23–33. [Google Scholar] [CrossRef]
- Ortega, R.; Loría, A.; Nicklasson, P.J.; Sira-Ramírez, H. Passivity-Based Control of Euler-Lagrange Systems; Springer: London, UK, 1998. [Google Scholar]
- Goodfellow, I.J.; Pouget-Abadie, J.; Mirza, M.; Xu, B.; Warde-Farley, D.; Ozair, S.; Courville, A.; Bengio, Y. Generative Adversarial Networks. Commun. ACM 2020, 63, 139–144. [Google Scholar] [CrossRef]
- Arjovsky, M.; Chintala, S.; Bottou, L. Wasserstein Generative Adversarial Networks. In Proceedings of the 34th International Conference on Machine Learning (ICML 2017), Sydney, Australia, 6–11 August 2017; Volume 70, pp. 214–223. [Google Scholar]
- Yoon, J.; Jarrett, D.; van der Schaar, M. Time-series Generative Adversarial Networks. In Advances in Neural Information Processing Systems; Wallach, H., Larochelle, H., Beygelzimer, A., d’Alché-Buc, F., Fox, E., Garnett, R., Eds.; Curran Associates, Inc.: Red Hook, NY, USA, 2019; Volume 32. [Google Scholar]
- Bentéjac, C.; Csörgő, A.; Martínez-Muñoz, G. A Comparative Analysis of XGBoost. arXiv 2020, arXiv:1911.01914. [Google Scholar] [CrossRef]


Disclaimer/Publisher’s Note: The statements, opinions and data contained in all publications are solely those of the individual author(s) and contributor(s) and not of MDPI and/or the editor(s). MDPI and/or the editor(s) disclaim responsibility for any injury to people or property resulting from any ideas, methods, instructions or products referred to in the content. |
© 2025 by the authors. Licensee MDPI, Basel, Switzerland. This article is an open access article distributed under the terms and conditions of the Creative Commons Attribution (CC BY) license (https://creativecommons.org/licenses/by/4.0/).