Salivary Gland Dysfunction in Patients with Chronic Heart Failure Is Aggravated by Nitrosative Stress, as Well as Oxidation and Glycation of Proteins


 ,
,  and
and 
Abstract
1. Introduction
2. Materials and Methods
2.1. Ethical Issues
2.2. Patients
2.3. Research Material
2.4. Blood Collection
2.5. Saliva Collection
2.6. Dental Examination
2.7. Total Protein
2.8. Salivary Amylase
2.9. Biochemical Assays
2.10. Salivary Antioxidants
2.11. Salivary Redox Status
2.12. Salivary Glycoxidation Products
2.13. Salivary Nitrosative Stress
2.14. Statistical Analysis
3. Results
3.1. Dental Examination and Salivary Gland Function
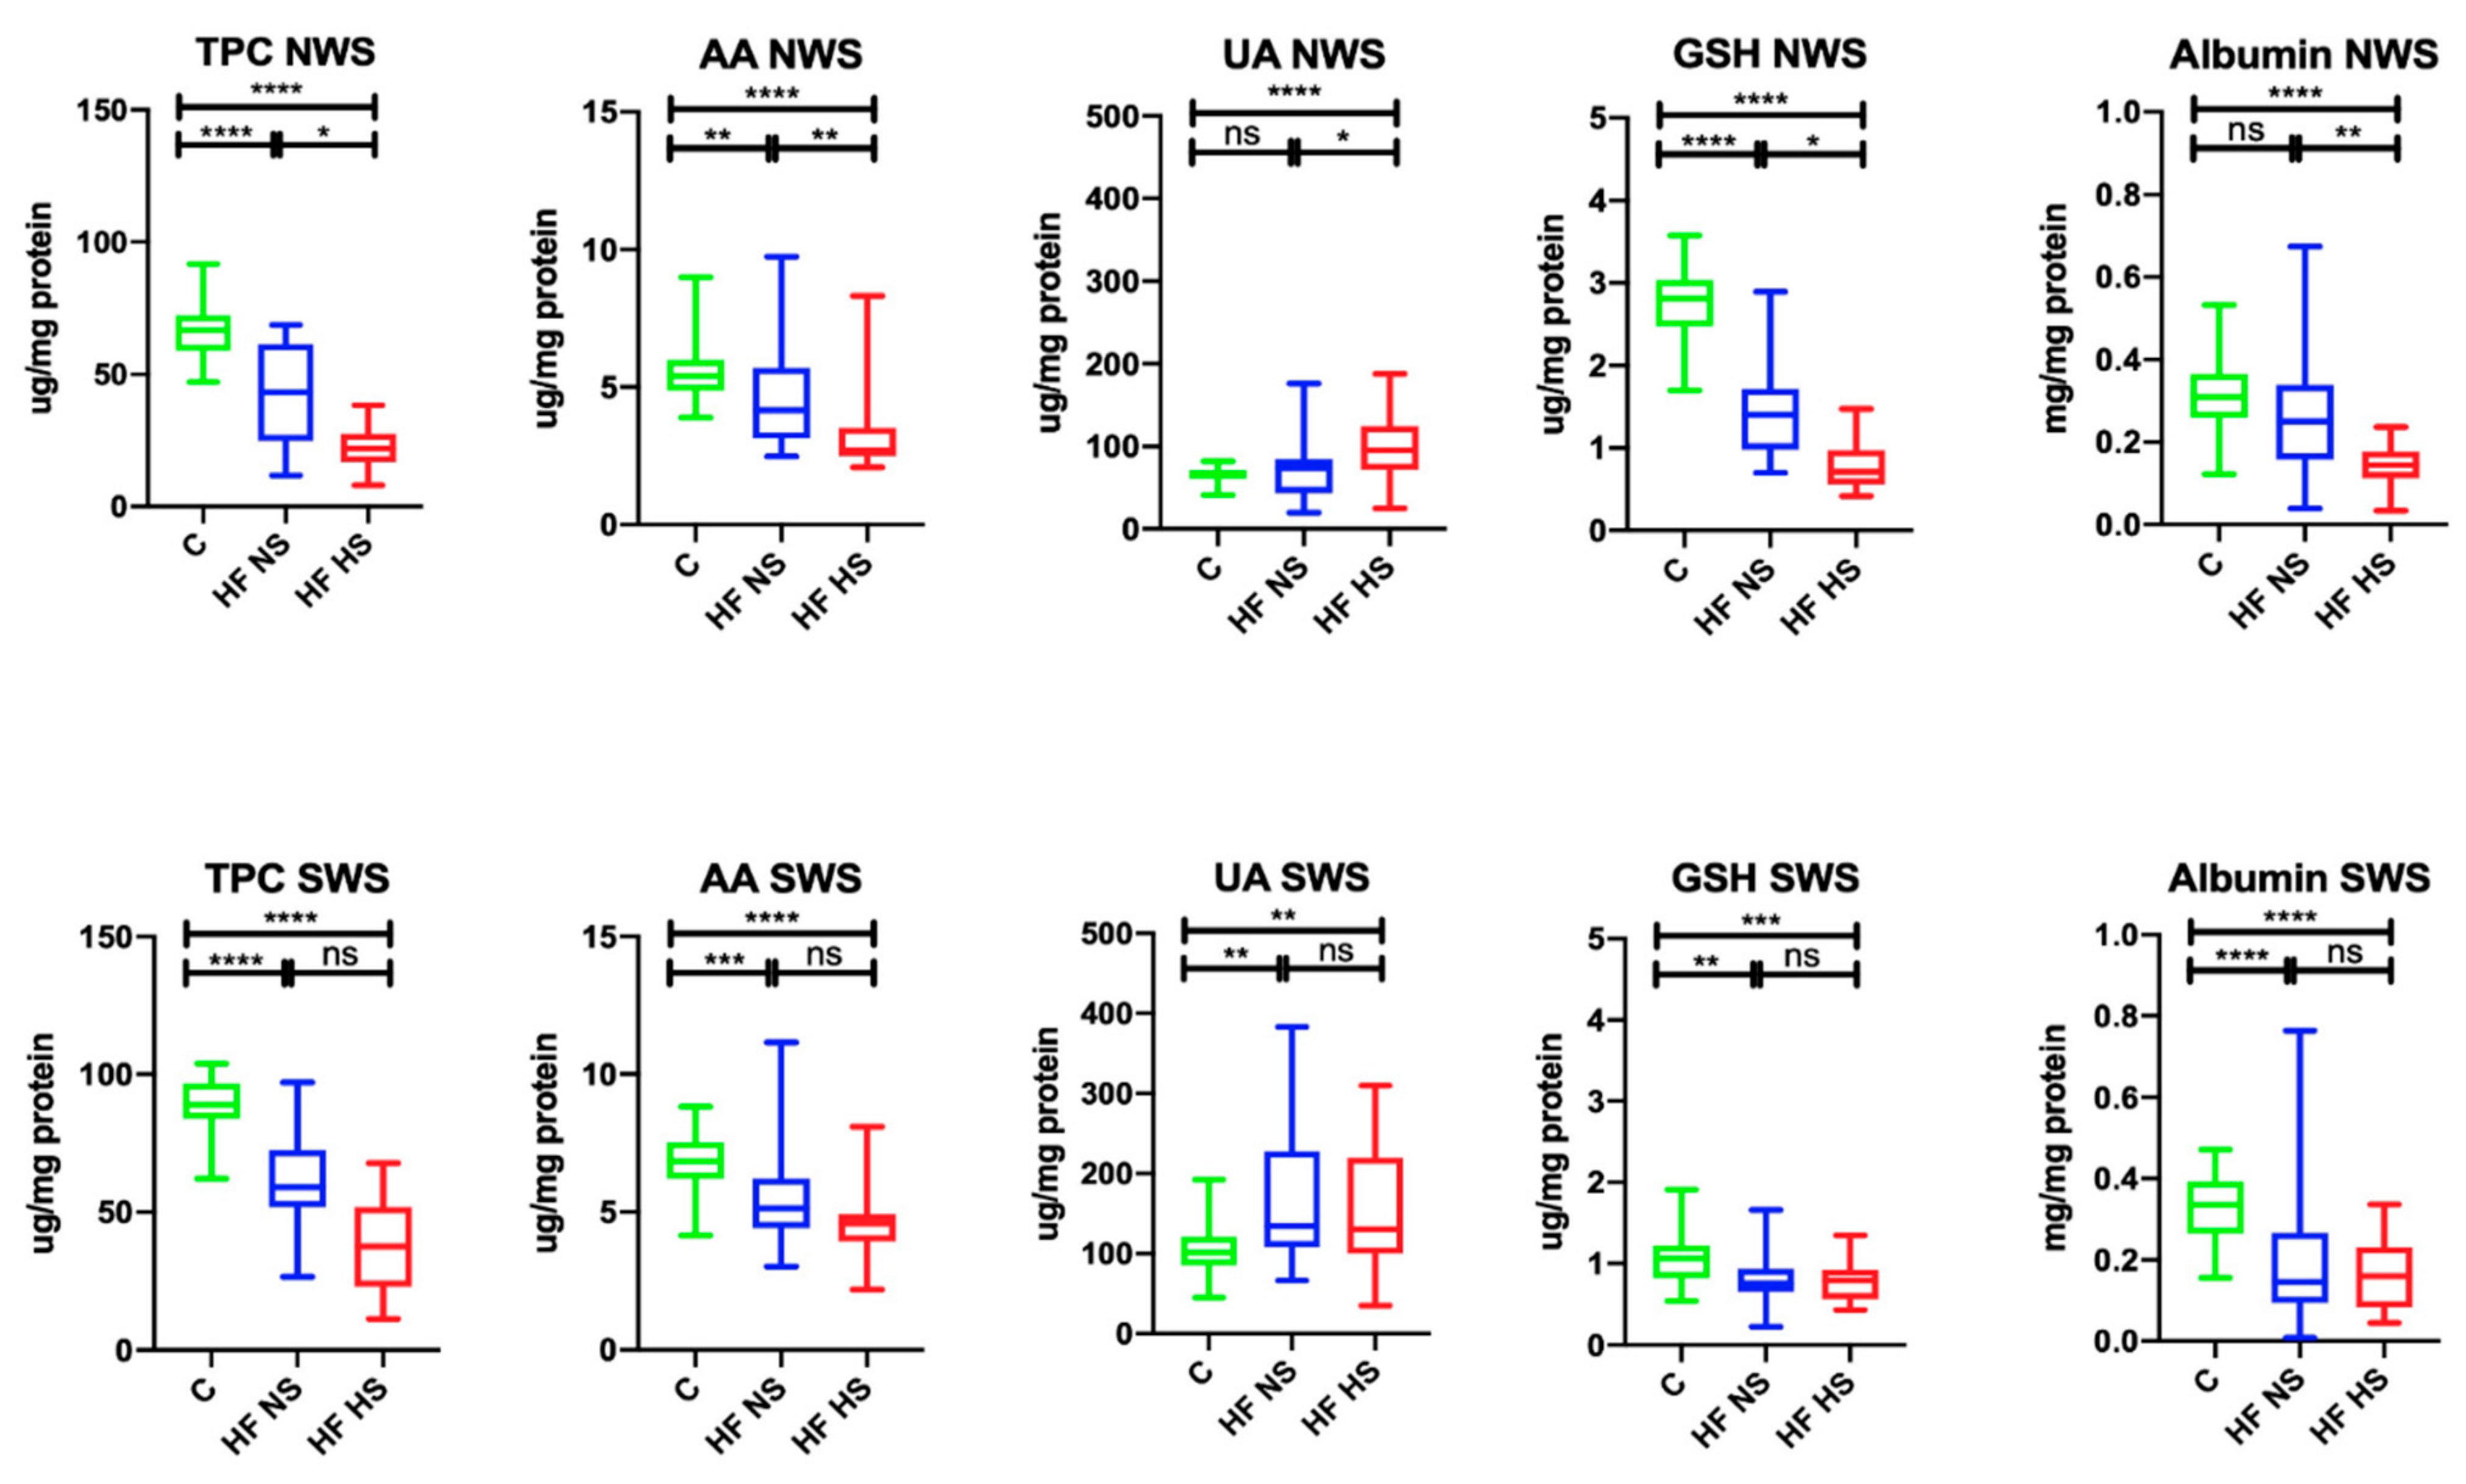
3.2. Salivary Antioxidants
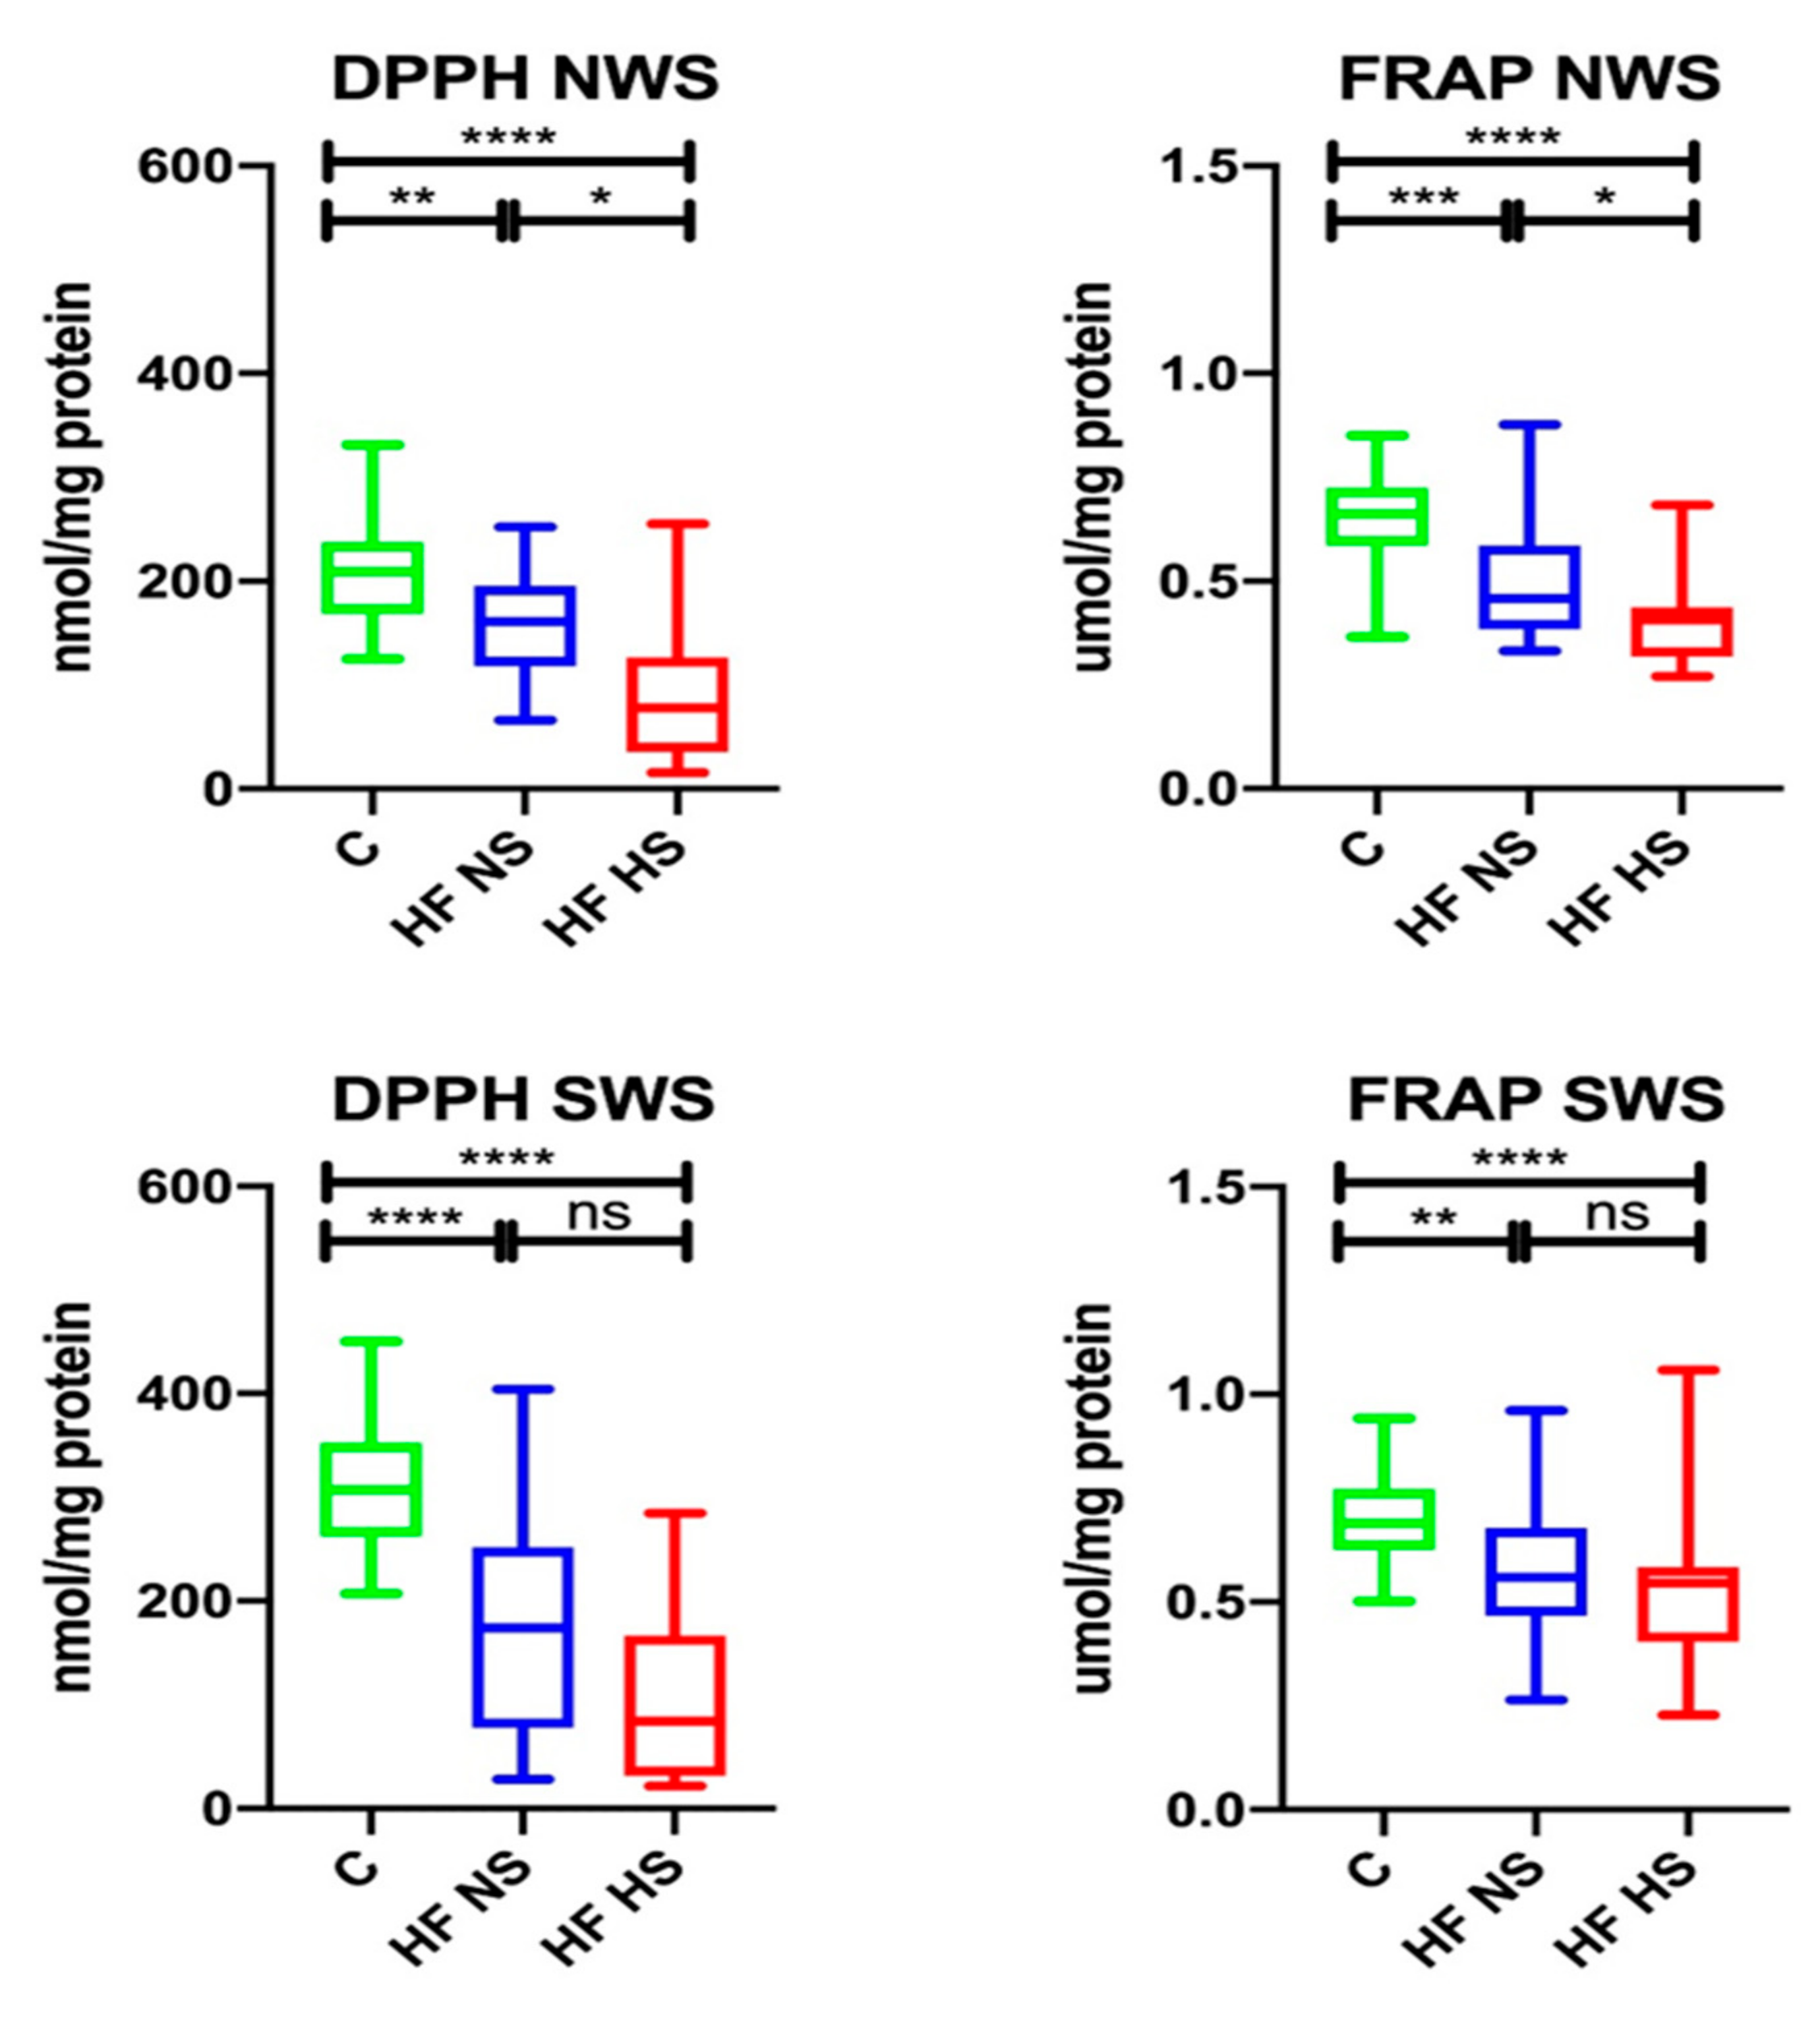
3.3. Salivary Redox Status
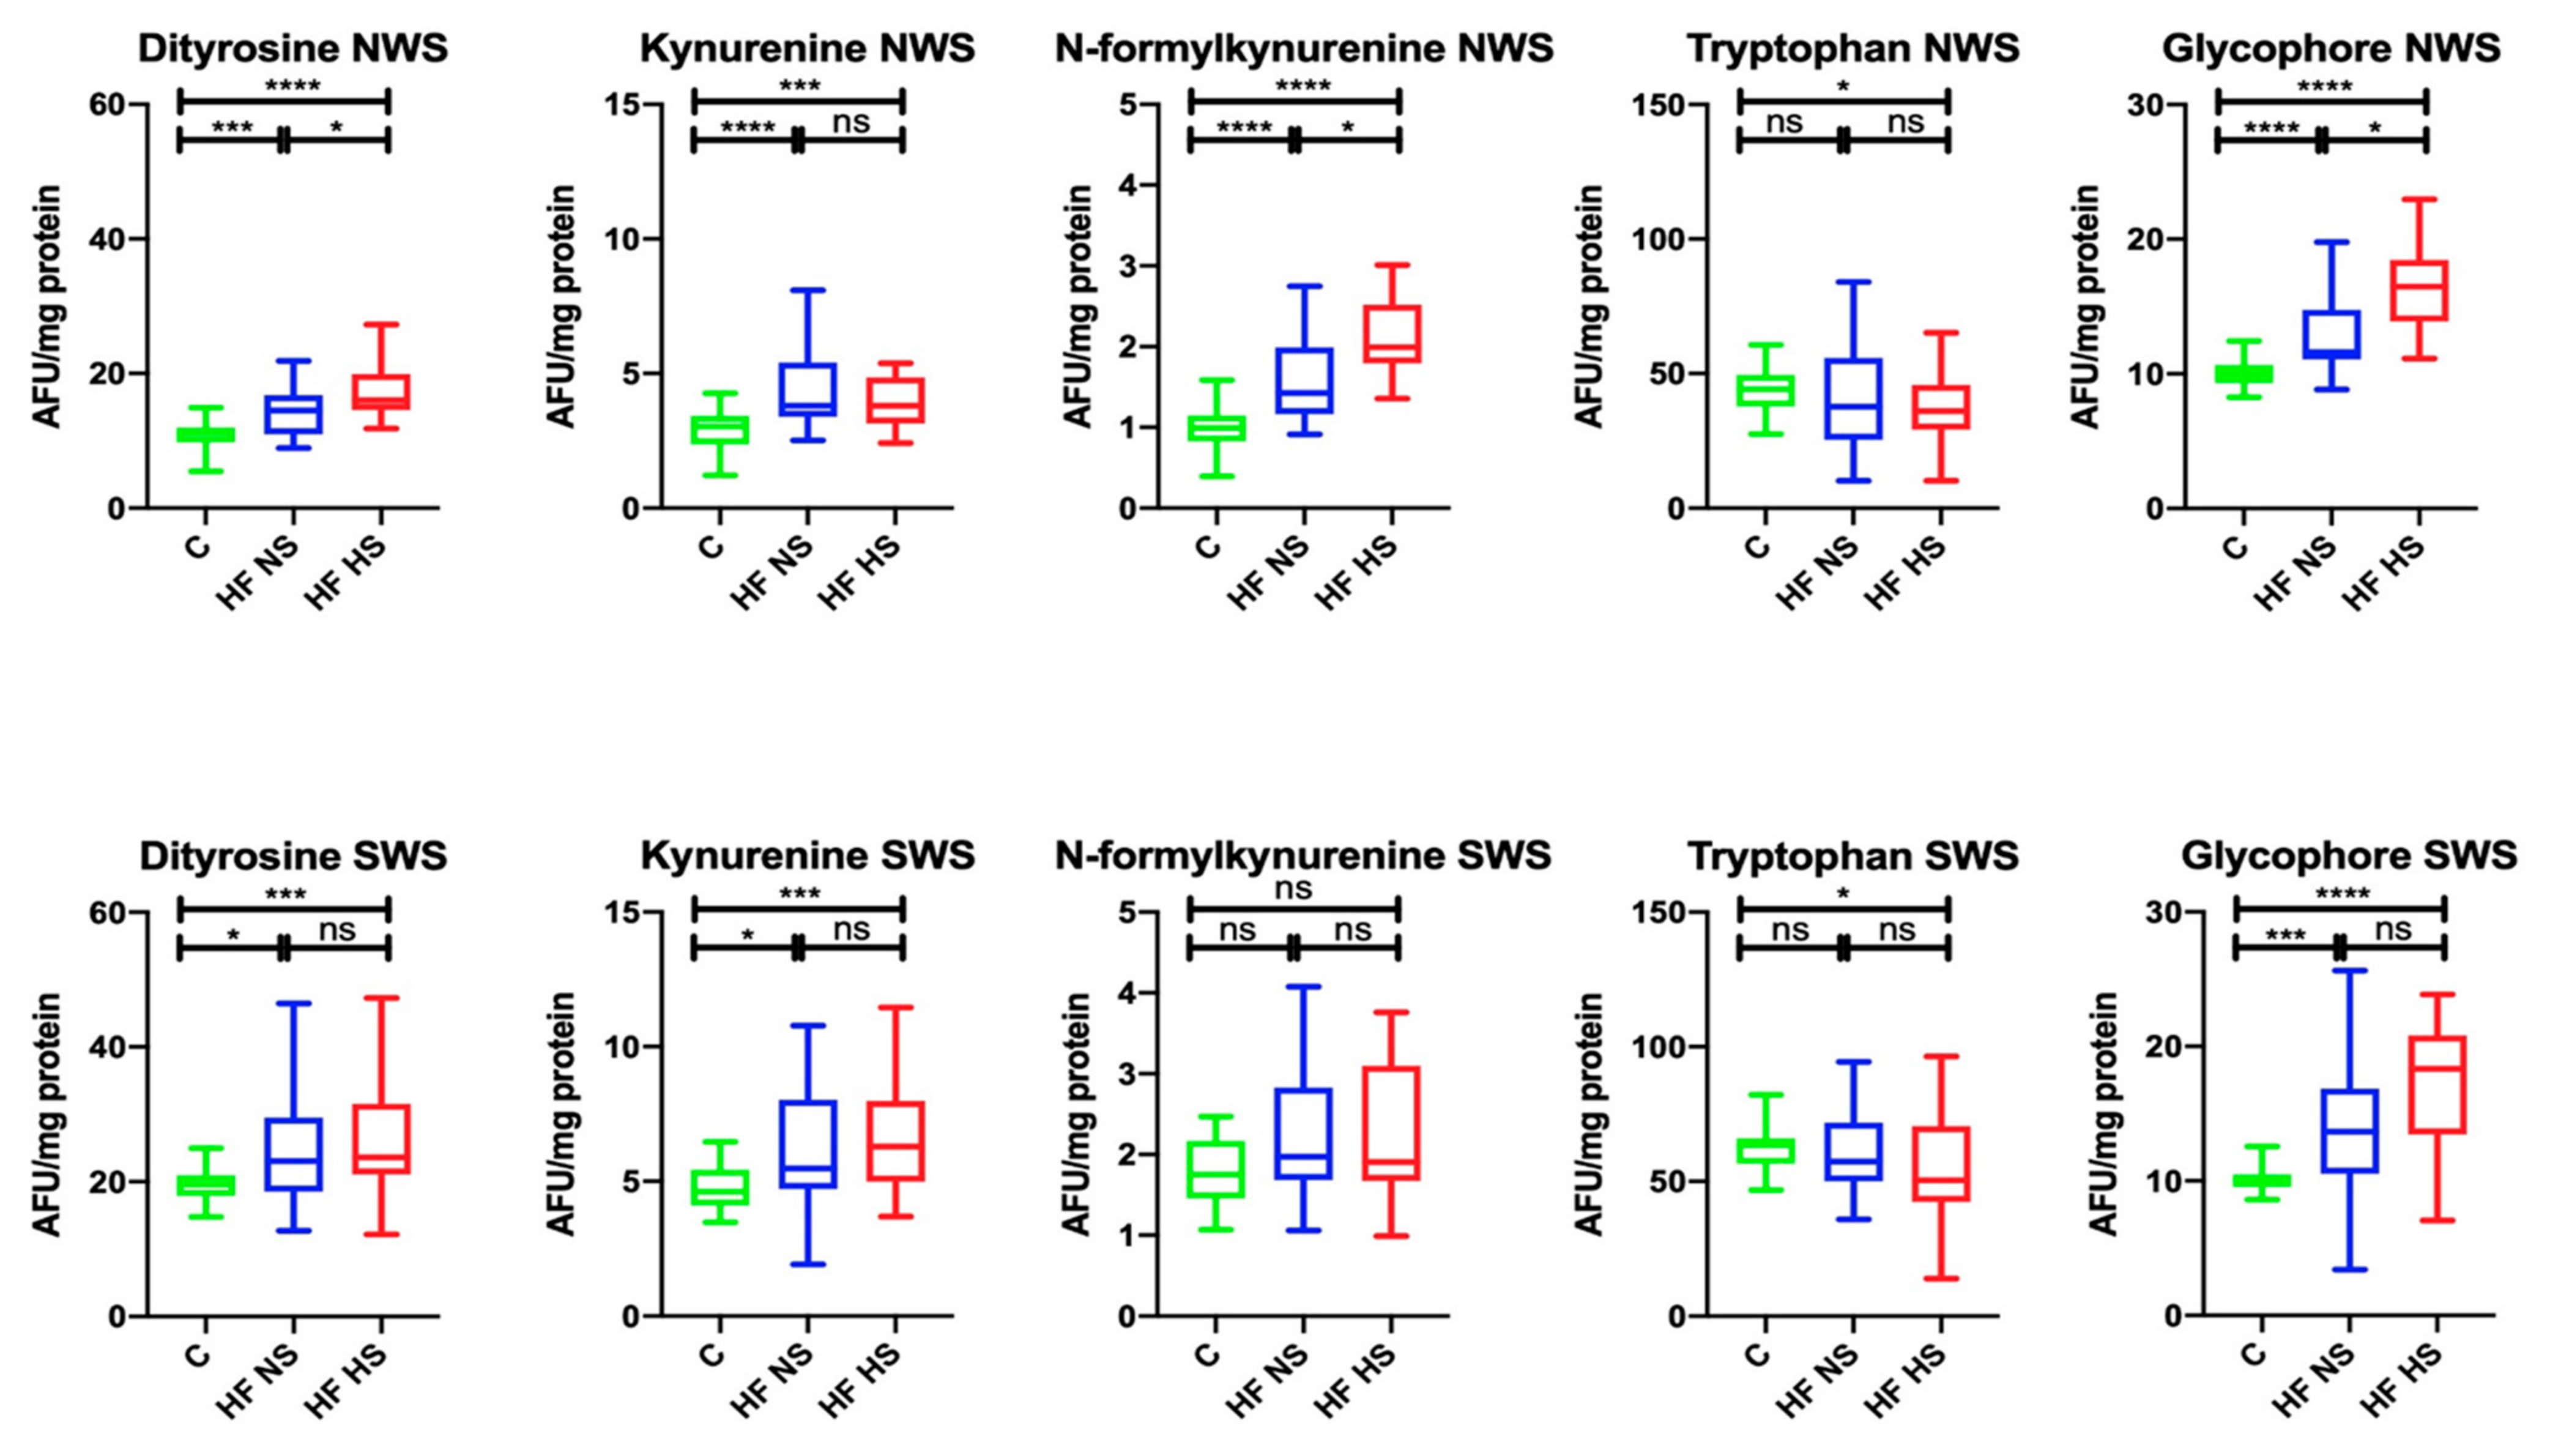
3.4. Salivary Glycoxidation Products
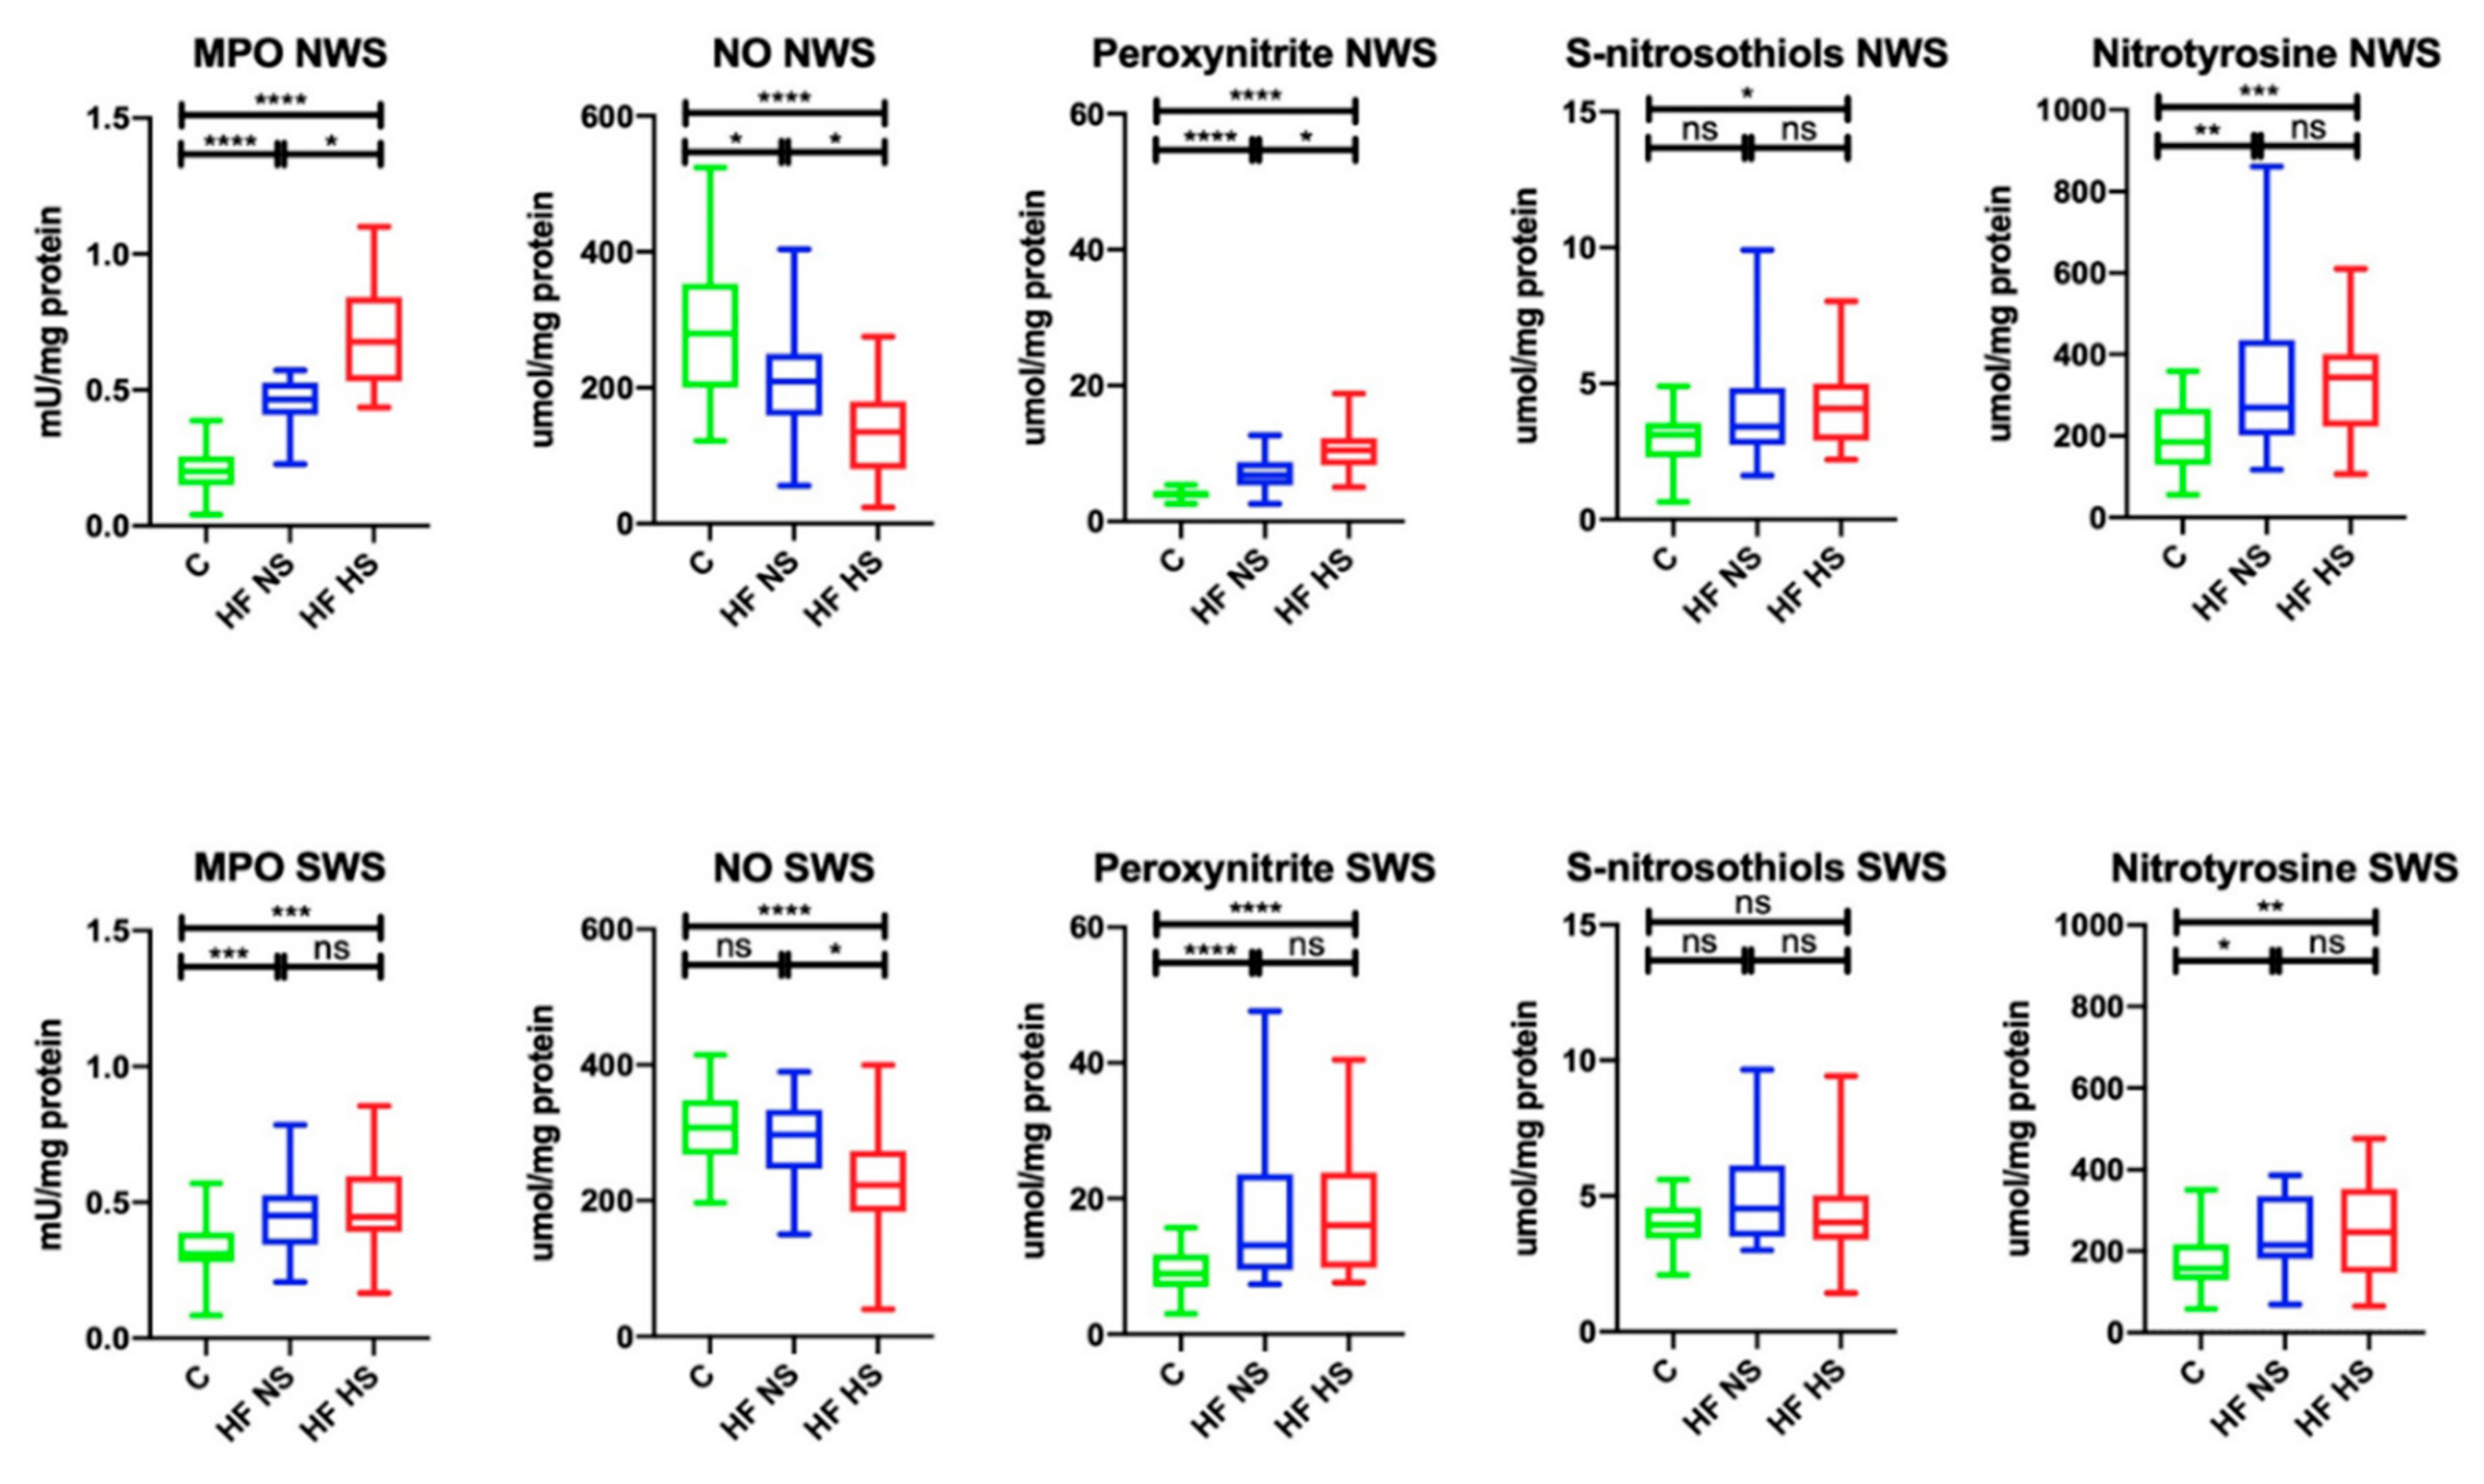
3.5. Salivary Nitrosative Stress
3.6. Plasma Antioxidants
3.7. Plasma Redox Status
3.8. Plasma Glycoxidation Products
3.9. Plasma Nitrosative Stress
3.10. Salivary Antioxidants
3.11. Salivary Redox Status
3.12. Salivary Glycoxidation Products
3.13. Salivary Nitrosative Stress
3.14. Correlations
3.15. ROC Analysis
4. Discussion
5. Conclusions
- Patients with chronic heart failure (HF) develop salivary gland dysfunction, with the submandibular salivary gland being the most inefficient.
- Redox homeostasis disorders in HF patients are different at the local (salivary glands) and central (blood) level.
- Oxidative/nitrosative stress may be one of the mechanisms responsible for the impairment of salivary gland secretory function in HF patients. Antioxidant supplementation should be considered to improve salivary gland activity in HF patients.
- Salivary redox biomarkers are a potential diagnostic tool in HF patients; however, further studies should be conducted on the matter in a larger population of such patients.
Author Contributions
Funding
Institutional Review Board Statement
Informed Consent Statement
Data Availability Statement
Conflicts of Interest
References
- Tanai, E.; Frantz, S. Pathophysiology of heart failure. Compr. Physiol. 2015, 6, 187–214. [Google Scholar] [CrossRef]
- Metra, M.; Teerlink, J.R. Heart failure. Lancet 2017, 390, 1981–1995. [Google Scholar] [CrossRef]
- Ponikowski, P.; Voors, A. 2016 Esc guidelines for the diagnosis and treatment of acute and chronic heart failure: The Task Force for the diagnosis and treatment of acute and chronic heart failure of the European society of cardiology (ESC): Developed with the special contribution. Russ. J. Cardiol. 2017, 141, 7–81. [Google Scholar] [CrossRef]
- D’Oria, R.; Schipani, R.; Leonardini, A.; Natalicchio, A.; Perrini, S.; Cignarelli, A.; Laviola, L.; Giorgino, F. The Role of Oxidative Stress in Cardiac Disease: From Physiological Response to Injury Factor. Oxid. Med. Cell. Longev. 2020, 2020, 1–29. [Google Scholar] [CrossRef]
- Galougahi, K.K.; Antoniades, C.; Nicholls, S.J.; Channon, K.M.; Figtree, G.A. Redox biomarkers in cardiovascularmedicine. Eur. Heart J. 2015, 36, 1576–1582. [Google Scholar] [CrossRef]
- Van der Pol, A.; van Gilst, W.H.; Voors, A.A.; van der Meer, P. Treating oxidative stress in heart failure: Past, present and future. Eur. J. Heart Fail. 2019, 21, 425–435. [Google Scholar] [CrossRef]
- Ziaeian, B.; Fonarow, G.C. Epidemiology and aetiology of heart failure. Nat. Rev. Cardiol. 2016, 13, 368–378. [Google Scholar] [CrossRef]
- Orso, F.; Fabbri, G.; Maggioni, A. Pietro. Epidemiology of heart failure. In Handbook of Experimental Pharmacology; Springer: Cham, Switzerland, 2017; Volume 243, pp. 15–33. [Google Scholar]
- Saleh, J.; Figueiredo, M.A.Z.; Cherubini, K.; Salum, F.G. Salivary hypofunction: An update on aetiology, diagnosis and therapeutics. Arch. Oral Biol. 2015, 60, 242–255. [Google Scholar] [CrossRef]
- Yuan, A.; Woo, S.B. Adverse drug events in the oral cavity. Oral Surg. Oral Med. Oral Pathol. Oral Radiol. 2015, 119, 35–47. [Google Scholar] [CrossRef]
- Maciejczyk, M.; Taranta-Janusz, K.; Wasilewska, A.; Kossakowska, A.; Zalewska, A. A Case-Control Study of Salivary Redox Homeostasis in Hypertensive Children. Can Salivary Uric Acid be a Marker of Hypertension? J. Clin. Med. 2020, 9, 837. [Google Scholar] [CrossRef]
- Soukup, M.; Biesiada, I.; Henderson, A.; Idowu, B.; Rodeback, D.; Ridpath, L.; Bridges, E.G.; Nazar, A.M.; Bridges, K.G. Salivary uric acid as a noninvasive biomarker of metabolic syndrome. Diabetol. Metab. Syndr. 2012, 4, 14. [Google Scholar] [CrossRef] [PubMed]
- Maciejczyk, M.; Szulimowska, J.; Taranta-Janusz, K.; Werbel, K.; Wasilewska, A.; Zalewska, A. Salivary FRAP as A Marker of Chronic Kidney Disease Progression in Children. Antioxidants 2019, 8, 409. [Google Scholar] [CrossRef] [PubMed]
- Maciejczyk, M.; Szulimowska, J.; Taranta-Janusz, K.; Wasilewska, A.; Zalewska, A. Salivary Gland Dysfunction, Protein Glycooxidation and Nitrosative Stress in Children with Chronic Kidney Disease. J. Clin. Med. 2020, 9, 1285. [Google Scholar] [CrossRef] [PubMed]
- Zalewska, A.; Kossakowska, A.; Taranta-Janusz, K.; Zięba, S.; Fejfer, K.; Salamonowicz, M.; Kostecka-Sochoń, P.; Wasilewska, A.; Maciejczyk, M. Dysfunction of Salivary Glands, Disturbances in Salivary Antioxidants and Increased Oxidative Damage in Saliva of Overweight and Obese Adolescents. J. Clin. Med. 2020, 9, 548. [Google Scholar] [CrossRef]
- Chielle, E.O.; Casarin, J.N. Evaluation of salivary oxidative parameters in overweight and obese young adults. Arch. Endocrinol. Metab. 2017, 61, 152–159. [Google Scholar] [CrossRef]
- Zalewska, A.; Maciejczyk, M.; Szulimowska, J.; Imierska, M.; Błachnio-Zabielska, A. High-Fat Diet Affects Ceramide Content, Disturbs Mitochondrial Redox Balance, and Induces Apoptosis in the Submandibular Glands of Mice. Biomolecules 2019, 9, 877. [Google Scholar] [CrossRef]
- Zalewska, A.; Ziembicka, D.; Żendzian-Piotrowska, M.; Maciejczyk, M. The Impact of High-Fat Diet on Mitochondrial Function, Free Radical Production, and Nitrosative Stress in the Salivary Glands of Wistar Rats. Oxid. Med. Cell. Longev. 2019, 2019, 2606120. [Google Scholar] [CrossRef]
- Skutnik-Radziszewska, A.; Maciejczyk, M.; Fejfer, K.; Krahel, J.; Flisiak, I.; Kołodziej, U.; Zalewska, A. Salivary Antioxidants and Oxidative Stress in Psoriatic Patients: Can Salivary Total Oxidant Status and Oxidative Status Index Be a Plaque Psoriasis Biomarker? Oxid. Med. Cell. Longev. 2020, 2020, 9086024. [Google Scholar] [CrossRef]
- Skutnik-Radziszewska, A.; Maciejczyk, M.; Flisiak, I.; Krahel, J.; Kołodziej, U.; Kotowska-Rodziewicz, A.; Klimiuk, A.; Zalewska, A. Enhanced Inflammation and Nitrosative Stress in the Saliva and Plasma of Patients with Plaque Psoriasis. J. Clin. Med. 2020, 9, 745. [Google Scholar] [CrossRef]
- Choromańska, M.; Klimiuk, A.; Kostecka-Sochoń, P.; Wilczyńska, K.; Kwiatkowski, M.; Okuniewska, N.; Waszkiewicz, N.; Zalewska, A.; Maciejczyk, M. Antioxidant defence, oxidative stress and oxidative damage in saliva, plasma and erythrocytes of dementia patients. Can salivary AGE be a marker of dementia? Int. J. Mol. Sci. 2017, 18, 2205. [Google Scholar] [CrossRef]
- Klimiuk, A.; Maciejczyk, M.; Choromańska, M.; Fejfer, K.; Waszkiewicz, N.; Zalewska, A. Salivary Redox Biomarkers in Different Stages of Dementia Severity. J. Clin. Med. 2019, 8, 840. [Google Scholar] [CrossRef] [PubMed]
- Gerreth, P.; Maciejczyk, M.; Zalewska, A.; Gerreth, K.; Hojan, K. Comprehensive Evaluation of the Oral Health Status, Salivary Gland Function, and Oxidative Stress in the Saliva of Patients with Subacute Phase of Stroke: A Case-Control Study. J. Clin. Med. 2020, 9, 2252. [Google Scholar] [CrossRef] [PubMed]
- Nonzee, V.; Manopatanakul, S.; Khovidhunkit, S.O.P. Xerostomia, hyposalivation and oral microbiota in patients using antihypertensive medications. J. Med. Assoc. Thail. 2012, 95, 96. [Google Scholar]
- Närhi, T.O.; Meurman, J.H.; Ainamo, A. Xerostomia and hyposalivation: Causes, consequences and treatment in the elderly. Drugs Aging 1999, 15, 103–116. [Google Scholar] [CrossRef] [PubMed]
- Maria, V.; Beniamino, P.; Andrea, M.; Carmen, L. Oxidative stress, plasma/salivary antioxidant status detection and health risk factors. Asian J. Med. Sci. 2017, 8, 32. [Google Scholar] [CrossRef]
- Meleti, M.; Cassi, D.; Vescovi, P.; Setti, G.; Pertinhez, T.A.; Pezzi, M.E. Salivary biomarkers for diagnosis of systemic diseases and malignant tumors. A systematic review. Med. Oral Patol. Oral Cir. Bucal 2020, 25, e229. [Google Scholar] [CrossRef]
- Zhang, C.Z.; Cheng, X.Q.; Li, J.Y.; Zhang, P.; Yi, P.; Xu, X.; Zhou, X.D. Saliva in the diagnosis of diseases. Int. J. Oral Sci. 2016, 8, 133–137. [Google Scholar] [CrossRef]
- Chen, Q.M.; Morrissy, S.; Alpert, J.S. Oxidative Stress and Heart Failure. In Comprehensive Toxicology, 3rd ed.; Elsevier: Amsterdam, The Netherlands, 2017; ISBN 9780081006122. [Google Scholar]
- Bertero, E.; Maack, C. Metabolic remodelling in heart failure. Nat. Rev. Cardiol. 2018, 15, 457–470. [Google Scholar] [CrossRef]
- Pacher, P.; Schulz, R.; Liaudet, L.; Szabó, C. Nitrosative stress and pharmacological modulation of heart failure. Trends Pharmacol. Sci. 2005, 26, 302–310. [Google Scholar] [CrossRef]
- Pacher, P.; Beckman, J.S.; Liaudet, L. Nitric oxide and peroxynitrite in health and disease. Physiol. Rev. 2007, 87, 315–424. [Google Scholar] [CrossRef]
- Klimiuk, A.; Zalewska, A.; Sawicki, R.; Knapp, M.; Maciejczyk, M. Salivary Oxidative Stress Increases With the Progression of Chronic Heart Failure. J. Clin. Med. 2020, 9, 769. [Google Scholar] [CrossRef] [PubMed]
- Borys, J.; Maciejczyk, M.; Krȩtowski, A.J.; Antonowicz, B.; Ratajczak-Wrona, W.; Jablonska, E.; Zaleski, P.; Waszkiel, D.; Ladny, J.R.; Zukowski, P.; et al. The redox balance in erythrocytes, plasma, and periosteum of patients with titanium fixation of the jaw. Front. Physiol. 2017, 8. [Google Scholar] [CrossRef] [PubMed]
- Maciejczyk, M.; Kossakowska, A.; Szulimowska, J.; Klimiuk, A.; Knaś, M.; Car, H.; Niklińska, W.; Ładny, J.R.; Chabowski, A.; Zalewska, A. Lysosomal Exoglycosidase Profile and Secretory Function in the Salivary Glands of Rats with Streptozotocin-Induced Diabetes. J. Diabetes Res. 2017, 2017. [Google Scholar] [CrossRef] [PubMed]
- Fejfer, K.; Buczko, P.; Niczyporuk, M.; Ładny, J.R.; Hady, H.R.; Knaś, M.; Waszkiel, D.; Klimiuk, A.; Zalewska, A.; Maciejczyk, M. Oxidative Modification of Biomolecules in the Nonstimulated and Stimulated Saliva of Patients with Morbid Obesity Treated with Bariatric Surgery. Biomed Res. Int. 2017, 2017, 1–13. [Google Scholar] [CrossRef] [PubMed]
- Knaś, M.; Maciejczyk, M.; Sawicka, K.; Hady, H.R.; Niczyporuk, M.; Ładny, J.R.; Matczuk, J.; Waszkiel, D.; Żendzian-Piotrowska, M.; Zalewska, A. Impact of morbid obesity and bariatric surgery on antioxidant/oxidant balance of the unstimulated and stimulated human saliva. J. Oral Pathol. Med. 2016, 45, 455–464. [Google Scholar] [CrossRef]
- Maciejczyk, M.; Szulimowska, J.; Skutnik, A.; Taranta-Janusz, K.; Wasilewska, A.; Wiśniewska, N.; Zalewska, A. Salivary Biomarkers of Oxidative Stress in Children with Chronic Kidney Disease. J. Clin. Med. 2018, 7, 209. [Google Scholar] [CrossRef]
- WHO. Oral Health Surveys: Basic Methods; World Health Organization: Geneva, Switzerland, 2013; pp. 1–137. [Google Scholar]
- Lobene, R.R.; Mankodi, S.M.; Ciancio, S.G.; Lamm, R.A.; Charles, C.H.; Ross, N.M. Correlations among gingival indices: A methodology study. J. Periodontol. 1989, 60, 159–162. [Google Scholar] [CrossRef]
- Löe, H. The Gingival Index, the Plaque Index and the Retention Index Systems. J. Periodontol. 1967, 38, 610–616. [Google Scholar] [CrossRef]
- Bernfeld, P. Amylases, alpha and beta. Methods Enzymol. 1955, 1, 149–158. [Google Scholar] [CrossRef]
- Jagota, S.K.; Dani, H.M. A new colorimetric technique for the estimation of vitamin C using Folin phenol reagent. Anal. Biochem. 1982, 127, 178–182. [Google Scholar] [CrossRef]
- Griffith, O.W. Determination of glutathione and glutathione disulfide using glutathione reductase and 2-vinylpyridine. Anal. Biochem. 1980, 106, 207–212. [Google Scholar] [CrossRef]
- Janaszewska, A.; Bartosz, G. Assay of total antioxidant capacity: Comparison of four methods as applied to human blood plasma. Scand. J. Clin. Lab. Investig. 2002, 62, 231–236. [Google Scholar] [CrossRef] [PubMed]
- Benzie, I.F.F.; Strain, J.J. The Ferric Reducing Ability of Plasma (FRAP) as a Measure of “Antioxidant Power”: The FRAP Assay. Anal. Biochem. 1996, 239, 70–76. [Google Scholar] [CrossRef] [PubMed]
- Diplock, A.T.; Symons, M.C.; Rice-Evans, C.A. Techniques in Free Radical Research. In Laboratory Techniques in Biochemistry and Molecular Biology; Elsevier: Amsterdam, The Netherlands, 1991; pp. 1–291. ISBN 9780444813046. [Google Scholar]
- Kalousová, M.; Zima, T.; Tesař, V.; Dusilová-Sulková, S.; Škrha, J. Advanced glycoxidation end products in chronic diseases-Clinical chemistry and genetic background. Mutat. Res.-Fundam. Mol. Mech. Mutagen. 2005, 579, 37–46. [Google Scholar] [CrossRef] [PubMed]
- Kruidenier, L.; Kuiper, I.; van Duijn, W.; Mieremet-Ooms, M.A.C.; van Hogezand, R.A.; Lamers, C.B.H.W.; Verspaget, H.W. Imbalanced secondary mucosal antioxidant response in inflammatory bowel disease. J. Pathol. 2003, 201, 17–27. [Google Scholar] [CrossRef]
- Borys, J.; Maciejczyk, M.; Antonowicz, B.; Krętowski, A.; Sidun, J.; Domel, E.; Dąbrowski, J.R.; Ładny, J.R.; Morawska, K.; Zalewska, A. Glutathione Metabolism, Mitochondria Activity, and Nitrosative Stress in Patients Treated for Mandible Fractures. J. Clin. Med. 2019, 8, 127. [Google Scholar] [CrossRef]
- Grisham, M.B.; Johnson, G.G.; Lancaster, J.R. Quantitation of nitrate and nitrite in extracellular fluids. Methods Enzymol. 1996, 268, 237–246. [Google Scholar] [CrossRef]
- Beckman, J.S.; Ischiropoulos, H.; Zhu, L.; van der Woerd, M.; Smith, C.; Chen, J.; Harrison, J.; Martin, J.C.; Tsai, M. Kinetics of superoxide dismutase- and iron-catalyzed nitration of phenolics by peroxynitrite. Arch. Biochem. Biophys. 1992, 298, 438–445. [Google Scholar] [CrossRef]
- Wink, D.A.; Kim, S.; Coffin, D.; Cook, J.C.; Vodovotz, Y.; Chistodoulou, D.; Jourd’heuil, D.; Grisham, M.B. Detection of S-nitrosothiols by fluorometric and colorimetric methods. Methods Enzymol. 1999, 301, 201–211. [Google Scholar] [CrossRef]
- Islas-Granillo, H.; Borges-Yañez, S.A.; de Navarrete-Hernández, J.J.; Veras-Hernández, M.A.; Casanova-Rosado, J.F.; Minaya-Sánchez, M.; Casanova-Rosado, A.J.; Fernández-Barrera, M.Á.; Medina-Solís, C.E. Indicators of oral health in older adults with and without the presence of multimorbidity: A cross-sectional study. Clin. Interv. Aging 2019, 14, 219–224. [Google Scholar] [CrossRef]
- Nagler, R.M.; Klein, I.; Zarzhevsky, N.; Drigues, N.; Reznick, A.Z. Characterization of the differentiated antioxidant profile of human saliva. Free Radic. Biol. Med. 2002, 32, 268–277. [Google Scholar] [CrossRef]
- Knaś, M.; Maciejczyk, M.; Waszkiel, D.; Zalewska, A. Oxidative stress and salivary antioxidants. Dent. Med. Probl. 2013, 50, 461–466. [Google Scholar]
- Ndrepepa, G. Uric acid and cardiovascular disease. Clin. Chim. Acta 2018, 484, 150–163. [Google Scholar] [CrossRef] [PubMed]
- Iliesiu, A.; Campeanu, A.; Marta, D.; Parvu, I.; Gheorghe, G. Uric Acid, Oxidative Stress and Inflammation in Chronic Heart Failure with Reduced Ejection Fraction. Rev. Rom. Med. Lab. 2015, 23, 397–406. [Google Scholar] [CrossRef]
- Bergamini, C.; Cicoira, M.; Rossi, A.; Vassanelli, C. Oxidative stress and hyperuricaemia: Pathophysiology, clinical relevance, and therapeutic implications in chronic heart failure. Eur. J. Heart Fail. 2009, 11, 444–452. [Google Scholar] [CrossRef] [PubMed]
- Sautin, Y.Y.; Johnson, R.J. Uric Acid: The Oxidant-Antioxidant Paradox. Nucleosides Nucleotides Nucleic Acids 2008, 27, 608–619. [Google Scholar] [CrossRef]
- Toczewska, J.; Maciejczyk, M.; Konopka, T.; Zalewska, A. Total Oxidant and Antioxidant Capacity of Gingival Crevicular Fluid and Saliva in Patients with Periodontitis: Review and Clinical Study. Antioxidants 2020, 9, 450. [Google Scholar] [CrossRef]
- Żukowski, P.; Maciejczyk, M.; Waszkiel, D. Sources of free radicals and oxidative stress in the oral cavity. Arch. Oral Biol. 2018, 92, 8–17. [Google Scholar] [CrossRef]
- Hansson, M.; Olsson, I.; Nauseef, W.M. Biosynthesis, processing, and sorting of human myeloperoxidase. Arch. Biochem. Biophys. 2006, 445, 214–224. [Google Scholar] [CrossRef]
- Cai, Z.; Yan, L.-J. Protein Oxidative Modifications: Beneficial Roles in Disease and Health. J. Biochem. Pharmacol. Res. 2013, 1, 15–26. [Google Scholar] [CrossRef]
- Singh, R.; Barden, A.; Mori, T.; Beilin, L. Advanced glycation end-products: A review. Diabetologia 2001, 44, 129–146. [Google Scholar] [CrossRef] [PubMed]
- Ott, C.; Jacobs, K.; Haucke, E.; Navarrete Santos, A.; Grune, T.; Simm, A. Role of advanced glycation end products in cellular signaling. Redox Biol. 2014, 2, 411–429. [Google Scholar] [CrossRef] [PubMed]
- Żukowski, P.; Maciejczyk, M.; Matczuk, J.; Kurek, K.; Waszkiel, D.; Zendzian-Piotrowska, M.; Zalewska, A. Effect of N-Acetylcysteine on Antioxidant Defense, Oxidative Modification, and Salivary Gland Function in a Rat Model of Insulin Resistance. Oxid. Med. Cell. Longev. 2018, 2018, 1–11. [Google Scholar] [CrossRef] [PubMed]
- De Coutinho, T.A.; Turner, S.T.; Peyser, P.A.; Bielak, L.F.; Sheedy, P.F.; Kullo, I.J. Associations of Serum Uric Acid With Markers of Inflammation, Metabolic Syndrome, and Subclinical Coronary Atherosclerosis. Am. J. Hypertens. 2007, 20, 83–89. [Google Scholar] [CrossRef] [PubMed]
- Beal, M.F. Oxidatively modified proteins in aging and disease. Free Radic. Biol. Med. 2002, 32, 797–803. [Google Scholar] [CrossRef]
- Proctor, G.B. The physiology of salivary secretion. Periodontol. 2000 2016, 70, 11–25. [Google Scholar] [CrossRef]
- Carpenter, G.H. The Secretion, Components, and Properties of Saliva. Annu. Rev. Food Sci. Technol. 2013, 4, 267–276. [Google Scholar] [CrossRef]
- Proctor, G.B.; Carpenter, G.H. Regulation of salivary gland function by autonomic nerves. Auton. Neurosci. 2007, 133, 3–18. [Google Scholar] [CrossRef]
- Lomniczi, A.; Suburo, A.M.; Elverdin, J.C.; Mastronardi, C.A.; Diaz, S.; Rettori, V.; McCann, S.M. Role of nitric oxide in salivary secretion. Neuroimmunomodulation 1998, 5, 226–233. [Google Scholar] [CrossRef]
- Förstermann, U. Nitric oxide and oxidative stress in vascular disease. Pflugers Arch. Eur. J. Physiol. 2010, 459, 923–939. [Google Scholar] [CrossRef]
- Odedra, K.; Ferro, A. Neurohormones and heart failure: The importance of aldosterone. Int. J. Clin. Pract. 2008, 60, 835–846. [Google Scholar] [CrossRef] [PubMed]
- Shetty, D.; Dua, M.; Kumar, K.; Dhanapal, R.; Astekar, M.; Shetty, D.C. Oral hygiene status of individuals with cardiovascular diseases and associated risk factors. Clin. Pract. 2012, 2, e86. [Google Scholar] [CrossRef] [PubMed][Green Version]
- Najafipour, H.; Malek Mohammadi, T.; Rahim, F.; Haghdoost, A.A.; Shadkam, M.; Afshari, M. Association of oral health and cardiovascular disease risk factors “results from a community based study on 5900 adult subjects”. ISRN Cardiol. 2013, 2013, 782126. [Google Scholar] [CrossRef] [PubMed]
- Sanchez, P.; Everett, B.; Salamonson, Y.; Ajwani, S.; Bhole, S.; Bishop, J.; Lintern, K.; Nolan, S.; Rajaratnam, R.; Redfern, J.; et al. Oral health and cardiovascular care: Perceptions of people with cardiovascular disease. PLoS ONE 2017, 12, e0181189. [Google Scholar] [CrossRef] [PubMed]
- Mathews, M.J.; Mathews, E.H.; Mathews, G.E. Oral health and coronary heart disease. BMC Oral Health 2016, 16, 122. [Google Scholar] [CrossRef] [PubMed]
- Toczewska, J.; Konopka, T.; Zalewska, A.; Maciejczyk, M. Nitrosative Stress Biomarkers in the Non-Stimulated and Stimulated Saliva, as well as Gingival Crevicular Fluid of Patients with Periodontitis: Review and Clinical Study. Antioxidants 2020, 9, 259. [Google Scholar] [CrossRef]
- Wilson, K.; Liu, Z.; Huang, J.; Roosaar, A.; Axéll, T.; Ye, W. Poor oral health and risk of incident myocardial infarction: A prospective cohort study of Swedish adults, 1973–2012. Sci. Rep. 2018, 8, 11479. [Google Scholar] [CrossRef]
- Muhvić-Urek, M.; Kovačević-Pavičić, D.; Antonić, R.; Prpić, J.; Bonifačić, I.; Glažar, I.; Pezelj-Ribarić, S. Medications as risk factors for hyposalivation in the elderly. In Oral Diseases; John Wiley & Sons Ltd.: Hoboken, NJ, USA, 2016. [Google Scholar] [CrossRef]
- Nederfors, T.; Nauntofte, B.; Twetman, S. Effects of furosemide and bendroflumethiazide on saliva flow rate and composition. Arch. Oral Biol. 2004, 49, 507–513. [Google Scholar] [CrossRef]
- Prasanthi, B.; Kannan, N.; Patil, R. Effect of diuretics on salivary flow, composition and oral health status: A clinico-biochemical study. Ann. Med. Health Sci. Res. 2014, 4, 549. [Google Scholar] [CrossRef]
- Maciejczyk, M.; Gerreth, P.; Zalewska, A.; Hojan, K.; Gerreth, K. Salivary Gland Dysfunction in Stroke Patients Is Associated with Increased Protein Glycoxidation and Nitrosative Stress. Oxid. Med. Cell. Longev. 2020, 2020, 6619439. [Google Scholar] [CrossRef]
- de Matos, L.F.; Pereira, S.M.; Kaminagakura, E.; Marques, L.S.; Pereira, C.V.; van der Bilt, A.; Pereira, L.J. Relationships of beta-blockers and anxiolytics intake and salivary secretion, masticatory performance and taste perception. Arch. Oral Biol. 2010, 55, 164–169. [Google Scholar] [CrossRef] [PubMed]
- Dubois-deruy, E.; Peugnet, V.; Turkieh, A.; Pinet, F. Oxidative stress in cardiovascular diseases. Antioxidants 2020, 9, 864. [Google Scholar] [CrossRef] [PubMed]
- Chang, Y.-T.; Chang, W.-N.; Tsai, N.-W.; Huang, C.-C.; Kung, C.-T.; Su, Y.-J.; Lin, W.-C.; Cheng, B.-C.; Su, C.-M.; Chiang, Y.-F.; et al. The Roles of Biomarkers of Oxidative Stress and Antioxidant in Alzheimer’s Disease: A Systematic Review. Biomed. Res. Int. 2014, 2014, 1–14. [Google Scholar] [CrossRef]
- Tsutsui, H.; Kinugawa, S.; Matsushima, S. Oxidative stress and mitochondrial DNA damage in heart failure. Circ. J. 2008, 72, A31–A37. [Google Scholar] [CrossRef] [PubMed]
- Tsutsui, H.; Kinugawa, S.; Matsushima, S. Oxidative stress and heart failure. Am. J. Physiol. Hear. Circ. Physiol. 2011, 301, H2181–H2190. [Google Scholar] [CrossRef]
- Trachtenberg, B.H.; Hare, J.M. Biomarkers of Oxidative Stress in Heart Failure. Heart Fail. Clin. 2009, 5, 561–577. [Google Scholar] [CrossRef]
- Bayeva, M.; Gheorghiade, M.; Ardehali, H. Mitochondria as a therapeutic target in heart failure. J. Am. Coll. Cardiol. 2013, 61, 599–610. [Google Scholar] [CrossRef]
- Tsutsui, H.; Kinugawa, S.; Matsushima, S. Mitochondrial oxidative stress and dysfunction in myocardial remodelling. Cardiovasc. Res. 2008, 81, 449–456. [Google Scholar] [CrossRef]
- Martín-Fernández, B.; Gredilla, R. Mitochondria and oxidative stress in heart aging. Age 2016, 38, 225–238. [Google Scholar] [CrossRef]
- Marquez, J.; Lee, S.R.; Kim, N.; Han, J. Rescue of heart failure by mitochondrial recovery. Int. Neurourol. J. 2006, 20, 5–12. [Google Scholar] [CrossRef]


| Patient Characteristics | Control n = 50 | HF NS n = 27 | HF HS n = 23 | ANOVA p | |
|---|---|---|---|---|---|
| Demographic data | |||||
| Sex | Male n (%) | 29 (58) | 14 (58.33) | 15 (57.69) | NA |
| Female n (%) | 21 (42) | 13 (61.9) | 8 (38.1) | ||
| Age | 66 (42–87) | 64 (49–85) | 71 (42–87) | 0.3337 | |
| Blood count | |||||
| WBC (×103/µL) | 7.44 (6.6–8.38) | 7.23 (4.02–11.62) | 7.65 (4.5–12.12) | 0.2232 | |
| RBC (×106/µL) | 4.50 (3.51–5.62) | 4.62 (3.38–12.9) | 4.3 (3.34–5.49) | 0.1114 | |
| HGB (g/dL) | 13.52 (6–19.09) | 13.75 (11.2–16.3) | 13 (10.2–15.6) | 0.2691 | |
| HCT (%) | 38.72 (32.49–46.8) | 39.9 (31.6–47.4) | 38.9 (31.8–46.2) | 0.1628 | |
| MCV (fL) | 90.33 (78.63–97.32) | 91.2 (76.2–105) | 90.7 (78.2–98.5) | 0.8838 | |
| MCH (pg) | 33.49 (26.94–39.18) | 30.95 (24.2–38.2) a | 30.5 (25.2–33.7) a | <0.0001 | |
| MCHC (g/dL) | 34.62 (27.58–40.5) | 37.4 (24.09–49) a | 30.8 (25.2–43.37) b | 0.0003 | |
| RDW-SW (fL) | 45.59 (42.95–47.98) | 45.75 (37.1–58.6) | 47.6 (42.2–55.6) | 0.0904 | |
| PLT (×103/µL) | 250 (217.7–272.8) | 175 (123–334) a | 189 (152–399) a | <0.0001 | |
| PCT (%) | 0.22 (0.17–0.25) | 1.04 (0.25–2.94) | 0.27 (0.16–0.31) | 0.0382 | |
| MPV (fL) | 7.91 (7.43–8.21) | 14.69 (4.37–21.15) a | 11.8 (9.3–14.12) ab | <0.0001 | |
| PDW (fL) | 13.62 (10.37–16.38) | 17.22 (11.41–21.57) a | 14.4 (10–17.5) b | <0.0001 | |
| P-LCR (%) | 30.13 (21.66–35) | 36.82 (28.03–47.25) a | 36.1 (19.6–47.17) a | <0.0001 | |
| Blood biochemistry | |||||
| CRP (mg/L) | 2.92 (2.39–3.47) | 1.8 (0.2–6.5) | 3.49 (0.6–9.2) b | 0.0122 | |
| Na+ (mmol/L) | 137.9 (129.4–149.7) | 139 (133–143) | 137 (125–141) | 0.1754 | |
| K+ (mmol/L) | 4.21 (3.94–4.6) | 4.66 (3.46–6.07) a | 4.71 (3.71–5.83) a | <0.0001 | |
| Creatinine (mg/dL) | 0.91 (0.66–1.5) | 0.93 (0.74–1.37) | 1.08 (0.72–2.34) ab | 0.0001 | |
| GFR (ml/min) | 85.69 (1.5–100.6) | 84.01 (74.56–88.72) | 73.99 (65.45–83.97) a | 0.0282 | |
| TSH (µIU/mL) | 1.05 (0.69–1.5) | 1.06 (0.03–2.56) | 1.3 (0.38–4.18) ab | 0.0014 | |
| FT3 (pg/mL) | 2.26 (1.3–3.0) | 2.44 (1.38–3.14) | 2.33 (1.65–3.15) | 0.4556 | |
| FT4 (ng/mL) | 9.78 (1.5–10.12) | 5.67 (0.34–12.48) a | 4.22 (0.91–9.2) ab | <0.0001 | |
| Vit. D3 (ng/mL) | 24.04 (1.5–35.14) | 18.05 (8.3–34.6) a | 12.1 (6.8–32.4) a | <0.0001 | |
| AST (IU/L) | 21.12 (1.5–27.91) | 22.5 (12–37) | 20 (15–37) | 0.03 | |
| ALT (IU/L) | 13.55 (1.5–16.42) | 16 (7–44) a | 18 (10–41) a | <0.0001 | |
| Glucose (mg/dL) | 92.01 (75–101.3) | 95.5 (85–104) a | 91.49 (78–102.9) | 0.044 | |
| NT-proBNP (pg/mL) | ND | 1782 (34–3644) | 3339 (742–6610) b | NA | |
| Heart function | |||||
| NYHA II/NYHA III n | – | 24/3 | 6/17 | NA | |
| EF | ND | 26 (12–35) | 20 (10–30) b | NA | |
| RR (mmHg) | SBP | 125 (120–129.4) | 124 (94–170) | 125 (102–156) | 0.3317 |
| DBP | 71.06 (52.23–80) | 75 (45–100) a | 75 (56–89) | 0.0318 | |
| Comorbidities | |||||
| Type 2 diabetes n (%) | 6 (14) | 7 (29.17) | 7 (26.92) | NA | |
| Cardiac dysrhythmia (atrial flutter and fibrillation) n (%) | – | 8 (33.33) | 7 (26.92) | NA | |
| Coronary artery disease n (%) | – | 8 (33.33) | 10 (38.46) | NA | |
| Myocardial infarction n (%) | – | 3 (12.5) | 2 (7.69) | NA | |
| Hypertension n (%) | 20 (40) | 19 (79.17) | 17 (65.38) | NA | |
| Medications | |||||
| Medications | ASA n (%) | 6 (12) | 10 (41.67) | 8 (30.77) | NA |
| Alpha receptor blocker n (%) | 0 (0) | 3 (12.5) | 3 (11.54) | NA | |
| Beta receptor blocker n (%) | 5 (10) | 10 (37.04) | 10 (43.47) | NA | |
| Ca2+ channel blocker n (%) | 3 (6) | 8 (33.33) | 7 (26.92) | NA | |
| AT1-receptor blocker n (%) | 8 (16) | 8 (29.63) | 9 (34.62) | NA | |
| Diuretics n (%) | 8 (16) | 14 (51.85) | 12 (52.17) | NA | |
| ACE n (%) | 6 (12) | 13 (48.15) | 12 (52.17) | NA | |
| Cardiac glycosides n (%) | 0 (0) | 3 (12.5) | 3 (11.54) | NA | |
| Organic nitrate n (%) | 0 (0) | 1 (4.17) | 1 (3.85) | NA | |
| Statins n (%) | 9 (18) | 13 (48.15) | 10 (43.48) | NA | |
| Patient Characteristics | Control n = 50 | HF NS n = 27 | HF HS n = 23 |
|---|---|---|---|
| NWS FR (mL/min) | 0.40 (0.31–0.53) | 0.31 (0.21–0.46) a | 0.12 (0.001–0.19) ab |
| SWS FR (mL/min) | 1.3 (1.05–1.47) | 0.8 (0.2–1.7) a | 0.6 (0.2–1.5) a |
| NWS TP (μg/mL) | 1390 (464.2–2107) | 1230 (381.6–1821) | 882 (486.5–1273) ab |
| SWS TP (μg/mL) | 1002 (125.4–1517) | 1060 (347.1–1507) | 863.2 (528.2–1174) ab |
| NWS SA (µmol/mg protein) | 0.18 (0.05–0.41) | 0.12 (0.02–0.19) a | 0.05 (0.007–0.18) ab |
| SWS SA (µmol/mg protein) | 0.25 (0.09–0.81) | 0.19 (0.1–0.33) a | 0.15 (0.08–0.26) a |
| DMFT | 28.62 (28.09–29.15) | 28.96 (28.27–29.65) | 29.09 (28.2–29.98) |
| GI | 1.10 (0.4–1.17) | 1.8 (1.53–2.07) | 1.9 (1.66–2.14) |
| PBI | 1.62 (1.56–1.68) | 1.65 (1.51–1.79) | 1.67 (1.53–1.81) |
| C n =50 | HF NS n =27 | HF HS n =23 | ANOVA p-Value | C n =50 | NYHA II n =30 | NYHA III n = 20 | ANOVA p-Value | |
|---|---|---|---|---|---|---|---|---|
| Salivary antioxidants | ||||||||
| AA (μg/mg protein) | 15.9 (3.0–27.5) | 12.9 (2.6–27.6) | 15.1 (0.58–33.7) | 0.1741 | 15.9 (3.981–27.5) | 13.4 (2.5–33.7) | 12.4 (0.58–29.8) | 0.2575 |
| UA (μg/mg protein) | 0.50 (0.18–0.98) | 0.98 (0.24–1.3) a | 0.83 (0.38–1.1) a | <0.0001 | 0.50 (0.18–0.98) | 0.96 (0.24–1.3) a | 0.81 (0.38–1.1) a | <0.0001 |
| GSH (μg/mg protein) | 4.3 (2.5–5.4) | 3.1 (1.6–5.4) a | 3.4 (2.0–6.8) a | <0.0001 | 4.3 (2.5–5.4) | 3.0 (1.6–5.4) a | 3.6 (2.0–6.8) a | <0.0001 |
| Albumin (mg/mg protein) | 2.4 (0.35–4.5) | 3.3 (0.63–4.5) | 2.5 (0.75–6.1) | 0.3427 | 2.4 (0.35–4.5) | 3.25 (0.63–4.55) | 2.5 (1.3–6.1) | 0.4745 |
| Salivary redox status | ||||||||
| DPPH (nmol/mg protein) | 156.3 (94.3–221.6) | 114.2 (24.2–205.1) a | 109.5 (63.8–180.3) a | <0.0001 | 156.3 (94.3–221.6) | 107.3 (24.2–205.1) a | 119.5 (63.8–180.3) a | <0.0001 |
| FRAP (µmol/mg protein) | 0.51 (0.30–0.69) | 0.40 (0.17–0.59) a | 0.40 (0.28–0.56) a | <0.0001 | 0.51 (0.30–0.69) | 0.40 (0.17–0.59) a | 0.41 (0.28–0.52) a | <0.0001 |
| Salivary glycoxidation products | ||||||||
| Dityrosine (AFU/mg protein) | 19.0 (6.9–27.0) | 33.7 (12.7–54.2) a | 33.1 (20.7–48.2) a | <0.0001 | 20.0 (6.9–27.0) | 33.4 (12.7–54.2) a | 33.1 (20.7–48.2) a | <0.0001 |
| Kynurenine (AFU/mg protein) | 5.1 (2.9–6.8) | 7.8 (6.2–10.0) a | 7.9 (6.1–9.3) a | <0.0001 | 5.1 (2.9–6.8) | 7.8 (6.1–10.0) a | 7.9 (6.2–9.0) a | <0.0001 |
| N-formylkynurenine (AFU/mg protein) | 1.9 (0.46–5.2) | 2.5 (0.96–4.1) | 2.5 (0.41–5.9) | 0.0209 | 1.9 (0.5–5.2) | 2.4 (0.5–4.1) | 2.6 (0.4–5.9) a | 0.009 |
| Tryptophan (AFU/mg protein) | 69.8 (58.3–90.2) | 68.3 (48.3–96.2) | 64.3 (56.1–73.6) a | 0.0114 | 69.8 (58.3–90.2) | 68.2 (48.3–96.2) | 63.1 (56.1–73.6) a | 0.0105 |
| Glycophore (AFU/mg protein) | 2.2 (0.56–3.4) | 4.9 (2.4–6.9) a | 3.9 (2.0–5.7) a | <0.0001 | 2.2 (0.56–3.4) | 4.8 (2.4–6.9) a | 3.9 (2.0–5.7) a | <0.0001 |
| Salivary nitrosative stress | ||||||||
| MPO (mU/mg protein) | 0.80 (0.62–0.98) | 1.1 (0.63–1.2) a | 1.1 (0.98–1.4) a | <0.0001 | 0.80 (0.62–0.98) | 1.1 (0.63–1.4) a | 1.1 (1.0–1.2) a | <0.0001 |
| NO (µmol/mg protein) | 97.0 (58.7–151.9) | 128.7 (75.0–191.3) a | 90.6 (44.1–150.4) b | <0.0001 | 97.0 (58.7–151.9) | 124.1 (50.6–191.3) a | 90.9 (44.1–150.4) b | <0.0001 |
| Peroxynitrite (µmol/mg protein) | 175.1 (67.6–256.7) | 193.5 (80.1–322.8) | 191.9 (123.7–297.8) | 0.3259 | 175.1 (67.6–256.7) | 193.2 (80.1–322.8) | 195.1 (123.7–297.8) | 0.2504 |
| S-nitrosothiols (µmol/mg protein) | 10.4 (6.2–15.0) | 8.2 (2.5–12.7) a | 7.9 (2.5–13.1) a | <0.0001 | 10.4 (6.2–15.0) | 8.0 (2.5–12.7) a | 8.2 (3.2–13.1) a | <0.0001 |
| Nitrotyrosine (µmol/mg protein) | 181.1 (114.4–234.4) | 218.1 (99.5–330.7) a | 205.6 (113.7–307.2) a | 0.0005 | 181.1 (114.4–234.4) | 213.9 (99.5–330.7) a | 206.6 (154.6–307.2) a | 0.0004 |
| NWS | SWS | |||||||
|---|---|---|---|---|---|---|---|---|
| C n = 50 | NYHA II n = 27 | NYHA III n = 23 | ANOVA p-Value | C n = 50 | NYHA II n = 30 | NYHA III n = 20 | ANOVA p-Value | |
| Salivary antioxidants | ||||||||
| TPC (µg /mg protein) | 66.7 (47.0–91.6) | 38.5 (11.8–68.7) a | 21.8 (8.1–38.3) ab | <0.0001 | 88.9 (62.2–103.9) | 56.9 (23.0–97.0) a | 40.5 (11.3–67.9) a | <0.0001 |
| AA (μg/mg protein) | 5.4 (3.9–9.0) | 4.2 (2.5–9.7) a | 2.7 (2.1–8.3) ab | <0.0001 | 6.8 (4.1–8.8) | 5.1 (3.0–11.2) a | 4.5 (2.2–8.1) a | <0.0001 |
| UA (μg/mg protein) | 65.7 (41.2–81.8) | 74.9 (19.6–176.1) | 94.7 (24.6–187.9) a | 0.0012 | 101.5 (45.3–192.1) | 134.5 (66.6–382.9) a | 130.1 (35.1–310.0) a | 0.0002 |
| GSH (μg/mg protein) | 2.8 (1.7–3.6) | 1.3 (0.46–2.9) a | 0.71 (0.42–1.5) a | <0.0001 | 1.1 (0.54–1.9) | 0.76 (0.22–1.7) a | 0.80 (0.43–1.2) a | <0.0001 |
| Albumin (mg/mg protein) | 0.31 (0.12–0.53) | 0.23 (0.04–0.67) a | 0.15 (0.03–0.24) ab | < 0.0001 | 0.34 (0.16–0.47) | 0.15 (0.01–0.76) a | 0.16 (0.04- 0.34) a | <0.0001 |
| Salivary redox status | ||||||||
| DPPH (nmol/mg protein) | 209.5 (125.3–331.5) | 148.8 (35.7–252.0) a | 76.6 (15.7–255.3) a | <0.0001 | 307.2 (207.3–450.2) | 169.5 (28.3–404.4) a | 82.6 (21.9–284.6) a | <0.0001 |
| FRAP (µmol/mg protein) | 0.66 (0.37–0.85) | 0.45 (0.27–0.88) a | 0.41 (0.27–0.68) a | <0.0001 | 0.69 (0.50–0.94) | 0.58 (0.26–0.96) a | 0.51 (0.23–1.1) a | <0.0001 |
| Salivary glycoxidation products | ||||||||
| Dityrosine (AFU/mg protein) | 11.2 (5.5–14.9) | 14.6 (8.9–26.3) a | 15.7 (11.8–27.3) a | <0.0001 | 19.6 (14.8–25.0) | 23.2 (12.7–46.5) a | 23.6 (12.2–47.3) a | 0.0003 |
| Kynurenine (AFU/mg protein) | 3.0 (1.2–4.3) | 3.9 (2.5–8.1) a | 3.8 (2.4–5.4) a | <0.0001 | 4.6 (3.5–6.5) | 5.6 (1.9–10.8) a | 6.2 (3.7–11.5) a | 0.0005 |
| N-formylkynurenine (AFU/mg protein) | 0.99 (0.39–1.6) | 1.6 (0.91–2.8) a | 2.0 (1.4–3.0) a | <0.0001 | 1.8 (1.1–2.5) | 2.1 (1.1–4.1) a | 1.8 (0.99–3.8) | 0.0357 |
| Tryptophan (AFU/mg protein) | 44.1 (27.6–60.7) | 37.7 (10.2– 84.1) | 34.2 (10.2–61.5) a | 0.029 | 63.4 (46.8–82.2) | 57.7 (35.9–94.3) | 50.0 (13.9–96.4) a | 0.0064 |
| Glycophore (AFU/mg protein) | 10.0 (8.3–12.4) | 12.3 (8.8–23.0) a | 15.2 (11.1–20.8) a | <0.0001 | 10.2 (8.6–12.6) | 13.9 (3.4–25.6) a | 18.2 (7.1–23.9) a | <0.0001 |
| Salivary nitrosative stress | ||||||||
| MPO (mU/mg protein) | 0.20 (0.04–0.39) | 0.47 (0.23–0.77) a | 0.70 (0.46–1.1) a | <0.0001 | 0.31 (0.08–0.57) | 0.46 (0.21–0.77) a | 0.45 (0.17–0.86) a | <0.0001 |
| NO (µmol/mg protein) | 279.9 (121.7–524.3) | 196.9 (55.7–403.6) a | 135.8 (23.8–275.4) a | <0.0001 | 307.8 (196.6–414.8) | 285.6 (139.7–389.7) | 222.4 (40.1–399.8) ab | 0.0004 |
| Peroxynitrite (µmol/mg protein) | 4.1 (2.6–5.4) | 7.1 (2.6–18.8) a | 10.3 (5.0–16.6) a | <0.0001 | 8.9 (3.0–15.7) | 13.1 (7.4–47.6) a | 16.4 (7.6–40.5) a | <0.0001 |
| S-nitrosothiols (µmol/mg protein) | 3.1 (0.64–4.9) | 3.7 (1.6–9.9) a | 3.6 (2.2–8.0) a | 0.0099 | 3.9 (2.1–5.6) | 4.5 (3.0–9.7) | 4.1 (1.4–9.4) | 0.0582 |
| Nitrotyrosine (µmol/mg protein) | 184.6 (55.8–358.4) | 272.4 (116.7–861.2) a | 348.2 (106.5–610.7) a | <0.0001 | 157.9 (59.1–350.6) | 234.9 (65.2–475.9) a | 246.2 (109.2–411.2) a | 0.0006 |
| NWS | SWS | ||||||||||||||||||||||
|---|---|---|---|---|---|---|---|---|---|---|---|---|---|---|---|---|---|---|---|---|---|---|---|
| C | HF NS | HF HS | C | HF NS | HF HS | ||||||||||||||||||
| FR | TP | SA | FR | TP | SA | FR | TP | SA | FR | TP | SA | FR | TP | SA | FR | TP | SA | ||||||
| Salivary antioxidants | |||||||||||||||||||||||
| TPC | −0.072 0.001 | 0.37 0.008 | −0.089 0.537 | −0.018 0.928 | 0.001 0.998 | 0.395 0.041 | 0.748 <0.0001 | 0.779 < 0.0001 | 0.802 <0.0001 | 0.13 0.369 | 0.132 0.359 | 0.455 0.001 | 0.999 <0.0001 | 0.014 0.945 | −0.013 0.949 | 0.069 0.755 | 0.143 0.514 | −0.025 0.911 | |||||
| AA | 0.051 0.726 | 0.21 0.143 | −0.112 0.44 | −0.054 0.788 | −0.466 0.014 | −0.154 0.444 | 0.933 <0.0001 | 0.959 <0.0001 | 0.979 <0.0001 | 0.457 0.001 | −0.338 0.016 | 0.099 0.492 | 0.133 0.507 | 0.344 0.079 | 0.837 <0.0001 | −0.559 0.006 | 0.22 0.312 | −0.206 0.347 | |||||
| UA | 0.135 0.352 | −0.029 0.84 | 0.16 0.267 | 0.15 0.455 | −0.175 0.382 | 0.143 0.478 | −0.847 <0.0001 | −0.841 <0.0001 | −0.869 <0.0001 | −0.259 0.07 | 0.062 0.668 | −0.056 0.699 | −0.151 0.453 | 0.188 0.348 | 0.208 0.297 | −0.106 0.629 | −0.09 0.683 | −0.149 0.497 | |||||
| GSH | −0.109 0.453 | −0.154 0.287 | 0.003 0.983 | 0.011 0.957 | −0.268 0.177 | 0.228 0.253 | 0.892 <0.0001 | 0.89 <0.0001 | 0.902 <0.0001 | 0.223 0.119 | −0.119 0.411 | 0.104 0.474 | 0.142 0.481 | 0.282 0.154 | 0.431 0.025 | −0.08 0.715 | 0.168 0.444 | −0.23 0.286 | |||||
| Albumin | 0.047 0.743 | −0.149 0.3 | 0.214 0.136 | −0.054 0.788 | −0.385 0.047 | −0.022 0.913 | 0.867 <0.0001 | 0.883 <0.0001 | 0.892 <0.0001 | −0.446 0.001 | 0.204 0.156 | 0.016 0.912 | 0.175 0.382 | 0.258 0.195 | 0.37 0.058 | −0.117 0.594 | 0.152 0.488 | −0.171 0.435 | |||||
| Salivary redox status | |||||||||||||||||||||||
| DPPH | −0.235 0.1 | −0.085 0.556 | −0.061 0.675 | 0.277 0.163 | −0.118 0.556 | 0.171 0.395 | 0.902 <0.0001 | 0.934 <0.0001 | 0.959 <0.0001 | 0.047 0.745 | −0.021 0.883 | −0.037 0.801 | 0.04 0.844 | 0.203 0.309 | 0.444 0.02 | −0.238 0.274 | 0.031 0.89 | −0.022 0.922 | |||||
| FRAP | −0.152 0.291 | 0.035 0.808 | 0.077 0.594 | −0.005 0.978 | −0.41 0.034 | 0.245 0.219 | 0.823 <0.0001 | 0.855 <0.0001 | 0.845 <0.0001 | −0.081 0.575 | −0.098 0.497 | −0.08 0.582 | −0.128 0.524 | 0.244 0.22 | 0.365 0.061 | −0.206 0.345 | 0.283 0.191 | −0.288 0.183 | |||||
| Salivary glycoxidation products | |||||||||||||||||||||||
| Dityrosine | 0.075 0.603 | −0.038 0.791 | 0.1 0.488 | −0.052 0.797 | −0.262 0.187 | −0.172 0.39 | −0.763 <0.0001 | −0.863 <0.0001 | −0.861 <0.0001 | 0.005 0.973 | 0.013 0.929 | 0.099 0.495 | −0.053 0.793 | 0.56 0.002 | 0.58 0.002 | −0.33 0.124 | −0.285 0.188 | −0.18 0.412 | |||||
| Kynurenine | −0.099 0.492 | 0.099 0.494 | −0.163 0.259 | −0.013 0.949 | −0.282 0.154 | 0.143 0.447 | -0.826 <0.0001 | −0.837 <0.0001 | −0.818 <0.0001 | 0.055 0.705 | −0.287 0.043 | −0.011 0.939 | −0.038 0.849 | 0.347 0.076 | 0.412 0.033 | −0.241 0.267 | 0.222 0.308 | −0.029 0.897 | |||||
| N-formylkynurenine | 0.039 0.789 | 0.026 0.859 | −0.099 0.494 | −0.026 0.897 | −0.454 0.017 | 0.142 0.481 | −0.867 <0.0001 | −0.919 <0.0001 | −0.954 <0.0001 | −0.373 0.008 | 0.218 0.128 | −0.066 0.648 | 0.155 0.439 | 0.257 0.196 | 0.773 <0.0001 | 0.046 0.838 | −0.217 0.331 | −0.111 0.662 | |||||
| Tryptophan | −0.126 0.383 | 0.174 0.226 | 0.097 0.502 | 0.044 0.828 | −0.269 0.174 | 0.109 0.587 | 0.812 <0.0001 | 0.816 <0.0001 | 0.826 <0.0001 | 0.08 0.58 | −0.174 0.226 | −0.038 0.795 | −0.256 0.198 | −0.125 0.536 | −0.032 0.873 | −0.351 0.1 | 0.189 0.388 | −0.239 0.272 | |||||
| Glycophore | −0.178 0.215 | 0.032 0.827 | −0.2 0.164 | 0.009 0.964 | −0.152 0.449 | −0.452 0.018 | −0.839 <0.0001 | −0898 <0.0001 | −0.878 <0.0001 | 0.044 0.76 | 0.081 0.578 | 0.081 0.575 | −0.168 0.403 | 0.177 0.377 | −0.338 0.085 | −0.091 0.68 | −0.08 0.717 | 0.304 0.158 | |||||
| Salivary nitrosative stress | |||||||||||||||||||||||
| MPO | 0.215 0.134 | −0.278 0.051 | 0.286 0.044 | −0.15 0.455 | −0.288 0.145 | −0.281 0.156 | −0.825 <0.0001 | −0.786 <0.0001 | −0.842 <0.0001 | −0.28 0.49 | 0.24 0.094 | 0.191 0.184 | −0.076 0.707 | 0.205 0.305 | 0.412 0.033 | −0.36 0.092 | −0.13 0.553 | −0.045 0.837 | |||||
| NO | −0.225 0.116 | −0.055 0.703 | 0.018 0.902 | 0.14 0.487 | 0.231 0.247 | −0.288 0.145 | 0.815 <0.0001 | 0.849 <0.0001 | 0.885 <0.0001 | 0.268 0.06 | 0.057 0.697 | 0.038 0.796 | 0.102 0.613 | −0.073 0.716 | 0.061 0.762 | −0.28 0.196 | 0.093 0.673 | 0.183 0.404 | |||||
| Peroxynitrite | −0.05 0.728 | 0.045 0.754 | −0.053 0.713 | −0.209 0.296 | −0.364 0.062 | 0.023 0.91 | −0.766 <0.0001 | −0.733 <0.0001 | −0.778 <0.0001 | −0.042 0.772 | 0.141 0.33 | −0.237 0.097 | 0.263 0.185 | 0.495 0.009 | 0.515 0.006 | −0.065 0.767 | 0.062 0.778 | 0.022 0.922 | |||||
| S-nitrosothiols | 0.268 0.06 | −0.253 0.076 | 0.062 0.667 | −0.007 0.973 | −0.253 0.202 | −0.021 0.916 | −0.813 <0.0001 | −0.817 <0.0001 | −0.842 <0.0001 | −0.005 0.973 | −0.11 0.447 | 0.172 0.231 | −0.13 0.517 | 0.168 0.401 | 0.454 0.017 | −0.583 0.003 | 0.125 0.568 | −0.187 0.394 | |||||
| Nitrotyrosine | −0.002 0.99 | −0.136 0.347 | −0.122 0.399 | 0.045 0.825 | 0.311 0.114 | 0.09 0.656 | −0.784 <0.0001 | −0.832 <0.0001 | −0.862 <0.0001 | 0.133 0.358 | −0.03 0.837 | 0.185 0.198 | 0.205 0.306 | 0.115 0.567 | 0.51 0.007 | 0.1 0.65 | −0.035 0.876 | −0.01 0.964 | |||||
| NWS | SWS | |||||||||||||||
|---|---|---|---|---|---|---|---|---|---|---|---|---|---|---|---|---|
| AUC | 95% Cl | p-Value | Cut-off | Sensitivity % | 95% Cl | Specificity % | 95% Cl | AUC | 95% Cl | p-Value | Cut-off | Sensitivity % | 95% Cl | Specificity % | 95% Cl | |
| Salivary antioxidants | ||||||||||||||||
| TPC (μg/mg protein) | 0.79 | 0.6627 to 0.9106 | 0.0007 | <26.08 | 65 | 43.29 to 81.88 | 67 | 48.78 to 80.77 | 0.78 | 0.6487 to 0.9079 | 0.0009 | <51.26 | 75 | 53.13 to 88.81 | 73 | 55.55 to 85.82 |
| AA (μg/mg protein) | 0.79 | 0.6567 to 0.9233 | 0.0006 | <3.091 | 75 | 53.13 to 88.81 | 77 | 59.07 to 88.21 | 0.68 | 0.5245 to 0.8322 | 0.0341 | <4.602 | 60 | 38.66 to 78.12 | 60 | 42.32 to 75.41 |
| UA (μg/mg protein) | 0.65 | 0.4933 to 0.8067 | 0.0747 | <81.11 | 65 | 43.29 to 81.88 | 63 | 45.51 to 78.13 | 0.51 | 0.3494 to 0.6773 | 0.8741 | <132.4 | 55 | 34.21 to 74.18 | 53 | 36.14 to 69.77 |
| GSH (μg/mg protein) | 0.84 | 0.7312 to 0.9521 | <0.0001 | <0.9130 | 75 | 53.13 to 88.81 | 77 | 59.07 to 88.21 | 0.54 | 0.3772 to 0.7094 | 0.6066 | <0.7691 | 45 | 25.82 to 65.79% | 47 | 30.23 to 63.86 |
| Albumin (mg/mg protein) | 0.72 | 0.5743 to 0.8657 | 0.0089 | <0.1631 | 70 | 48.10 to 85.45 | 70 | 52.12 to 83.34 | 0.54 | 0.3746 to 0.6987 | 0.6631 | <0.1590 | 50 | 29.93 to 70.07 | 47 | 30.23 to 63.86 |
| Salivary redox status | ||||||||||||||||
| DPPH (nmol/mg protein) | 0.76 | 0.6122 to 0.9111 | 0.0019 | <117.3 | 70 | 48.10 to 85.45 | 70 | 52.12 to 83.34 | 0.71 | 0.5645 to 0.8588 | 0.0119 | <119.9 | 65 | 43.29 to 81.88 | 63 | 45.51 to 78.13 |
| FRAP (µmol/mg protein) | 0.71 | 0.5639 to 0.8528 | 0.0133 | <0.4216 | 65 | 43.29 to 81.88 | 63 | 45.51 to 78.13 | 0.64 | 0.4789 to 0.7977 | 0.1002 | <0.5474 | 60 | 38.66 to 78.12 | 60 | 42.32 to 75.41 |
| Salivary glycoxidation products | ||||||||||||||||
| Dityrosine (AFU/mg protein) | 0.66 | 0.5034 to 0.8066 | 0.0655 | >15.08 | 55 | 34.21 to 74.18 | 57 | 39.20 to 72.62 | 0.53 | 0.3580 to 0.6920 | 0.7664 | >23.40 | 55 | 34.21 to 74.18 | 53 | 36.14 to 69.77 |
| Kynurenine (AFU/mg protein) | 0.58 | 0.4220 to 0.7414 | 0.3319 | <3.807 | 55 | 34.21 to 74.18 | 53 | 36.14 to 69.77 | 0.53 | 0.3608 to 0.6926 | 0.7514 | >5.989 | 55 | 34.21 to 74.18 | 53 | 36.14 to 69.77 |
| N-formylkynurenine (AFU/mg protein) | 0.88 | 0.7999 to 0.9521 | <0.0001 | >1.165 | 77 | 59.07% to 88.21 | 76 | 62.59 to 85.70 | 0.51 | 0.3327 to 0.6883 | 0.902 | <1.916 | 58 | 36.28 to 76.86 | 57 | 39.20 to 72.62 |
| Tryptophan (AFU/mg protein) | 0.57 | 0.4059 to 0.7241 | 0.4399 | <36.55 | 55 | 34.21% to 74.18% | 57 | 39.20% to 72.62% | 0.67 | 0.5050 to 0.8283 | 0.0477 | <55.12 | 60 | 38.66 to 78.12 | 60 | 42.32 to 75.41 |
| Glycophore (AFU/mg protein) | 0.72 | 0.5726 to 0.8574 | 0.0106 | >14.33 | 65 | 43.29 to 81.88 | 63 | 45.51 to 78.13 | 0.69 | 0.5296 to 0.8404 | 0.0279 | >15.54 | 60 | 38.66 to 78.12 | 60 | 42.32 to 75.41 |
| Salivary nitrosative stress | ||||||||||||||||
| MPO (mU/mg protein) | 0.87 | 0.7717 to 0.9716 | <0.0001 | >0.5324 | 75 | 53.13 to 88.81 | 77 | 59.07 to 88.21 | 0.52 | 0.3494 to 0.6872 | 0.8276 | <0.4495 | 55 | 34.21 to 74.18 | 53 | 36.14 to 69.77 |
| NO (µmol/mg protein) | 0.69 | 0.5373 to 0.8360 | 0.0266 | <165.3 | 70 | 48.10 to 85.45 | 70 | 52.12 to 83.34 | 0.71 | 0.5483 to 0.8650 | 0.0141 | <236.7 | 70 | 48.10 to 85.45 | 77 | 59.07 to 88.21 |
| Peroxynitrite (µmol/mg protein) | 0.75 | 0.6150 to 0.8917 | 0.0026 | >8.721 | 70 | 48.10 to 85.45 | 70 | 52.12 to 83.34 | 0.52 | 0.3485 to 0.6881 | 0.8276 | >14.21 | 60 | 38.66 to 78.12 | 60 | 42.32 to 75.41 |
| S-nitrosothiols (µmol/mg protein) | 0.51 | 0.3435 to 0.6699 | 0.9369 | >3.657 | 50 | 29.93 to 70.07 | 50 | 33.15 to 66.85 | 0.63 | 0.4662 to 0.7871 | 0.1323 | <4.277 | 55 | 34.21 to 74.18 | 57 | 39.20 to 72.62 |
| Nitrotyrosine (µmol/mg protein) | 0.56 | 0.3942 to 0.7225 | 0.4882 | >308.1 | 60 | 38.66 to 78.12 | 60 | 42.32 to 75.41 | 0.55 | 0.3801 to 0.7099 | 0.5929 | >246.2 | 50 | 29.93 to 70.07 | 50 | 33.15 to 66.85 |
Publisher’s Note: MDPI stays neutral with regard to jurisdictional claims in published maps and institutional affiliations. |
© 2021 by the authors. Licensee MDPI, Basel, Switzerland. This article is an open access article distributed under the terms and conditions of the Creative Commons Attribution (CC BY) license (http://creativecommons.org/licenses/by/4.0/).
Share and Cite
Klimiuk, A.; Zalewska, A.; Knapp, M.; Sawicki, R.; Ładny, J.R.; Maciejczyk, M. Salivary Gland Dysfunction in Patients with Chronic Heart Failure Is Aggravated by Nitrosative Stress, as Well as Oxidation and Glycation of Proteins. Biomolecules 2021, 11, 119. https://doi.org/10.3390/biom11010119
Klimiuk A, Zalewska A, Knapp M, Sawicki R, Ładny JR, Maciejczyk M. Salivary Gland Dysfunction in Patients with Chronic Heart Failure Is Aggravated by Nitrosative Stress, as Well as Oxidation and Glycation of Proteins. Biomolecules. 2021; 11(1):119. https://doi.org/10.3390/biom11010119
Chicago/Turabian StyleKlimiuk, Anna, Anna Zalewska, Małgorzata Knapp, Robert Sawicki, Jerzy Robert Ładny, and Mateusz Maciejczyk. 2021. "Salivary Gland Dysfunction in Patients with Chronic Heart Failure Is Aggravated by Nitrosative Stress, as Well as Oxidation and Glycation of Proteins" Biomolecules 11, no. 1: 119. https://doi.org/10.3390/biom11010119
APA StyleKlimiuk, A., Zalewska, A., Knapp, M., Sawicki, R., Ładny, J. R., & Maciejczyk, M. (2021). Salivary Gland Dysfunction in Patients with Chronic Heart Failure Is Aggravated by Nitrosative Stress, as Well as Oxidation and Glycation of Proteins. Biomolecules, 11(1), 119. https://doi.org/10.3390/biom11010119