Article

Active Colitis-Induced Atrial Electrophysiological Remodeling

1
Department of Internal Medicine/Cardiology, Rush University Medical Center, 1750 W. Harrison St., Chicago, IL 60612, USA
2
Rush Center for Integrated Microbiome and Chronobiology Research, Rush University Medical Center, 1725 W. Harrison St., Chicago, IL 60612, USA
3
Department of Internal Medicine/Gastroenterology, Rush University Medical Center, 1725 W. Harrison St., Chicago, IL 60612, USA
*
Author to whom correspondence should be addressed.
Biomolecules 2025, 15(7), 982; https://doi.org/10.3390/biom15070982
Submission received: 28 May 2025 / Revised: 3 July 2025 / Accepted: 4 July 2025 / Published: 10 July 2025
(This article belongs to the Special Issue Molecular Advances in Inflammatory Bowel Disease)

Abstract

Patients with ulcerative colitis exhibit an increased risk for supraventricular arrhythmia during the active disease phase of the disease and show signs of atrial electrophysiological remodeling in remission. The goal of this study was to determine the basis for colitis-induced changes in atrial excitability. In a mouse model (C57BL/6; 3 months) of dextran sulfate sodium (DSS)-induced active colitis (3.5% weight/volume, 7 days), electrocardiograms (ECG) revealed altered atrial electrophysiological properties with a prolonged P-wave duration and PR interval. ECG changes coincided with a decreased atrial conduction velocity in Langendorff perfused hearts. Action potentials (AP) recorded from isolated atrial myocytes displayed an attenuated maximal upstroke velocity and amplitude during active colitis, as well as a prolonged AP duration (APD). Voltage clamp analysis revealed a colitis-induced shift in the voltage-dependent activation of the Na-current (INa) to more depolarizing voltages. In addition, protein levels of Nav1.5 protein and connexin isoform Cx43 were reduced. APD prolongation depended on a reduction in the transient outward K-current (Ito) mostly generated by Kv4.2 channels. The changes in ECG, atrial conductance, and APD were reversible upon remission. The change in conduction velocity predominantly depended on the reversibility of the reduced Cx43 and Nav1.5 expression. Treatment of mice with inhibitors of Angiotensin-converting enzyme (ACE) or Angiotensin II (AngII) receptor type 1 (AT1R) prevented the colitis-induced atrial electrophysiological remodeling. Our data support a colitis-induced increase in AngII signaling that promotes atrial electrophysiological remodeling and puts colitis patients at an increased risk for atrial arrhythmia.

1. Introduction

Ulcerative colitis (UC), one of the most common types of inflammatory bowel disease (IBD), is a chronic inflammation of the mucosa of the large intestine (colon) that is characterized by a relapsing and remitting course [1,2]. Colonic inflammation results in mucosa ulceration, colonic barrier disruption, bacterial translocation, and systemic inflammatory/immune reactions [1,2]. Indeed, IBD is an immune-mediated disease that affects organs distant from the gastrointestinal tract [3]. In the cardiovascular system, it manifests with inflammatory processes (e.g., pericarditis), arrhythmia, conduction disorders, and an increased risk for stroke [4,5,6,7]. Patients with IBD exhibit a 1.5 to 2-times higher risk for atrial fibrillation (AF) [7,8,9,10] that occurs at a younger age and in the absence of traditional cardiovascular risk factors. Episodes of AF occur during UC flares [8,9], but even in remission, patients exhibit changes in atrial electromechanical properties reflected in increased P-wave duration (Pdur), P-wave dispersion (Pdisp), atrial electromechanical delay, and reduced left atrial mechanical function [6,11,12,13,14]. The ECG parameter Pdur, Pdisp, as well as the P wave amplitude are independent predictors of an increased risk for AF [15,16,17]. The mechanisms of the colitis-induced atrial electrophysiological remodeling, or the electrophysiological phenotype underlying the ECG changes, have yet to be determined.
Alterations in Pdur and Pdisp reflect changes in the intra- and inter- atrial conductance and a heterogeneity of the atrial excitation [17,18]. Atrial conduction velocity and dispersion depend on the upstroke velocity of the action potential (AP) driven by the activation of the voltage-gated sodium (Na) channels Nav1.5 (SCN5A), the intercellular coupling through the predominant atrial gap junction proteins connexin (Cx) 43 and Cx40, the AP duration (APD), and the degree of atrial fibrotic remodeling [19,20]. A reduced Na-current (INa) density as well as a shift of the channels voltage dependence of activation impair the atrial conduction and lead to a prolonged and/or more heterogeneous cardiac excitation [21,22]. Altered Nav1.5 expression as well as gain and loss of function mutations in SCN5A have been linked to an increased propensity for AF [23,24,25]. The APD, on the other hand, depends on the balance between the voltage-dependent activation and inactivation of depolarizing currents such as the late INa (INa,L) and the current through the L-type Calcium channel (LTCC), as well as the activation of re-polarizing K-channels. At this point, it is not known how changes in atrial ion channel expression or function contribute to the observed electrophysiological changes observed in patients with active colitis.
During active colitis, patients and animal models exhibit gut dysbiosis, bacterial translocation, increased intestinal and systemic inflammation, and increased sympathetic signaling [1,2]. These changes can promote the remodeling of atrial electrophysiological properties through increased levels of inflammatory cytokines such as interleukin-1 β (IL-1β), IL-17, IL-6, tumor necrosis factor-alpha (TNF-α), and interferon-gamma (IFN-γ), changes in gut-derived metabolites such as short chain fatty acids (SCFA) and trimethylamine N-oxide (TMAO), or the elevated transfer of lipopolysaccharide (LPS) into systemic circulation [26]. Interestingly, all components also alter the renin-angiotensin system (RAS), a key mediator of inflammatory signaling [27]. An increase in angiotensinogen (Agt) expression during colitis could therefore occur through increased sympathetic signaling [28], inflammatory cytokines [29], increased renin secretion through reduced SCFAs, and enhanced ACE and AngII receptor type 1 (AT1R) signaling through LPS [30]. In our recent study, we could demonstrate increased AngII levels in the serum of a mouse model of active colitis [31].
The role of AngII in atrial electrophysiological and structural remodeling is well-established [32,33]. AngII signaling through the AT1R promotes ROS production, changes in cellular Ca2+ handling properties, and the cellular AP [34]. However, whether a change in AngII signaling contributes to the observed alterations in atrial electrophysiology during active colitis remains to be determined.
In this study, using an animal model of dextran sulfate sodium (DSS)-induced active colitis, we aim to determine the mechanism of colitis-induced atrial electrophysiological remodeling and to test the hypothesis that a colitis-induced increase in AngII/AT1R signaling alters atrial ECG parameters by attenuating atrial conductance and prolonging the APD as a consequence of reduced INa and Ito availability, respectively.

2. Materials and Methods

2.1. Animals

Three- to six-month-old male mice (C57BL/6; The Jackson Laboratory, Bar Harbor, ME USA) were used for the study. Active colitis was induced by treating mice with DSS (MW: 36–50 kDa, MP Biomedicals, Irvine, CA, USA)-supplemented drinking water (3.5% weight/volume, 7 days; Figure 1a) as previously described [31]. For this purpose, CTL mice and DSS-treated mice were both supplied with water bottles one day before DSS supplementation. DSS-induced damage occurs predominantly in the distal part of the colon, reflecting the disease phenotype of ulcerative colitis [35]. Development of colitis was quantified in vivo as previously described using the animal’s body weight, stool consistency, and rectal bleeding to determine the disease activity index (DAI) [31,36]. Peak DAI at day 3 after DSS treatment was defined as active colitis (DSSA), whereas the return of DAI to the baseline 21 days after removal of DSS was defined as remission (DSSR) [31,37]. To evaluate the contribution of AngII signaling to the colitis-induced changes in cardiac electrophysiology, animals were treated with the ACE inhibitor Perindopril (intraperitoneal, ip: 3 mg/kg/day; Sellek Chemicals, Huston, TX, USA) [31,38] or the AT1R blocker Losartan (ip: 30 mg/kg/day; Sellek Chemicals, Huston, TX, USA) starting on day 5 of DSS treatment until sacrifice (DSSi(ACE), DSSi(AT1R), Figure 1a). CTL animals were treated with the drugs for the equivalent amount of time. All animal procedures were performed with the approval of the IACUC of Rush University (protocol code #22-034 approved 13 July 2022) and in accordance with the National Institute of Health’s Guide for the Care and Use of Laboratory Animals.

2.2. Electrocardiogram Recordings

In isoflurane-anesthetized mice (induction: 4%; maintenance: 2%; O2: 0.8–1.0 L/min), ECG recordings were performed using a Mouse Surgical Monitor (Indus Instruments, Webster, TX, USA) [39]. Data were digitized (4 kHz; PowerLab 8/35, AD instruments, Colorado Springs, CO, USA) and analyzed with LabChart 8 (AD instruments, Colorado Springs, CO, USA). ECGs were recorded continuously after a 10-min adaptation period. All ECG recordings were performed between 8:00–10:00 AM to minimize circadian variation in heart rate [31,39].

2.3. Isolated Langendorff Perfused Hearts

Mouse hearts were isolated, then a perfusion cannula was inserted into the aorta and connected to a Langendorff perfusion system (Harvard Apparatus, Holliston, MA, USA). The heart was continuously perfused with Krebs-Hänseleit solution containing (in mmol/L): 119 NaCl, 4 KCl, 1.2 KH2PO4, 25 NaHCO3, 10 Glucose, 2 Na Pyruvate, 2 MgSO4, 1.8 CaCl2; at 37 °C, 95% O2–5% CO2, pH of 7.4) [34]. Atrial electrograms were recorded using multielectrode arrays (FlexMEA36; Multichannel Systems, Reutlingen, Germany) placed on the left atrial epicardial surface. The array that consists of 36 gold electrodes with a diameter of 50 mm and an interelectrode distance of 300 mm was placed on the atrial epicardial surface. Atrial electrograms were recorded continuously during the adaptation period (15 min) and the experimental protocol. Electrograms were analyzed for their field potential duration (FPdur), FP dispersion (FPdisp), and conduction velocity using Cardio2D+ (V 2.16.5, Multichannel Systems, Reutlingen, Germany) as previously described [31,39].

2.4. Current and Voltage Clamp Recordings

Patch clamp recordings (MultiClamp 700A, Axon Instruments, Molecular Devices, San Jose, CA, USA) on isolated atrial myocytes were performed at room temperature, in the whole cell, current- (APs) and voltage-clamp (Na- and K- currents, INa, IK) configuration. For AP and IK recordings, the extracellular solution contained (in mmol/L) 140 NaCl, 5 KCl, 1 MgCl2, 1 CaCl2, 10 D-Glucose, 10 HEPES, and pH = 7.4 (NaOH), and intracellular solutions contained (in mmol/L) 140 KCl, 5 NaCl, 4 MgATP, 5 EGTA, 10 HEPES, pH = 7.2 (KOH). To record INa, the extracellular solution contained (in mmo/L) 130 NaCl, 10 CsCl, 1 MgCl2, 1 CaCl2, 10 D-Glucose, 10 HEPES, 0.005 Nifedipine, and pH = 7.4 (NaOH), and the intracellular contained (in mmo/L): 130 CsCl, 10 NaCl, 5 MgATP, 5 EGTA, 10 HEPES, and pH = 7.2 (CsOH). INa was further normalized to the maximum peak current (Imax) and fit to a two-state Boltzmann distribution: I/Imax = (1 + exp[ze(VV1/2)/kT])−1, where V1/2 is the potential of half-maximal activation (V1/2a) and inactivation (V1/2i), k is the Boltzmann constant, z is the apparent gating charge, T the absolute temperature, and kT/e = 25 mV at 22 °C.
For atrial myocyte AP recordings, a holding current was applied to maintain Vm at −85 mV, and APs were induced by current injection at a frequency of 1 Hz. Holding currents did not vary significantly between groups (CTL: −91.65 ± 47.86 pA; DSSA: −77.90 ± 32.59 pA; DSSR: −97.73 ± 73.26 pA), excluding differences in diastolic current. To quantify INa and IK activation, cells were held at a holding potential of −80 mV, and hyper- and de-polarizing pulses of 500 ms duration were applied in 5 mV increments from −140 mV to +100 mV (protocol ). The INa voltage-dependent inactivation was determined at the end of the test pulse by clamping the cell to −20 mV (50 ms), before return to the holding potential. Data were digitized (Digidata1322A at 10 kHz) and analyzed with Clampex 8.2 and Clampfit 11.2, respectively (Molecular Devices, San Jose, CA, USA). All whole-cell currents were normalized to cell capacitance (pA/pF) and are presented in dependence on membrane voltage (Vm).

2.5. Isolation of Mouse Atrial Myocytes

Atrial myocytes were isolated by Langendorff perfusion and enzymatic digestion as previously described [40,41]. In short, the atria were dissected, cut into strips and incubated in digestion buffer (mg/L); 0.1 Liberase TM (Roche, Indianapois, IN, USA), 0.14 trypsin (Thermo Fisher Scientific, Waltham, MA, USA), and 1 Protease type XIV (Sigma-Aldrich Inc., St. Louis, MO, USA) for 20 min at 37 °C. Digestion was stopped by addition of bovine calf serum (Hyclone, Thermo Fisher Scientific, Waltham, MA, USA) before Ca2+ in the solution was reintroduced in a stepwise manner.

2.6. Protein Quantification by Western Blot

Protein quantification and immunoblotting were performed as previously described [34,39]. In short, freshly isolated atrial tissue was washed and rapidly frozen in liquid nitrogen. Tissue was lysed in hot 1-X- Laemmli sample buffer and protein quantified using a BCA protein assay kit (Thermo Fisher Scientific, Waltham, MA, USA). SDS-PAGE was performed on a 4–20% Tris-Glycine gel with 30–40 μg of protein loaded. After protein transfer, membranes were stained with Ponceau S for total protein quantification and incubated with primary antibodies overnight (4 °C) against Cx43 (1:20,000, C619, Sigma- Aldrich Inc. St. Louis, MO, USA) and SCN5A (1:10,000, ASC-005, Alamone). Species-specific horseradish peroxidase-conjugated secondary antibodies were used, and visualization was accomplished by Western PierceTM enhanced chemiluminescence (Thermo Fisher Scientific, Waltham, MA, USA). The Syngene PXi 6 imager in combination with the GeneSYS software (Syngene) was used for image acquisition. Changes in protein level were quantified with ImageJ version 1.54 (U.S. National Institutes of Health, Bethesda, MD, USA).

2.7. Chemicals

All reagents were purchased from Sigma Aldrich, except for LiberaseTM (Roche, Indianapois, IN, USA), Perindropil L-arginine (Sellek Chemicals, Huston, TX, USA), dextran sulfate sodium salt (MP Biomedicals, Irvine, CA, USA), trypsin (Thermo Fisher Scientific, Waltham, MA, USA), and bovine calf serum (Hyclone, Thermo Fisher Scientific, Waltham, MA, USA).

2.8. Statistic

A Shapiro-Wilk test was performed to assess the normal distribution of the data. Comparisons are made using a Student’s t-test (2 data groups) or one-way ANOVA (>3 data groups) with Tukey’s multiple comparison test. When the Shapiro–Wilk test revealed a non-parametric distribution, the one-way ANOVA on ranks, or Mann–Whitney U test were used as indicated. Data are presented when possible as scatter plots, as mean ± standard deviation (SD), or ±standard error mean (SEM) in case of the current voltage relationships. The number of experiments is provided as number of mice/hearts for ECG, Langendorff, and MEA recordings, or as the number of cells obtained from the respective number of isolations (cells/mice). The level of significance was set at p < 0.05.

3. Results

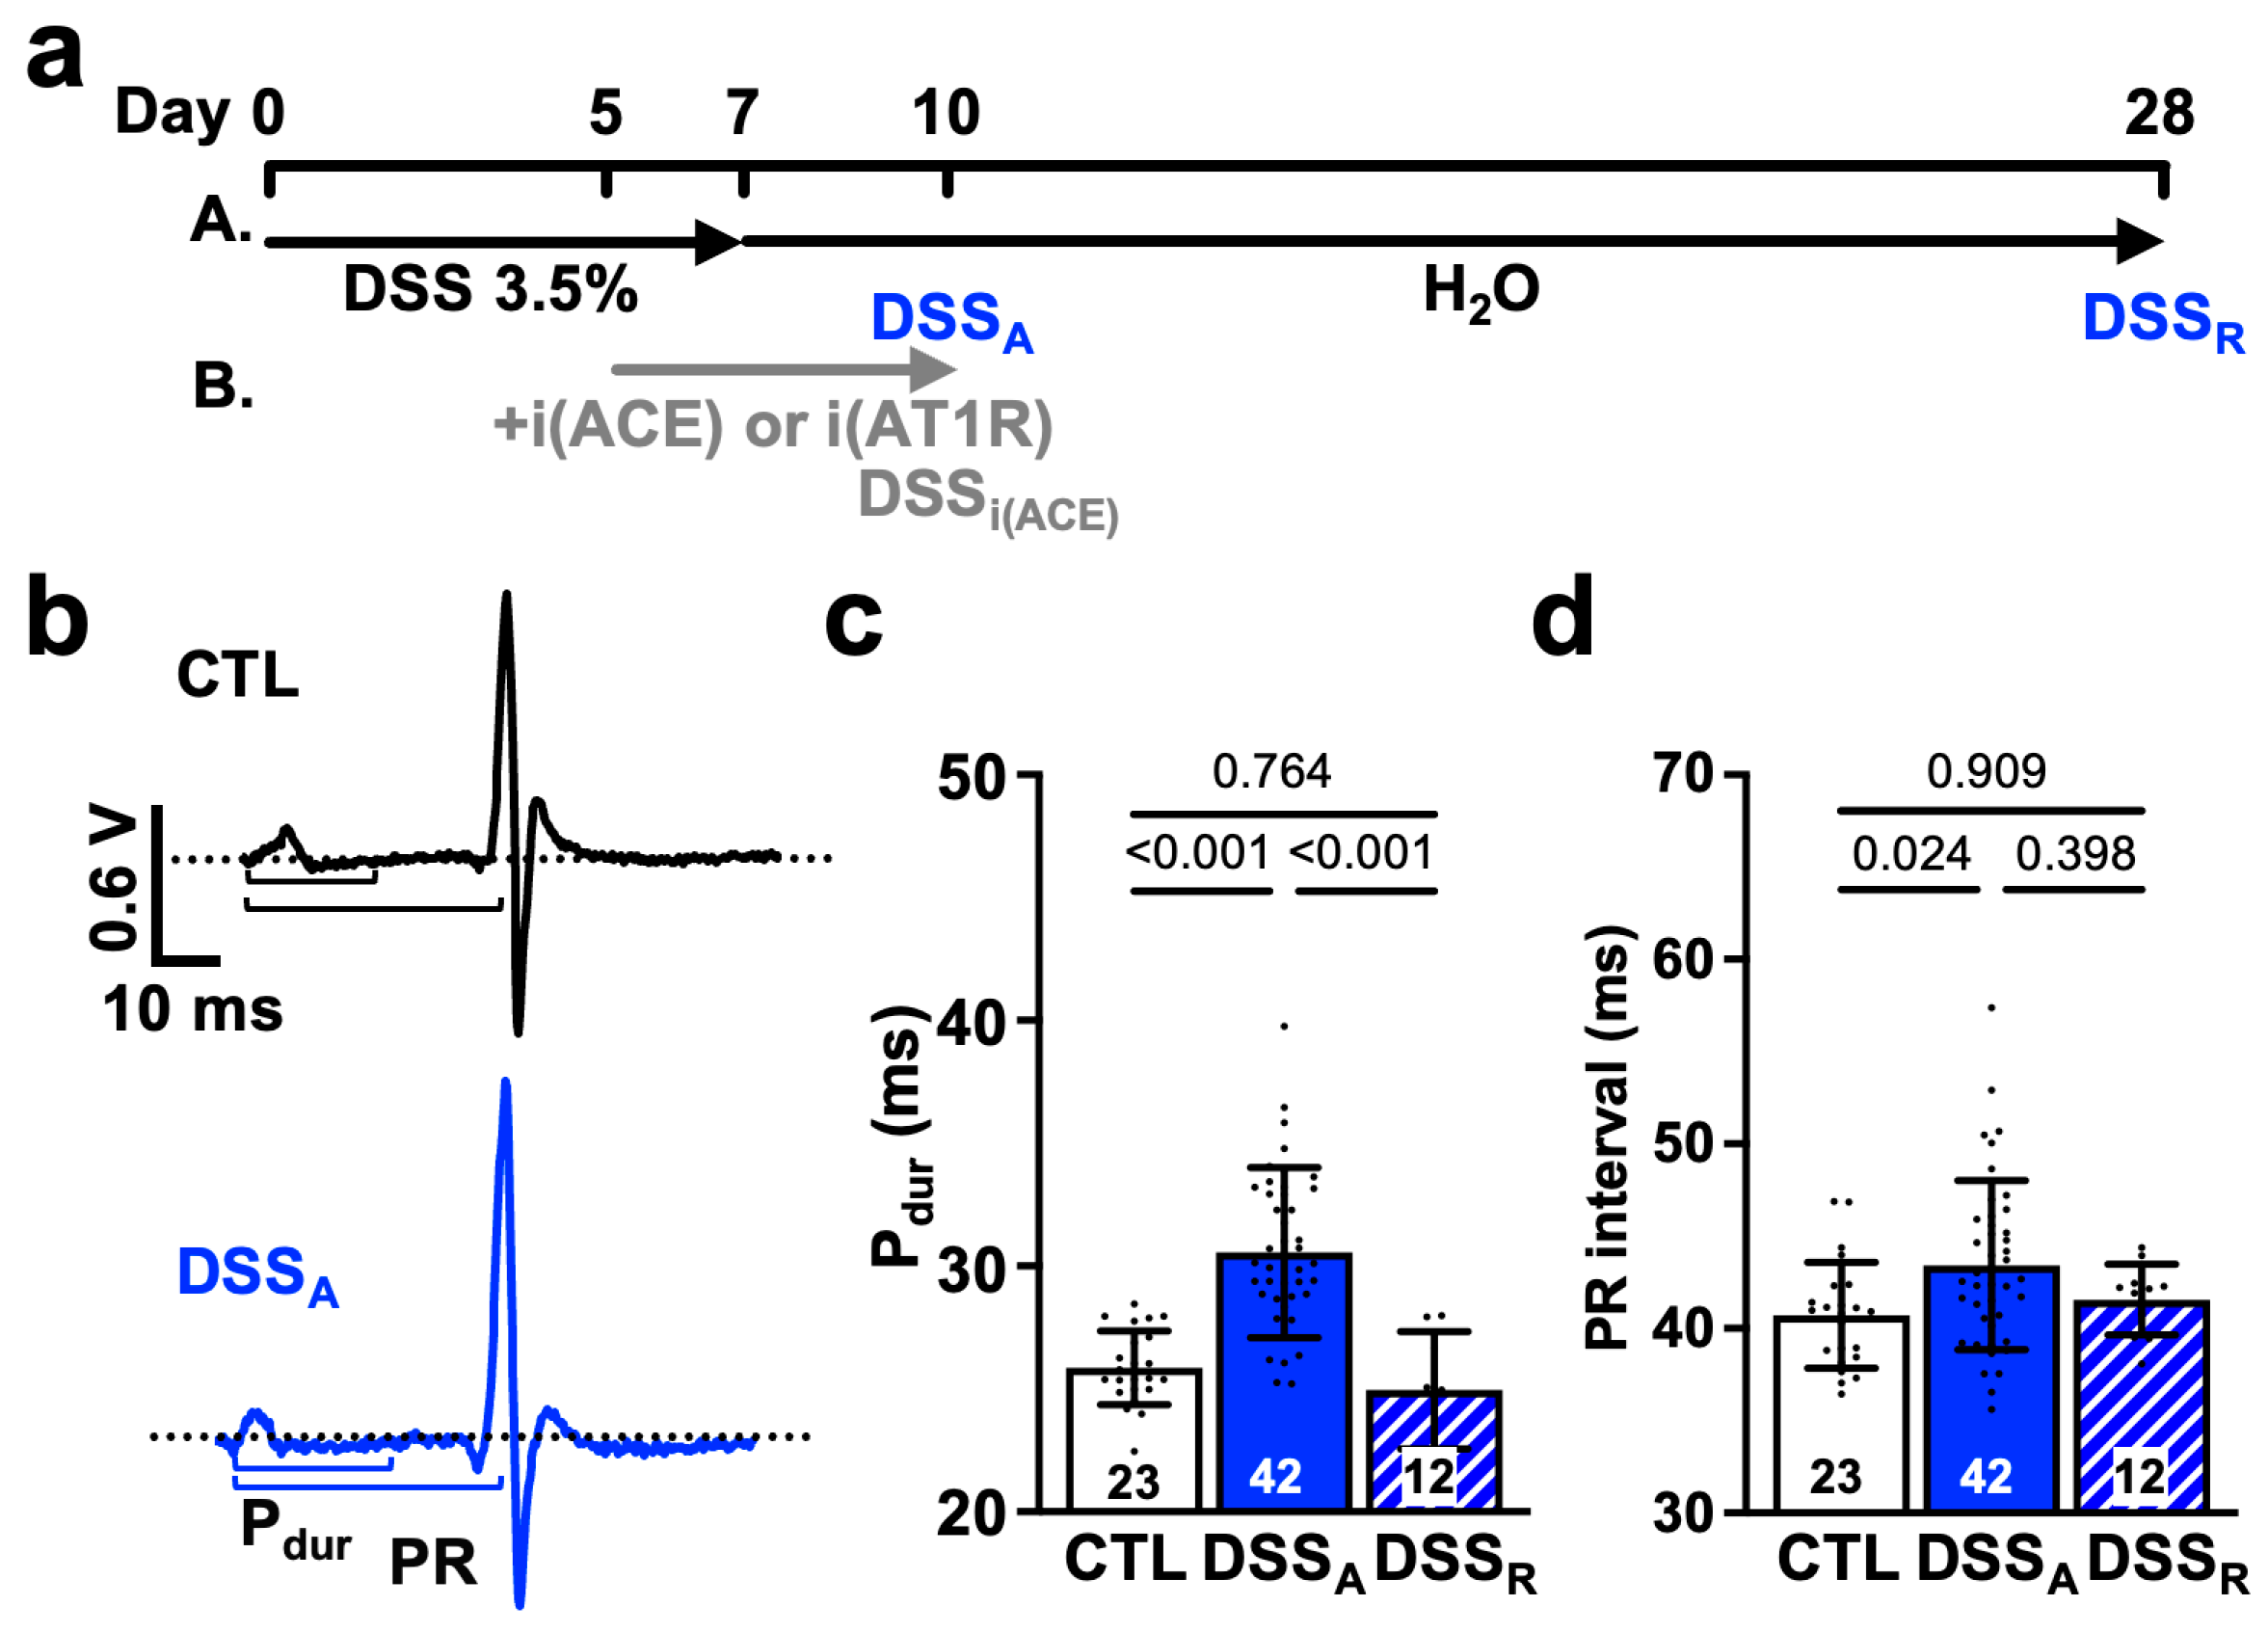
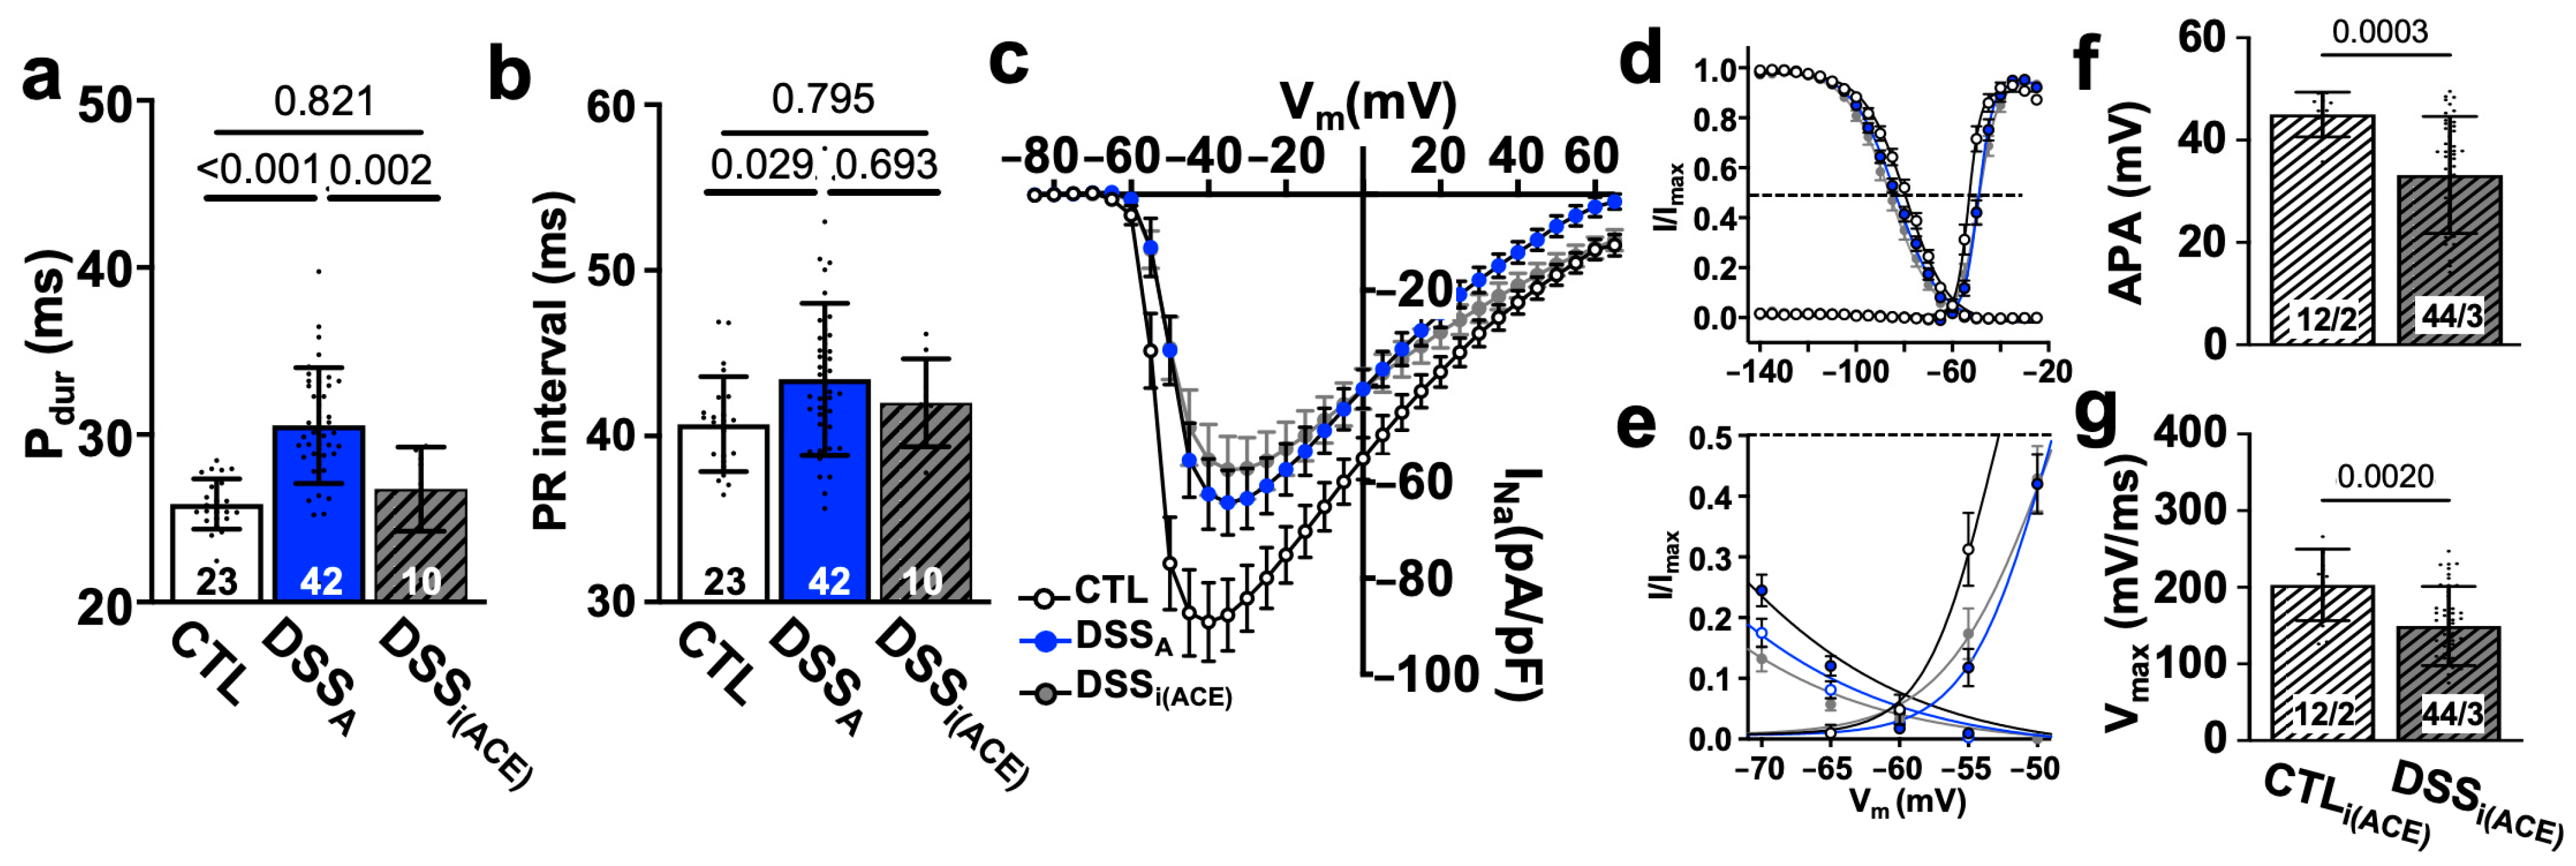
3.1. Change in Atrial Electrophysiological Properties During Active Colitis

Clinical studies show that patients with active colitis exhibit an increased propensity for AF [7,8,9]. To determine the mechanism of colitis-induced remodeling of atrial electrophysiological properties, we used a mouse model of DSS-induced active colitis and compared atrial ECG parameters from control (CTL) mice with those from mice with active colitis (DSSA) and in remission (DSSR; Figure 1a(A)). Despite comparable heart rates under basal conditions [31], DSSA mice exhibited a prolonged Pdur and PR interval (Figure 1b–d). These changes in atrial electrophysiological properties were reversible upon remission. In vivo, the heart is under the persistent control of the autonomic nervous system. To determine if the changes in atrial electrophysiology are intrinsic to the heart (independent of the autonomic control), hearts were isolated, perfused in the Langendorff configuration, and MEAs were used for the recording of left atrial electrograms [39,42]. MEA recordings revealed an attenuated left atrial conduction velocity in DSSA atria that recovered upon remission (Figure 2a,b). The data support that active colitis induces reversible atrial electrophysiological remodeling and that clinical observations of atrial electrophysiological changes are recapitulated in the DSS mouse model of active colitis.

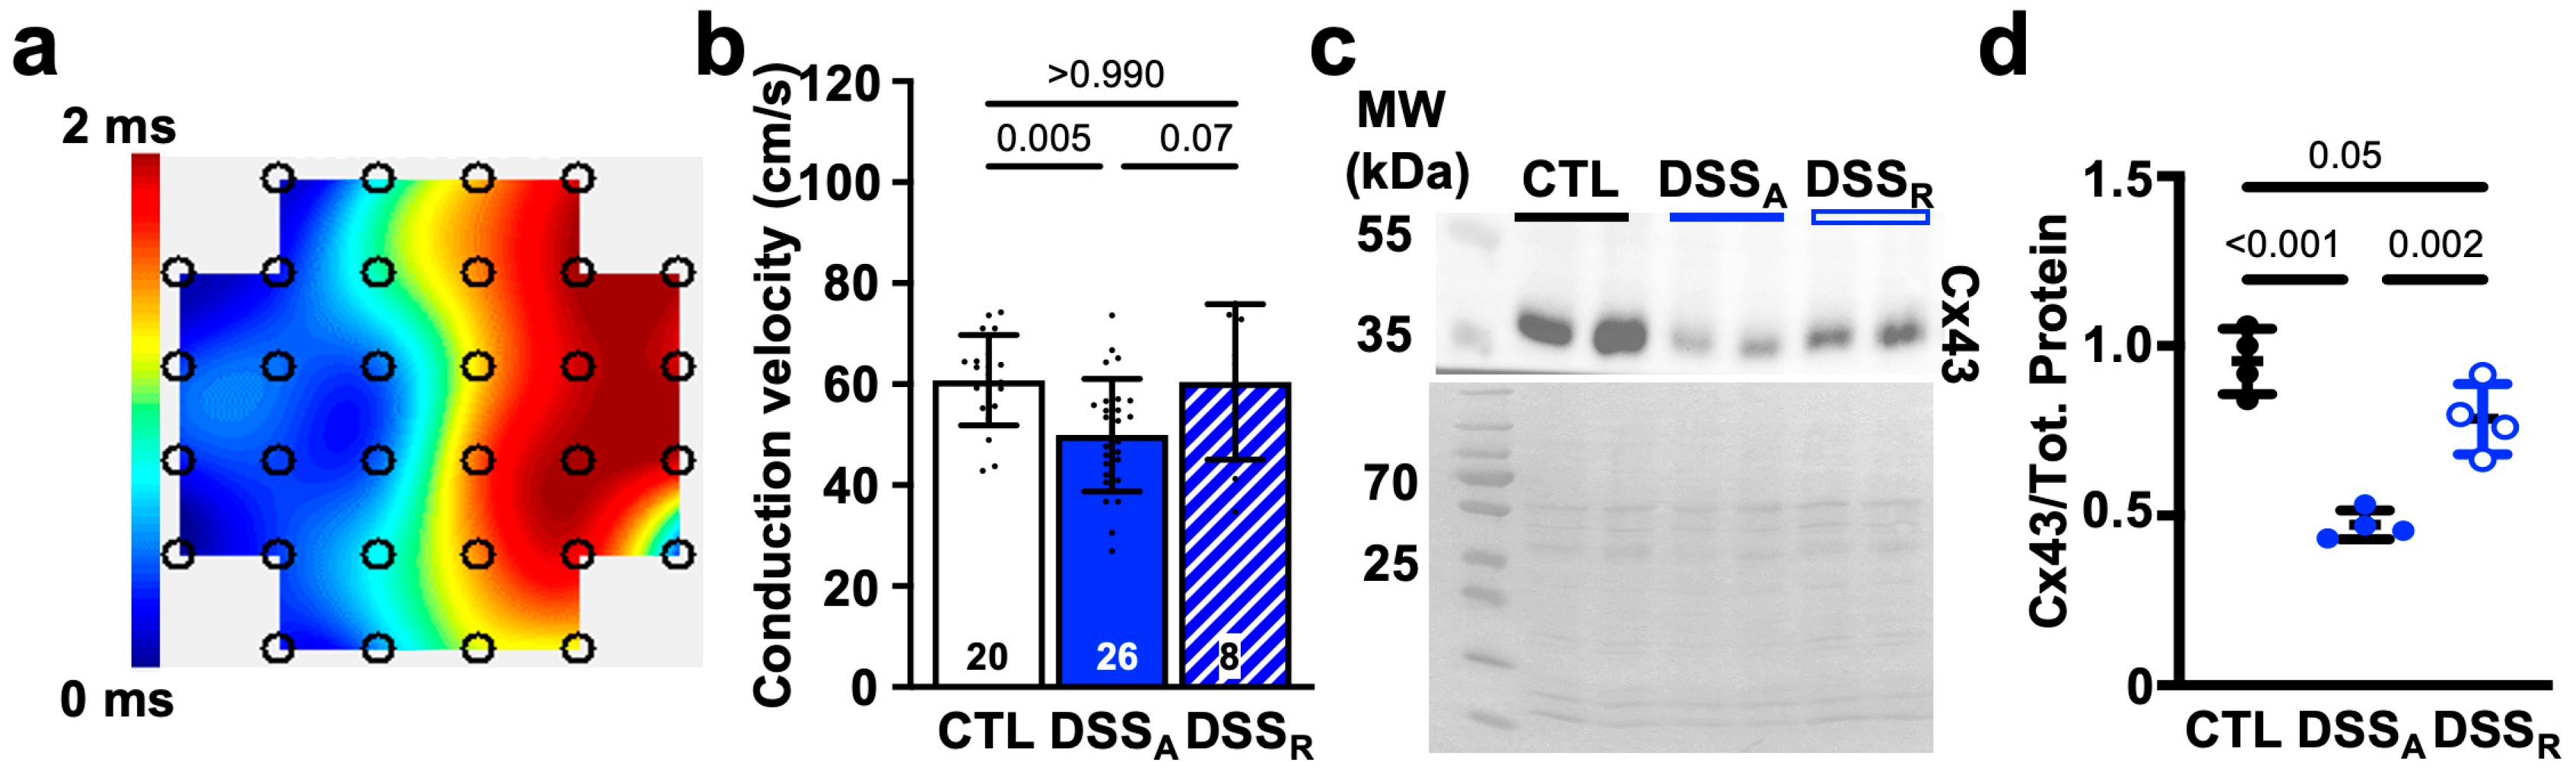
3.2. Colitis-Induced Changes of the Atrial Conduction Velocity

Changes in atrial conduction velocity are often the consequence of an attenuated intercellular conductance established through the atrial gap junction proteins Cx40 and Cx43 [43,44], or an attenuated AP upstroke velocity caused by altered INa density or activation kinetic [45,46]. To determine if changes in atrial conductance depended on a change in intercellular coupling, we quantified left atrial Cx43 expression. A significant reduction in Cx43 protein was determined during active colitis that recovered upon remission (Figure 2c,d). To further evaluate changes in cellular excitability, we performed current clamp recordings in isolated atrial myocytes from CTL, DSSA, and DSSR mice. AP recordings from atrial myocytes of DSSA hearts displayed an attenuated maximal AP upstroke velocity (Vmax, Figure 3a,b), a delayed AP rise time (time from 50% or 10% to peak amplitude; Figure 3c,d), and an attenuated AP amplitude (APA) compared to myocytes from CTL and DSSR mice (Supplemental Information (SI) Figure S1).
To determine if the attenuated AP upstroke velocity is a consequence of an altered INa, current voltage relationships were recorded from isolated CTL, DSSA, and DSSR atrial myocytes in the whole-cell voltage clamp configuration. To quantify the voltage dependent activation, INa was elicited from a holding potential of −80 mV, and the voltage dependent activation and inactivation was quantified. In DSSA myocytes, the current density of INa (Figure 4a,b) was reduced and the voltages at half maximal activation (V1/2a) and inactivation (V1/2i) of INa were significantly shifted to more positive and negative voltages, respectively (Figure 4c,d, Table 1). The reduced INa density during active colitis was consistent with reduced protein levels of Nav1.5 quantified by western blotting (Figure 4e) that recovered during remission. The Nav1.5 protein ran slightly above the expected molecular weight, potentially reflecting the glycosylated form of the channel [47]. Interestingly, while INa density recovered to CTL levels upon remission, the activation and inactivation kinetic of the current remained attenuated compared to CTL. The experimental data suggest that active colitis attenuates atrial conduction velocity by reducing the availability of Nav1.5 and by attenuated Cx43 expression.

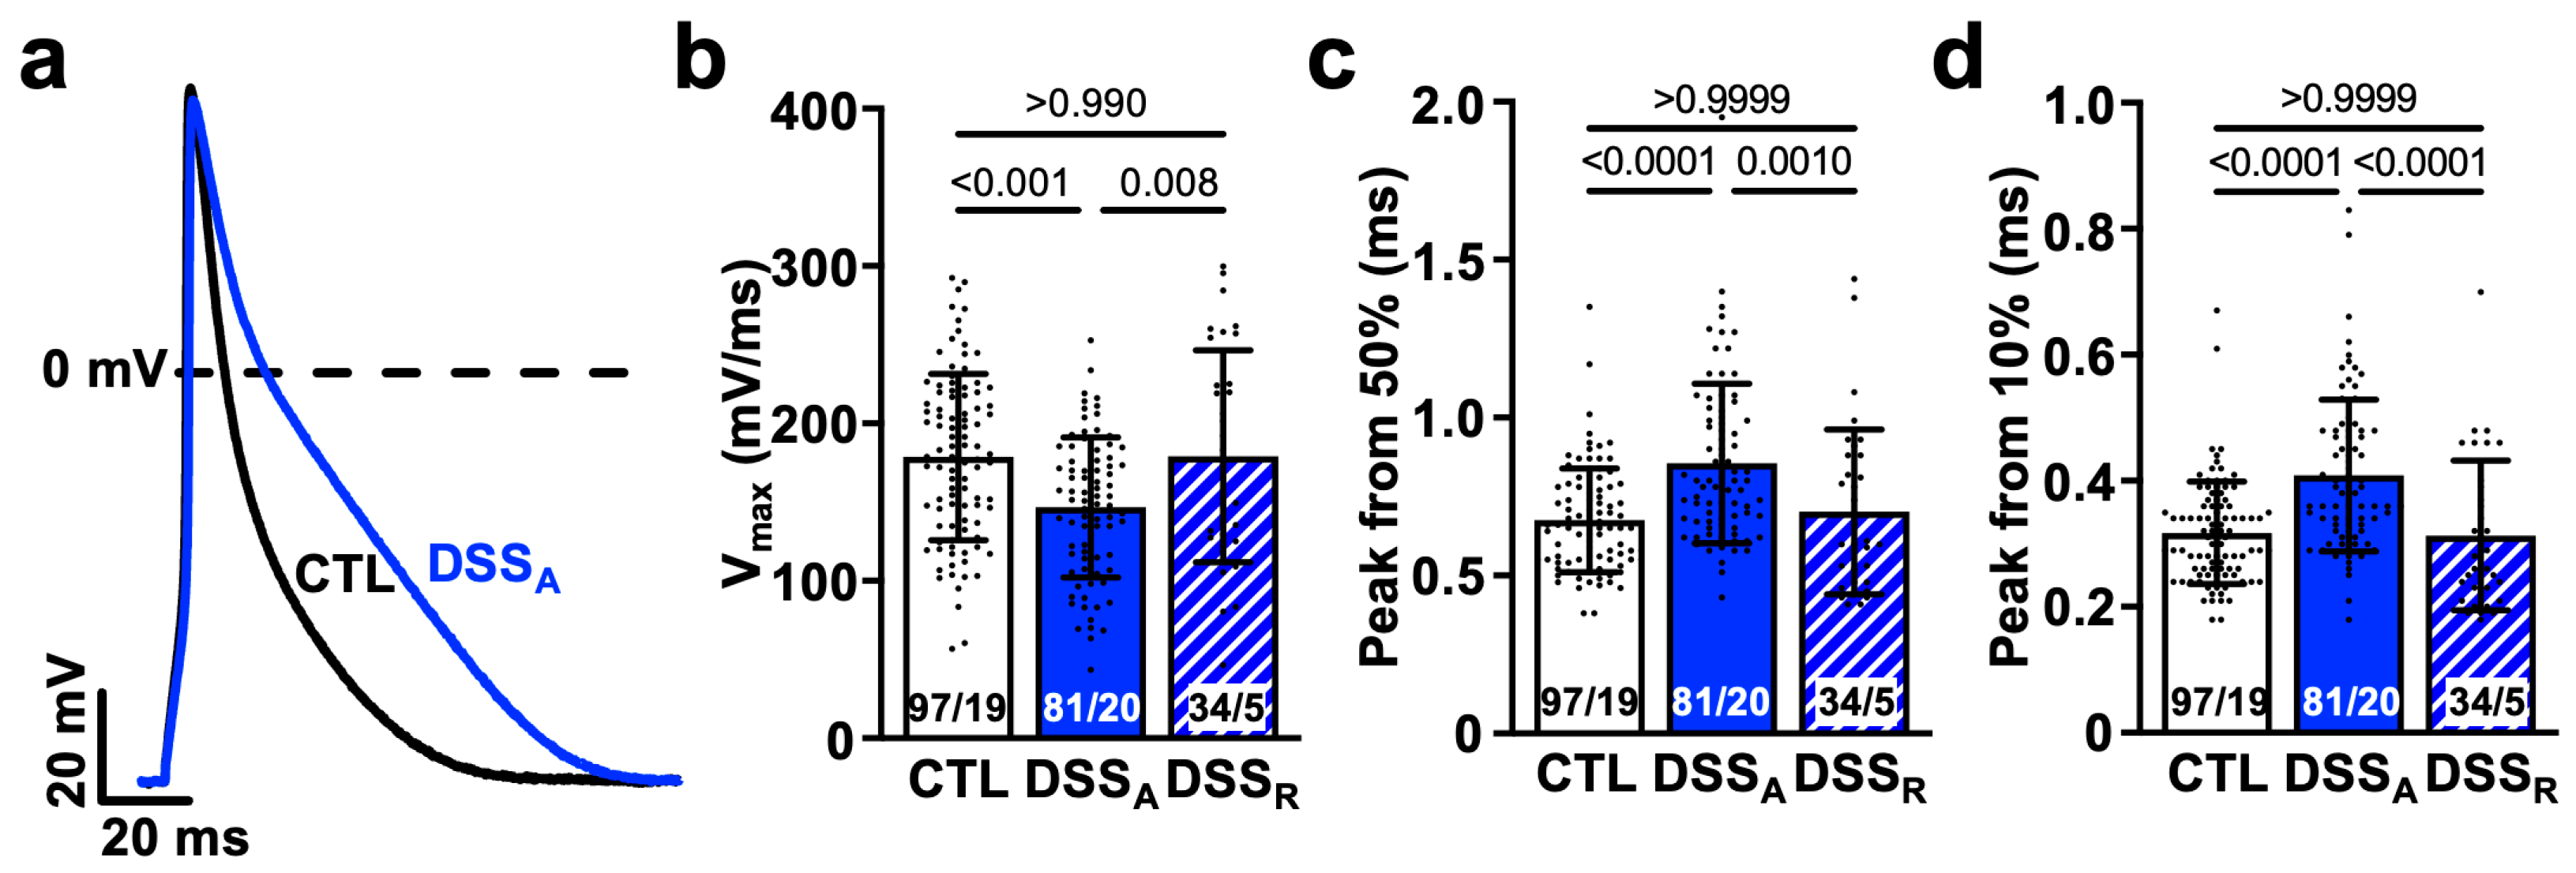
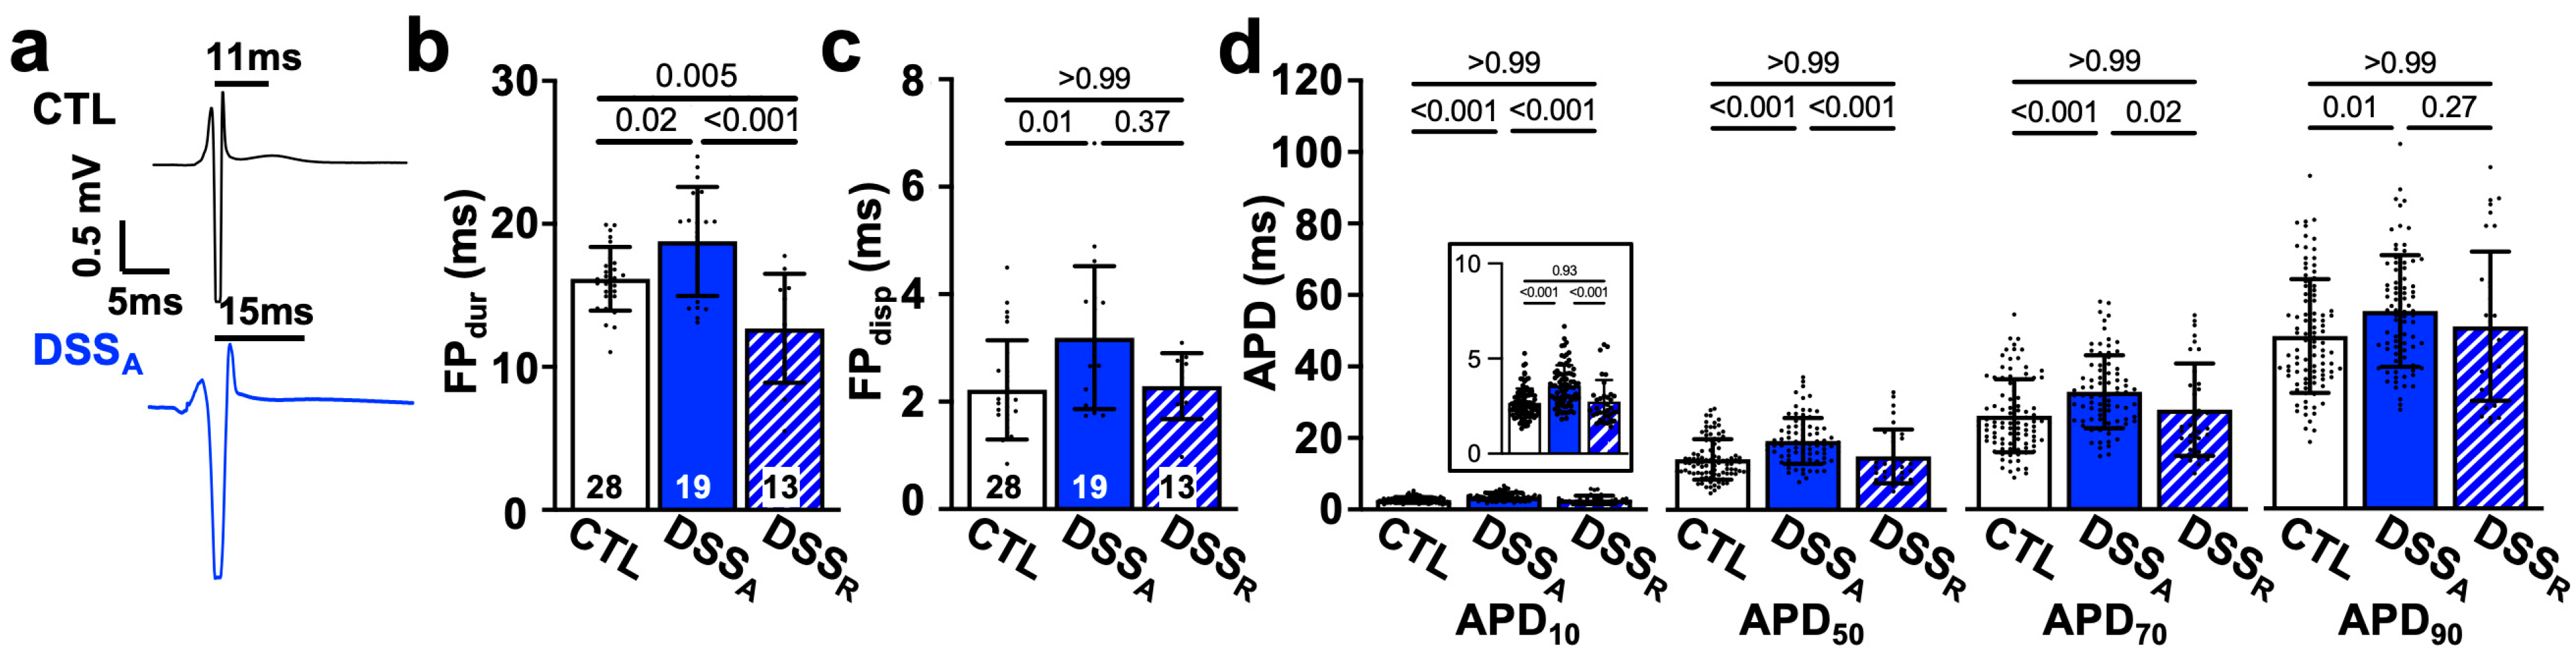
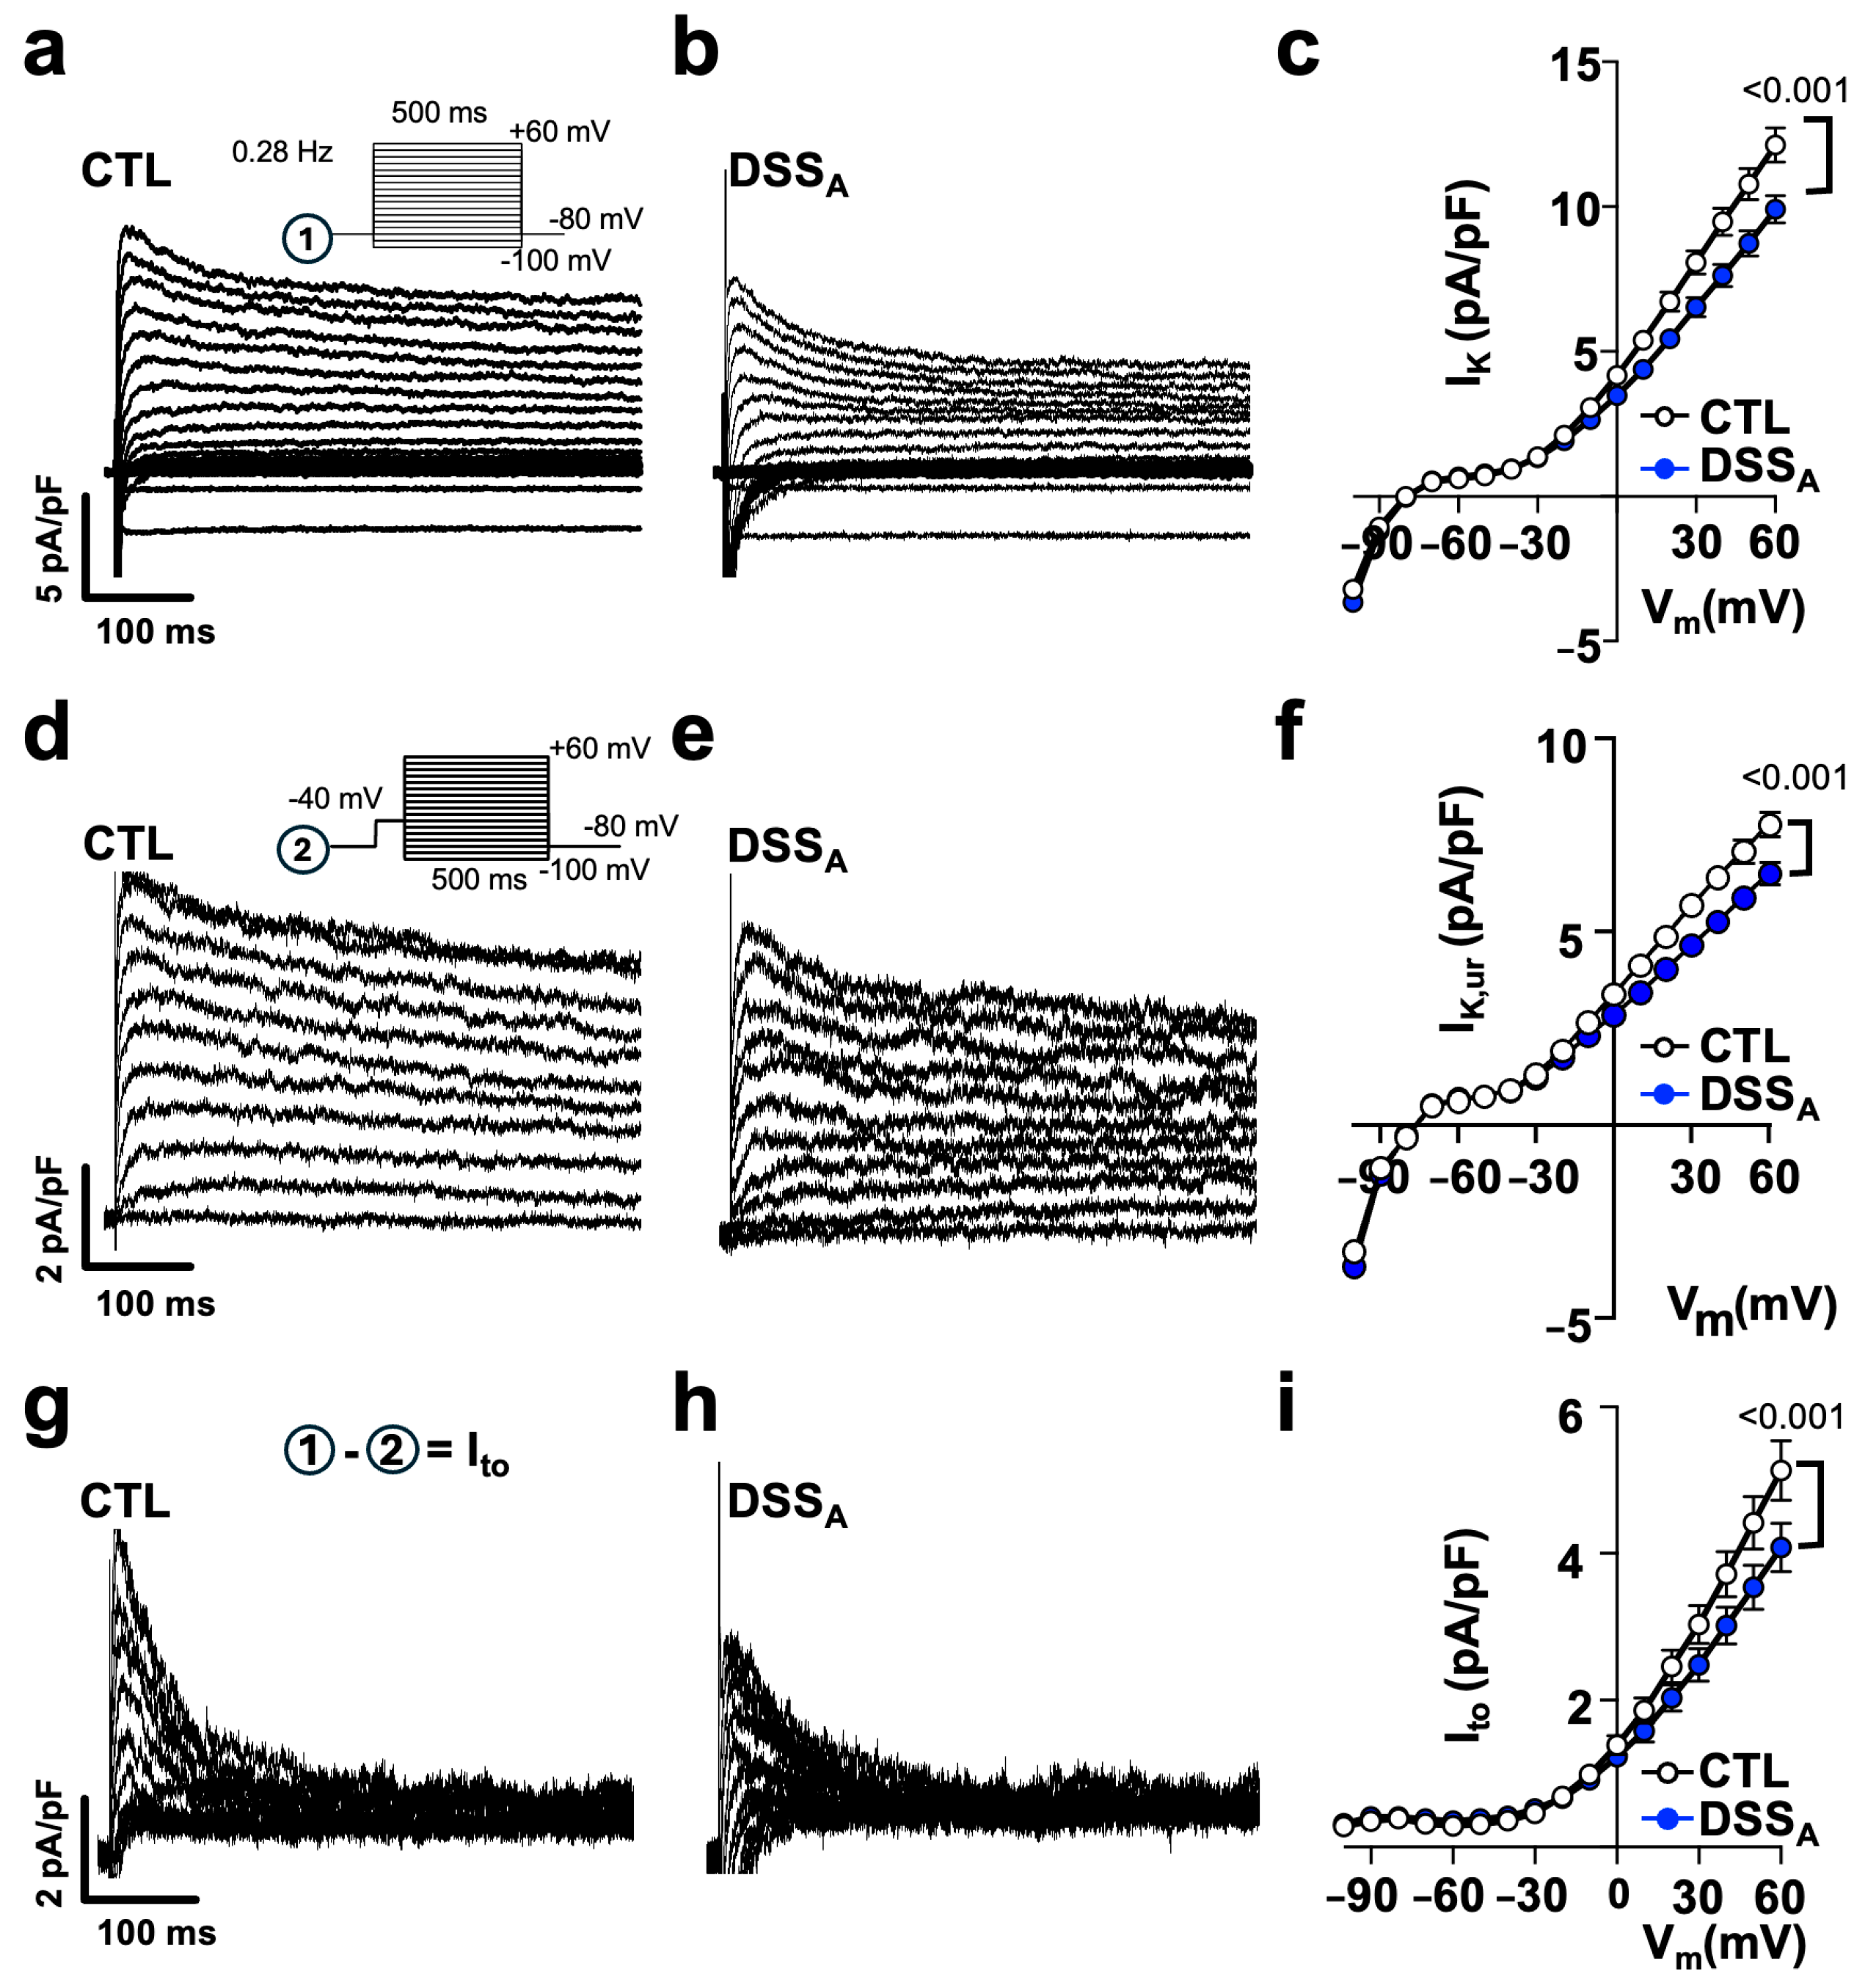
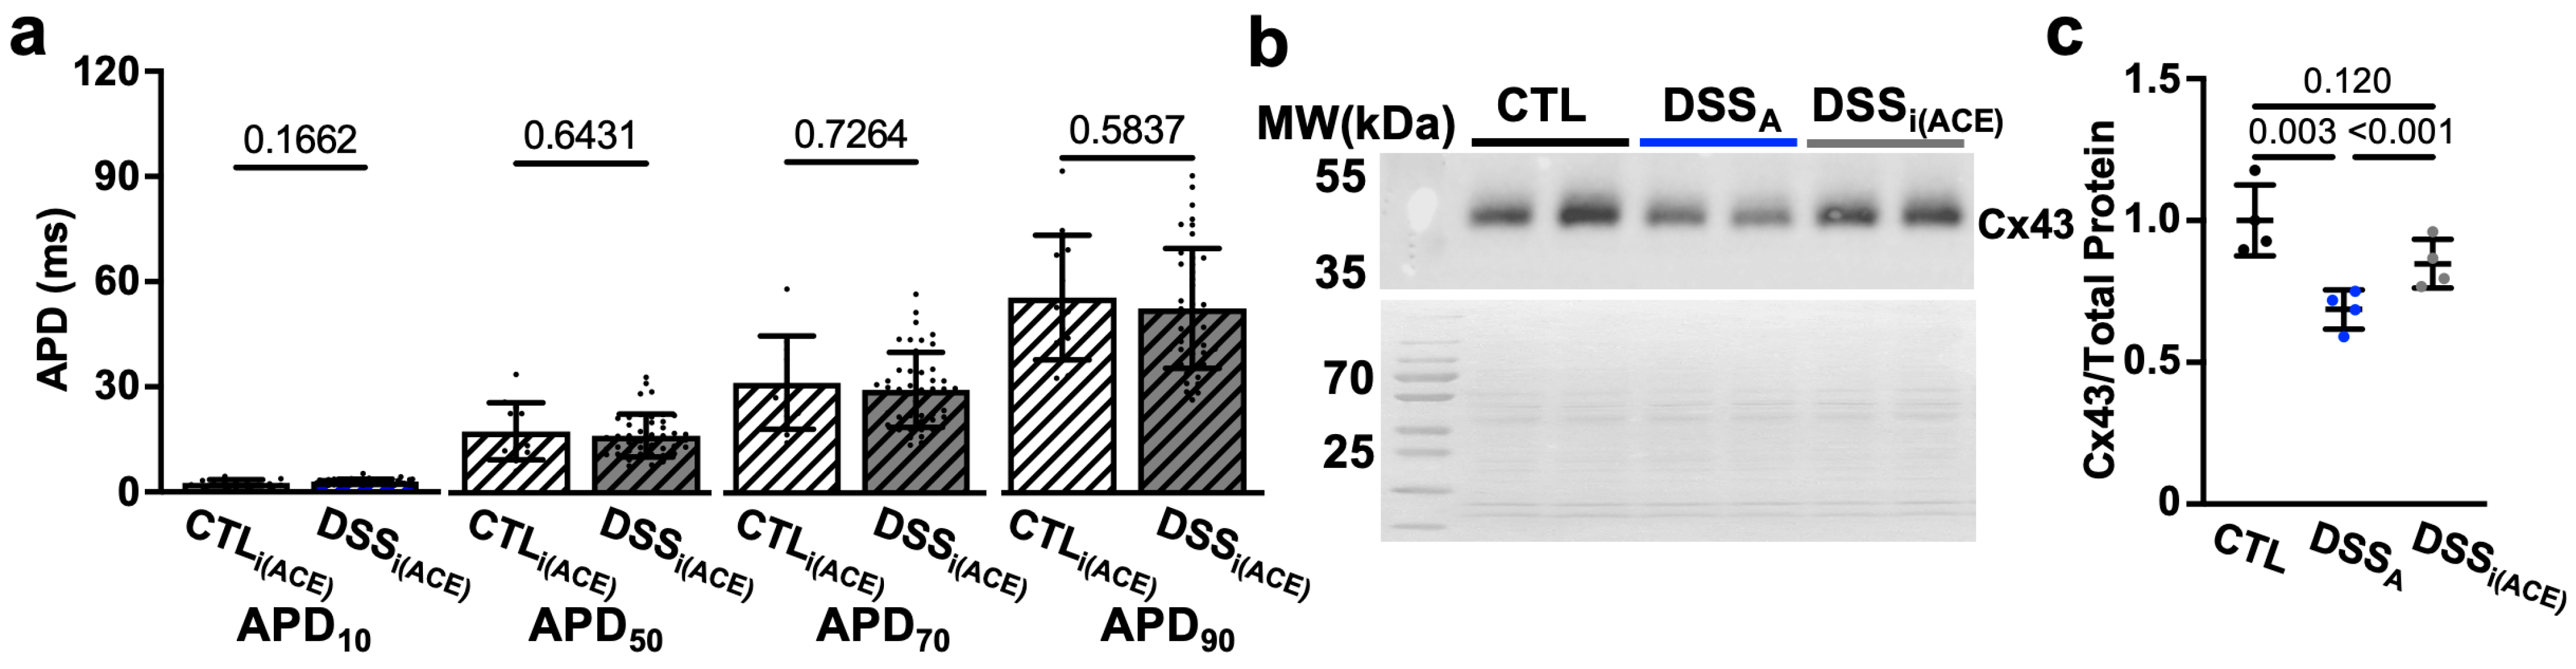
3.3. Colitis-Induced Changes of the Atrial APD

Alterations in atrial INa have been linked to an increased propensity for atrial arrhythmia because of a reduced atrial conduction velocity that facilitates the occurrence of reentry [23,24] or an increased INa,L that prolongs the APD and thereby increases the propensity for early afterdepolarization (EADs) and triggered activity [48]. To determine colitis-induced changes in the duration of cellular excitability, we quantified FPdur from the atrial electrogram as a measure of the APD [31,42]. In mice with active colitis, atria exhibited a prolonged FPdur, and heterogeneity in atrial repolarization, quantified as FPdisp, was increased (Figure 5a–c). The atrial data were supported by current clamp AP recordings on the cellular level. APDs were quantified at 10%, 50%, 70%, and 90% of repolarization (e.g., APD10; Figure 5d) and exhibited a significant prolongation during active colitis. The colitis-induced APD prolongation was reversible upon remission. However, the APD prolongation did not coincide with an increase in INa,L density or a change in the ratio between peak and steady-state INa (Figure S2a,b).
To determine differences in atrial myocyte repolarization, we quantified atrial K-currents using the voltage clamp technique. K-currents were elicited from a holding potential of −80 mV using the voltage protocol depicted in Figure 6a. Active colitis induced a significant reduction in peak IK in comparison to CTL atrial myocytes, suggesting a colitis-induced remodeling of fast voltage-activated K-channels. The early phase of AP repolarization is initiated by the voltage dependent activation of the slow and fast transient outward potassium currents (Ito,s and Ito,f) as well as the ultra-rapid K-current (IK,ur). To isolate the contribution of Ito,f and Ito,s from other K-channels, the voltage protocol (Figure 6a) was repeated with a depolarizing pre-pulse (−40 mV, 100 ms) before the test pulses (protocol : Figure 6d) to promote the voltage-dependent inactivation of Ito and isolate IK,ur (Figure 6d,e). IK,ur (Figure 6f), but also Ito, quantified as the differential current (Ito = I − I; Figure 6g–i), were significantly attenuated during active colitis. In an alternative approach, we used 4-Aminopyridine (4-AP: 100 mmol/L), a pan-K-channel blocker [19] that predominantly blocks Ito (Ito,s: Kv1.4; Ito,f: Kv4.2/4.3 and IK,ur: Kv1.5), in the atria. Superfusion of atrial myocytes with 4-AP eliminated the differences in IK between the CTL and DSSA myocytes (Figure S3), and the differential current density quantified as the area under the curve (0–100 ms) before and after superfusion with 4-AP (Ito = I − I(+4AP)) revealed a significantly reduced Ito during active colitis (Figure 7b). To resolve the impact that Ito has on the atrial AP, APs were recorded from isolated myocytes before and during 4-AP superfusion. 4-AP shortened the APD in CTL and DSSA atrial myocytes; however, the degree of change was significantly larger in CTL myocytes (Figure 7c), consistent with the observed reduction of Ito density in DSSA.
To quantify the contribution of IK,ur to the 4-AP sensitive current, IK (protocol ) was recorded before and during superfusion with Diphenyl phosphine oxide-1 (DPO-1: 1 mmol/L), an IK,ur (Kv1.5) specific blocker [49]. The DPO-1 sensitive current (IK,DPO = I − I(+DPO)) was significantly reduced during active colitis Figure S4a) consistent with the difference in current obtained with protocol (Figure 6d–f). However, DPO-1 did not eliminate the difference in IK between CTL and DSSA myocytes (Figure S4b), and superfusion of DPO-1 during AP recordings induced comparable changes in APD of CTL and DSSA myocytes (Figure S4c). Overall, the experimental data support a colitis-induced decrease in Ito (Ito,f, Ito,s, IK,ur) where the atrial APD prolongation is primarily a consequence of a reduction in Ito,f.

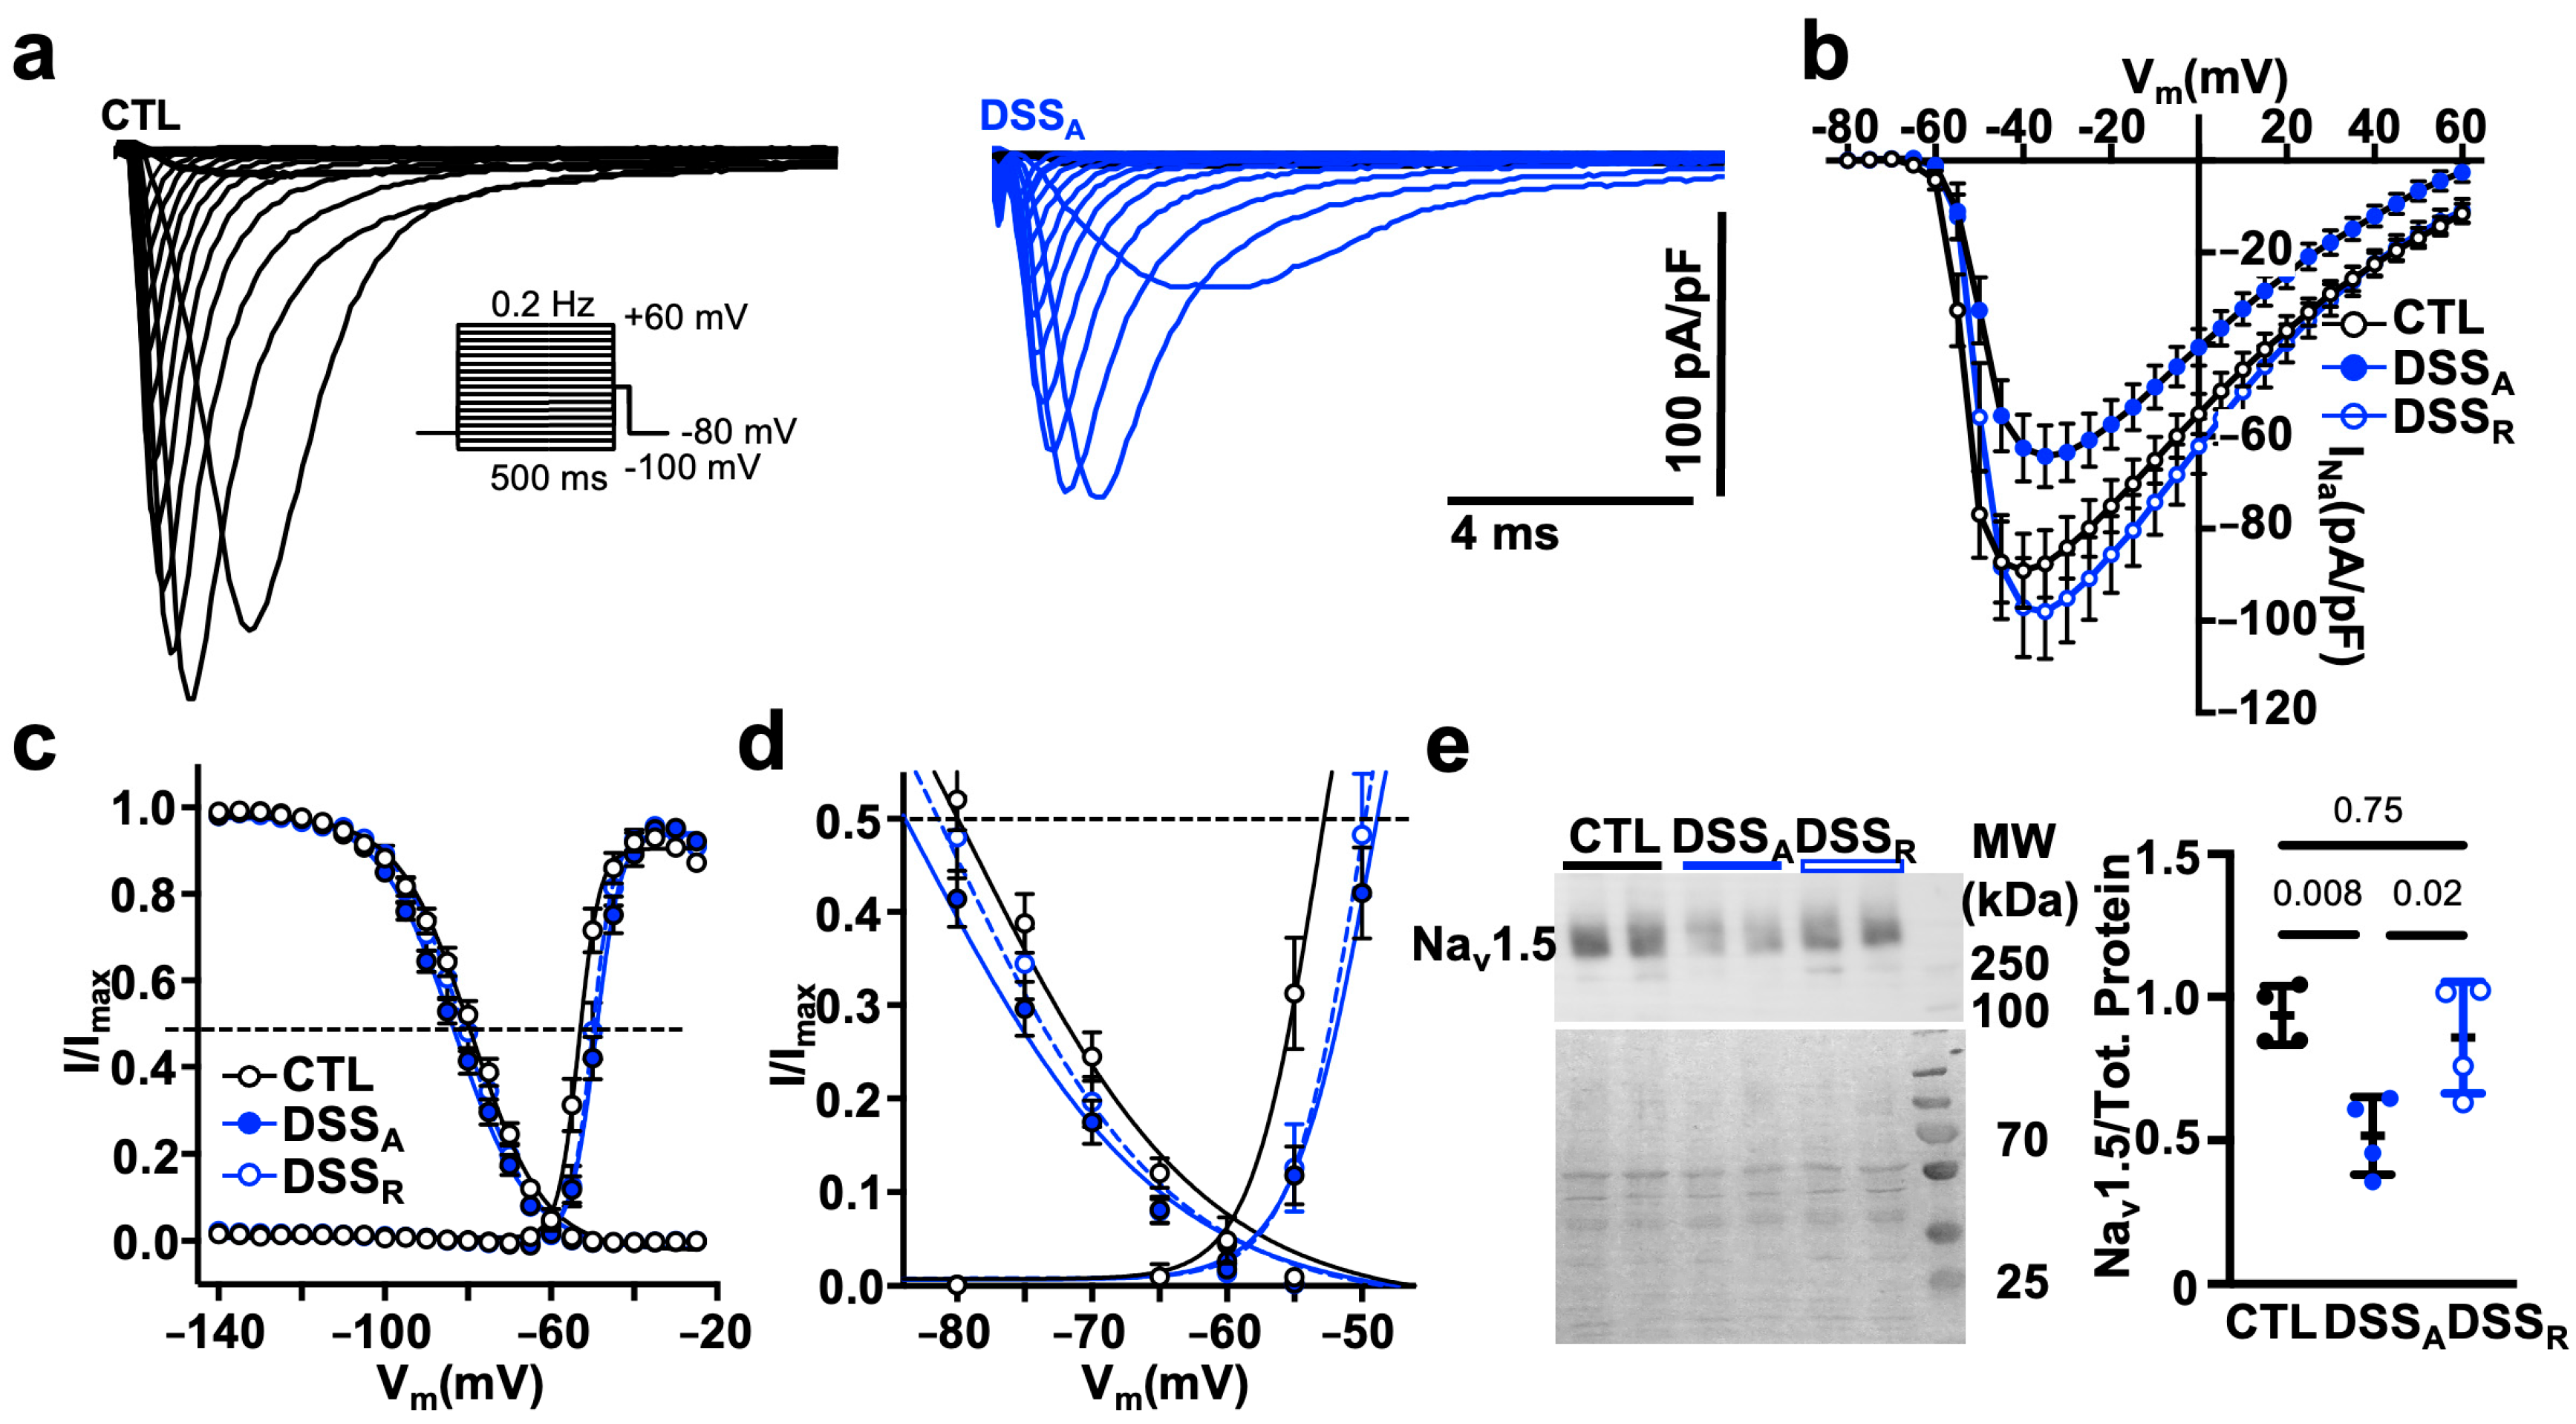
3.4. Increased RAS Signaling Links Colitis to Atrial Remodeling

In patients, during active colitis, gut dysbiosis, bacterial translocation, inflammation, and altered autonomic control can enhance systemic AngII signaling [27,30], and our prior studies demonstrated increased serum levels of AngII in our mouse model of active colitis [31]. To determine if AngII contributes to the observed changes in atrial electrophysiology, we treated mice with the ACE inhibitor Perindopril (3 mg/kg/day, ip) during the DSS treatment period as previously described (Figure 1a(B)) [31]. At the end of treatment, ECGs were recorded and atrial myocytes isolated from ACE inhibitor (i(ACE)) treated mice (DSSi(ACE)). ECG analysis revealed that i(ACE) treatment during active colitis prevented a significant prolongation of Pdur (Figure 8a), and the PR interval remained comparable to CTL animals (Figure 8b). Interestingly, after i(ACE) treatment, INa remained attenuated (Figure 7c) and half maximal activation and inactivation remained significantly slower in DSSi(ACE) compared to CTL myocytes (Figure 8d,e; Table 2), despite the ECG normalization and comparable expression levels of Nav1.5 in CTL- and iACE-treated animals (Figure S5). Consistent with the reduced INa, the AP amplitude and upstroke velocity (APA, Vmax; Figure 8f,g) remained attenuated in DSSi(ACE) myocytes, while APD shortening was prevented compared to CTLi(ACE) myocytes (Figure 9a), especially during the early phase of repolarization. Comparison of Cx43 expression in CTLi(ACE) and DSSi(ACE) atria showed that Cx43 downregulation during active colitis was prevented by i(ACE) treatment (Figure 9b,c).
ACE inhibition prevents the conversion of AngI to AngII. To determine if the signaling observed is a consequence of enhanced AngII-induced AT1R activation, we repeated part of the experiments in CTL and DSS mice treated with the AT1R blocker Losartan-K (ip: 30 mg/kg/day). Comparable to iACE, block of AT1R during the induction of colitis (Figure 1a(B)) also prevented prolongation of the Pdur and PR interval (Figure S6a,b). Interestingly, in DSSi(AT1R) myocytes, APA and Vmax (Figure S6c,d), as well as the AP rise time (time from 50% and 10% to peak), were maintained, suggesting the prevention of INa remodeling (Figure S6e,f). Also, a DSS-induced prolongation of the APD was successfully suppressed by i(AT1R) (Figure S6g). Overall, the results support a role of increased AngII signaling in the deregulation of atrial electrophysiological properties during active colitis.

4. Discussion

In the present study, we demonstrate for the first-time on the cellular level an active colitis-induced atrial electrophysiological remodeling. We establish that Pdur and PR prolongation are the consequence of a reduced availability of Cx43 and the voltage dependent Na-channels (INa, SCN5A), and that a prolongation of the APD is the result of a colitis-induced attenuation of Ito. The observed atrial electrophysiological changes that are linked to an increased risk for atrial arrhythmia, were only partially reversible upon remission and the consequence of a colitis-induced increase in AngII signaling.

4.1. Atrial Remodeling in Patients with Active Colitis

Inflammatory bowel disease, including ulcerative colitis, is a common chronic inflammatory disorder of the gastrointestinal tract [1,2]. In the course of the disease, repeated episodes of acute inflammation become superimposed upon a chronic disease progression. Besides gastrointestinal symptoms, patients are reported to develop an increased risk for extraintestinal disorders [3]. Changes in cardiovascular function include supraventricular arrhythmia, AF, and an increased risk for stroke [7,8,9]. Interestingly, colitis patients present with new onset AF predominantly during the active phase of the disease [8,9]. To determine the mechanism of active colitis-induced changes in atrial electrophysiology that could increase the risk for atrial arrhythmia, we chose a mouse model of DSS-induced colitis [35,36]. Administration of DSS through drinking water causes injury to the intestinal epithelial lining [37]. It is well documented that the resulting transition of luminal bacteria and antigens into the mucosa results in an inflammatory response and the increase in inflammatory markers in the intestine (TNF-α, IL-1β, IFN-γ and cytokines) and serum (C-reactive protein) [50]. Colitis disease severity depends on the mouse strain, the concentration of DSS, as well as the duration and frequency of exposure [35,37]. In our study, the chosen DSS concentration of 3.5% induces the disease phenotype of active colitis [31], and the C57BL/6 strain was chosen because it develops a more severe and chronic disease phenotype more representative to human colitis. Our experimental results reveal a P-wave and PR interval prolongation that mirrors the atrial electrophysiological changes described in colitis patients [11,13,14] and highlights the usefulness of the model in studying the mechanism of colitis-induced atrial remodeling.

4.2. Active Colitis-Induced Prolongation of Pdur and PR Interval

The P-wave is a measure of the excitation spread across the atria, whereas P-wave dispersion reflects the homogeneity of inter-atrial conductance and/or propagation of the excitation across the atria [17,18]. Consistent with patient data, our results show a prolongation of Pdur and PR that coincided with a reduced atrial epicardial conduction velocity (Figure 2a,b) and increased dispersion of excitation (Figure 5c). The fact that the alterations in atrial excitation were reproduced in isolated hearts suggests that they are intrinsic to the atrial tissue and not a consequence of disease-dependent alterations in autonomic control or electrolyte imbalance [51]. On the tissue level, an attenuated cardiac conduction velocity can be the result of a decreased AP upstroke velocity, increased intercellular resistance, or structural remodeling such as tissue fibrosis [52]. Activation of atrial fibroblasts and fibrosis can be a consequence of an atrial inflammatory response [53], as it occurs in the DSS model of active colitis [35,50]. In our model, the reversibility of the slowed atrial conductance upon remission (Figure 2a) does not advocate for permanent structural fibrotic remodeling of the atria. The observed reversibility of the ECG changes stands in contrast to clinical data showing persistent ECG changes in patients in remission [6,11]. However, as described in the literature, these changes correlate with disease severity and duration and could suggest that in our model, longer or repeated episodes of active colitis could promote progressive and irreversible structural remodeling of the atria.
The AP upstroke velocity is driven by the activation of Nav1.5 (SCN5A) [54]. Altered Nav1.5 expression as well as gain and loss of function mutations have been linked to an increased propensity for AF [23,24]. Reduced current density as well as a shift of the channels voltage dependence of activation thereby impair atrial conduction and lead to a prolonged or a more heterogeneous excitation of the atria [21,55]. Our AP recordings in isolated atrial myocytes support an attenuated AP up-stroke velocity because of a reduction in Nav1.5 protein and a shift of the INa activation kinetic to more depolarizing voltages (Figure 3). While the conduction velocity, INa density, and protein levels recovered in remission, INa kinetic remained attenuated, suggesting that the change in kinetic alone was insufficient to cause the slowed atrial conduction velocity. The latter is not surprising given that changes in intercellular coupling were shown to have a more pronounced impact on cardiac conduction velocity than alterations in INa [20]. Attenuated atrial gap junction coupling due to a reduction in channel expression, a change in the channel’s sub-cellular distribution, or mutation-dependent changes in the channel’s conductance were shown to attenuate atrial conductance. The colitis-induced, reversible reduction in the protein level of Cx43 is therefore more likely the determining factor for the reduced atrial conduction velocity in DSSA atria. At this point, we do not know if the recovery of INa activation kinetic during remission is slowed or if the changes remain permanent. In the latter case, repeated disease episodes could progressively and persistently impact atrial conduction and dispersion of excitation, even in remission.

4.3. Colitis-Induced Changes in APD

Changes in the atrial APD are linked to an increased risk for atrial arrhythmia [52,56]. During rapid atrial pacing, or in the context of AF, a shortened APD attenuates the atrial refractory period and facilitates the occurrence of reentry or delayed after depolarizations (DADs) [52]. On the other hand, a prolongation of the atrial APD can increase the risk for arrhythmic events by facilitating the incidence of EADs. A prolongation of the atrial APD is the result of increased depolarizing currents, such as raised levels of INa,L, the L-type Ca-current, or enhanced sodium calcium exchanger (INCX) activity [48]. Alternatively, a prolongation of the APD can be caused by a reduction in repolarizing K-currents. Atrial K-currents are composed of a large group of voltage-regulated channels with different activation kinetics [57,58]. Ito,f and Ito,s as well as IK,ur (Kv1.5) are rapidly activated during the upstroke of the AP and regulate the APs amplitude as well as duration. The downregulation of Ito [59,60] and IK,ur [57,61] have been described in patients as well as animal models of AF, and mutations have been linked to heritable cardiac arrhythmia. The colitis-induced prolongation of the early phase of the atrial APD (APD10, APD50) suggests an attenuation of Ito,f, Ito,s, and IKur. This was supported by our experimental data, that show significantly reduced 4-AP and DPO-1 sensitive currents in DSSA myocytes (Figure 7b, Figure S4a) and the elimination of differences in IK between CTL and DSSA after the pharmacological inhibition of Ito (Figure S3). The failure of DPO-1 to eliminate differences in APD between CTL and DSSA myocytes insinuates that the atrial-specific IK,ur (Kv1.5) has a more limited impact on APD prolongation during active colitis.
The fast and slow component of atrial Ito refers to the current’s inactivation and recovery from inactivation, respectively. Ito,f has been linked to the Kv4 family Kv4.2 and Kv4.3 (KCND2/3), whereas Ito,s has been linked to Kv1.4 (KCNA4) [62]. Interestingly, Kv1.4 is expressed in a species-dependent manner and shows a spatially defined expression pattern [62]. In rabbits and humans, the Kv1.4 protein was determined in the atrial muscle, whereas in mice, deletion of Kv1.4 had no impact on the atrial electrophysiology but increased the occurrence of AV block and altered the ventricular APD [63]. In mouse atria however, the expression of a dominant negative form of Kv4.2 eliminated Ito, suggesting that Kv4 channels are a major contributor to early AP repolarization [64]. At this point, we therefore suggest that the colitis-induced APD prolongation is predominantly the result of a reduction of Ito,f (Kv4.2,4.3)-dependent currents.

4.4. The Gut-Heart Axis

Gut dysbiosis, colonic barrier disruption with bacterial translocation, increased sympathetic tone and increased levels of systemic inflammation in symptomatic patients with active ulcerative colitis [3,65]. A link between gut health and cardiovascular function has been previously demonstrated. Therefore, the progression of heart failure, atherosclerosis, cardio-metabolic syndrome, hypertension, and endocarditis have been linked to changes in gut microbiota, transfer of bacteria into the circulation, as well as changes in bacterial metabolites [66]. More recently, increasing evidence has emerged of a close link between AF and gut dysbiosis [26]. The mechanistic link, however, remains complex and underexplored. Potential mechanisms are increased levels of LPS and TMAO metabolic products of the gut microbiome, as well as decreased levels of SCFAs, such as butyrate [26]. In all cases, their dysregulation was linked to increased inflammatory signaling and an increased propensity of cardiac fibrosis [26,67]. One commonality of all signaling mechanisms is their impact on RAS signaling [68]. Increased levels of inflammatory cytokines increase Agt expression [29], while LPS enhances ACE and AT1 signaling. SCFAs on the other hand, attenuate renin secretion [30]. Colitis-induced inflammation, an increase in LPS, the sympathetic tone, and a decrease in SCFA would all result in increased levels of Agt and AngII [69,70], which have been shown to correlate with disease activity [71]. AngII itself, which we have shown to be increased in the serum of our mouse model of active colitis [31], can further intestinal and systemic inflammation by stimulating the expression of inflammatory cytokines. The latter is consistent with the observation that in AT1R-deficient mice and during i(ACE) treatment [72], colitis-induced intestinal inflammation is attenuated [73].
In the heart, acute and chronic exposure to AngII promotes electrophysiological remodeling, hypertrophic growth, ROS signaling, and fibrotic remodeling [74]. Increased AngII levels were determined in the atria of patients with AF, and in mouse models, chronic AngII exposure or overexpression of AT1R increased Pdur, atrial effective refractory period, and the propensity for AF [19,75]. The AngII-induced attenuation of the atrial conduction velocity has been linked to reduced INa, Cx43, and Cx40, whereas the AP prolongation coincided with an attenuation of Ito and IK,ur [19,75,76]. In our model of active colitis, we identified an atrial electrophysiological phenotype that exhibits a prolonged Pdur and attenuated conduction velocity based on a reduced Cx43 expression and INa availability, whereas the observed APD prolongation is a consequence of attenuated repolarizing Ito,f. The remodeling of the conduction velocity and APD could be prevented by treatment of mice with i(ACE) (Figure 8 and Figure 9) or i(AT1R) (Figure S6) during the induction of colitis. While the effect of i(ACE) only supports an increase in RAS signaling, the protective effect of i(AT1R) narrows the signaling down to an AngII/AT1R-induced signaling cascade. At this point, we do not distinguish if the colitis-induced increase in AngII signaling is caused by changes in the autonomic tone, inflammation, or alterations in gut microbiome and its metabolites. We also cannot rule out an attenuation of signaling pathways that would counteract signaling downstream of AT1R; however, the effectiveness of i(ACE) and i(AT1R) underlines the observed contribution of this receptor mediated pathway in the atrial remodeling.

4.5. Limitations

DSS, as well as other colitis models, are indispensable tools to study IBD, but no model reflects the complexity of the human disease [77]. In contrast to IBD in humans, inflammation induced by DSS is more severe and occurs more rapidly. In addition, in mice, T- and B- cells are not required for the development of the disease and intestinal bacteria differ from those in humans. We chose the model of DSS-induced colitis because it can mimic acute, chronic, and relapsing phases of the disease, and the induced dysplasia resembles the clinical phenotype of human ulcerative colitis. Also, cytokines (IL-6, -16, -22) and chemokines (CCL2, CCL3, CXCL1) related to human IBD are upregulated [50]. In future studies, we will further verify our findings in other colitis models (e.g., spontaneous colitis, inducible colitis, genetically modified, and adoptive transfer models).
The model of acute colitis was chosen because IBD patients with acute colitis exhibit a more than two-fold increase in their risk for AF. Disease severity in patients, however, will most likely be impacted by the chronic progression of the disease. The fact that electrophysiological remodeling occurs during the first appearance of acute colitis underlines the significance to better understand the gut-heart axis. In the future, atrial remodeling in models of chronic disease progression will elucidate the long-term impact of the disease on the heart.
A Mendelian randomization study has argued against a causative link between colitis and AF [78]. However, limitations of the studies were that IBD disease activity, severity, and duration were not included in the analysis, and the occurrence of AF was not evaluated by long-term monitoring and therefore likely underestimated. Our data support atrial electrophysiological remodeling as a consequence of colitis; however, further clinical and animal studies are warranted to better link IBD disease activity to changes in atrial electrophysiology and the propensity for AF.

5. Conclusions

In the presented study, we demonstrate for the first time that active colitis induces atrial electrophysiological remodeling, which creates an atrial substrate described to have an increased propensity for arrhythmia. The colitis-induced increase in AngII signaling attenuated the conduction velocity and increased APD through the remodeling of INa, intercellular coupling, and Ito,f. The results are consistent with clinical reports showing an increased vulnerability of colitis patients to atrial arrhythmia, and suggest that in especially hypertensive colitis patients, ACE inhibitors should be the treatment of choice, and increased RAS signaling could serve as a marker for colitis patients at risk for atrial arrhythmia.

Supplementary Materials

The following supporting information can be downloaded at: https://www.mdpi.com/article/10.3390/biom15070982/s1, Figure S1: Colitis attenuates AP amplitude; Figure S2: INa,L does not contribute to colitis-induced AP prolongation; Figure S3: 4-AP relinquishes the difference in IK during active colitis; Figure S4: DPO does not relinquishes the difference in IK during active colitis; Figure S5: AT1R block does not prevent Nav1.5 downregulation; Figure S6: AT1R block during colitis prevents atrial electrophysiological remodeling.

Author Contributions

Conceptualization, K.B. and A.K.; methodology, E.J.O.V., K.B. and A.K.; validation, K.B. and H.K.; formal analysis, H.K., E.J.O.V., C.H.P., A.F.P. and K.B.; investigation, H.K., E.J.O.V. and A.F.P.; resources, K.B.; data curation, H.K., E.J.O.V., C.H.P. and A.F.P.; writing—original draft preparation, K.B.; writing—review and editing, H.K., E.J.O.V., C.H.P., A.F.P., A.K. and K.B.; visualization, H.K. and K.B.; supervision, K.B.; project administration, K.B.; funding acquisition, K.B. All authors have read and agreed to the published version of the manuscript.

Funding

This research was funded by National Institute of Health Grants HL155762, HL164453 and HL132871 to KB.

Institutional Review Board Statement

The animal study protocol was approved by the Institutional Review Board of RUSH University Medical Center (protocol code #22-034 approved on 13 July 2022).

Informed Consent Statement

Not applicable.

Data Availability Statement

The data that support the findings of this study are available from the corresponding author upon reasonable request.

Acknowledgments

No GenAI has been used for purposes such as generating text, data, or graphics, or for study design, data collection, analysis, or interpretation of data.

Conflicts of Interest

The authors declare no conflicts of interest.

Abbreviations

The following abbreviations are used in this manuscript:
ACEAngiotensin-converting enzyme
AFAtrial fibrillation
AgtAngiotensinogen
AngIIAngiotensin II
APAction potential
APDAction potential duration
AT1RAngiotensin II receptor type 1
CxConnexin
DAIDisease activity index
DSSDextran sulfate sodium
ECGElectrocardiogram
IBDInflammatory bowel disease
ILInterleukin
LPSLipopolysaccharide
LTCCL-type Ca channel
PdurP wave duration
PdispP wave dispersion
RASRenin-angiotensin system
SCFAShort chain fatty acids
TMAOTrimethylamine N-oxide
UCUlcerative colitis

References

  1. Khan, M.W.; Keshavarzian, A.; Gounaris, E.; Melson, J.E.; Cheon, E.C.; Blatner, N.R.; Chen, Z.E.; Tsai, F.-N.; Lee, G.; Ryu, H.; et al. PI3K/AKT Signaling Is Essential for Communication between Tissue-Infiltrating Mast Cells, Macrophages, and Epithelial Cells in Colitis-Induced Cancer. Clin. Cancer Res. 2013, 19, 2342–2354. [Google Scholar] [CrossRef] [PubMed]
  2. Keerthivasan, S.; Aghajani, K.; Dose, M.; Molinero, L.; Khan, M.W.; Venkateswaran, V.; Weber, C.; Emmanuel, A.O.; Sun, T.; Bentrem, D.J.; et al. β-Catenin Promotes Colitis and Colon Cancer through Imprinting of Proinflammatory Properties in T Cells. Sci. Transl. Med. 2014, 6, 225ra28. [Google Scholar] [CrossRef]
  3. Vavricka, S.R.; Schoepfer, A.; Scharl, M.; Lakatos, P.L.; Navarini, A.; Rogler, G. Extraintestinal Manifestations of Inflammatory Bowel Disease. Inflamm. Bowel Dis. 2015, 21, 1982–1992. [Google Scholar] [CrossRef] [PubMed]
  4. Aarestrup, J.; Jess, T.; Kobylecki, C.J.; Nordestgaard, B.G.; Allin, K.H. Cardiovascular Risk Profile Among Patients with Inflammatory Bowel Disease: A Population-Based Study of More Than 100 000 Individuals. J. Crohns Colitis 2019, 13, 319–323. [Google Scholar] [CrossRef] [PubMed]
  5. Bunu, D.-M.; Timofte, C.-E.; Ciocoiu, M.; Floria, M.; Tarniceriu, C.-C.; Barboi, O.-B.; Tanase, D.-M. Cardiovascular Manifestations of Inflammatory Bowel Disease: Pathogenesis, Diagnosis, and Preventive Strategies. Gastroenterol. Res. Pract. 2019, 2019, 3012509–3012514. [Google Scholar] [CrossRef]
  6. Mitchell, N.E.; Harrison, N.; Junga, Z.; Singla, M. Heart Under Attack: Cardiac Manifestations of Inflammatory Bowel Disease. Inflamm. Bowel Dis. 2018, 24, 2322–2326. [Google Scholar] [CrossRef]
  7. Pattanshetty, D.J.; Anna, K.; Gajulapalli, R.D.; Shekkar, R.R.; Sappati-Biyyani, R. Inflammatory Bowel “Cardiac” Disease: Point Prevalence of Atrial Fibrillation in Inflammatory Bowel Disease Population. Saudi J. Gastroenterol. 2015, 21, 325–329. [Google Scholar] [CrossRef]
  8. Choi, Y.J.; Han, K.D.; Park, J.; Moon, I.; Lee, E.; Choe, W.S.; Lee, S.R.; Cha, M.J.; Lim, W.-H.; Oh, S. Increased Risk of Atrial Fibrillation in Patients with Inflammatory Bowel Disease: A Nationwide Population-Based Study. World J. Gastroenterol. 2019, 25, 2788–2798. [Google Scholar] [CrossRef]
  9. Kristensen, S.L.; Kristensen, S.L.; Lindhardsen, J.; Lindhardsen, J.; Ahlehoff, O.; Ahlenhoff, O.; Erichsen, R.; Erichsen, R.; Lamberts, M.; Lamberts, M.; et al. Increased Risk of Atrial Fibrillation and Stroke during Active Stages of Inflammatory Bowel Disease: A Nationwide Study. Europace 2014, 16, 477–484. [Google Scholar] [CrossRef]
  10. Sun, J.; Roelstraete, B.; Svennberg, E.; Halfvarson, J.; Sundström, J.; Forss, A.; Olén, O.; Ludvigsson, J.F. Long-Term Risk of Arrhythmias in Patients with Inflammatory Bowel Disease: A Population-Based, Sibling-Controlled Cohort Study. PLoS Med. 2023, 20, e1004305. [Google Scholar] [CrossRef]
  11. Bornaun, H.A.; Yılmaz, N.; Kutluk, G.; Dedeoğlu, R.; Oztarhan, K.; Keskindemirci, G.; Tulunoğlu, A.; Şap, F. Prolonged P-Wave and QT Dispersion in Children with Inflammatory Bowel Disease in Remission. BioMed Res. Int. 2017, 2017, 6960810. [Google Scholar] [CrossRef] [PubMed]
  12. Curione, M.; Aratari, A.; Amato, S.; Colotto, M.; Barbato, M.; Leone, S.; Tego, A.; Panetti, D.; Parlapiano, C. A Study on QT Interval in Patients Affected with Inflammatory Bowel Disease without Cardiac Involvement. Intern. Emerg. Med. 2010, 5, 307–310. [Google Scholar] [CrossRef] [PubMed]
  13. Efe, T.H.; Cimen, T.; Ertem, A.G.; Coskun, Y.; Bilgin, M.; Sahan, H.F.; Pamukcu, H.E.; Yayla, C.; Sunman, H.; Yuksel, I.; et al. Atrial Electromechanical Properties in Inflammatory Bowel Disease. Echocardiography 2016, 33, 1309–1316. [Google Scholar] [CrossRef]
  14. Nar, G.; Ergul, B.; Aksan, G.; Inci, S. Assessment of Atrial Electromechanical Delay and Left Atrial Mechanical Functions in Patients with Ulcerative Colitis. Echocardiography 2016, 33, 970–976. [Google Scholar] [CrossRef]
  15. Rasmussen, M.U.; Kumarathurai, P.; Fabricius-Bjerre, A.; Larsen, B.S.; Domínguez, H.; Davidsen, U.; Gerds, T.A.; Kanters, J.K.; Sajadieh, A. P-wave Indices as Predictors of Atrial Fibrillation. Ann. Noninvasive Electrocardiol. 2020, 25, e12751. [Google Scholar] [CrossRef] [PubMed]
  16. Baturova, M.A.; Cornefjord, G.; Carlson, J.; Johnson, L.S.B.; Smith, J.G.; Platonov, P.G. P-Wave Characteristics as Electrocardiographic Markers of Atrial Abnormality in Prediction of Incident Atrial Fibrillation—The Malmö Preventive Project. J. Electrocardiol. 2024, 82, 125–130. [Google Scholar] [CrossRef]
  17. Giannopoulos, G.; Tachmatzidis, D.; Moysidis, D.V.; Filos, D.; Petridou, M.; Chouvarda, I.; Vassilikos, V.P. P-Wave Indices as Predictors of Atrial Fibrillation: The Lion from a Claw. Curr. Probl. Cardiol. 2024, 49, 102051. [Google Scholar] [CrossRef]
  18. Censi, F.; Corazza, I.; Reggiani, E.; Calcagnini, G.; Mattei, E.; Triventi, M.; Boriani, G. P-Wave Variability and Atrial Fibrillation. Sci. Rep. 2016, 6, 26799. [Google Scholar] [CrossRef]
  19. Jansen, H.J.; Mackasey, M.; Moghtadaei, M.; Belke, D.D.; Egom, E.E.; Tuomi, J.M.; Rafferty, S.A.; Kirkby, A.W.; Rose, R.A. Distinct Patterns of Atrial Electrical and Structural Remodeling in Angiotensin II Mediated Atrial Fibrillation. J. Mol. Cell. Cardiol. 2018, 124, 12–25. [Google Scholar] [CrossRef]
  20. Rohr, S. Role of Gap Junctions in the Propagation of the Cardiac Action Potential. Cardiovasc. Res. 2004, 62, 309–322. [Google Scholar] [CrossRef]
  21. Jeevaratnam, K.; Guzadhur, L.; Goh, Y.M.; Grace, A.A.; Huang, C.L.-H. Sodium Channel Haploinsufficiency and Structural Change in Ventricular Arrhythmogenesis. Acta Physiol. 2016, 216, 186–202. [Google Scholar] [CrossRef]
  22. Bao, Y.; Willis, B.C.; Frasier, C.R.; Lopez-Santiago, L.F.; Lin, X.; Ramos-Mondragón, R.; Auerbach, D.S.; Chen, C.; Wang, Z.; Anumonwo, J.; et al. Scn2b Deletion in Mice Results in Ventricular and Atrial Arrhythmias. Circ. Arrhythmia Electrophysiol. 2018, 9, e003923. [Google Scholar] [CrossRef] [PubMed]
  23. Olson, T.M.; Michels, V.V.; Ballew, J.D.; Reyna, S.P.; Karst, M.L.; Herron, K.J.; Horton, S.C.; Rodeheffer, R.J.; Anderson, J.L. Sodium Channel Mutations and Susceptibility to Heart Failure and Atrial Fibrillation. JAMA 2005, 293, 447–454. [Google Scholar] [CrossRef]
  24. Chen, L.; Ballew, J.; Herron, K.; Rodeheffer, R.; Olson, T. A Common Polymorphism in SCN5A Is Associated with Lone Atrial Fibrillation. Clin. Pharmacol. Ther. 2007, 81, 35–41. [Google Scholar] [CrossRef] [PubMed]
  25. Ziyadeh-Isleem, A.; Clatot, J.; Duchatelet, S.; Gandjbakhch, E.; Denjoy, I.; Hidden-Lucet, F.; Hatem, S.; Deschênes, I.; Coulombe, A.; Neyroud, N.; et al. A Truncating SCN5A Mutation Combined with Genetic Variability Causes Sick Sinus Syndrome and Early Atrial Fibrillation. Heart Rhythm 2014, 11, 1015–1023. [Google Scholar] [CrossRef]
  26. Gawałko, M.; Agbaedeng, T.A.; Saljic, A.; Müller, D.N.; Wilck, N.; Schnabel, R.; Penders, J.; Rienstra, M.; van Gelder, I.; Jespersen, T.; et al. Gut Microbiota, Dysbiosis and Atrial Fibrillation. Arrhythmogenic Mechanisms and Potential Clinical Implications. Cardiovasc. Res. 2021, 118, 2415–2427. [Google Scholar] [CrossRef] [PubMed]
  27. Forrester, S.J.; Booz, G.W.; Sigmund, C.D.; Coffman, T.M.; Kawai, T.; Rizzo, V.; Scalia, R.; Eguchi, S. Angiotensin II Signal Transduction: An Update on Mechanisms of Physiology and Pathophysiology. Physiol. Rev. 2018, 98, 1627–1738. [Google Scholar] [CrossRef]
  28. Jackson, K.L.; Gueguen, C.; Lim, K.; Eikelis, N.; Stevenson, E.R.; Charchar, F.J.; Lambert, G.W.; Burke, S.L.; Paterson, M.R.; Marques, F.Z.; et al. Neural Suppression of MiRNA-181a in the Kidney Elevates Renin Expression and Exacerbates Hypertension in Schlager Mice. Hypertens. Res. 2020, 43, 1152–1164. [Google Scholar] [CrossRef]
  29. Friedrich, M.; Pohin, M.; Powrie, F. Cytokine Networks in the Pathophysiology of Inflammatory Bowel Disease. Immunity 2019, 50, 992–1006. [Google Scholar] [CrossRef]
  30. Liu, W.; Tan, Z.; Geng, M.; Jiang, X.; Xin, Y. Impact of the Gut Microbiota on Angiotensin II-Related Disorders and Its Mechanisms. Biochem. Pharmacol. 2023, 214, 115659. [Google Scholar] [CrossRef]
  31. Pereira, C.H.; Kittaka, H.; Ouille V, E.J.; Almeida, J.F.Q.; Pelaez, A.; Keshavarzian, A.; Blatter, L.A.; Banach, K. Colitis Induced Ventricular Alternans Increases the Risk for Ventricular Arrhythmia. J. Mol. Cell. Cardiol. 2025, 204, 68–78. [Google Scholar] [CrossRef]
  32. Goette, A.; Staack, T.; Röcken, C.; Arndt, M.; Geller, J.C.; Huth, C.; Ansorge, S.; Klein, H.U.; Lendeckel, U. Increased Expression of Extracellular Signal-Regulated Kinase and Angiotensin-Converting Enzyme in Human Atria during Atrial Fibrillation. J. Am. Coll. Cardiol. 2000, 35, 1669–1677. [Google Scholar] [CrossRef] [PubMed]
  33. Cardin, S.; Li, D.; Thorin-Trescases, N.; Leung, T.-K.; Thorin, E.; Nattel, S. Evolution of the Atrial Fibrillation Substrate in Experimental Congestive Heart Failure: Angiotensin-Dependent and -Independent Pathways. Cardiovasc. Res. 2003, 60, 315–325. [Google Scholar] [CrossRef]
  34. Desantiago, J.; Bare, D.J.; Varma, D.; Solaro, R.J.; Arora, R.; Banach, K. Loss of P21-Activated Kinase 1 (Pak1) Promotes Atrial Arrhythmic Activity. Heart Rhythm 2018, 15, 1233–1241. [Google Scholar] [CrossRef] [PubMed]
  35. Perše, M.; Perse, M.; Cerar, A.; Cerar, A. Dextran Sodium Sulphate Colitis Mouse Model: Traps and Tricks. J. Biomed. Biotechnol. 2012, 2012, 718617. [Google Scholar] [CrossRef] [PubMed]
  36. Bento, A.F.; Leite, D.F.P.; Marcon, R.; Claudino, R.F.; Dutra, R.C.; Cola, M.; Martini, A.C.; Calixto, J.B. Evaluation of Chemical Mediators and Cellular Response during Acute and Chronic Gut Inflammatory Response Induced by Dextran Sodium Sulfate in Mice. Biochem. Pharmacol. 2012, 84, 1459–1469. [Google Scholar] [CrossRef]
  37. Chassaing, B.; Aitken, J.D.; Malleshappa, M.; Vijay-Kumar, M. Dextran Sulfate Sodium (DSS)-Induced Colitis in Mice. Curr. Protoc. Immunol. 2014, 104, 15.25.1–15.25.14. [Google Scholar] [CrossRef]
  38. Lu, H.; Yuan, P.; Ma, X.; Jiang, X.; Liu, S.; Ma, C.; Philipsen, S.; Zhang, Q.; Yang, J.; Xu, F.; et al. Angiotensin-Converting Enzyme Inhibitor Promotes Angiogenesis through Sp1/Sp3-Mediated Inhibition of Notch Signaling in Male Mice. Nat. Commun. 2023, 14, 731. [Google Scholar] [CrossRef]
  39. Pereira, C.H.; Bare, D.J.; Rosas, P.C.; Dias, F.A.L.; Banach, K. The Role of P21-Activated Kinase (Pak1) in Sinus Node Function. J. Mol. Cell. Cardiol. 2023, 179, 90–101. [Google Scholar] [CrossRef]
  40. Desantiago, J.; Bare, D.J.; Ke, Y.; Sheehan, K.A.; Solaro, R.J.; Banach, K. Functional Integrity of the T-Tubular System in Cardiomyocytes Depends on P21-Activated Kinase. J. Mol. Cell. Cardiol. 2013, 60, 121–128. [Google Scholar] [CrossRef]
  41. Varma, D.; Almeida, J.F.Q.; DeSantiago, J.; Blatter, L.A.; Banach, K. Inositol 1,4,5-Trisphosphate Receptor-Reactive Oxygen Signaling Domain Regulates Excitation-Contraction Coupling in Atrial Myocytes. J. Mol. Cell. Cardiol. 2022, 163, 147–155. [Google Scholar] [CrossRef] [PubMed]
  42. Halbach, M.; Egert, U.; Hescheler, J.; Banach, K. Estimation of Action Potential Changes from Field Potential Recordings in Multicellular Mouse Cardiac Myocyte Cultures. Cell. Physiol. Biochem. 2003, 13, 271–284. [Google Scholar] [CrossRef] [PubMed]
  43. Kirchhoff, S.; Kim, J.S.; Hagendorff, A.; Thonnissen, E.; Kruger, O.; Lamers, W.H.; Willecke, K. Abnormal Cardiac Conduction and Morphogenesis in Connexin40 and Connexin43 Double-Deficient Mice. Circ. Res. 2000, 87, 399. [Google Scholar] [CrossRef]
  44. Kanagaratnam, P.; Peters, N.S. Conduction, Gap Junctions, and Atrial Fibrillation: An Eternal Triangle? Heart Rhythm 2004, 1, 746–749. [Google Scholar] [CrossRef] [PubMed]
  45. Remme, C.A.; Scicluna, B.P.; Verkerk, A.O.; Amin, A.S.; van Brunschot, S.; Beekman, L.; Deneer, V.H.M.; Chevalier, C.; Oyama, F.; Miyazaki, H.; et al. Genetically Determined Differences in Sodium Current Characteristics Modulate Conduction Disease Severity in Mice with Cardiac Sodium Channelopathy. Circ. Res. 2009, 104, 1283–1292. [Google Scholar] [CrossRef]
  46. Remme, C.A. SCN5A Channelopathy: Arrhythmia, Cardiomyopathy, Epilepsy and Beyond. Philos. Trans. R. Soc. B 2023, 378, 20220164. [Google Scholar] [CrossRef]
  47. Mercier, A.; Clément, R.; Harnois, T.; Bourmeyster, N.; Bois, P.; Chatelier, A. Nav1.5 Channels Can Reach the Plasma Membrane through Distinct N-Glycosylation States. Biochim. Biophys. Acta (BBA) Gen. Subj. 2015, 1850, 1215–1223. [Google Scholar] [CrossRef]
  48. Savio-Galimberti, E.; Darbar, D. Atrial Fibrillation and SCN5A Variants. Card. Electrophysiol. Clin. 2014, 6, 741–748. [Google Scholar] [CrossRef]
  49. Regan, C.P.; Wallace, A.A.; Cresswell, H.K.; Atkins, C.L.; Lynch, J.J. In Vivo Cardiac Electrophysiologic Effects of a Novel Diphenylphosphine Oxide IKur Blocker, (2-Isopropyl-5-Methylcyclohexyl) Diphenylphosphine Oxide, in Rat and Nonhuman Primate. J. Pharmacol. Exp. Ther. 2006, 316, 727–732. [Google Scholar] [CrossRef]
  50. Alex, P.; Zachos, N.C.; Nguyen, T.; Gonzales, L.; Chen, T.-E.; Conklin, L.S.; Centola, M.; Li, X. Distinct Cytokine Patterns Identified from Multiplex Profiles of Murine DSS and TNBS-Induced Colitis. Inflamm. Bowel Dis. 2009, 15, 341–352. [Google Scholar] [CrossRef]
  51. De Oliveira, Í.M.; da Silva Júnior, E.L.; Martins, Y.D.O.; Rocha, H.A.L.; Scanavacca, M.I.; Gutierrez, P.S. Cardiac Autonomic Nervous System Remodeling May Play a Role in Atrial Fibrillation: A Study of the Autonomic Nervous System and Myocardial Receptors. Arq. Bras. Cardiol. 2021, 117, 999–1007. [Google Scholar] [CrossRef]
  52. Vinciguerra, M.; Dobrev, D.; Nattel, S. Atrial Fibrillation: Pathophysiology, Genetic and Epigenetic Mechanisms. Lancet Reg. Health Eur. 2024, 37, 100785. [Google Scholar] [CrossRef]
  53. Kang, W.; Deng, J.; Fan, Z.; Zhou, F.; Wang, X.; Liu, K.; Wang, L. Mechanisms Associated with the Development of Atrial Fibrillation after Sepsis and the Role of Neuregulin-1. Preprint 2023. [Google Scholar] [CrossRef]
  54. Joukar, S. A Comparative Review on Heart Ion Channels, Action Potentials and Electrocardiogram in Rodents and Human: Extrapolation of Experimental Insights to Clinic. Lab. Anim. Res. 2021, 37, 25. [Google Scholar] [CrossRef]
  55. Savio-Galimberti, E.; Argenziano, M.; Antzelevitch, C. Cardiac Arrhythmias Related to Sodium Channel Dysfunction. Handb. Exp. Pharmacol. 2017, 246, 331–354. [Google Scholar] [CrossRef]
  56. Heijman, J.; Voigt, N.; Nattel, S.; Dobrev, D. Cellular and Molecular Electrophysiology of Atrial Fibrillation Initiation, Maintenance, and Progression. Circ. Res. 2014, 114, 1483–1499. [Google Scholar] [CrossRef] [PubMed]
  57. Brundel, B.J.J.M.; Gelder, I.C.V.; Henning, R.H.; Tuinenburg, A.E.; Wietses, M.; Grandjean, J.G.; Wilde, A.A.M.; Gilst, W.H.V.; Crijns, H.J.G.M. Alterations in Potassium Channel Gene Expression in Atria of Patients with Persistent and Paroxysmal Atrial Fibrillation: Differential Regulation of Protein and MRNA Levels for K+ Channels. J. Am. Coll. Cardiol. 2001, 37, 926–932. [Google Scholar] [CrossRef] [PubMed]
  58. Nerbonne, J.M.; Nichols, C.G.; Schwarz, T.L.; Escande, D. Genetic Manipulation of Cardiac K+ Channel Function in Mice. Circ. Res. 2001, 89, 944–956. [Google Scholar] [CrossRef]
  59. Wagoner, D.R.V.; Pond, A.L.; McCarthy, P.M.; Trimmer, J.S.; Nerbonne, J.M. Outward K+ Current Densities and Kv1.5 Expression Are Reduced in Chronic Human Atrial Fibrillation. Circ. Res. 1997, 80, 772–781. [Google Scholar] [CrossRef]
  60. Bosch, R.F.; Scherer, C.R.; Rüb, N.; Wöhrl, S.; Steinmeyer, K.; Haase, H.; Busch, A.E.; Seipel, L.; Kühlkamp, V. Molecular Mechanisms of Early Electrical Remodeling: Transcriptional Downregulation of Ion Channel Subunits Reduces ICa,L and Ito in Rapid Atrial Pacing in Rabbits. J. Am. Coll. Cardiol. 2003, 41, 858–869. [Google Scholar] [CrossRef]
  61. Yang, Y.; Li, J.; Lin, X.; Yang, Y.; Hong, K.; Wang, L.; Liu, J.; Li, L.; Yan, D.; Liang, D.; et al. Novel KCNA5 Loss-of-Function Mutations Responsible for Atrial Fibrillation. J. Hum. Genet. 2009, 54, 277–283. [Google Scholar] [CrossRef] [PubMed]
  62. Nerbonne, J.M.; Kass, R.S. Molecular Physiology of Cardiac Repolarization. Physiol. Rev. 2005, 85, 1205–1253. [Google Scholar] [CrossRef] [PubMed]
  63. Guo, W.; Li, H.; London, B.; Nerbonne, J.M. Functional Consequences of Elimination of I(to,f) and I(to,s): Early Afterdepolarizations, Atrioventricular Block, and Ventricular Arrhythmias in Mice Lacking Kv1.4 and Expressing a Dominant-Negative Kv4 Alpha Subunit. Circ. Res. 2000, 87, 73–79. [Google Scholar] [CrossRef]
  64. Xu, H.; Li, H.; Nerbonne, J.M. Elimination of the Transient Outward Current and Action Potential Prolongation in Mouse Atrial Myocytes Expressing a Dominant Negative Kv4 α Subunit. J. Physiol. 1999, 519, 11–21. [Google Scholar] [CrossRef] [PubMed]
  65. Ordás, I.; Eckmann, L.; Talamini, M.; Baumgart, D.C.; Sandborn, W.J. Ulcerative Colitis. Lancet 2012, 380, 1606–1619. [Google Scholar] [CrossRef]
  66. Sinha, T.; Zain, Z.; Bokhari, S.F.H.; Waheed, S.; Reza, T.; Eze-Odurukwe, A.; Patel, M.; Almadhoun, M.K.I.K.; Hussain, A.; Reyaz, I. Navigating the Gut-Cardiac Axis: Understanding Cardiovascular Complications in Inflammatory Bowel Disease. Cureus 2024, 16, e55268. [Google Scholar] [CrossRef]
  67. Yu, L.; Meng, G.; Huang, B.; Zhou, X.; Stavrakis, S.; Wang, M.; Li, X.; Zhou, L.; Wang, Y.; Wang, M.; et al. A Potential Relationship between Gut Microbes and Atrial Fibrillation: Trimethylamine N-Oxide, a Gut Microbe-Derived Metabolite, Facilitates the Progression of Atrial Fibrillation. Int. J. Cardiol. 2018, 255, 92–98. [Google Scholar] [CrossRef]
  68. Jaworska, K.; Koper, M.; Ufnal, M. Gut Microbiota and Renin-Angiotensin System: A Complex Interplay at Local and Systemic Levels. Am. J. Physiol.-Gastrointest. Liver Physiol. 2021, 321, G355–G366. [Google Scholar] [CrossRef]
  69. Salmenkari, H.; Korpela, R.; Vapaatalo, H. Renin–Angiotensin System in Intestinal Inflammation—Angiotensin Inhibitors to Treat Inflammatory Bowel Diseases? Basic Clin. Pharmacol. Toxicol. 2021, 129, 161–172. [Google Scholar] [CrossRef]
  70. Higham, J.P.; Bhebhe, C.N.; Gupta, R.A.; Tranter, M.M.; Barakat, F.M.; Dogra, H.; Bab, N.; Wozniak, E.; Barker, K.H.; Wilson, C.H.; et al. Transcriptomic Profiling Reveals a Pronociceptive Role for Angiotensin II in Inflammatory Bowel Disease. Pain 2024, 165, 1592–1604. [Google Scholar] [CrossRef]
  71. Nowak, J.K.; Lindstrøm, J.C.; Kalla, R.; Ricanek, P.; Halfvarson, J.; Satsangi, J. Age, Inflammation, and Disease Location Are Critical Determinants of Intestinal Expression of SARS-CoV-2 Receptor ACE2 and TMPRSS2 in Inflammatory Bowel Disease. Gastroenterology 2020, 159, 1151–1154.e2. [Google Scholar] [CrossRef] [PubMed]
  72. Spencer, A.U.; Yang, H.; Haxhija, E.Q.; Wildhaber, B.E.; Greenson, J.K.; Teitelbaum, D.H. Reduced Severity of a Mouse Colitis Model with Angiotensin Converting Enzyme Inhibition. Dig. Dis. Sci. 2007, 52, 1060–1070. [Google Scholar] [CrossRef] [PubMed]
  73. Katada, K.; Yoshida, N.; Suzuki, T.; Okuda, T.; Mizushima, K.; Takagi, T.; Ichikawa, H.; Naito, Y.; Cepinskas, G.; Yoshikawa, T. Dextran Sulfate Sodium-Induced Acute Colonic Inflammation in Angiotensin II Type 1a Receptor Deficient Mice. Inflamm. Res. 2008, 57, 84–91. [Google Scholar] [CrossRef]
  74. Lymperopoulos, A.; Borges, J.I.; Stoicovy, R.A. RGS Proteins and Cardiovascular Angiotensin II Signaling: Novel Opportunities for Therapeutic Targeting. Biochem. Pharmacol. 2023, 218, 115904. [Google Scholar] [CrossRef] [PubMed]
  75. Demers, J.; Ton, A.; Huynh, F.; Thibault, S.; Ducharme, A.; Paradis, P.; Nemer, M.; Fiset, C. Atrial Electrical Remodeling in Mice with Cardiac-Specific Overexpression of Angiotensin II Type 1 Receptor. J. Am. Heart Assoc. Cardiovasc. Cerebrovasc. Dis. 2021, 11, e023974. [Google Scholar] [CrossRef]
  76. Gu, J.; Hu, W.; Liu, X. Pioglitazone Improves Potassium Channel Remodeling Induced by Angiotensin II in Atrial Myocytes. Med. Sci. Monit. Basic Res. 2014, 20, 153–160. [Google Scholar] [CrossRef]
  77. Oh, S.Y.; Cho, K.-A.; Kang, J.L.; Kim, K.H.; Woo, S.-Y. Comparison of Experimental Mouse Models of Inflammatory Bowel Disease. Int. J. Mol. Med. 2014, 33, 333–340. [Google Scholar] [CrossRef]
  78. Chen, L.; Fu, G.; Jiang, C. Mendelian Randomization as an Approach to Assess Causal Effects of Inflammatory Bowel Disease on Atrial Fibrillation. Aging 2021, 13, 12016–12030. [Google Scholar] [CrossRef]
Figure 1. Active colitis attenuates atrial and AV nodal conductance: (a) Schematic representation of the treatment protocol for DSS-induced colitis (A). Experimental days for active colitis (DSSA) and remission (DSSR) are marked. Treatment with ACE inhibitor (B) Perindopril (i(ACE): ip: 3 mg/kg/day) or AT1R blocker Losartan (i(AT1R): ip: 30 mg/kg/day) is indicated in grey. (b) Representative ECG recordings obtained in anesthetized control (CTL) and DSSA mice. Dotted black and purple lines show isoelectric lines; P-wave duration (Pdur), and PR interval are illustrated by solid lines. Quantification of (c) Pdur and (d) PR interval from ECGs recorded in anesthetized CTL (animals: n = 23), DSSA (n = 42), and DSSR (n = 12) mice. Data are presented as mean ± SD, and significance was determined by one-way ANOVA followed by Tukey’s multiple comparison test (c,d).
Biomolecules 15 00982 g001
Figure 2. Active colitis attenuates atrial conduction velocity: (a) Representative contour plot from a left atrial MEA recording. (b) Conduction velocity quantified from atrial CTL (white; hearts: n = 20), DSSA (blue; n = 26), and DSSR (hatched; n = 8) MEA recordings. (c) Representative western blot of Cx43 (top) and Ponceau S staining (bottom) with molecular weight (MW) markers labeled on the left (four different left atrial tissue samples, two technical controls). (d) Quantification of western blot results (c) normalized to total protein. Data are presented as mean ± SD, significance was determined by one-way ANOVA followed by Tukey’s multiple comparison test.
Biomolecules 15 00982 g002
Figure 3. Active colitis attenuates atrial AP upstroke velocity: (a) Representative AP recordings (1 Hz) from CTL- and DSSA-isolated atrial myocytes. Quantification of AP (b) maximal upstroke velocity (Vmax) and rise time from (c) 50% and (d) 10% to peak amplitude. Numbers of cells and mice (cells/mice) are provided within columns. Data are presented as mean ± SD, significance was determined by one-way Anova on ranks and Dunn’s multiple comparison test.
Biomolecules 15 00982 g003
Figure 4. Active colitis alters atrial INa activation and inactivation kinetics: (a) Representative traces of INa density, recorded in atrial myocytes isolated from CTL (left) and DSSA (right) mice, using the voltage protocol depicted. (b) Current-voltage relationship of INa peak current density from CTL (cells/mice: n = 37/6), DSSA (n = 31/6), and DSSR (n = 20/2) atrial myocytes. (c) Activation and inactivation kinetic of INa/INa,max fitted with a two-state Boltzmann distribution. Dotted line indicates half-maximal activation (V1/2a) and inactivation (V1/2b), respectively. (d) Expansion of the plot shown in (c,e). Western blot of Nav1.5 (top) and Ponceau S staining (bottom, left) with molecular weight (MW) markers labeled on the left (four different left atrial tissue samples, two technical controls). Quantification (right) of Western blot results. Significance was determined by one-way ANOVA followed by Tukey’s multiple comparison test (e).
Biomolecules 15 00982 g004
Figure 5. Active colitis alters atrial AP duration and dispersion: (a) Representative MEA recordings of atrial electrograms, black lines indicate duration of FPdur. (b) FPdur as a measure of APD and (c) FPdisp quantified from MEA recordings of CTL (n = 28), DSSA (n = 19), and DSSR (n = 13) hearts. (d) AP duration (e.g., APD10) at 10%, 50%, 70%, and 90% amplitude recorded in CTL (cells/mice: n = 97/19), DSSA (n = 81/20), and DSSR (n = 34/5) atrial myocytes. Insert shows APD10 with expanded y-axis. Data are presented as mean ± SD, significance was determined by one-way Anova followed by Tukey’s multiple comparison test (b) or one-way Anova on ranks and Dunn’s multiple comparison test.
Biomolecules 15 00982 g005
Figure 6. Active colitis reduces atrial IK specifically Ito: Representative traces of IK density, recorded in atrial myocytes from (a) CTL and (b) DSSA mice with voltage protocol shown as inset. (c) IK density vs. voltage (Vm) relationship from CTL (cells/mice: n = 78/10) and DSSA (n = 66/10) myocytes. Representative traces show atrial IK,ur current density from (d) CTL and (e) DSSA myocytes obtained with voltage protocol shown as inset. (f) Current density vs. voltage relationship of IK,ur from CTL (n = 78/10) and DSSA (n = 66/10) myocytes. Ito obtained from (g) CTL and (h) DSSA myocytes by subtraction of I − I = Ito. (i) Current density vs. voltage relationship of Ito from CTL (n = 78/10) and DSSA (n = 66/10) myocytes. Data are presented as mean ± SEM. Significance was determined by two-way ANOVA followed by Tukey’s multiple comparison test.
Biomolecules 15 00982 g006
Figure 7. Active colitis reduces atrial IK: (a) Representative traces of atrial IK current density recorded in CTL (top) and DSSA (bottom) myocytes with protocol at +40 mV, with and without 4-AP (100 µmol/L). (b) Quantification of the area under the curve (100 ms) of the 4-AP-sensitive IK(Ito) in CTL (cells/mice: n = 23/5) and DSSA (n = 20/6) atrial myocytes. (c) 4-AP-induced change in APD 10–90% in CTL (n = 27/8) and DSSA (n = 25/7) myocytes. Data are presented as mean ± SEM (b) or mean ± SD (c), and significance was determined by two-way Anova (b) or Mann–Whitney test (c).
Biomolecules 15 00982 g007
Figure 8. ACE inhibitor prevents electrophysiological remodeling. (a) Pdur and (b) PR interval quantified from ECGs recorded in CTL and DSSA mice as well as mice treated with i(ACE) during the induction of colitis. (c) INa current density vs. voltage plot of CTL (cells/mice: n = 37/6), DSSA (n= 31/6), and DSSi(ACE) (n = 32/6) myocytes. (d) Activation and inactivation kinetic of INa/INa,max fitted with two-state Boltzmann distributions of the data shown in (c). Dotted line indicates INa half maximal inactivation and activation, respectively. (e) Expansion of the plot shown in (d,f). AP amplitude (APA) and (g) Vmax quantified from AP recordings (1 Hz) in isolated atrial myocytes. (ce) Data are presented as mean ± SEM, the remaining as mean ± SD. Significance was determined by one-way ANOVA, followed by Tukey’s multiple comparison test.
Biomolecules 15 00982 g008
Figure 9. ACE inhibition during colitis (DSSi(ACE)) prevents APD prolongation: (a) APD at 10, 50, 70, and 90% of decay of CTL (cells/mice: n = 97/19), DSSA (n = 81/20), and DSSi(ACE) (n = 44/7) atrial myocytes. (b) Western blot (WB: top) of protein lysate from CTL, DSSA, and DSSi(ACE), atria stained with antibody against Cx43 together with the corresponding Ponceau S staining. (c) Quantification of Western blot shown in (b) data normalized to total protein determined by Ponceau S stain (atrial samples: n = 4, repeated twice). Data are presented as mean ± SD. Significance was determined by one-way ANOVA (a,b), followed by Tukey’s multiple comparison test.
Biomolecules 15 00982 g009
Table 1. Changes in Boltzmann parameters for INa activation and inactivation kinetic during colitis.
CTLDSSADSSRp Values
Activationn37/631/620/2CTL vs. DSSACTL vs. DSSRDSSA vs. DSSR
V1/2a−53.3 ± 0.2−49.2 ± 0.2−50.1 ± 0.2<0.001<0.0010.025
slope2.5 ± 0.23.0 ± 0.22.6 ± 0.20.0960.9320.327
Inactivationn37/631/620/2
V1/2i−79.2 ± 0.4−83.3 ± 0.3−80.7 ± 0.5<0.0010.024<0.001
slope−8.7 ± 0.3−9.1 ± 0.3−8.2 ± 0.40.5350.6340.179
Table 2. ACE inhibitor prevents changes in Boltzmann parameters for INa activation and inactivation kinetic during colitis.
CTLDSSADSSi(ACE)p Values
Activationn37/631/632/6CTL vs. DSSACTL vs. DSSi(ACE)DSSA vs. DSSi(ACE)
V1/2a−53.3 ± 0.2−49.2 ± 0.2−49.0 ± 0.3<0.001<0.0010.827
slope2.5 ± 0.23.0 ± 0.23.8 ± 0.20.162<0.0010.006
Inactivationn37/631/632/6
V1/2i−79.2 ± 0.4−83.3 ± 0.3−85.8 ± 0.4<0.001<0.001<0.001
slope−8.7 ± 0.3−9.1 ± 0.3−8.9 ± 0.40.7270.9970.785
Disclaimer/Publisher’s Note: The statements, opinions and data contained in all publications are solely those of the individual author(s) and contributor(s) and not of MDPI and/or the editor(s). MDPI and/or the editor(s) disclaim responsibility for any injury to people or property resulting from any ideas, methods, instructions or products referred to in the content.

