
Synergistic Effects of UVB and Ionizing Radiation on Human Non-Malignant Cells: Implications for Ozone Depletion and Secondary Cosmic Radiation Exposure

 ,
,  , , , , , ,
  , , and
  add
Show full author list
add
Show full author list
Abstract
1. Introduction
2. Materials and Methods
2.1. Cells
2.1.1. Human Non-Cancerous Cell Lines
2.1.2. Human Primary Lymphocytes (PBMCs)
2.2. Preparation of Cells for Exposure to Protons and UVB
2.2.1. Human Cell Lines
2.2.2. PBMCs
2.3. Preparation of Cells for Exposure to Gamma Rays and UVB
Human Non-Cancerous Cell Lines
2.4. Irradiation of Cells
2.4.1. Proton Irradiation
2.4.2. Gamma Irradiation
2.4.3. UVB Irradiation
2.5. Post-Exposure Investigations
2.5.1. Post-Exposure Cultivation of Cells
2.5.2. Cell Viability
2.5.3. DNA Damage Immunofluorescence Study
2.5.4. Transmission Electron Microscopy (TEM)—γH2AX Immunogold Labeling
2.5.5. Chromosomal Aberrations Assays
2.5.6. Gene Expression
3. Results
3.1. Cellular Viability
3.1.1. Exposure to Protons or/and UVB
Fibroblasts
Keratinocytes
Monocytes
3.1.2. Exposure to Gamma Rays or/and UVB
Fibroblasts
Keratinocytes
3.2. DNA Damage
3.2.1. Exposure to Protons and/or UVB
Fibroblasts
Keratinocytes
Monocytes
3.2.2. Exposure to Gamma Rays or/and UVB
Fibroblasts
Keratinocytes
3.3. Genomic Instability–Chromosomal Aberrations Assay
3.3.1. Exposure to Gamma Rays or/and UVB
3.3.2. Proton or/and UVB Induced Dicentric Frequencies in Lymphocytes
3.4. Stress Genes Expression Assay
- Fibroblasts
- Keratinocytes
- Monocytes
4. Discussion
5. Conclusions
Supplementary Materials
Author Contributions
Funding
Institutional Review Board Statement
Informed Consent Statement
Data Availability Statement
Acknowledgments
Conflicts of Interest
References
- Mironova, I.A.; Aplin, K.L.; Arnold, F.; Bazilevskaya, G.A.; Harrison, R.G.; Krivolutsky, A.A.; Nicoll, K.A.; Rozanov, E.V.; Turunen, E.; Usoskin, I.G. Energetic Particle Influence on the Earth’s Atmosphere. Space Sci. Rev. 2015, 194, 1–96. [Google Scholar] [CrossRef]
- IARC. IARC. IARC Working Group on the Evaluation of Carcinogenic Risks to Humans. In Solar and Ultraviolet Radiation; IARC: Lyon, France, 1992; Volume 55. [Google Scholar]
- Goodhead, D.T.; Weinfeld, M. Clustered DNA Damage and its Complexity: Tracking the History. Radiat. Res. 2024, 202, 385–407. [Google Scholar] [CrossRef] [PubMed]
- Mladenova, V.; Mladenov, E.; Stuschke, M.; Iliakis, G. DNA Damage Clustering after Ionizing Radiation and Consequences in the Processing of Chromatin Breaks. Molecules 2022, 27, 1540. [Google Scholar] [CrossRef]
- Mavragani, I.V.; Nikitaki, Z.; Kalospyros, S.A.; Georgakilas, A.G. Ionizing Radiation and Complex DNA Damage: From Prediction to Detection Challenges and Biological Significance. Cancers 2019, 11, 1789. [Google Scholar] [CrossRef]
- Volatier, T.; Schumacher, B. Short-Term UVB Irradiation Leads to Persistent DNA Damage in Limbal Epithelial Stem Cells, Partially Reversed by DNA Repairing Enzymes. Biology 2023, 12, 265. [Google Scholar] [CrossRef]
- Sage, E. Distribution and repair of photolesions in DNA: Genetic consequences and the role of sequence context. Photochem. Photobiol. 1993, 57, 163–174. [Google Scholar] [CrossRef]
- Rizzo, J.L.; Dunn, J.; Rees, A.; Rünger, T.M. No formation of DNA double-strand breaks and no activation of recombination repair with UVA. J. Investig. Dermatol. 2011, 131, 1139–1148. [Google Scholar] [CrossRef]
- Cadet, J.; Douki, T.; Ravanat, J.L. Oxidatively generated damage to cellular DNA by UVB and UVA radiation. Photochem. Photobiol. 2015, 91, 140–155. [Google Scholar] [CrossRef]
- Wang, H.; Kochevar, I.E. Involvement of UVB-induced reactive oxygen species in TGF-β biosynthesis and activation in keratinocytes. Free Radic. Biol. Med. 2005, 38, 890–897. [Google Scholar] [CrossRef]
- Heck, D.E.; Vetrano, A.M.; Mariano, T.M.; Laskin, J.D. UVB Light Stimulates Production of Reactive Oxygen Species: UNEXPECTED ROLE FOR CATALASE*. J. Biol. Chem. 2003, 278, 22432–22436. [Google Scholar] [CrossRef]
- Sánchez-Marzo, N.; Pérez-Sánchez, A.; Castillo, J.; Herranz-López, M.; Barrajón-Catalán, E.; Micol, V. P 187—Prevention of UVB-induced Oxidative Stress and DNA damage in human keratinocytes by citrus and olive formulations. Free Radic. Biol. Med. 2017, 108, S82. [Google Scholar] [CrossRef]
- Dunn, J.; Potter, M.; Rees, A.; Rünger, T.M. Activation of the Fanconi anemia/BRCA pathway and recombination repair in the cellular response to solar ultraviolet light. Cancer Res. 2006, 66, 11140–11147. [Google Scholar] [CrossRef] [PubMed]
- Marti, T.M.; Hefner, E.; Feeney, L.; Natale, V.; Cleaver, J.E. H2AX phosphorylation within the G1 phase after UV irradiation depends on nucleotide excision repair and not DNA double-strand breaks. Proc. Natl. Acad. Sci. USA 2006, 103, 9891–9896. [Google Scholar] [CrossRef]
- Rastogi, R.P.; Richa; Kumar, A.; Tyagi, M.B.; Sinha, R.P. Molecular mechanisms of ultraviolet radiation-induced DNA damage and repair. J. Nucleic Acids 2010, 2010, 592980. [Google Scholar] [CrossRef]
- Garinis, G.A.; Mitchell, J.R.; Moorhouse, M.J.; Hanada, K.; de Waard, H.; Vandeputte, D.; Jans, J.; Brand, K.; Smid, M.; van der Spek, P.J.; et al. Transcriptome analysis reveals cyclobutane pyrimidine dimers as a major source of UV-induced DNA breaks. EMBO J. 2005, 24, 3952–3962. [Google Scholar] [CrossRef]
- Greinert, R.; Volkmer, B.; Henning, S.; Breitbart, E.W.; Greulich, K.O.; Cardoso, M.C.; Rapp, A. UVA-induced DNA double-strand breaks result from the repair of clustered oxidative DNA damages. Nucleic Acids Res. 2012, 40, 10263–10273. [Google Scholar] [CrossRef]
- Song, J.M.; Milligan, J.R.; Sutherland, B.M. Bistranded oxidized purine damage clusters: Induced in DNA by long-wavelength ultraviolet (290–400 nm) radiation? Biochemistry 2002, 41, 8683–8688. [Google Scholar] [CrossRef]
- de Gruijl, F.R.; Longstreth, J.; Norval, M.; Cullen, A.P.; Slaper, H.; Kripke, M.L.; Takizawa, Y.; van der Leun, J.C. Health effects from stratospheric ozone depletion and interactions with climate change. Photochem. Photobiol. Sci. Off. J. Eur. Photochem. Assoc. Eur. Soc. Photobiol. 2003, 2, 16–28. [Google Scholar] [CrossRef]
- Sutherland, B.M.; Hacham, H.; Sutherland, J.C.; Gange, R.W. Pyrimidine Dimer Formation by UVA Radiation: Implications for Photoreactivation; Gromkowska-Kępka, K.J., Ed.; Brookhaven National Laboratory (BNL): Upton, NY, USA, 1991. [Google Scholar]
- Puścion-Jakubik, A. The impact of ultraviolet radiation on skin photoaging—Review of in vitro studies. J. Cosmet. Dermatol. 2021, 20, 3427–3431. [Google Scholar] [CrossRef]
- Sato, T. Analytical Model for Estimating Terrestrial Cosmic Ray Fluxes Nearly Anytime and Anywhere in the World: Extension of PARMA/EXPACS. PLoS ONE 2015, 10, e0144679. [Google Scholar] [CrossRef]
- Groom, D.E.; Mokhov, N.V.; Striganov, S.I. Muon stopping power and range tables 10 MeV–100 TeV. At. Data Nucl. Data Tables 2001, 78, 183–356. [Google Scholar] [CrossRef]
- Crosby, N.; Mavromichalaki, H.; Malandraki, O.; Gerontidou, M.; Karavolos, M.; Lingri, D.; Makrantoni, P.; Papailiou, M.; Paschalis, P.; Tezari, A. Very High Energy Solar Energetic Particle Events and Ground Level Enhancement Events: Forecasting and Alerts. Space Weather 2024, 22, e2023SW003839. [Google Scholar] [CrossRef]
- Brede, H.J.; Cosack, M.; Dietze, G.; Gumpert, H.; Guldbakke, S.; Jahr, R.; Kutscha, M.; Schlegel-Bickmann, D.; Schölermann, H. The Braunschweig accelerator facility for fast neutron research: 1: Building design and accelerators. Nucl. Instrum. Methods 1980, 169, 349–358. [Google Scholar] [CrossRef]
- Ziegler, J.F.; Ziegler, M.D.; Biersack, J.P. SRIM—The stopping and range of ions in matter (2010). Nucl. Instrum. Methods Phys. Res. Sect. B Beam Interact. Mater. At. 2010, 268, 1818–1823. [Google Scholar] [CrossRef]
- Tremi, I.; Havaki, S.; Georgitsopoulou, S.; Terzoudi, G.; Lykakis, I.N.; Iliakis, G.; Georgakilas, V.; Gorgoulis, V.G.; Georgakilas, A.G. Biological Response of Human Cancer Cells to Ionizing Radiation in Combination with Gold Nanoparticles. Cancers 2022, 14, 5086. [Google Scholar] [CrossRef]
- Nikitaki, Z.; Pariset, E.; Sudar, D.; Costes, S.V.; Georgakilas, A.G. In Situ Detection of Complex DNA Damage Using Microscopy: A Rough Road Ahead. Cancers 2020, 12, 3288. [Google Scholar] [CrossRef]
- Robertson, D.; Monaghan, P.; Clarke, C.; Atherton, A.J. An appraisal of low-temperature embedding by progressive lowering of temperature into Lowicryl HM20 for immunocytochemical studies. J. Microsc. 1992, 168, 85–100. [Google Scholar] [CrossRef]
- Tremi, I.; Havaki, S.; Georgitsopoulou, S.; Lagopati, N.; Georgakilas, V.; Gorgoulis, V.G.; Georgakilas, A.G. A Guide for Using Transmission Electron Microscopy for Studying the Radiosensitizing Effects of Gold Nanoparticles In Vitro. Nanomaterials 2021, 11, 859. [Google Scholar] [CrossRef]
- Ainsbury, E.A.; Lloyd, D.C. Dose estimation software for radiation biodosimetry. Health Phys. 2010, 98, 290–295. [Google Scholar] [CrossRef]
- Dobre, M.; Boscencu, R.; Neagoe, I.V.; Surcel, M.; Milanesi, E. Insight into the Web of Stress Responses Triggered at Gene Expression Level by Porphyrin-PDT in HT29 Human Colon Carcinoma Cells. Pharmaceutics 2021, 13, 1032. [Google Scholar] [CrossRef]
- Xie, F.; Xiao, P.; Chen, D.; Xu, L.; Zhang, B. miRDeepFinder: A miRNA analysis tool for deep sequencing of plant small RNAs. Plant Mol. Biol. 2012, 80, 75–84. [Google Scholar] [CrossRef] [PubMed]
- Meyer, B.; Voss, K.O.; Tobias, F.; Jakob, B.; Durante, M.; Taucher-Scholz, G. Clustered DNA damage induces pan-nuclear H2AX phosphorylation mediated by ATM and DNA-PK. Nucleic Acids Res. 2013, 41, 6109–6118. [Google Scholar] [CrossRef]
- Barnes, L.; Dumas, M.; Juan, M.; Noblesse, E.; Tesniere, A.; Schnebert, S.; Guillot, B.; Molès, J.P. GammaH2AX, an accurate marker that analyzes UV genotoxic effects on human keratinocytes and on human skin. Photochem. Photobiol. 2010, 86, 933–941. [Google Scholar] [CrossRef] [PubMed]
- Panier, S.; Boulton, S.J. Double-strand break repair: 53BP1 comes into focus. Nat. Rev. Mol. Cell Biol. 2014, 15, 7–18. [Google Scholar] [CrossRef]
- Hayes, J.D.; Dinkova-Kostova, A.T.; Tew, K.D. Oxidative Stress in Cancer. Cancer Cell 2020, 38, 167–197. [Google Scholar] [CrossRef]
- Habano, W.; Miura, T.; Terashima, J.; Ozawa, S. Aryl hydrocarbon receptor as a DNA methylation reader in the stress response pathway. Toxicology 2022, 470, 153154. [Google Scholar] [CrossRef]
- Goshen, I.; Yirmiya, R. Interleukin-1 (IL-1): A central regulator of stress responses. Front. Neuroendocrinol. 2009, 30, 30–45. [Google Scholar] [CrossRef]
- Hwang, B.J.; Gonzales, R.; Corzine, S.; Stenson, E.; Pidugu, L.; Lu, A.L. DNA binding by the Rad9A subunit of the Rad9-Rad1-Hus1 complex. PLoS ONE 2022, 17, e0272645. [Google Scholar] [CrossRef]
- Miao, E.A.; Rajan, J.V.; Aderem, A. Caspase-1-induced pyroptotic cell death. Immunol. Rev. 2011, 243, 206–214. [Google Scholar] [CrossRef]
- Han, J.; Flemington, C.; Houghton, A.B.; Gu, Z.; Zambetti, G.P.; Lutz, R.J.; Zhu, L.; Chittenden, T. Expression of bbc3, a pro-apoptotic BH3-only gene, is regulated by diverse cell death and survival signals. Proc. Natl. Acad. Sci. USA 2001, 98, 11318–11323. [Google Scholar] [CrossRef]
- Gehrmann, M.; Marienhagen, J.; Eichholtz-Wirth, H.; Fritz, E.; Ellwart, J.; Jäättelä, M.; Zilch, T.; Multhoff, G. Dual function of membrane-bound heat shock protein 70 (Hsp70), Bag-4, and Hsp40: Protection against radiation-induced effects and target structure for natural killer cells. Cell Death Differ. 2005, 12, 38–51. [Google Scholar] [CrossRef] [PubMed]
- Liu, W.; Ding, I.; Chen, K.; Olschowka, J.; Xu, J.; Hu, D.; Morrow, G.R.; Okunieff, P. Interleukin 1beta (IL1B) signaling is a critical component of radiation-induced skin fibrosis. Radiat. Res. 2006, 165, 181–191. [Google Scholar] [CrossRef] [PubMed]
- Liang, Y.Y.; Niu, F.Y.; Xu, A.A.; Jiang, L.L.; Liu, C.S.; Liang, H.P.; Huang, Y.F.; Shao, X.F.; Mo, Z.W. Increased MCL-1 synthesis promotes irradiation-induced nasopharyngeal carcinoma radioresistance via regulation of the ROS/AKT loop. Cell Death Dis. 2022, 13, 131. [Google Scholar] [CrossRef] [PubMed]
- Sansonetti, P.J.; Phalipon, A.; Arondel, J.; Thirumalai, K.; Banerjee, S.; Akira, S.; Takeda, K.; Zychlinsky, A. Caspase-1 activation of IL-1beta and IL-18 are essential for Shigella flexneri-induced inflammation. Immunity 2000, 12, 581–590. [Google Scholar] [CrossRef]
- Sharma, M.R.; Mitrani, R.; Werth, V.P. Effect of TNFα blockade on UVB-induced inflammatory cell migration and collagen loss in mice. J. Photochem. Photobiol. B Biol. 2020, 213, 112072. [Google Scholar] [CrossRef]
- Lee, K.J.; Park, K.H.; Hahn, J.H. Alleviation of Ultraviolet-B Radiation-Induced Photoaging by a TNFR Antagonistic Peptide, TNFR2-SKE. Mol. Cells 2019, 42, 151–160. [Google Scholar] [CrossRef]
- Tang, X.; Yang, T.; Yu, D.; Xiong, H.; Zhang, S. Current insights and future perspectives of ultraviolet radiation (UV) exposure: Friends and foes to the skin and beyond the skin. Environ. Int. 2024, 185, 108535. [Google Scholar] [CrossRef]
- Loscalzo, J.; Barabasi, A.-L. Systems biology and the future of medicine. WIREs Syst. Biol. Med. 2011, 3, 619–627. [Google Scholar] [CrossRef]
- D’Errico, M.; Teson, M.; Calcagnile, A.; De Santis, L.P.; Nikaido, O.; Botta, E.; Zambruno, G.; Stefanini, M.; Dogliotti, E. Apoptosis and efficient repair of DNA damage protect human keratinocytes against UVB. Cell Death Differ. 2003, 10, 754–756. [Google Scholar] [CrossRef]
- Mbundi, L.; Gallar-Ayala, H.; Khan, M.R.; Barber, J.L.; Losada, S.; Busquets, R. Chapter Two—Advances in the Analysis of Challenging Food Contaminants: Nanoparticles, Bisphenols, Mycotoxins, and Brominated Flame Retardants. In Advances in Molecular Toxicology; Fishbein, J.C., Heilman, J.M., Eds.; Elsevier: Amsterdam, The Netherlands, 2014; Volume 8, pp. 35–105. [Google Scholar]
- Chaurasia, R.K.; Shirsath, K.B.; Desai, U.N.; Bhat, N.N.; Sapra, B.K. Establishment of in vitro Calibration Curve for (60)Co-γ-rays Induced Phospho-53BP1 Foci, Rapid Biodosimetry and Initial Triage, and Comparative Evaluations with γH2AX and Cytogenetic Assays. Front. Public Health 2022, 10, 845200. [Google Scholar] [CrossRef]
- Dhuppar, S.; Roy, S.; Mazumder, A. γH2AX in the S Phase after UV Irradiation Corresponds to DNA Replication and Does Not Report on the Extent of DNA Damage. Mol. Cell. Biol. 2020, 40, e00328-20. [Google Scholar] [CrossRef] [PubMed]
- Nikitaki, Z.; Nikolov, V.; Mavragani, I.V.; Mladenov, E.; Mangelis, A.; Laskaratou, D.A.; Fragkoulis, G.I.; Hellweg, C.E.; Martin, O.A.; Emfietzoglou, D.; et al. Measurement of complex DNA damage induction and repair in human cellular systems after exposure to ionizing radiations of varying linear energy transfer (LET). Free Radic. Res. 2016, 50, S64–S78. [Google Scholar] [CrossRef] [PubMed]
- Saul, D.; Kosinsky, R.L.; Atkinson, E.J.; Doolittle, M.L.; Zhang, X.; LeBrasseur, N.K.; Pignolo, R.J.; Robbins, P.D.; Niedernhofer, L.J.; Ikeno, Y.; et al. A new gene set identifies senescent cells and predicts senescence-associated pathways across tissues. Nat. Commun. 2022, 13, 4827. [Google Scholar] [CrossRef]
- Cazzalini, O.; Scovassi, A.I.; Savio, M.; Stivala, L.A.; Prosperi, E. Multiple roles of the cell cycle inhibitor p21(CDKN1A) in the DNA damage response. Mutat. Res. 2010, 704, 12–20. [Google Scholar] [CrossRef]
- Lau, L.; Porciuncula, A.; Yu, A.; Iwakura, Y.; David, G. Uncoupling the Senescence-Associated Secretory Phenotype from Cell Cycle Exit via Interleukin-1 Inactivation Unveils Its Protumorigenic Role. Mol. Cell. Biol. 2019, 39, e00586-18. [Google Scholar] [CrossRef]
- Lambert, B.; Hansson, K.; Bui, T.H.; Funes-Cravioto, F.; Lindsten, J. DNA repair and frequency of x-ray and u.v.-light induced chromosome aberrations in leukocytes from patients with Down’s syndrome. Ann. Hum. Genet. 1976, 39, 293–303. [Google Scholar] [CrossRef]
- Holmberg, M. Lack of synergistic effect between X-ray and UV irradiation on the frequency of chromosome aberrations in PHA-stimulated human lymphocytes in the G1 stage. Mutat. Res. 1976, 34, 141–148. [Google Scholar] [CrossRef]
- Staaf, E.; Brehwens, K.; Haghdoost, S.; Nievaart, S.; Pachnerova-Brabcova, K.; Czub, J.; Braziewicz, J.; Wojcik, A. Micronuclei in human peripheral blood lymphocytes exposed to mixed beams of X-rays and alpha particles. Radiat. Environ. Biophys. 2012, 51, 283–293. [Google Scholar] [CrossRef]
- Sollazzo, A.; Shakeri-Manesh, S.; Fotouhi, A.; Czub, J.; Haghdoost, S.; Wojcik, A. Interaction of low and high LET radiation in TK6 cells-mechanistic aspects and significance for radiation protection. J. Radiol. Prot. Off. J. Soc. Radiol. Prot. 2016, 36, 721–735. [Google Scholar] [CrossRef]
- Lopez Riego, M.; Meher, P.; Brzozowska, B.; Akuwudike, P.; Bucher, M.; Oestreicher, U.; Lundholm, L.; Wojcik, A. Chromosomal damage, gene expression and alternative transcription in human lymphocytes exposed to mixed ionizing radiation as encountered in space. Sci. Rep. 2024, 14, 11502. [Google Scholar] [CrossRef]
- Sollazzo, A.; Brzozowska, B.; Cheng, L.; Lundholm, L.; Scherthan, H.; Wojcik, A. Live Dynamics of 53BP1 Foci Following Simultaneous Induction of Clustered and Dispersed DNA Damage in U2OS Cells. Int. J. Mol. Sci. 2018, 19, 519. [Google Scholar] [CrossRef] [PubMed]
- Cheng, L.; Brzozowska, B.; Sollazzo, A.; Lundholm, L.; Lisowska, H.; Haghdoost, S.; Wojcik, A. Simultaneous induction of dispersed and clustered DNA lesions compromises DNA damage response in human peripheral blood lymphocytes. PLoS ONE 2018, 13, e0204068. [Google Scholar] [CrossRef]
- Łukasiewicz, S.; Czeczelewski, M.; Forma, A.; Baj, J.; Sitarz, R.; Stanisławek, A. Breast Cancer—Epidemiology, Risk Factors, Classification, Prognostic Markers, and Current Treatment Strategies—An Updated Review. Cancers 2021, 13, 4287. [Google Scholar] [CrossRef] [PubMed]
- Revell, S.H. The Breakage-and-Reunion Theory and the Exchange Theory for Chromosomal Aberrations Induced by Ionizing Radiations: A Short History. In Advances in Radiation Biology; Lett, J.T., Adler, H., Zelle, M., Eds.; Elsevier: Amsterdam, The Netherlands, 1974; Volume 4, pp. 367–416. [Google Scholar]
- Kuznetsov, K.A.; Onyshchenko, G.M.; Nikolov, O.T. Cell stress response to combined ionizing and non-ionizing radiation and magnetic fields: A review based on human buccal epithelium cells. Biophys. Bull. 2024, 52, 33–44. [Google Scholar] [CrossRef]
- Morizane, S.; Mukai, T.; Sunagawa, K.; Tachibana, K.; Kawakami, Y.; Ouchida, M. “Input/output cytokines” in epidermal keratinocytes and the involvement in inflammatory skin diseases. Front. Immunol. 2023, 14, 1239598. [Google Scholar] [CrossRef]
- Wang, Z.; Qi, F.; Luo, H.; Xu, G.; Wang, D. Inflammatory Microenvironment of Skin Wounds. Front. Immunol. 2022, 13, 789274. [Google Scholar] [CrossRef]
- Orlando, F.A.; Mainous, A.G., 3rd. Editorial: Inflammation and chronic disease. Front. Med. 2024, 11, 1434533. [Google Scholar] [CrossRef]
- Talapko, J.; Talapko, D.; Katalinić, D. Health Effects of Ionizing Radiation on the Human Body. Medicina 2024, 60, 653. [Google Scholar] [CrossRef]
- Shin, E.; Lee, S.; Kang, H.; Kim, J.; Kim, K.; Youn, H.; Jin, Y.W.; Seo, S.; Youn, B. Organ-Specific Effects of Low Dose Radiation Exposure: A Comprehensive Review. Front. Genet. 2020, 11, 566244. [Google Scholar] [CrossRef]
- Hernández, A.; Endesfelder, D.; Einbeck, J. Biodose Tools: An R shiny application for biological dosimetry. Int. J. Radiat. Biol. 2023, 99, 1378–1390. [Google Scholar] [CrossRef]
- Dimri, G.P.; Lee, X.; Basile, G.; Acosta, M.; Scott, G.; Roskelley, C.; Medrano, E.E.; Linskens, M.; Rubelj, I.; Pereira-Smith, O.; et al. A biomarker that identifies senescent human cells in culture and in aging skin in vivo. Proc. Natl. Acad. Sci. USA 1995, 92, 9363–9367. [Google Scholar] [CrossRef]


| Assay | Exposure Set Up | Cell Type | Results |
|---|---|---|---|
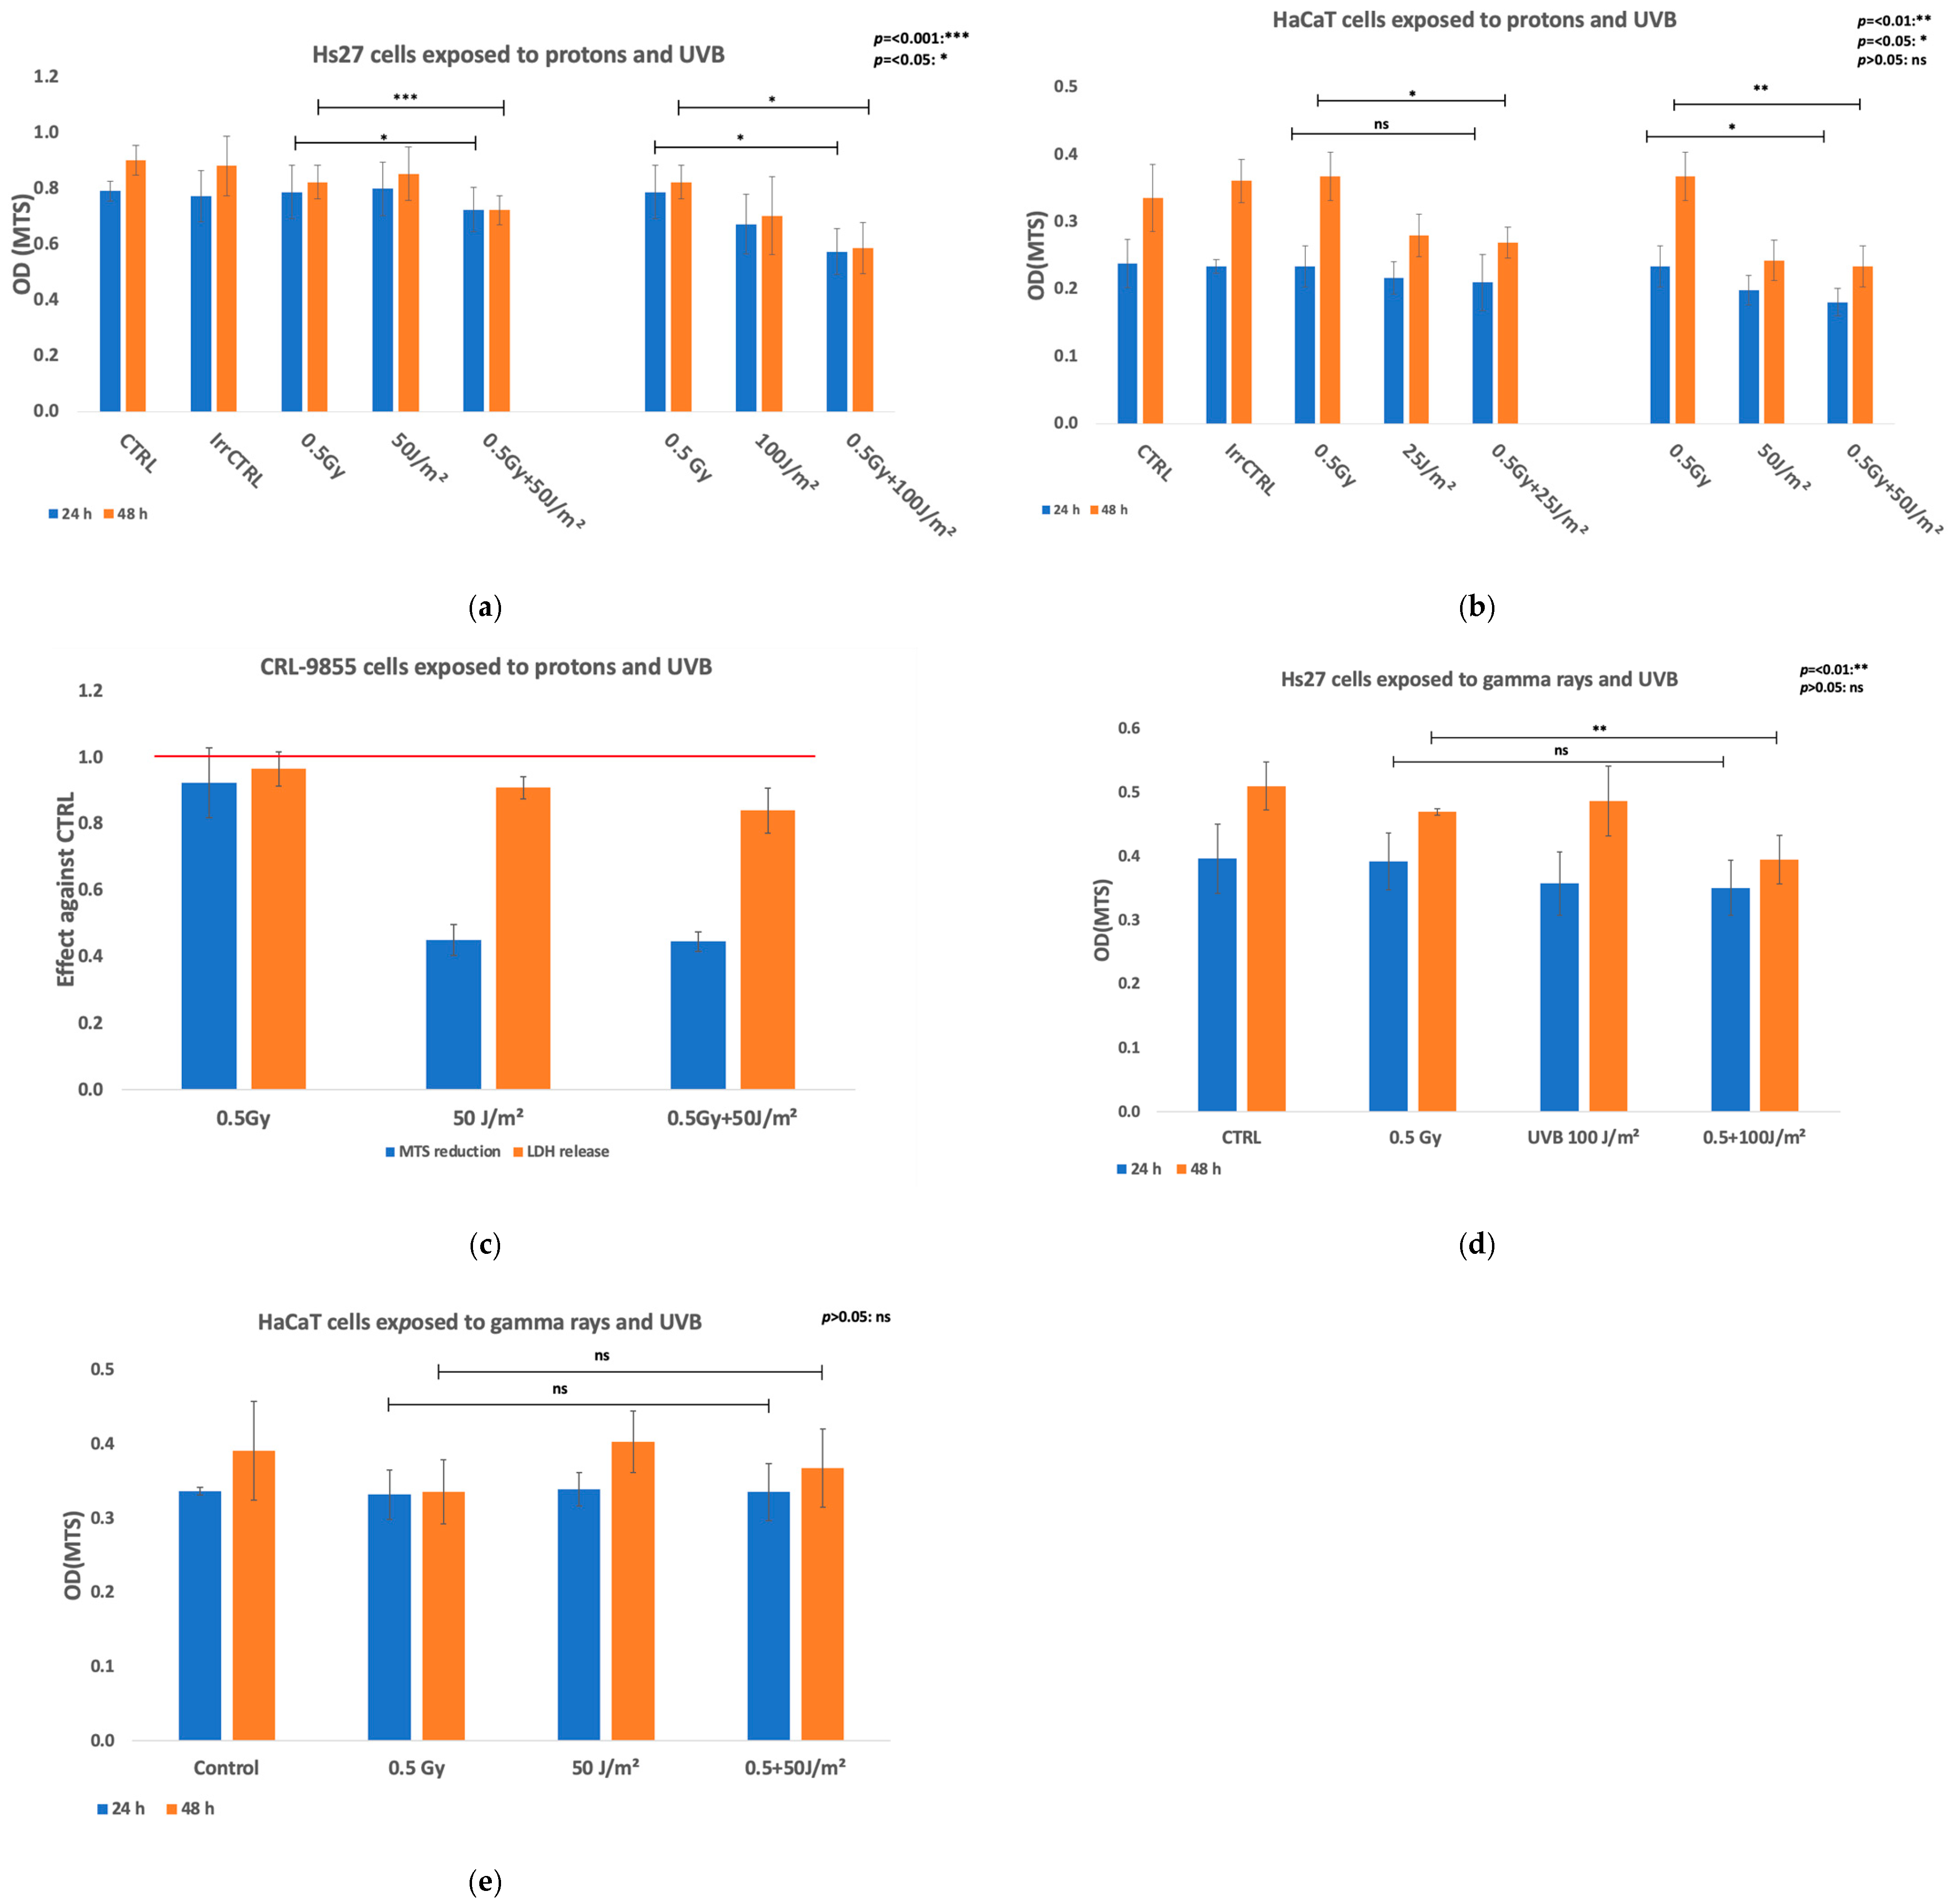
| Viability (MTS reduction) | Protons + UVB | Keratinocytes (HaCaT) | Significantly lower in co-exposed cells at 24 h but at 48 h was mainly due to UVB exposure. |
| Fibroblasts (Hs27) | Marked decrease in MTS reduction at 24 h and 48 h after irradiation in co-exposed cells both against protons and UVB alone. | ||
| Monocytes (CRL-9855) | Marked decrease in MTS reduction at 24 h post-exposure was due to UVB exposure. | ||
| Gamma rays + UVB | Keratinocytes (HaCaT) | MTS reduction did not alter at 24 h or 48 h post-co-exposure. | |
| Fibroblasts (Hs27) | Pronounced decrease at 48 h after co-exposure. | ||
| Viability (manual counting) | Gamma rays + UVB | Fibroblasts (VH10) | Co-exposure reduced cell survival. |
| DNA Damage IF γH2AΧ | Protons + UVB | Keratinocytes (HaCaT) | In co-exposed cells, the γH2AX foci number increased 6 h post-exposure (particularly in the co-exposure with the higher UVB dose). This synergistic effect was still evident at 24 h. |
| Fibroblasts (Hs27) | Co-exposed with the higher UVB fluence displayed markedly higher levels of γH2AX foci per nucleus at all time points. | ||
| Monocytes (CRL-9855) | In co-exposed, the number of γH2AX foci was increased, the synergistic effect persisting over 24 h. | ||
| Gamma rays + UVB | Keratinocytes (HaCaT) | The co-exposure to did not result in statistically higher number of γH2AX foci. | |
| Fibroblasts (Hs27) | The co-exposure resulted in more severe damage, with a statistically significant difference at the 24 h time point. | ||
| Fibroblasts (VH10) | The co-exposure to resulted in significantly greater damage across all time points. | ||
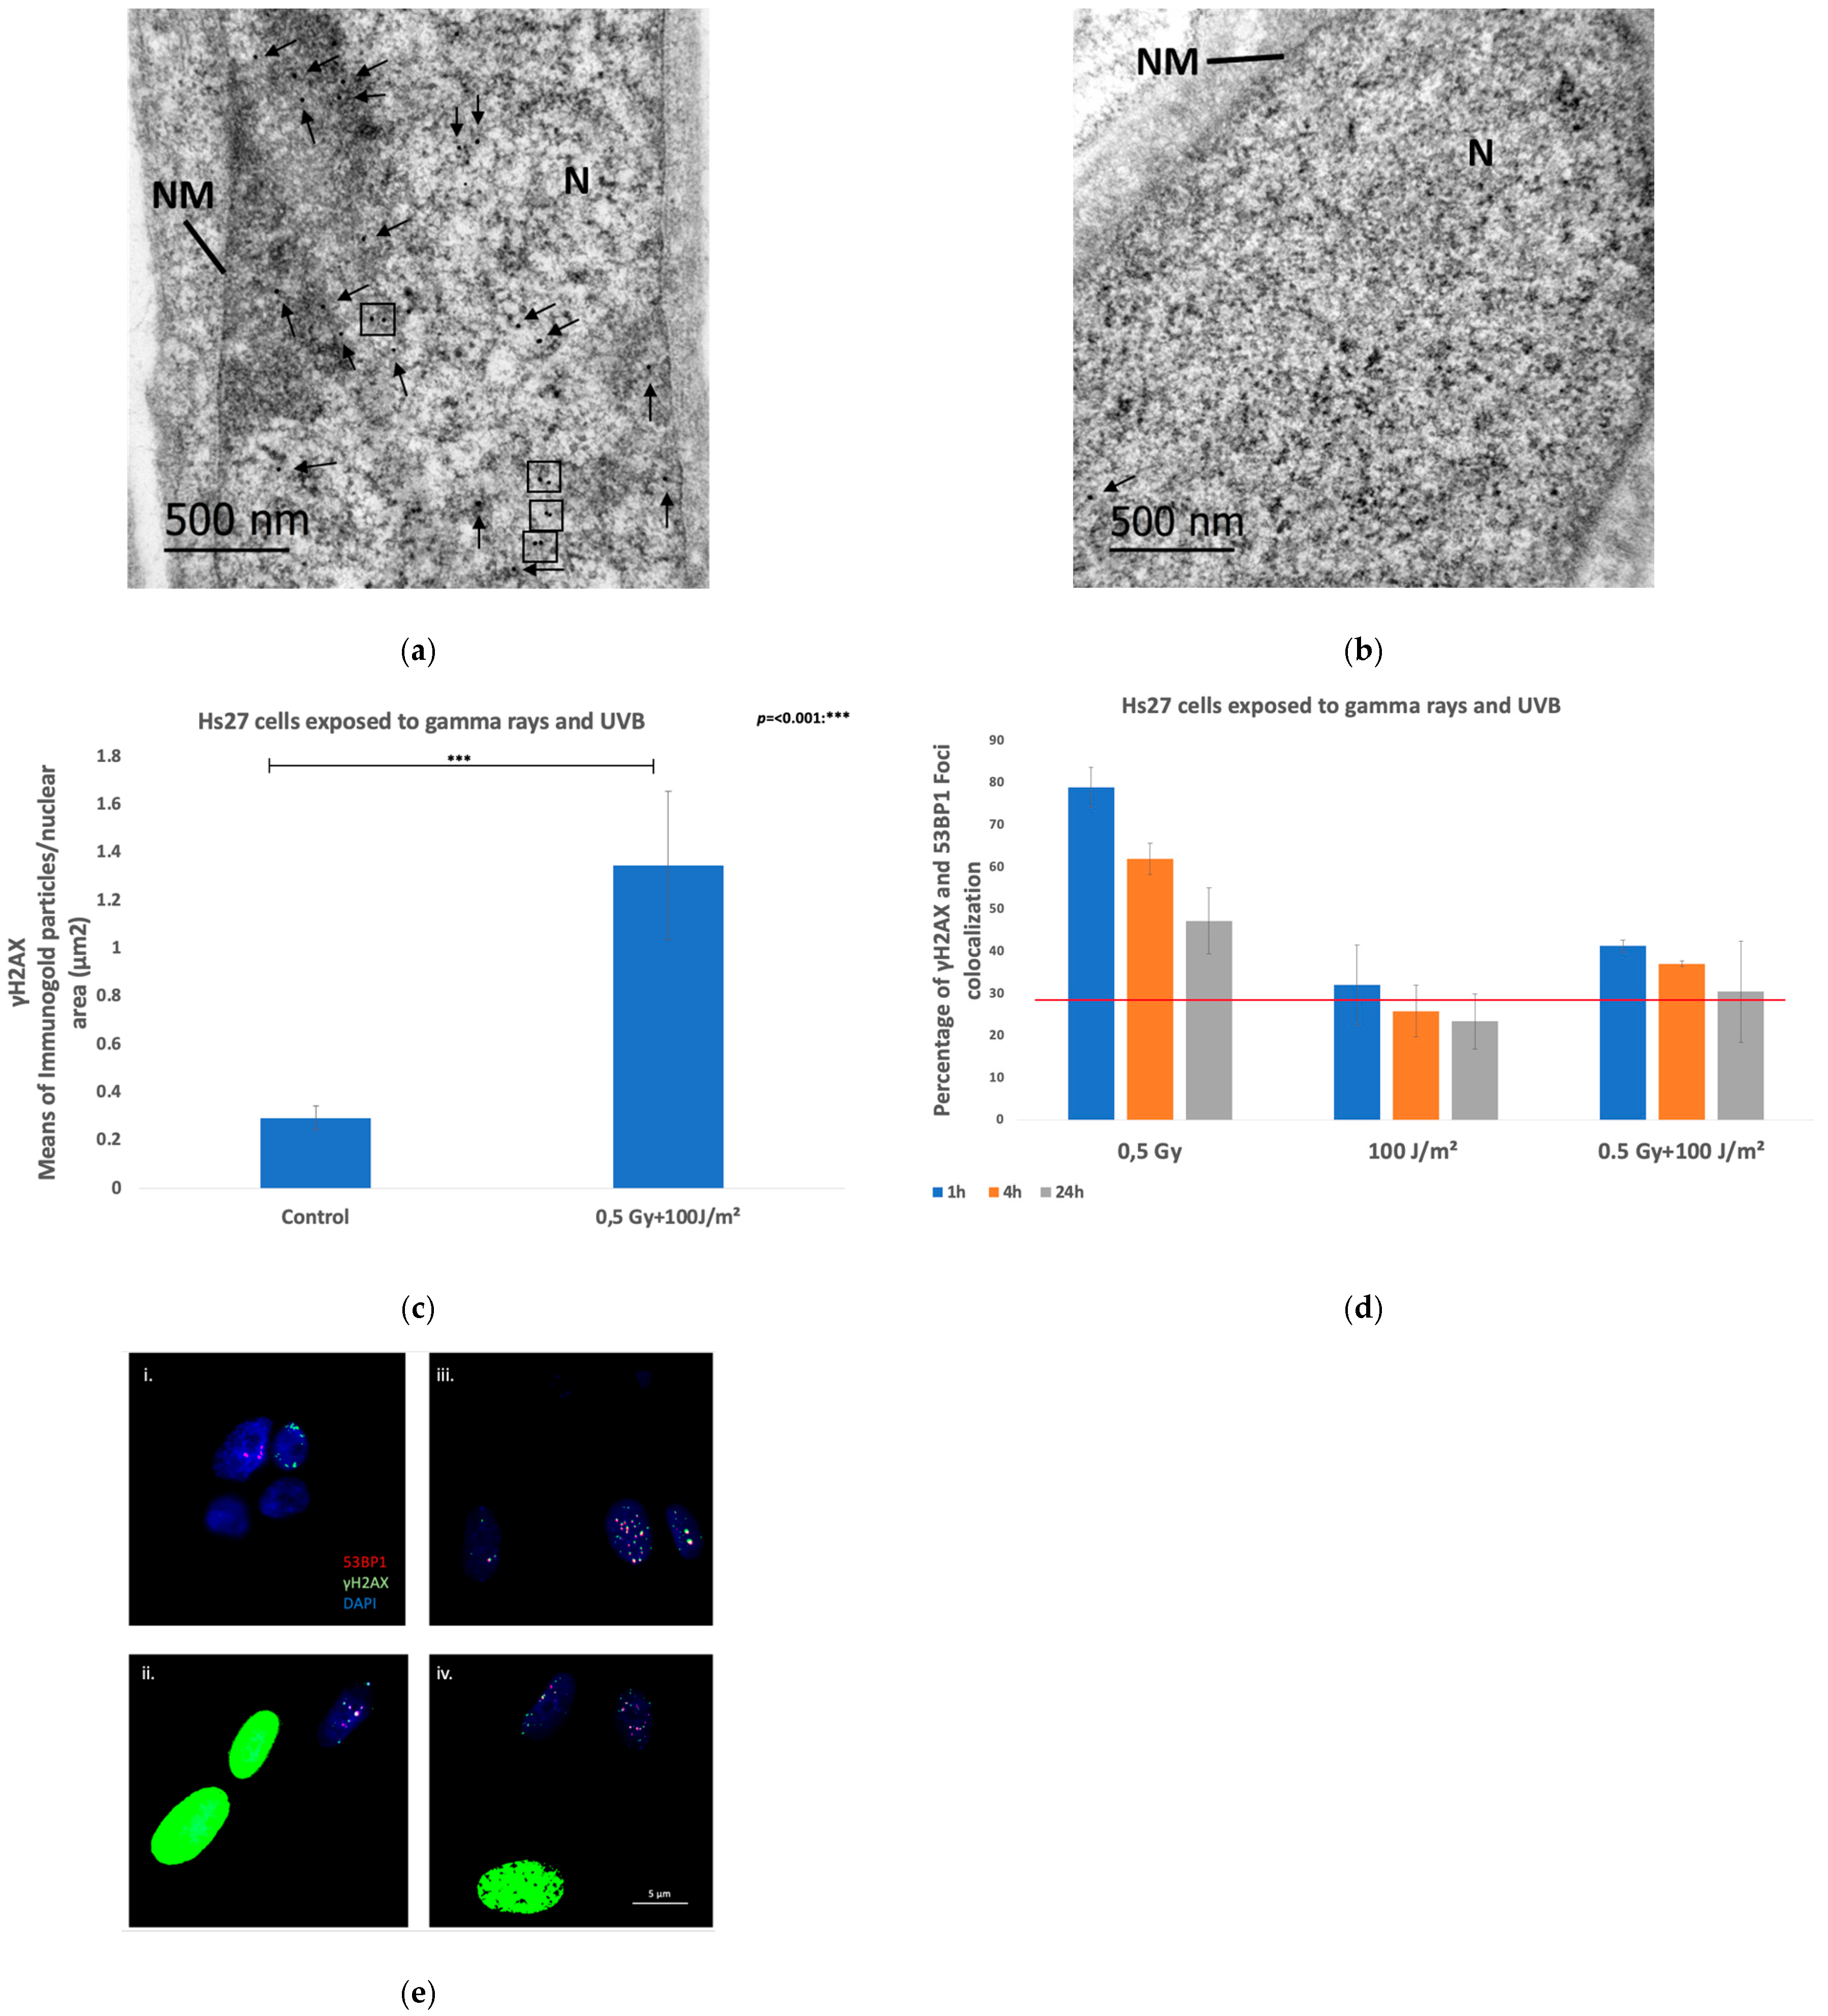
| DNA Damage IF γH2AΧ-53PB1 | Gamma rays + UVB | Fibroblasts (Hs27) | Co-exposure resulted in high percentages of colocalization compared to UVB-exposed samples, but significant lower at all time points compared to samples exposed to ionizing radiation. |
| Transmission electron microscopy—γH2AX immunogold labeling | Gamma rays + UVB | Fibroblasts (Hs27) | In co-exposed cells, the number of γH2AX particles per μm2 of nuclear surface area was significantly elevated compared to the control sample while 48.75% of the analyzed nuclear areas exhibited γH2AX gold particle clusters. |
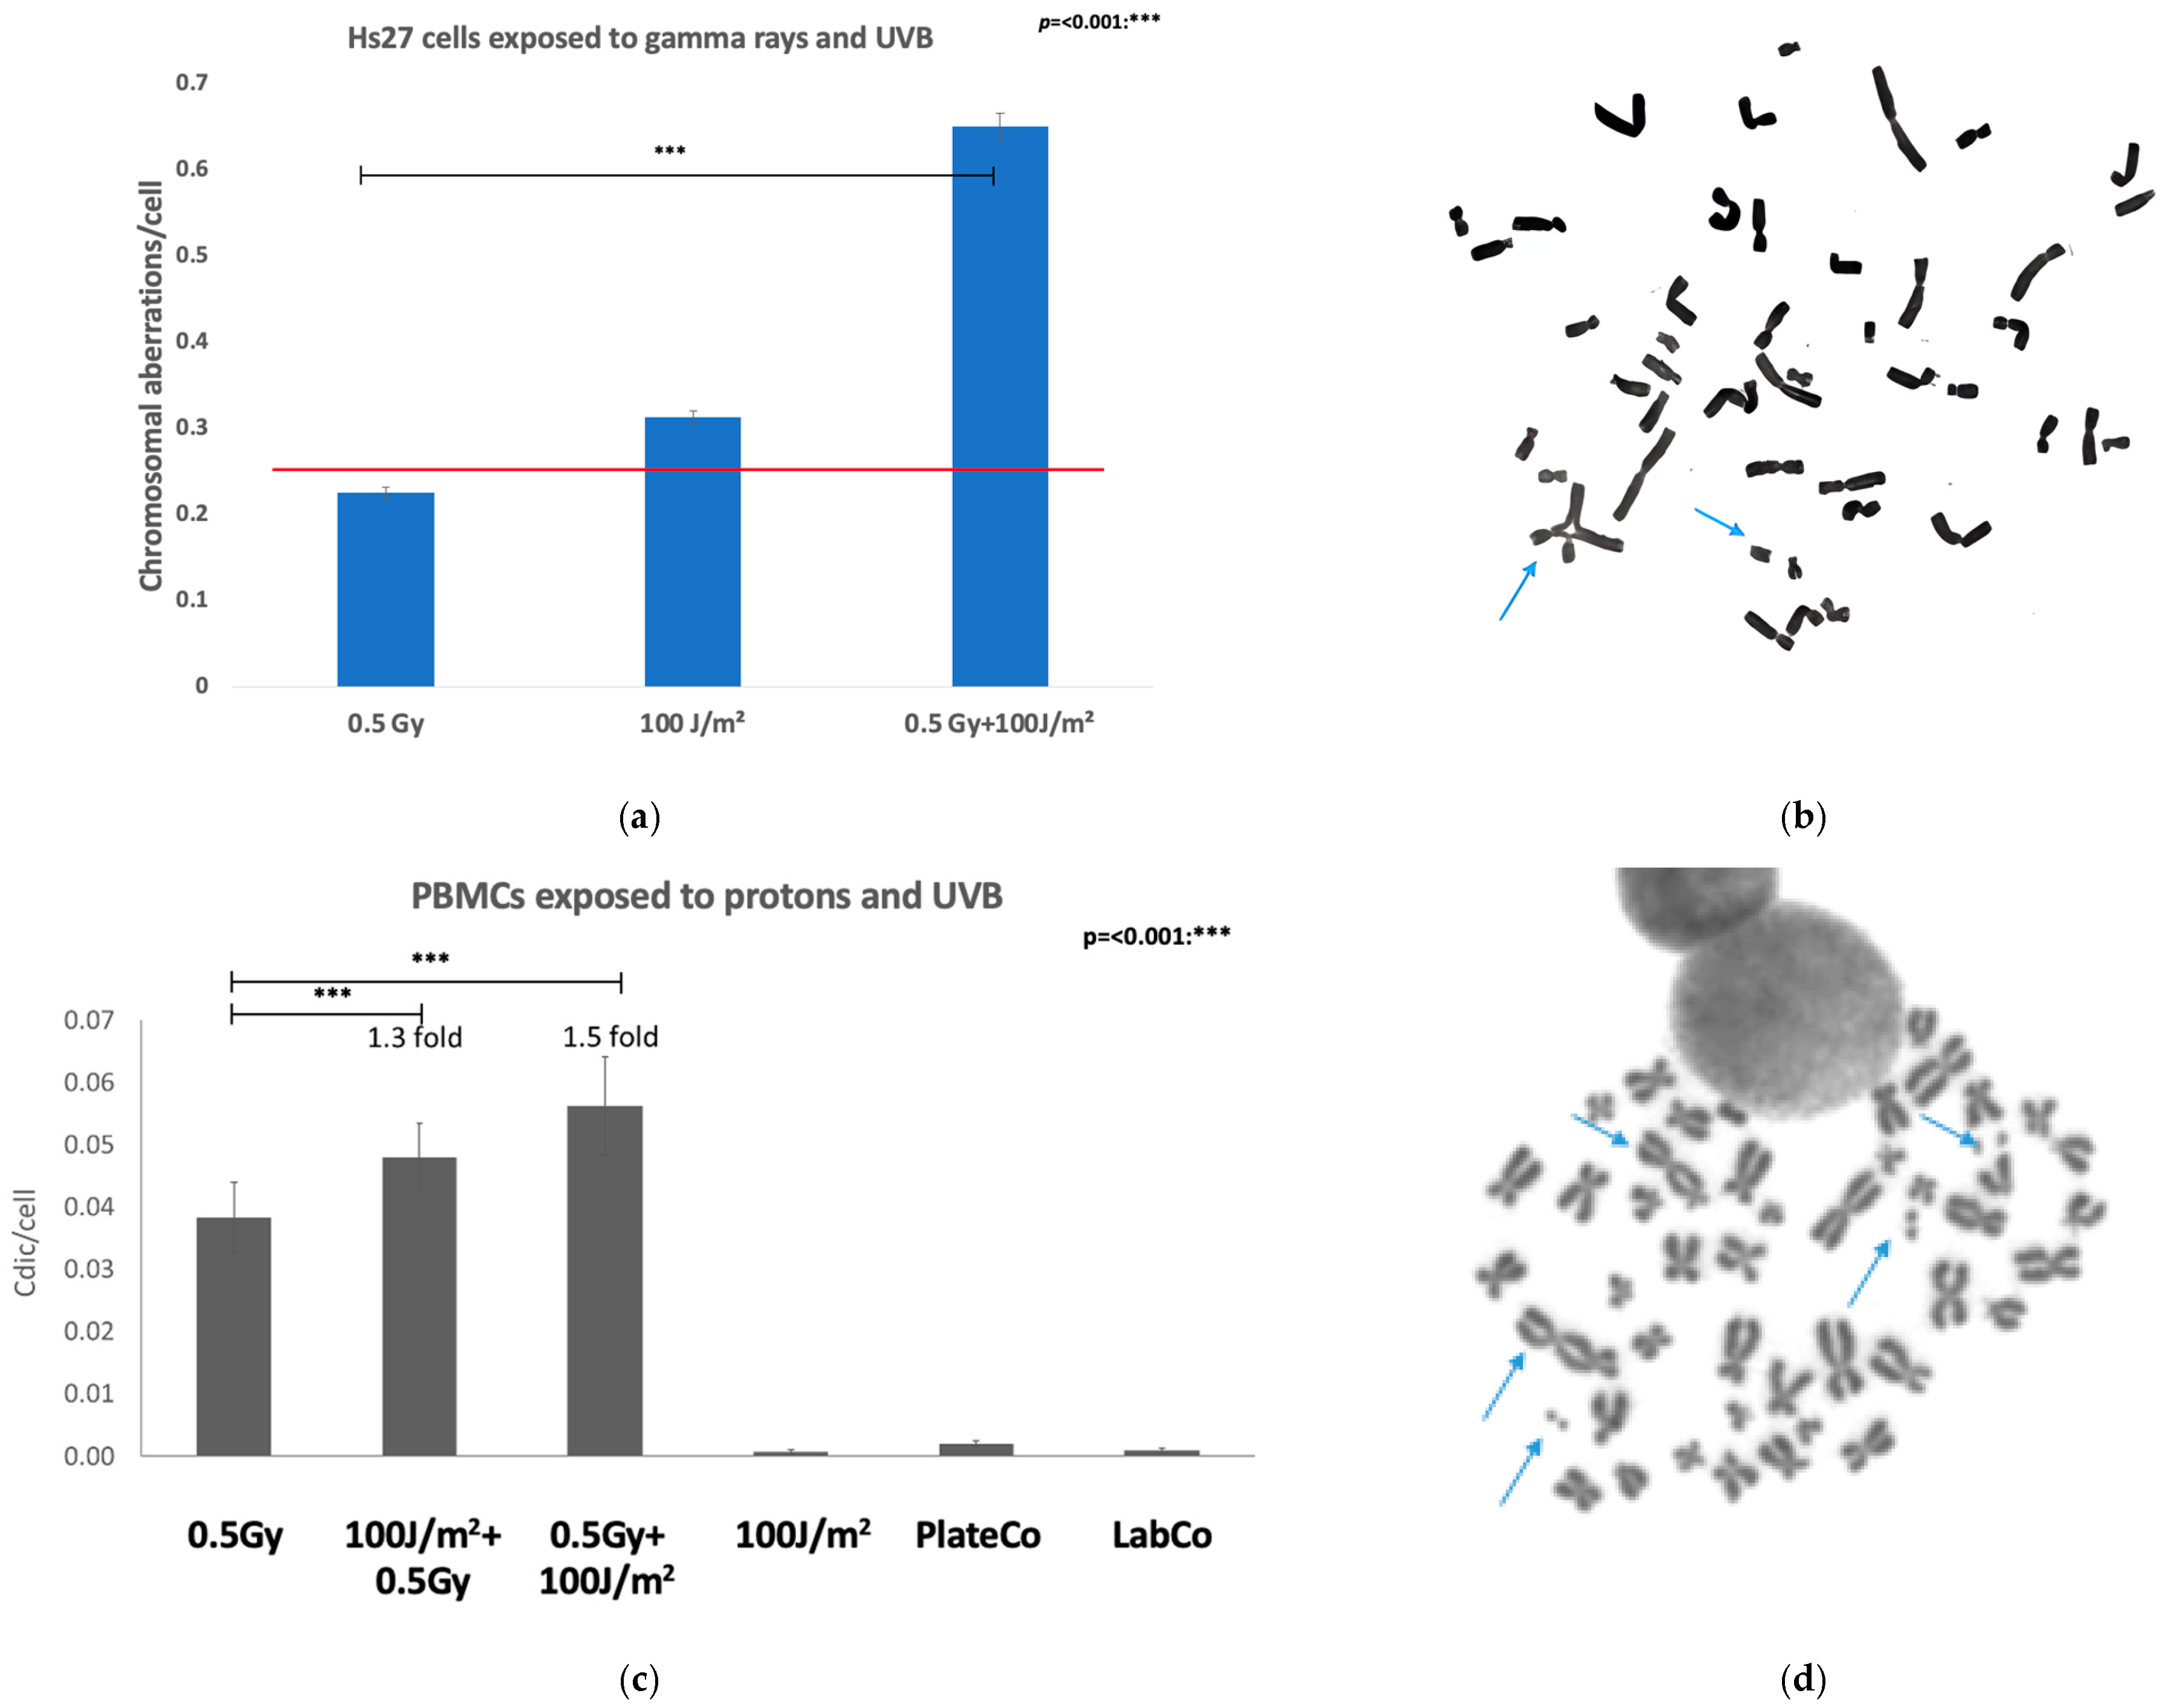
| Genomic instability-Chromosomal aberrations | Protons + UVB | PBMCs | Dicentric yield increased about 1.5-fold in co-exposed cells compared to proton-irradiated samples. |
| Gamma rays + UVB | Fibroblasts (Hs27) | The chromosomal aberration yields in co-exposed cells was increased about 1.5-fold compared to gamma irradiated samples. | |
| Gene expression | Protons + UVB | Keratinocytes (HaCaT) | ATM, ATR, DDB2, and CASP1 were up-regulated at 48 h post co-exposure. |
| Fibroblasts (Hs27) | GADD45A, CDKN1A, HUS 1, XPC, ATM DDB2, FAS, and TNFRSF10 were up-regulated at 48 h post co-exposure. | ||
| Monocytes (CRL-9855) | The TNFRSF1 gene involved in necrotic cell death, was down-regulated only in co-exposed cells, while single stressors did not significantly affect their expression. Only the pro-inflammatory stress genes IL1Aand IL1B were up-regulated at 24 h in co-exposed cells or in cells exposed to UVB alone, whilst being down-regulated in cells exposed to protons alone. | ||
| Senescence (SA-β-gal) | Gamma rays + UVB | Fibroblasts (VH10) | The mixed radiation treatment increased the percentage of senescent cells. |
Disclaimer/Publisher’s Note: The statements, opinions and data contained in all publications are solely those of the individual author(s) and contributor(s) and not of MDPI and/or the editor(s). MDPI and/or the editor(s) disclaim responsibility for any injury to people or property resulting from any ideas, methods, instructions or products referred to in the content. |
© 2025 by the authors. Licensee MDPI, Basel, Switzerland. This article is an open access article distributed under the terms and conditions of the Creative Commons Attribution (CC BY) license (https://creativecommons.org/licenses/by/4.0/).
Share and Cite
Gkikoudi, A.; Manda, G.; Beinke, C.; Giesen, U.; Al-Qaaod, A.; Dragnea, E.-M.; Dobre, M.; Neagoe, I.V.; Sangsuwan, T.; Haghdoost, S.; et al. Synergistic Effects of UVB and Ionizing Radiation on Human Non-Malignant Cells: Implications for Ozone Depletion and Secondary Cosmic Radiation Exposure. Biomolecules 2025, 15, 536. https://doi.org/10.3390/biom15040536
Gkikoudi A, Manda G, Beinke C, Giesen U, Al-Qaaod A, Dragnea E-M, Dobre M, Neagoe IV, Sangsuwan T, Haghdoost S, et al. Synergistic Effects of UVB and Ionizing Radiation on Human Non-Malignant Cells: Implications for Ozone Depletion and Secondary Cosmic Radiation Exposure. Biomolecules. 2025; 15(4):536. https://doi.org/10.3390/biom15040536
Chicago/Turabian StyleGkikoudi, Angeliki, Gina Manda, Christina Beinke, Ulrich Giesen, Amer Al-Qaaod, Elena-Mihaela Dragnea, Maria Dobre, Ionela Victoria Neagoe, Traimate Sangsuwan, Siamak Haghdoost, and et al. 2025. "Synergistic Effects of UVB and Ionizing Radiation on Human Non-Malignant Cells: Implications for Ozone Depletion and Secondary Cosmic Radiation Exposure" Biomolecules 15, no. 4: 536. https://doi.org/10.3390/biom15040536
APA StyleGkikoudi, A., Manda, G., Beinke, C., Giesen, U., Al-Qaaod, A., Dragnea, E.-M., Dobre, M., Neagoe, I. V., Sangsuwan, T., Haghdoost, S., Vasilopoulos, S. N., Triantopoulou, S., Georgakopoulou, A., Tremi, I., Koutsoudaki, P. N., Havaki, S., Gorgoulis, V. G., Kokkoris, M., Krasniqi, F., ... Georgakilas, A. G. (2025). Synergistic Effects of UVB and Ionizing Radiation on Human Non-Malignant Cells: Implications for Ozone Depletion and Secondary Cosmic Radiation Exposure. Biomolecules, 15(4), 536. https://doi.org/10.3390/biom15040536