1. Introduction
The initial defense against viral infection is the innate immune response [
1,
2]. In the event of a virus infection, host cell pattern recognition receptors (PRRs) recognize viral nucleic acids, which can function as pathogen-associated molecular patterns. One important PRR for detecting intracellular viral RNA and coordinating the antiviral response is retinoic acid-inducible gene I (RIG-I)-like receptors [
3,
4].
Mitochondrial antiviral-signaling protein (MAVS), also known as IPS-1/VISA/Cardif, is a key adaptor in the RIG-I pathway, coordinating antiviral and antitumor responses through signal transduction [
5,
6,
7,
8,
9]. RIG-I is a crucial cytosolic PRR within the innate immune system. It detects viral RNA, especially double-stranded RNA and 5′-triphosphorylated RNA, triggering a cascade of antiviral responses, including the induction of Type I interferons [
8].
MAVS is not an interferon-stimulated gene and so its expression is not directly regulated by interferons. MAVS levels are regulated through transcriptional and post-transcriptional mechanisms [
10].
Signal transduction pathways are essential for controlling the level of inflammation during the immune response. Diversification of protein form and function is the key to the regulation of these pathways [
11]. Several splice variants that have been suggested to adversely regulate MAVS signaling are also encoded by the
MAVS gene [
12]. A single gene locus may be alternatively spliced and/or translated to produce multiple proteins with different functions [
11]. Human full-length (FL)-MAVS is composed of 540 amino acids. The caspase activation and recruitment domain (CARD) at the N-terminus can interact with the CARD at RIG-I/MDA5. The C-terminus is the transmembrane (TM) domain. This domain localizes MAVS to the outer mitochondrial membrane. Furthermore, three active motifs in a proline-rich region bind to downstream E3 ubiquitin ligase TRAFs [
7]. MiniMAVS, a truncated isoform of human MAVS with 398 amino acids that lacks the CARD and partial proline-rich region, has also been discovered. The translation of MiniMAVS starts from Met142 but not Met1 due to alternative translation [
11]. The N-terminally truncated isoform of MAVS ∼50 kDa was reported in several studies [
6,
13,
14]. MAVS aggregation is essential for amplifying, sustaining, and regulating the antiviral innate immune response. The prion-like nature of MAVS aggregates ensures self-perpetuating activation and robust signal amplification while its mitochondrial localization integrates immune signaling with cellular metabolism. Aggregation provides a stable platform for sustained immune responses, tightly regulated to prevent inappropriate activation [
13]. Both the truncated form and FL-MAVS were produced from the same bicistronic MAVS transcript [
11,
15]. On virus infection, FL-MAVS forms functional prion-like aggregates [
13]. Although it is not completely elucidated, a study reports that MiniMAVS functions in inhibiting the spontaneous aggregation of FL-MAVS until viral infection [
16]. Human MAVS exhibits a structural similarity to rat MAVS, which is composed of 507 amino acids. In this study, we aimed to sequence and clone a novel rat MAVS variant (MAVS500), which has not been previously described in the literature. The expression of MAVS500 was evaluated in human embryonic kidney 293T (HEK293T) and rat bladder cancer Nara bladder tumor no.2 (NBT-II) cells by Western Blot and fluorescent microscopy approaches. Identification of novel rat MAVS isoforms may provide new insights for the nuclear factor kappa B (NFκβ)-associated molecular pathways.
2. Materials and Methods
2.1. Plasmids
PcDNA-DEST53 GFP (Invitrogen, Waltham, MA, USA) and p3xFlag-CMV/DEST (Invitrogen, Waltham, MA, USA) mammalian destination vectors and the E. coli DH5α bacterial strain (Invitrogen, Waltham, MA, USA) used for the cloning of expression vectors were kindly provided by Prof. Ersan Kalay (Karadeniz Technical University).
2.2. RNA Extraction and cDNA Synthesis
RNA extraction was performed on rat NBT-II cells using an RNA Isolation Kit (Macharey Nagel, Germany) according to the manufacturer’s instructions. The quantity and quality of the isolated RNAs were assessed by spectrophotometry and electrophoresis on a 1% agarose gel. Rat NBT-II cDNA was synthesized from 2 μg total RNA using the High-Capacity cDNA Reverse Transcription Kit (Catalog# 4368814, Thermo-Fisher Scientific, Waltham, MA, USA), following the manufacturer’s instructions, using random primers and reverse transcriptase. Agarose gel electrophoresis was performed to assess the quality of the synthesized cDNAs.
2.3. PCR and PCR Clean-Up
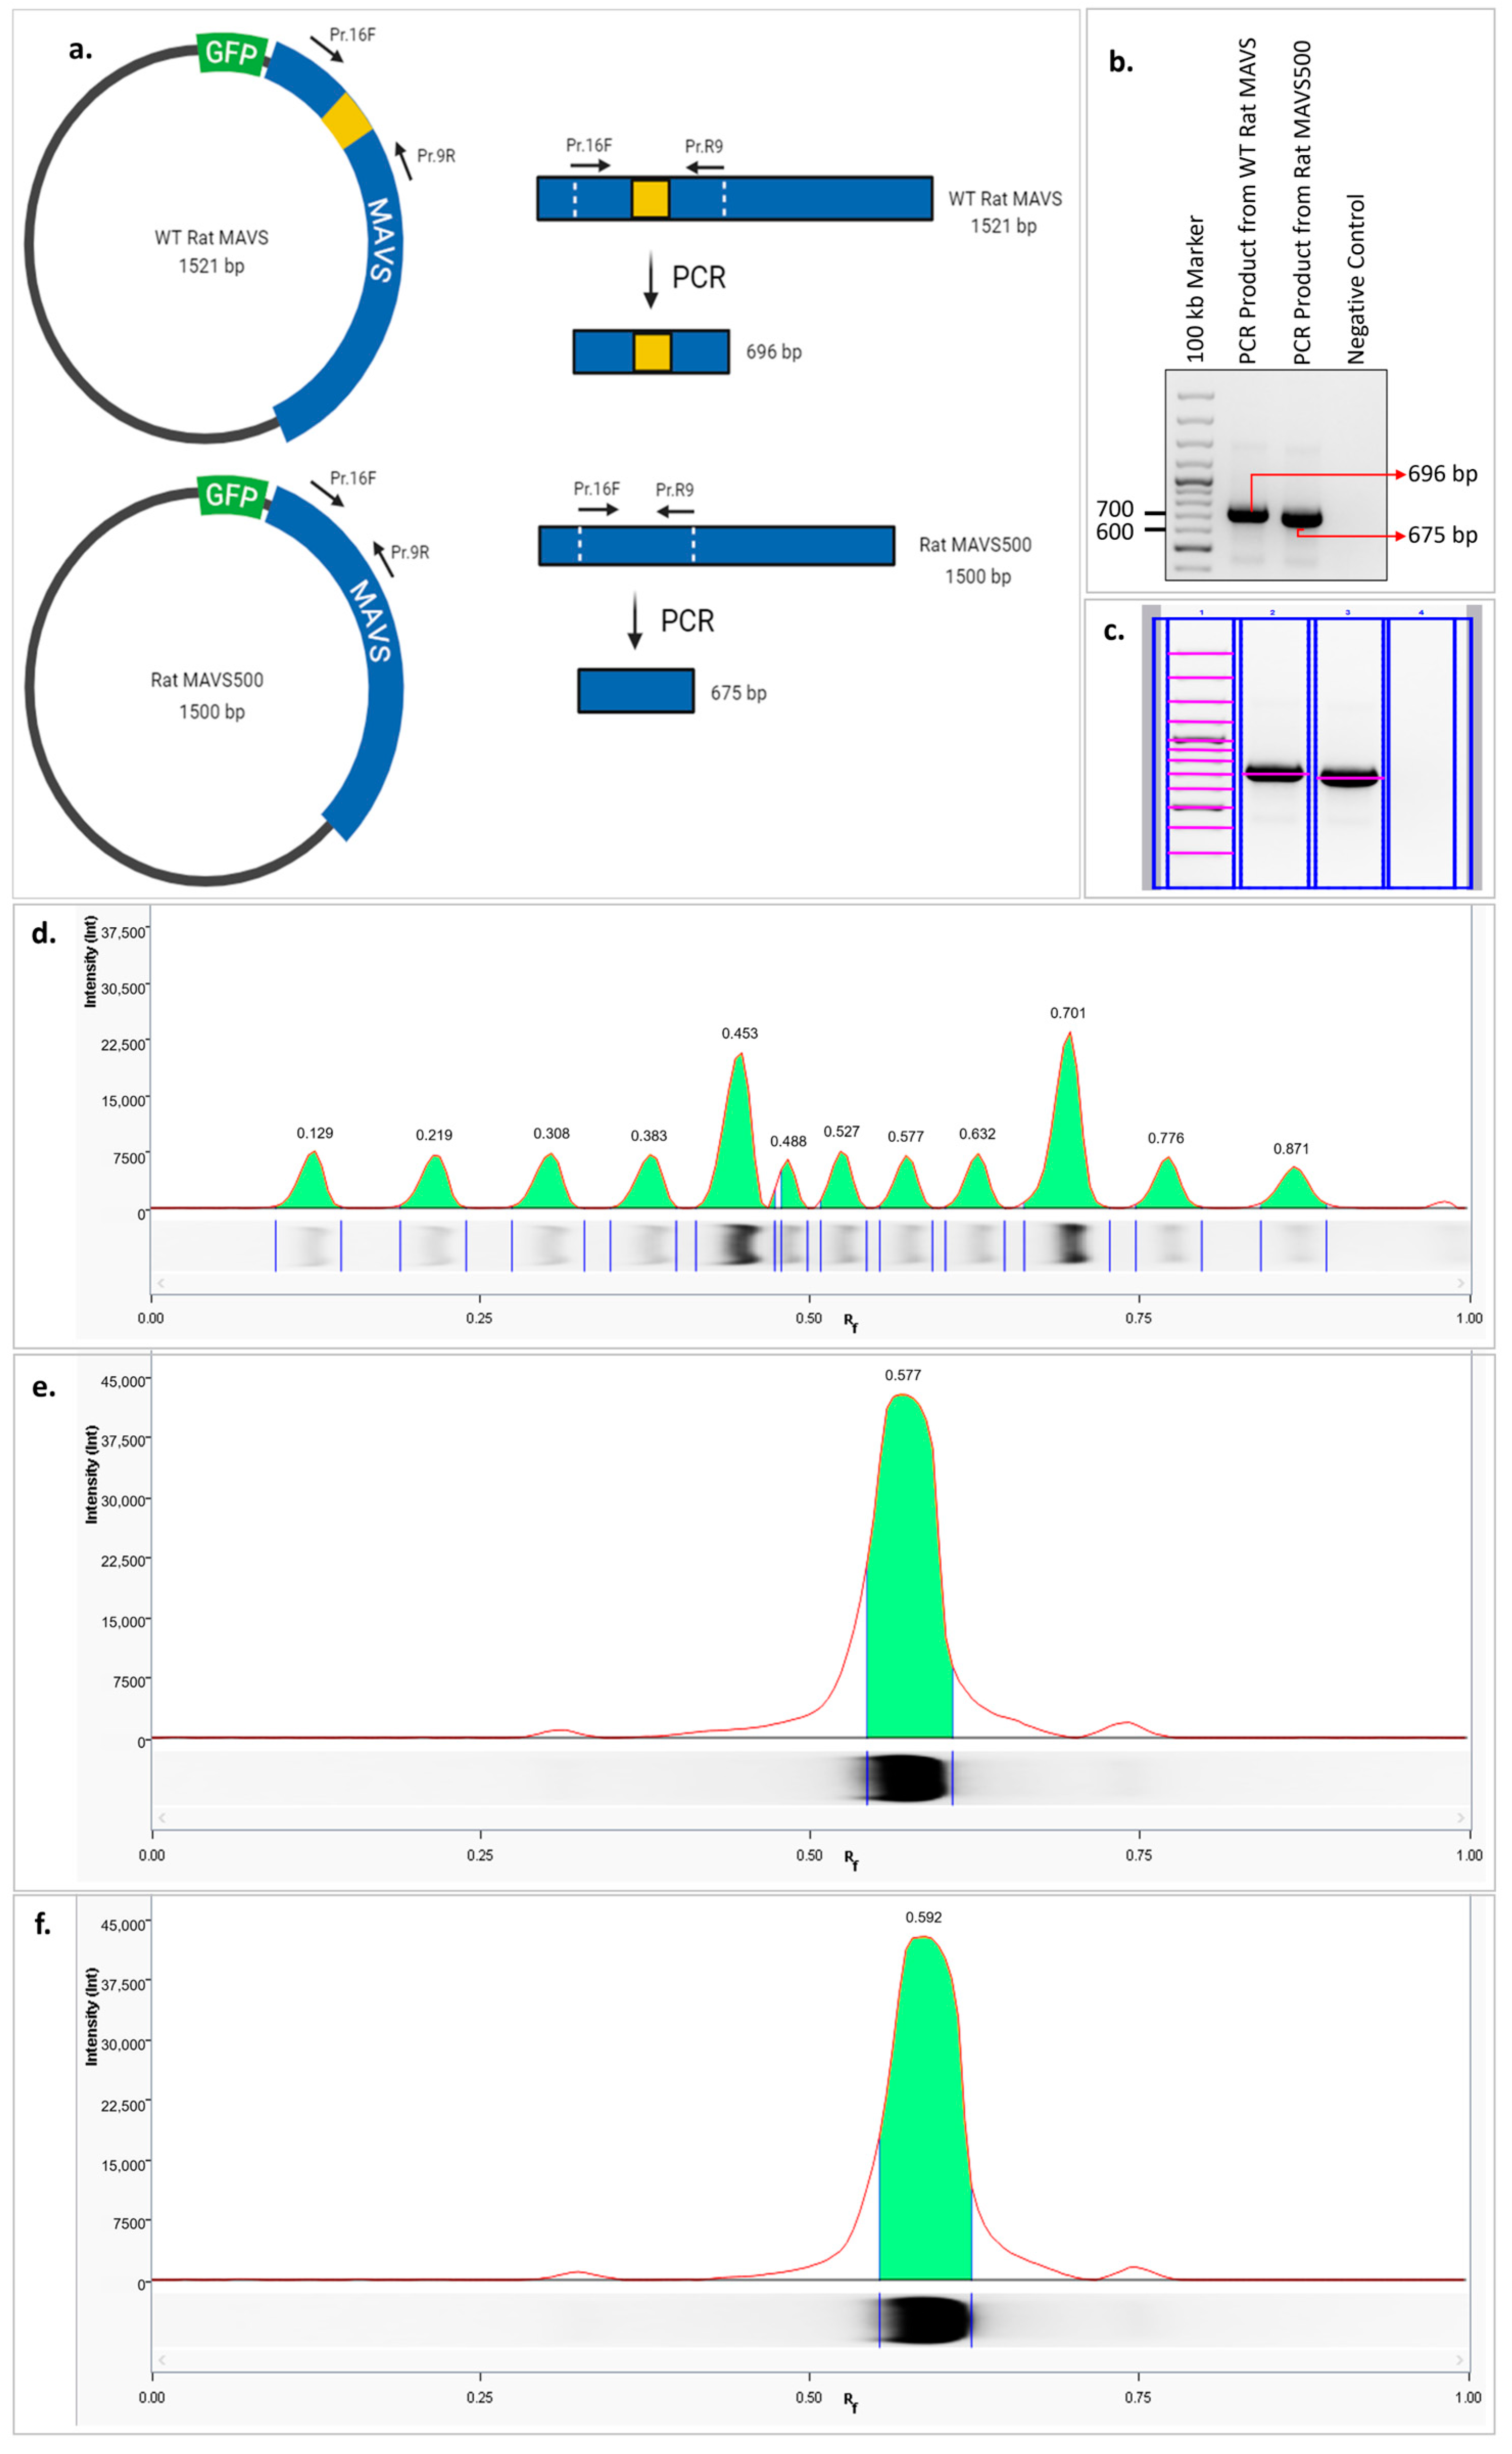
Rat NBT-II cDNA was used as a template in the PCR reaction performed to amplify the rat MAVS gene. The reaction was performed using 5′-ggggggacaagtttgtacaaaaaagcaggcttcACATTTGCTGAGGAAAAGACCTATAAGTATATCCG-3′ forward and 5′-ggggggaccactttgtacaagaagaaagctgggtcTCACTGGGCCAGGTGCCTGC-3′ reverse primer pairs carrying attB1 and attb2 sequences and the Phusion™ Hot Start II DNA Polymerase (2 U/μL) (Catalog # F549S, Thermo-Fisher Scientific, Waltham, MA, USA) enzyme according to the protocol recommended by the manufacturer. The PCR was performed at 98 °C for 30 s, 62 °C for 2 min, and 72 °C for 2 min for a total of 35 cycles in a thermal cycler (VeritiTM, Applied Biosystems, Waltham, MA, USA). PCR products were run on a 2% agarose gel and the clearly separated bands were excised from the gel. The PCR Clean-up Gel Extraction Kit (Catalog # 740609.50, Macherey-Nagel, Germany) was used for the purification.
In addition, to confirm the 21-nucleotide deleted region in the MAVS500 cDNA, a PCR reaction was set up using the GFP WT rat MAVS and GFP MAVS500 expression vectors to generate a short amplicon containing DNA sequences close to the deleted region. The reaction was performed using 5′-ggggggacaagtttgtacaaaaaagcaggcttcACATTTGCTGAGGAAAAGACCTATAAGTATATCCG-3′ forward and 5′-GCAATACGTGGAAGGGGCTGGAAG-3′ reverse primer pairs and Firepol Taq Polymerase (Catalog # 01-0-00500, Solis Biodyne, Tartu, Estonia) according to the protocol recommended by the manufacturer. The PCR was performed at 98 °C for 30 min, 62 °C for 2 min, and 72 °C for 2 min for a total of 35 cycles in the thermal cycler (VeritiTM, Applied Biosystems, Waltham, MA, USA). PCR products were run on a 2% agarose gel. The marking of the bands in the agarose gel was performed using lane and bands analysis on the Image Lab 6.1 version. The analysis of the bands in the agarose gel was performed by lane profile analysis using Image Lab version 6.1. The Rf values were calculated to show the band migration distance, which is calculated by dividing the band migration distance by the buffer front migration distance. The distances are each measured from the beginning of the uppermost point of the gel. The molecule with a higher Rf value travels further in the electrophoretic environment.
2.4. Gateway Cloning and Sequencing of the Vectors
Construction of the expression vector carrying a GFP or Flag tag at the N-terminal end was performed in two steps by a gateway cloning system based on homologous recombination. Firstly, purified PCR products carrying 3′ and 5′ attB ends were cloned into the pDONR201 donor vector using the Gateway
® BP Clonase
® II Enzyme Kit (Catalog # 11789-013, Thermo-Fisher Scientific, Waltham, MA, USA), according to the manufacturer’s protocol, to create the entry vector by BP reaction [
17,
18].
After the BP reaction, BP reaction products were transformed into
E. coli DH5α strain [
19]. After transformation, bacteria carrying entry vectors were cultured on LB agar medium containing 50 μg/mL kanamycin antibiotic and incubated at 37 °C for 16 h. At the end of the period, antibiotic-resistant colonies were selected and transferred to LB liquid medium and incubated at 37 °C, 220 rpm for 12–16 h. Bacterial cultures with an optical density (OD)
600 of 2–3 were selected to isolate plasmids using E.Z.N.A.
® Plasmid DNA Mini Kit I (Catalog# D6943-01, Omega Bio-Tek, Norcross, GA, USA), according to the manufacturer’s protocol, and the plasmids were sequenced.
In the second step of the gateway cloning system, entry vectors were cloned into the destination plasmids by LR reaction using Gateway
® LR Clonase
® II Enzyme mix (Catalog# 11791-100, Thermo-Fisher Scientific, Waltham, MA, USA) according to the manufacturer’s protocol [
18]. After the LR reaction, the products were transformed into
E. coli DH5α strain [
19]. After transformation, bacteria-carrying expression vectors were cultured on LB agar medium containing 100 μg/mL ampicillin antibiotic and incubated at 37 °C for 16 h. The grown colonies selected and transferred into LB liquid medium were allowed to grow for 12–16 h at 37 °C, 220 rpm. E.Z.N.A.
® Endo-free Plasmid DNA Mini Kit I (Catalog# D6948-02, Omega Bio-Tek, Norcross, GA, USA) was used to isolate plasmids from bacterial cultures with an OD
600 of 2–3 and the plasmids were sequenced. The sequencing reaction was performed using the BigDye
® Terminator v3.1 Cycle Sequencing Kit (Catalog# 4337455, Thermo-Fisher Scientific, Waltham, MA, USA) with the addition of 400–800 ng of template plasmid DNAs and specific primers specific to the gene of interest to each sequencing reaction according to the manufacturer’s protocol. Sequencing reactions were performed in an Applied Biosystems 9700 Thermocycler and the sequencing reaction products of the entry and expression vectors were purified with Sephadex
®G-50 (Catalog# S5897-25G, Sigma-Aldrich, Darmstadt, Germany) according to the manufacturer’s protocol. The purified reaction products were loaded into the genetic analyzer and sequencing was performed. The sequencing results were analyzed using Chromas 2.6.6 software and compared with reference genes.
2.5. Analysis of DNA and Amino Acid Sequences
Nucleotide and amino acid sequence alignments were performed using the Expasy (SIB Swiss Institute of Bioinformatics) and Clustal Omega Multiple Sequence Alignment (European Molecular Biology Laboratory, European Bioinformatics Institute). The reference nucleotide sequences of the MAVS of various species deposited in the GenBank NCBI Data Bank under the accession numbers NP_001005556 (Rattus norvegicus), NP_065797 (Homo sapiens), and NP_001193314 (Mus musculus) were aligned to compare the sequences.
2.6. Structural Similarity Analysis
Additionally, 3D downloaded and predicted protein structures of WT rat MAVS and MAVS500 were visualized and colored by the Python-based molecular visualization software PyMOL program, version 3.0.3. PDB files of the protein sequences were downloaded from UniProt.org. The ‘super’ command was used to compare predicted protein structures to obtain a structural similarity score which is the root mean square deviation (RMSD). This analysis was conducted to determine the extent to which the downloaded protein structure deviated from the predicted protein structure. For instance, a RMSD score of ‘0’ would indicate that the downloaded protein and the predicted protein had 100% structural similarity, with no deviation or structural difference [
20].
2.7. Cell Culture, DNA Transfection
The NBT-II cell line (Urinary Bladder Tumor Rat, Catalog # CRL-1655) was purchased from the American Type Culture Collection (ATCC) (Manassas, VA, USA). The HEK293T cell line (Catalog # HCL4517, DharmaconTM) was purchased from Horizon Discovery (Lafayette, CO, USA). NBT-II and HEK293T cells were grown in Modified Eagle Medium (MEM) (Gibco, Thermo-Fisher Scientific, Waltham, MA, USA) and Dulbecco’s MEM (DMEM) (Gibco, Thermo-Fisher Scientific, Waltham, MA, USA), respectively. The growth medium was supplemented with 1% penicillin-streptomycin (100 μg/mL) (Thermo-Fisher Scientific, Waltham, MA, USA) and 10% heat-inactivated, non-USA-origin, sterile filtered fetal bovine serum (F9665, Sigma-Aldrich, Darmstadt, Germany).
Additionally, 3 × 10
5 cells were cultured in 2 mL of DMEM (4.5 g/L Glucose) containing 10% FBS for 24 h in 6-well plates at 37 °C in a humidified atmosphere containing 5% CO
2. The HEK293T cells reaching approximately 70% confluence were transfected with either GFP-labeled wild-type (WT) rat MAVS (2 μg) or MAVS500 (2 μg) mammalian expression plasmids generated using the gateway cloning strategy using the calcium phosphate method [
21]. The protein was determined 24 h after transfection by Western Blotting and fluorescence microscopy. Additionally, 3 × 10
5 NBT-II cells were cultured in 2 mL of MEM containing 10% FBS for 24 h in 6-well plates at 37 °C in a humidified atmosphere containing 5% CO
2. NBT-II cells were transfected with plasmids either containing WT rat MAVS or MAVS500 in 6-well plates. The NBT-II cells reaching approximately 70% confluence were transfected with either GFP-labeled WT rat MAVS (2.5 μg) or MAVS500 (2.5 μg) plasmids using Lipofectamine 3000 (Catalog # L3000008, Thermo-Fisher Scientific, Waltham, MA, USA) according to the manufacturer’s protocol for fluorescence microscopy experiments. The NBT-II cells reaching approximately 70% confluence were transfected with either Flag-tagged WT rat MAVS (2.5 μg) or Flag-tagged MAVS500 (2.5 μg) plasmids using Lipofectamine 3000 (Catalog # L3000008, Thermo-Fisher Scientific, Waltham, MA, USA) according to the manufacturer’s protocol for fluorescence microscopy experiments. The protein was determined 48 h after transfection by Western Blotting and fluorescence microscopy.
2.8. Western Blotting
Transfected cells were lysed in TRIS-NaCl-Tween 20 Buffer (0.01M Tris.HCl (pH 8.0), 0.15M NaCl, 0.05% Tween®-20) containing protease and phosphatase inhibitors. Additionally, 25 μg protein samples were denatured with Laemmli Buffer containing 2% (v/v) β-mercaptoethanol for 5 min at 99 °C, resolved by SDS-PAGE on 10% (v/v) Tris-glycine polyacrylamide gels. The proteins were transferred onto a PVDF membrane (Catalog # 1212639, GVS North America, Sanford, ME, USA) and the membrane was incubated with 5% non-fat milk in TBST for blocking at room temperature for 1h. The following antibodies were used to target proteins at the indicated concentrations: rabbit monoclonal anti-GFP (1:10,000, Catalog # A-11122, Thermo-Fisher Scientific, Waltham, MA, USA), mouse monoclonal anti-Flag M2 antibody (1:1000, Catalog # F3165, Sigma-Aldrich, Darmstadt, Germany), rabbit polyclonal MAVS antibody (1:500, Catalog # Ab189109, Abcam, Waltham, MA, USA), rabbit monoclonal NFκβ antibody (1:1000, Catalog # 8242S, Cell Signaling, St. Louis, MO, USA), rabbit monoclonal pNFκβ antibody (1:1000, Catalog # MA5-15160, Invitrogen, Waltham, MA, USA), mouse monoclonal GAPDH antibody (1:10,000, Catalog # AC033, Abclonal, Woburn, MA, USA. The membrane was washed three times with TBST for 5–7 min each. Then, the membrane was incubated with HRP-conjugated goat anti-rabbit (1:42,000, Cat# Ab205718, Abcam, Waltham, MA, USA) or HRP-conjugated horse anti-mouse (1:2000, Catalog # 7076S, Cell Signaling, St. Louis, MO, USA). The bands were visualized on a ChemiDoc imager (Bio-Rad Laboratories, Hercules, CA, USA) using Clarity™ Western ECL Substrate (Catalog # 1705060, Bio-Rad Laboratories, Hercules, CA, USA). Densitometric analysis was performed using the ‘Volume Tools’ feature in Image Lab software, version 6.1 (Bio-Rad Laboratories, Hercules, CA, USA).
2.9. Fluorescence Imaging
Sterilized 15 × 15 mm coverslips were placed in 6-well plates (ISOLAB, Wertheim, Germany). Then, 3 × 10⁵ HEK293T and NBT-II cells were seeded into each well in DMEM and MEM supplemented with 10% (v/v) FBS, respectively. After 24 h, the cells were transfected with expression vectors. The pcDNA-DEST53 GFP destination vector was used as a control.
Approximately 24 h after transfection, HEK293T cells were fixed with 4% (w/v) paraformaldehyde (PFA) (Catalog # P6148, Sigma-Aldrich, Darmstadt, Germany) for 2 min and washed three times with PBS. The expression of recombinant GFP-labeled proteins in the cells was visualized by Zeiss Axio Imager.
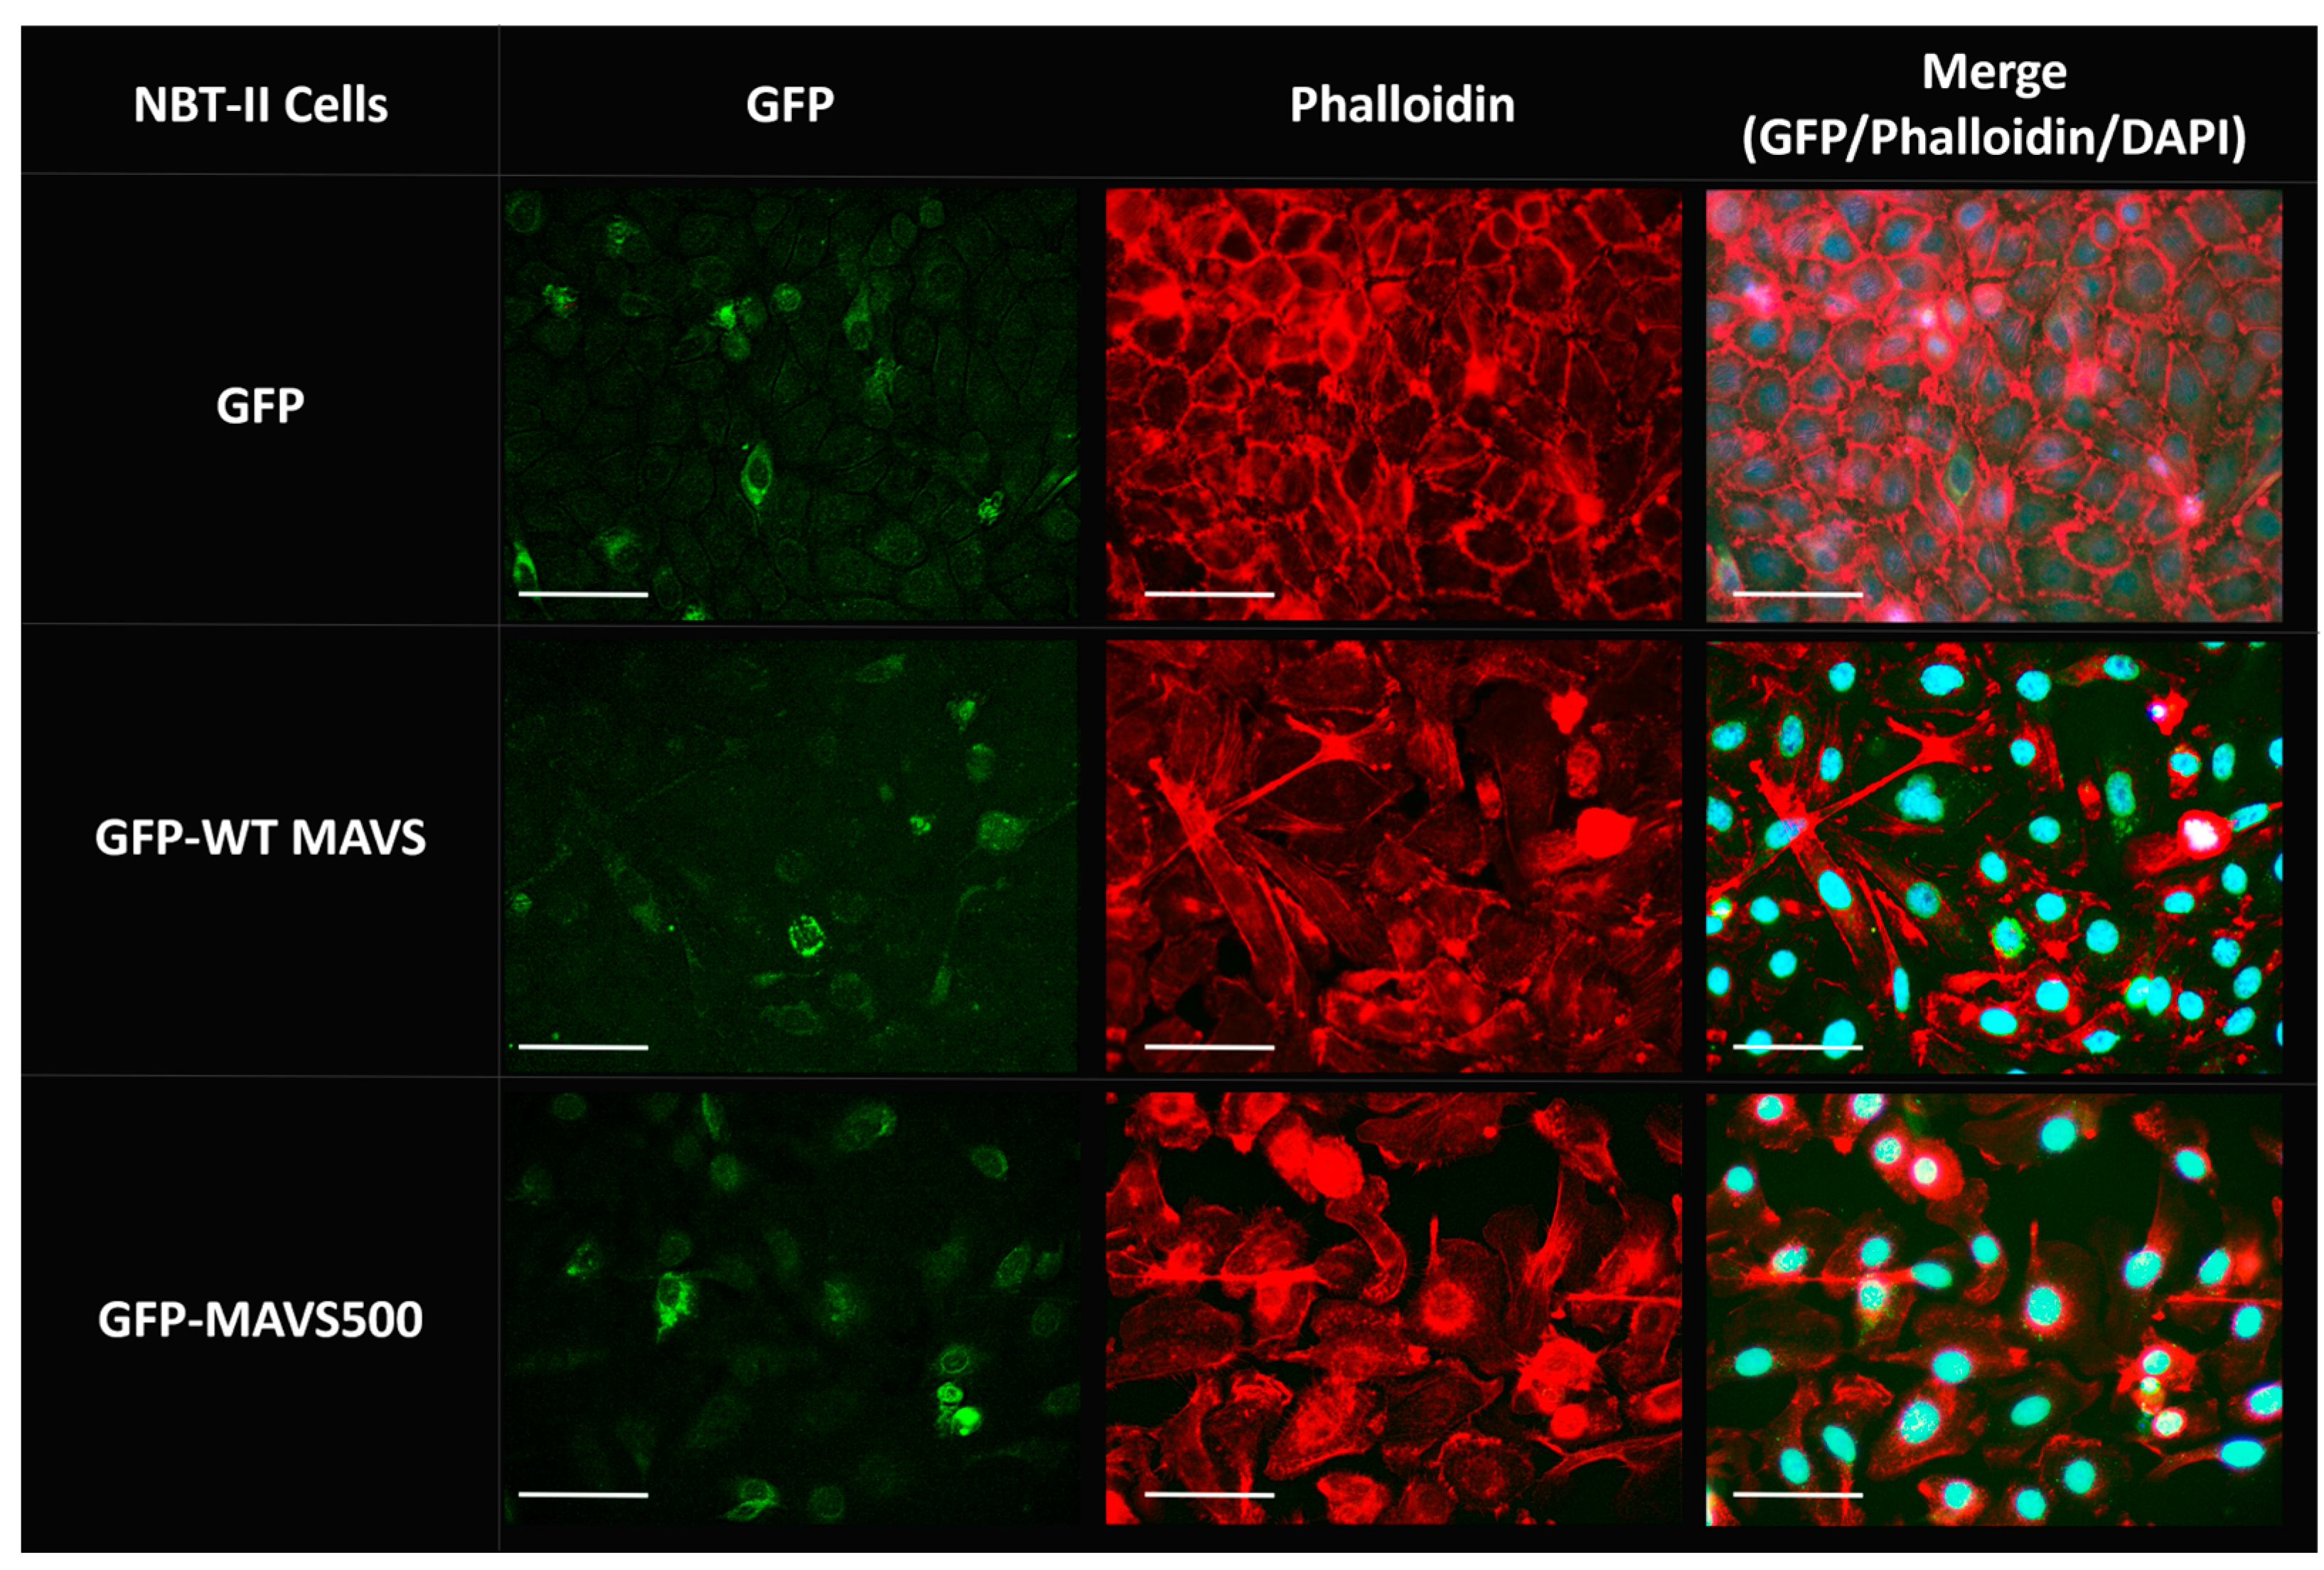
In addition, 24 h after transfection, phalloidin staining for F-actin was performed to better visualize the cell compartments in NBT-II cells. The cells were first fixed with 4% PFA in phosphate-buffered saline (PBS) for 10 min at room temperature, followed by three washes with PBS to remove any residual PFA. To permeabilize the cell membranes, the cells were incubated with 0.2% Triton X-100 in PBS for 7 min and washed three times with PBS. Phalloidin-iFluor 647 Reagent (Catalog # AB176759, Abcam, Waltham, MA, USA) was diluted 1:1000 in PBS and applied to the cells for 90 min at room temperature, with the plate covered to protect from light. After staining, the cells were washed three times with PBS. Finally, the cells were co-stained with DAPI mounting medium (Catalog # P36935, Prolong GOLD antifade mounting media DAPI, Thermo-Fisher Scientific, Waltham, MA, USA) and imaged using a Zeiss Axio microscope equipped with appropriate filters. Intensity measurements of the GFP-WT MAVS and GFP-MAVS500 groups were performed using ImageJ software (Image J 1.54g). Cells in the experimental groups were manually selected using the region of interest (ROI) tool, with at least 15 cells analyzed per group. Images were converted to grayscale (8-bit) and background correction was applied based on the average gray value of areas outside the cells. Mean intensity was measured as the average signal intensity per unit area in a ROI. This is typically reported directly as the ‘Mean Gray Value’. Pixels in the ROI were reported as ‘area’. Integrated density was calculated by multiplying ‘mean intensity’ and ‘area’.
2.10. Statistical Analysis
Each experiment was repeated three times to ensure reproducibility. Statistical analyses were conducted using a two-tailed
t-test to evaluate differences between groups. The statistical tests were calculated using the online tool available at GraphPad QuickCalcs (
https://www.graphpad.com/quickcalcs/ttest2/, accessed on 15 November 2024), ensuring accurate quantification and rigorous assessment of statistical significance.
4. Discussion
The human
MAVS gene generates a single mRNA and produces multiple proteins that together regulate cellular activity [
11]. The human MAVS transcript generates two isoforms: FL-MAVS from open reading frame-1 and an N-terminal 141-amino-acid truncated isoform, which is also known as the 50 kDa variant (MiniMAVS), from open reading frame-2. MiniMAVS exhibits dominant negative effects on the aggregation and activity of MAVS [
11,
15]. The involvement of FL-MAVS and MiniMAVS in antiviral and cell death responses in the cells implies that this gene is potentially crucial for preserving tissue homeostasis prior to, during, and following infections. The identification and functional analysis of MAVS splicing variants in different species provide valuable insights into the diversity and regulation of antiviral signaling pathways. In their study, Zou et al. characterized two MAVS transcripts in a large yellow croaker (Larimichthys crocea): Lc-MAVS_tv1 (the canonical form) and Lc-MAVS_tv2 (a splicing variant lacking the C-terminal TM domain). The findings demonstrated that overexpression of both Lc-MAVS_tv1 and Lc-MAVS_tv2 could induce the activation of NF-κB [
22]. In the study by Qi et al., several N-terminally truncated isoforms of MAVS lacking the CARD were identified. These truncated isoforms were shown to associate with full-length MAVS through homotypic interactions mediated by their TM domains. This interaction plays a crucial role in preventing the spontaneous aggregation of full-length MAVS. In the absence of these N-terminally truncated isoforms, full-length MAVS forms spontaneous aggregates, which are cleared through Nix-mediated mitophagy. This study reveals a mechanism that prevents the spontaneous aggregation of MAVS in cells, thereby avoiding the misactivation of innate immune responses and the associated detrimental inflammation [
16].
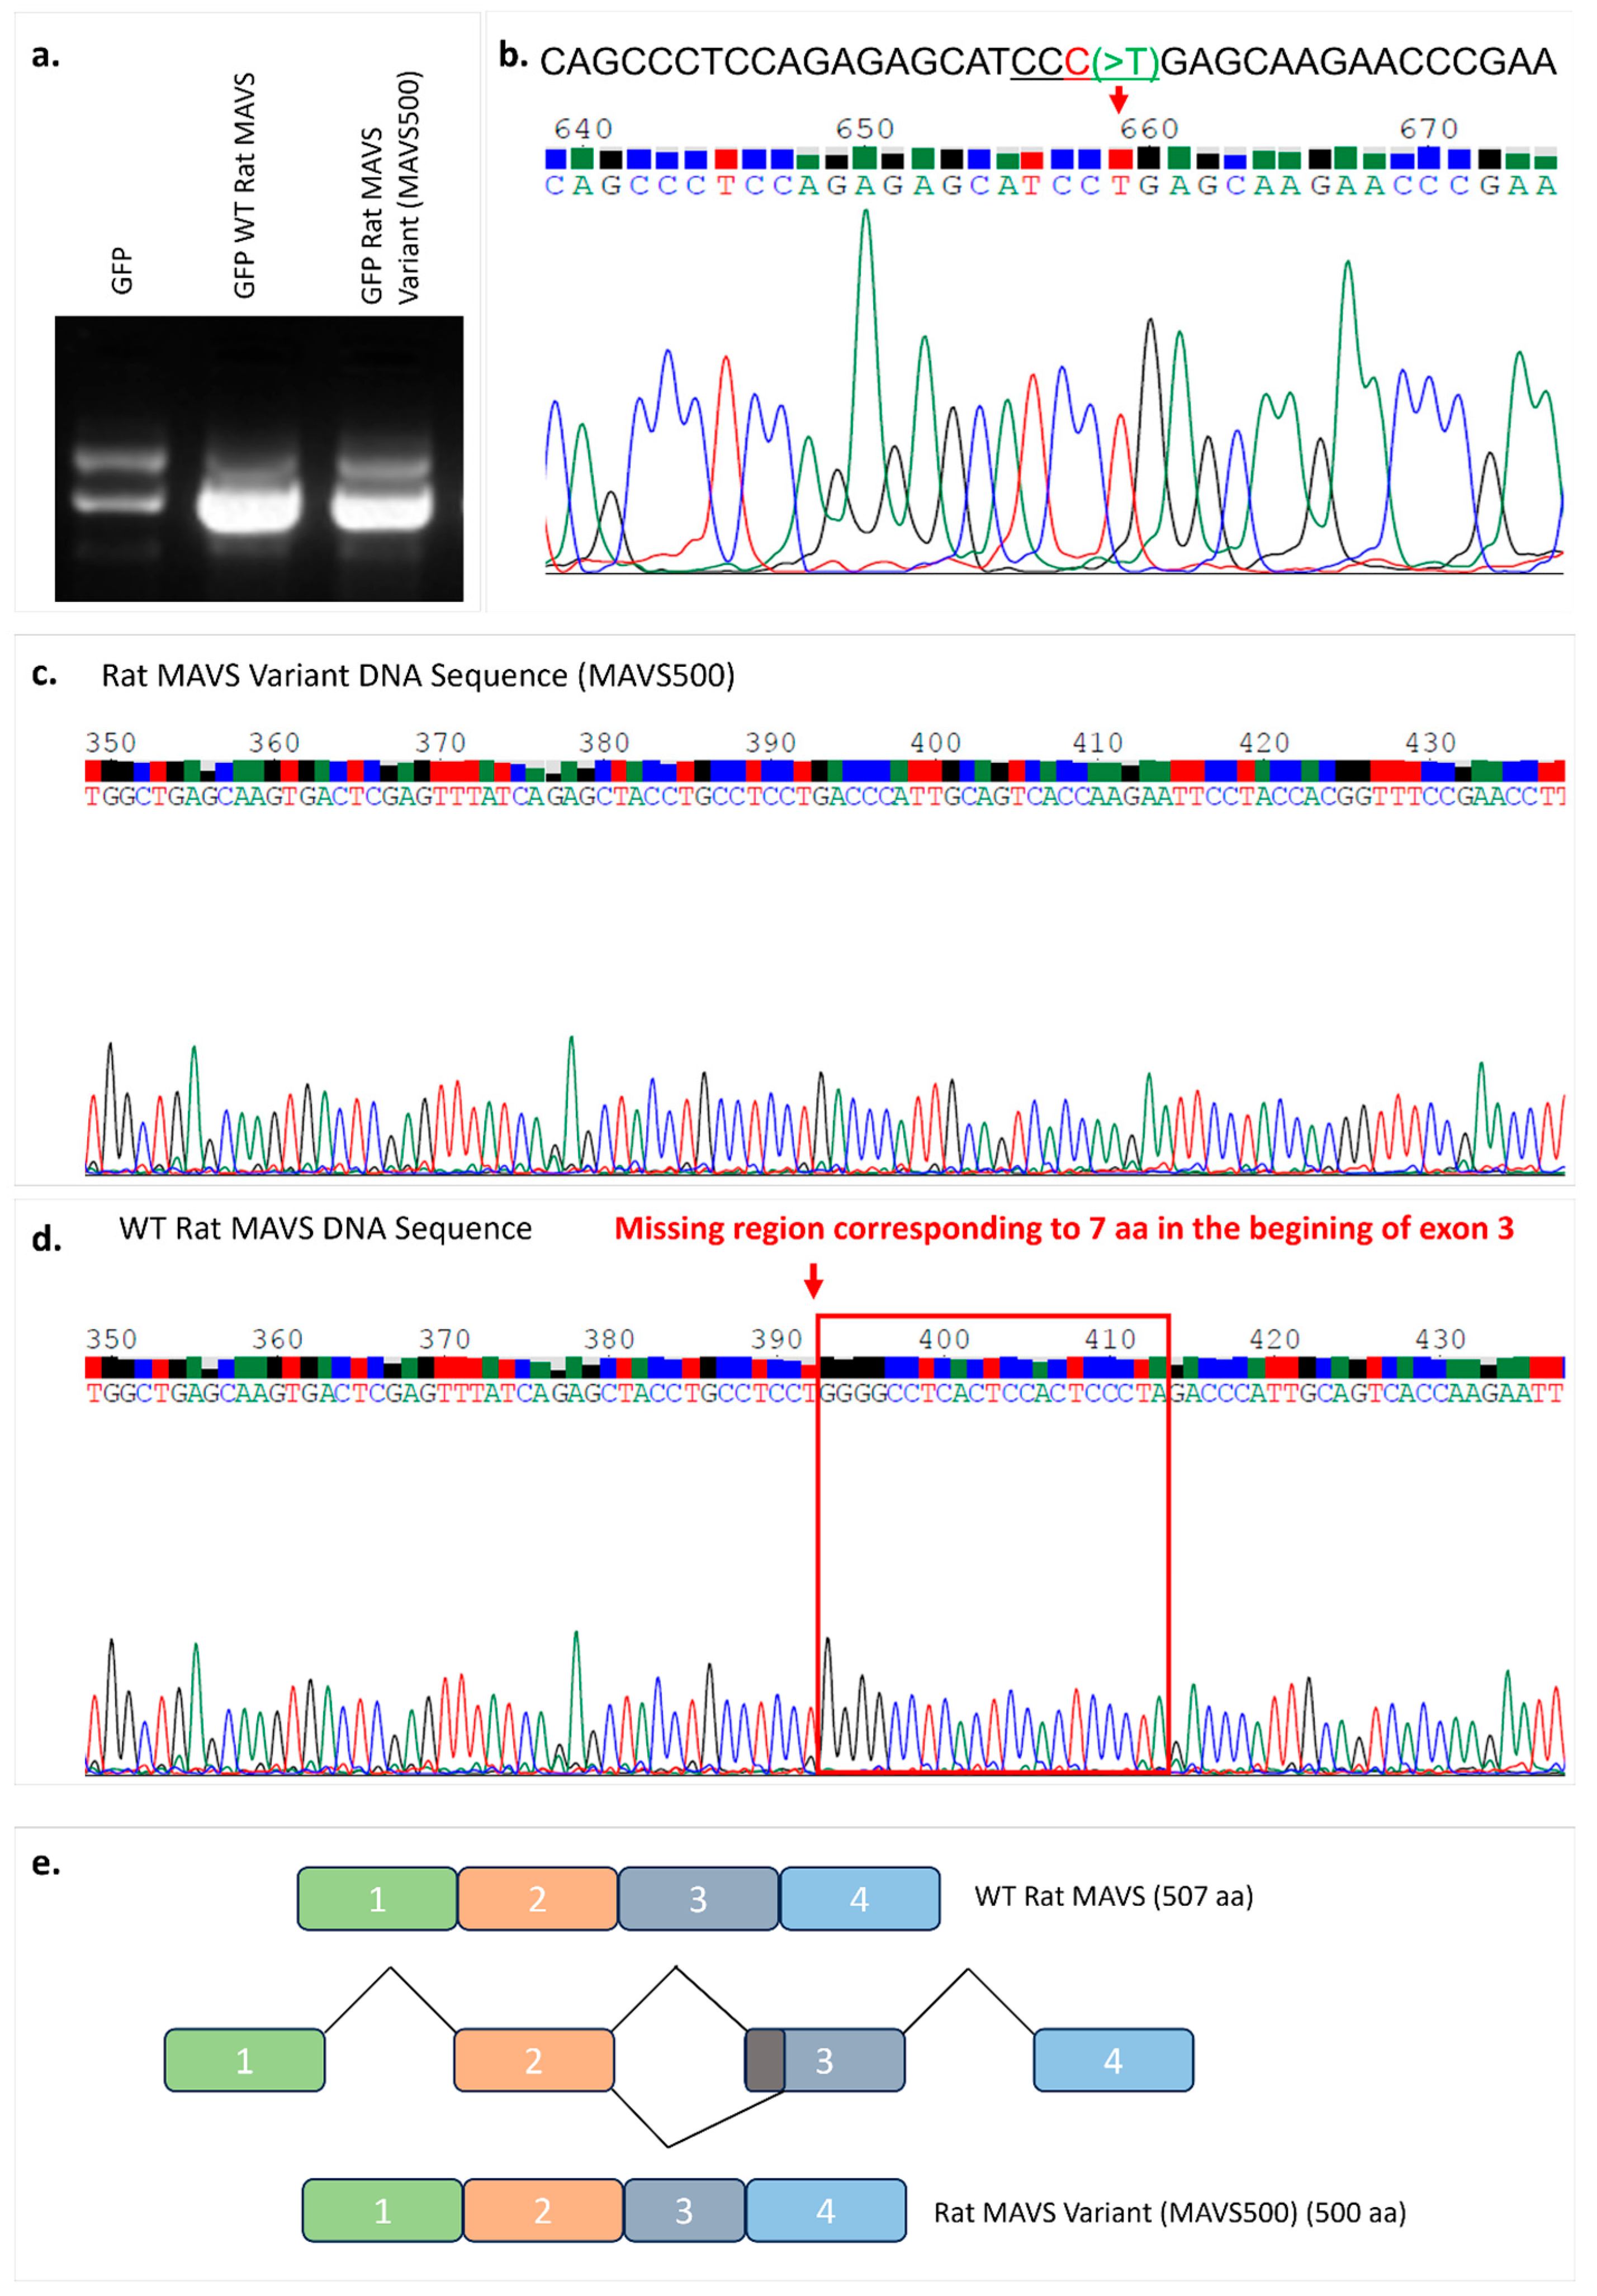
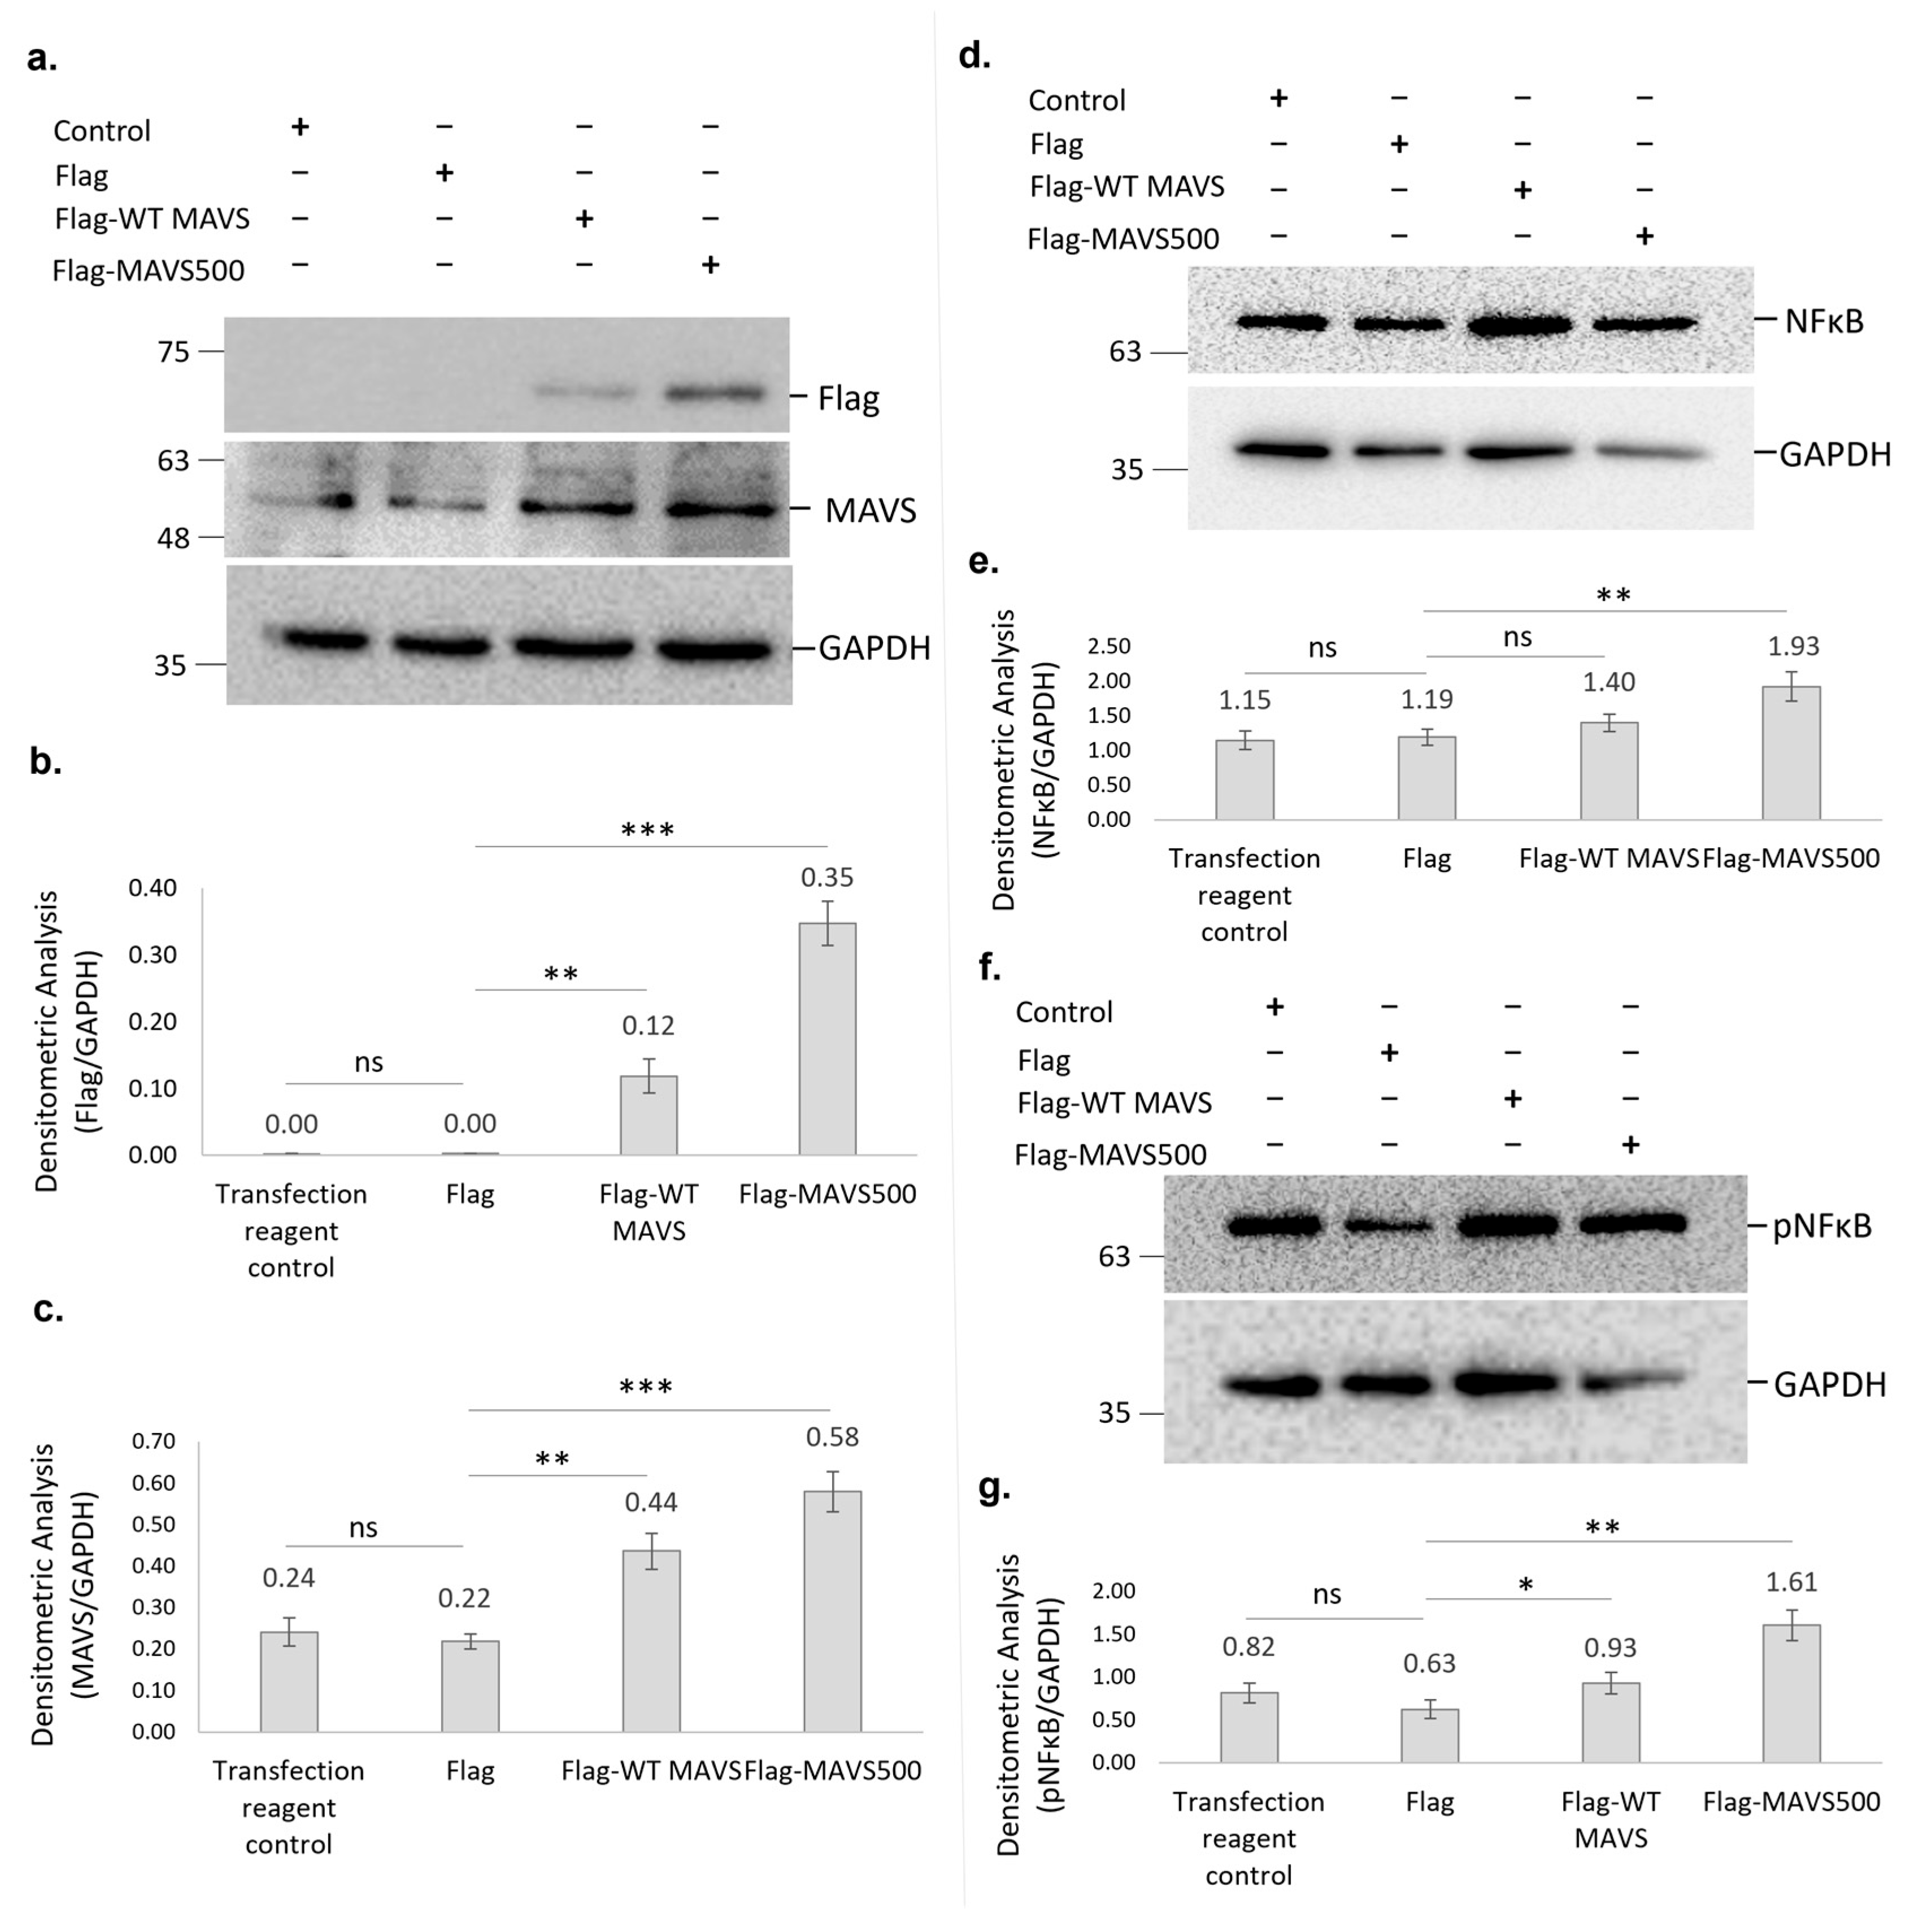
We have discovered a novel variant of WT rat MAVS in the NBT-II rat bladder cancer cell line, designated as ‘MAVS500’. The sequenced coding sequences of WT rat MAVS and MAVS500 differ by 21 nucleotides. This deletion was confirmed by PCR amplification targeting the affected region, where MAVS500 produced a distinct band with a higher Rf value than the WT MAVS product, indicating increased electrophoretic mobility due to its smaller size.
The sequence of the variant is very similar to the MAVS transcript; however, MAVS500, an alternatively spliced form, has a twenty-one-nucleotide truncation from the 3′ end of Exon 3, resulting in a protein that is seven amino acids shorter than the WT rat MAVS, with a size of five-hundred amino acids. The rs3320008647 C > T polymorphism, previously identified in the rat genome database, was also found in the MAVS500 sequence. This genetic variation, causing a synonymous substitution that replaces one amino acid (proline), does not alter the amino acid sequence of the protein. The 3D protein structures of WT rat MAVS and MAVS500, the predicted counterparts, were analyzed using the PyMOL to compute the RMSD value as a measure of structural similarity. The RMSD value, 0.012, was very low, indicating the downloaded and predicted protein structures are highly similar, with only minor deviations. The Uniprot.org sequence of the WT rat MAVS reveals that the CARDs are located between Domains 10 and 77. It is also indicated that the transmembrane domain and Residues 288–424 are essential for the interaction of WT rat MAVS with DHX58/LGP2. In the protein sequence, Amino Acids 419–422 contain the pLxLS motif. In addition, Amino Acids 143–147 interact with TRAF2, 153–158 interact with TRAF6, 340–507 interact with DHX33, and 435–440 interact with TRAF6. The truncated region of MAVS500, which has a seven-amino-acid truncation between Amino Acids 99 and 105 compared to the WT rat MAVS sequence, is not included in a domain, motif, or region on the Uniprot.org database. The deletion-induced conformational rearrangements in MAVS500 suggest that the structural flexibility and secondary structure dynamics are affected, potentially influencing its functional properties. The reduction in helical turns and the observed shifts in the surrounding regions may alter the capacity of MAVS500 for molecular interactions, such as binding to downstream signaling molecules in the innate immune pathway. The domains and regions of WT rat MAVS have not been fully characterized so it is still possible that the truncated site that gave rise to MAVS500 plays a role in certain cellular processes.
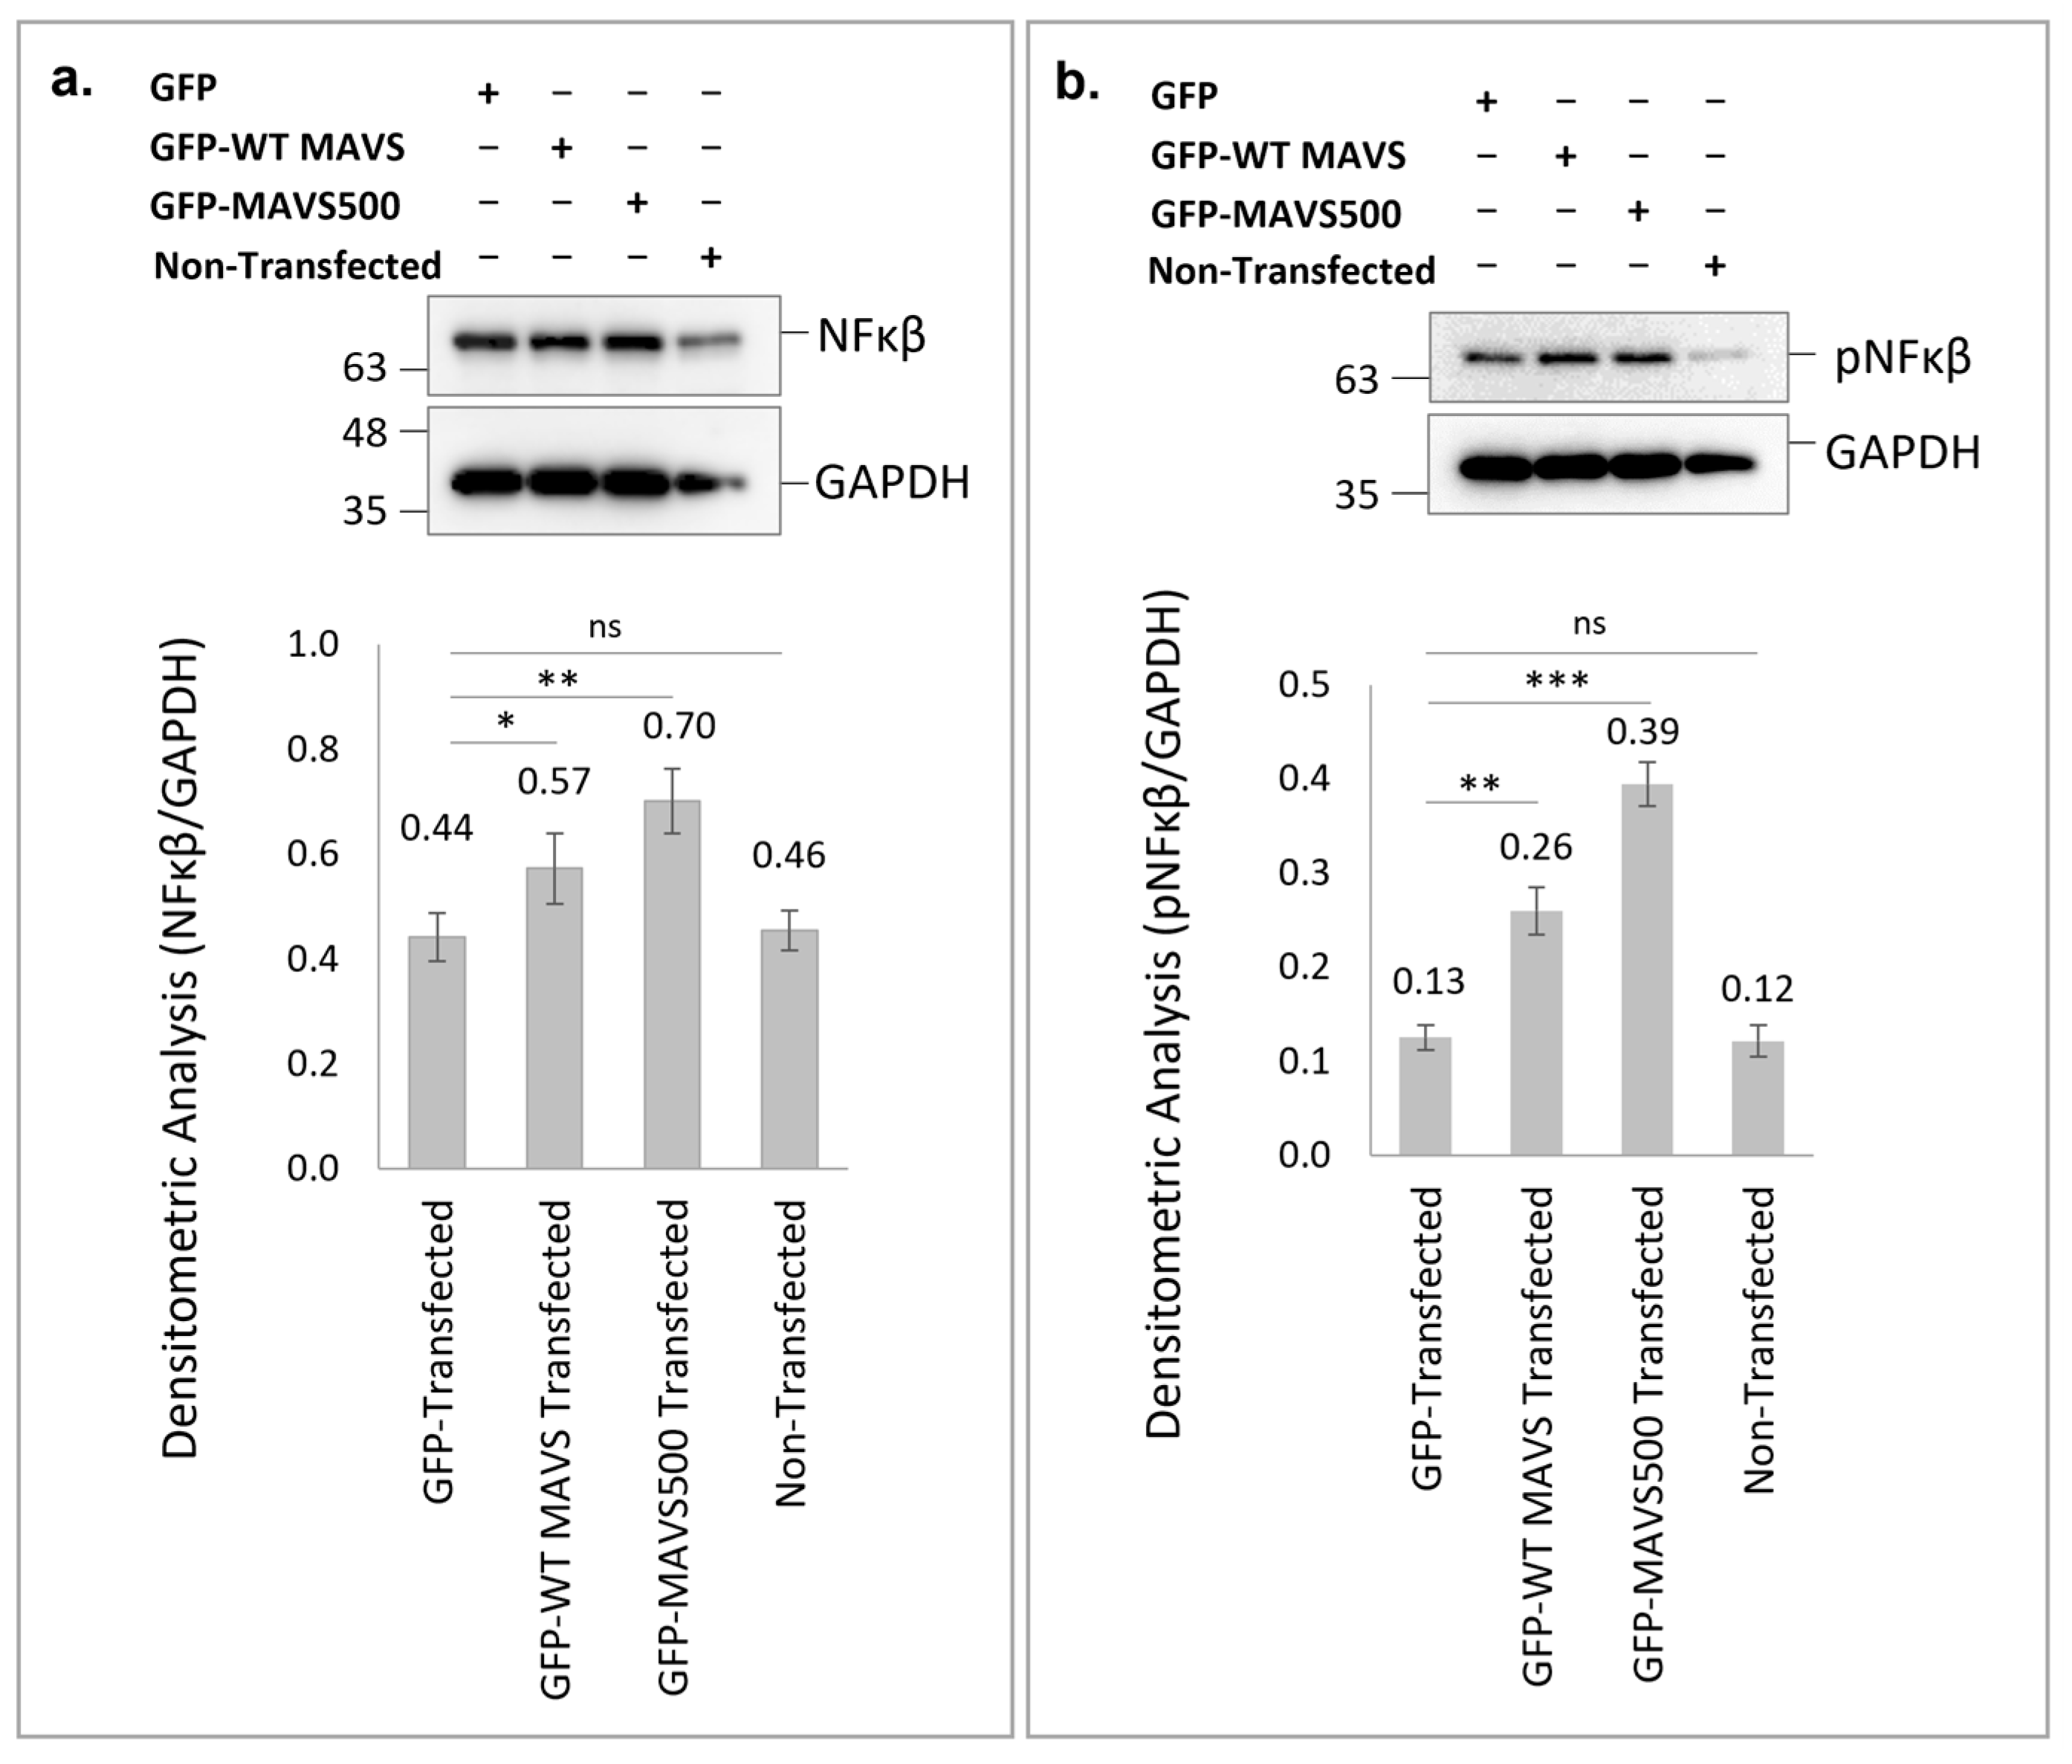
Flag and MAVS expression levels were confirmed, with results indicating that Flag-MAVS500 was expressed at significantly higher levels than Flag-WT rat MAVS in NBT-II cells. The cell employs many diverse mechanisms to regulate MAVS, including protein–protein interactions for the physical blockage of the MAVS association with upstream or downstream signaling partners and alterations of mitochondrial physical dynamics, as well as the physical distribution/aggregation of MAVS [
23]. Significant progress has been achieved in understanding the host cell regulation of MAVS-mediated signaling, yet much remains to be learned about its intricate mechanisms. Ongoing research aims to uncover MAVS regulators and enhance our understanding of MAVS regulome, contributing to advancements in innate immunity studies and highlighting the continued importance of further investigation in this field [
23,
24].
MAVS500, a novel truncated variant of MAVS identified in NBT-II cells, significantly enhances NFκB and pNFκB signaling compared to WT MAVS, with a more pronounced effect observed in MAVS500-expressing cells. These findings suggest that MAVS500 may engage complex, cell-specific mechanisms to more effectively activate antiviral pathways, potentially influencing immune responses and contributing to cancer progression. Further investigation into the role of MAVS500 could reveal its therapeutic potential in modulating innate immunity and enhancing immune-based cancer treatments. The differential impact on NFκB signaling underscores the importance of MAVS variants in modulating immune responses. These results suggest that both forms of MAVS enhance NFκB signaling, with overexpressed MAVS500 having a more substantial impact, potentially indicating a stronger activation of the antiviral response pathway. Understanding these dynamics is essential for elucidating how MAVS influences immune signaling and potentially identifying therapeutic targets. While this study provides significant insights into the functional role of MAVS500, certain aspects remain to be explored. The endogenous expression of MAVS500 was not verified in additional tissues or cell lines beyond those used in this study. To address this limitation, future studies will investigate the expression of MAVS500 in a broader range of cell lines and tissues, including cancer-derived and non-cancerous systems, to better understand its physiological relevance and potential tissue-specific roles. This will help elucidate whether MAVS500 expression is a universal feature or restricted to specific biological contexts.
In addition to its effect on NFκB signaling, MAVS500 is likely to influence other essential downstream pathways, including IRF3 and IRF7, which are critical for the activation of Type I interferon responses. Future work will aim to investigate the effects of MAVS500 on these pathways to provide a more comprehensive understanding of its role in innate immune signaling. Moreover, proteomic and transcriptomic approaches could be employed to identify novel interacting partners and regulatory mechanisms associated with MAVS500, shedding light on its broader influence within cellular signaling networks.


