


Tumor-Infiltrating Immune Cells and HLA Expression as Potential Biomarkers Predicting Response to PD-1 Inhibitor Therapy in Stage IV Melanoma Patients


 , ,
, ,  and
and
Abstract
1. Introduction
2. Materials and Methods
2.1. Patients and Tumor Samples
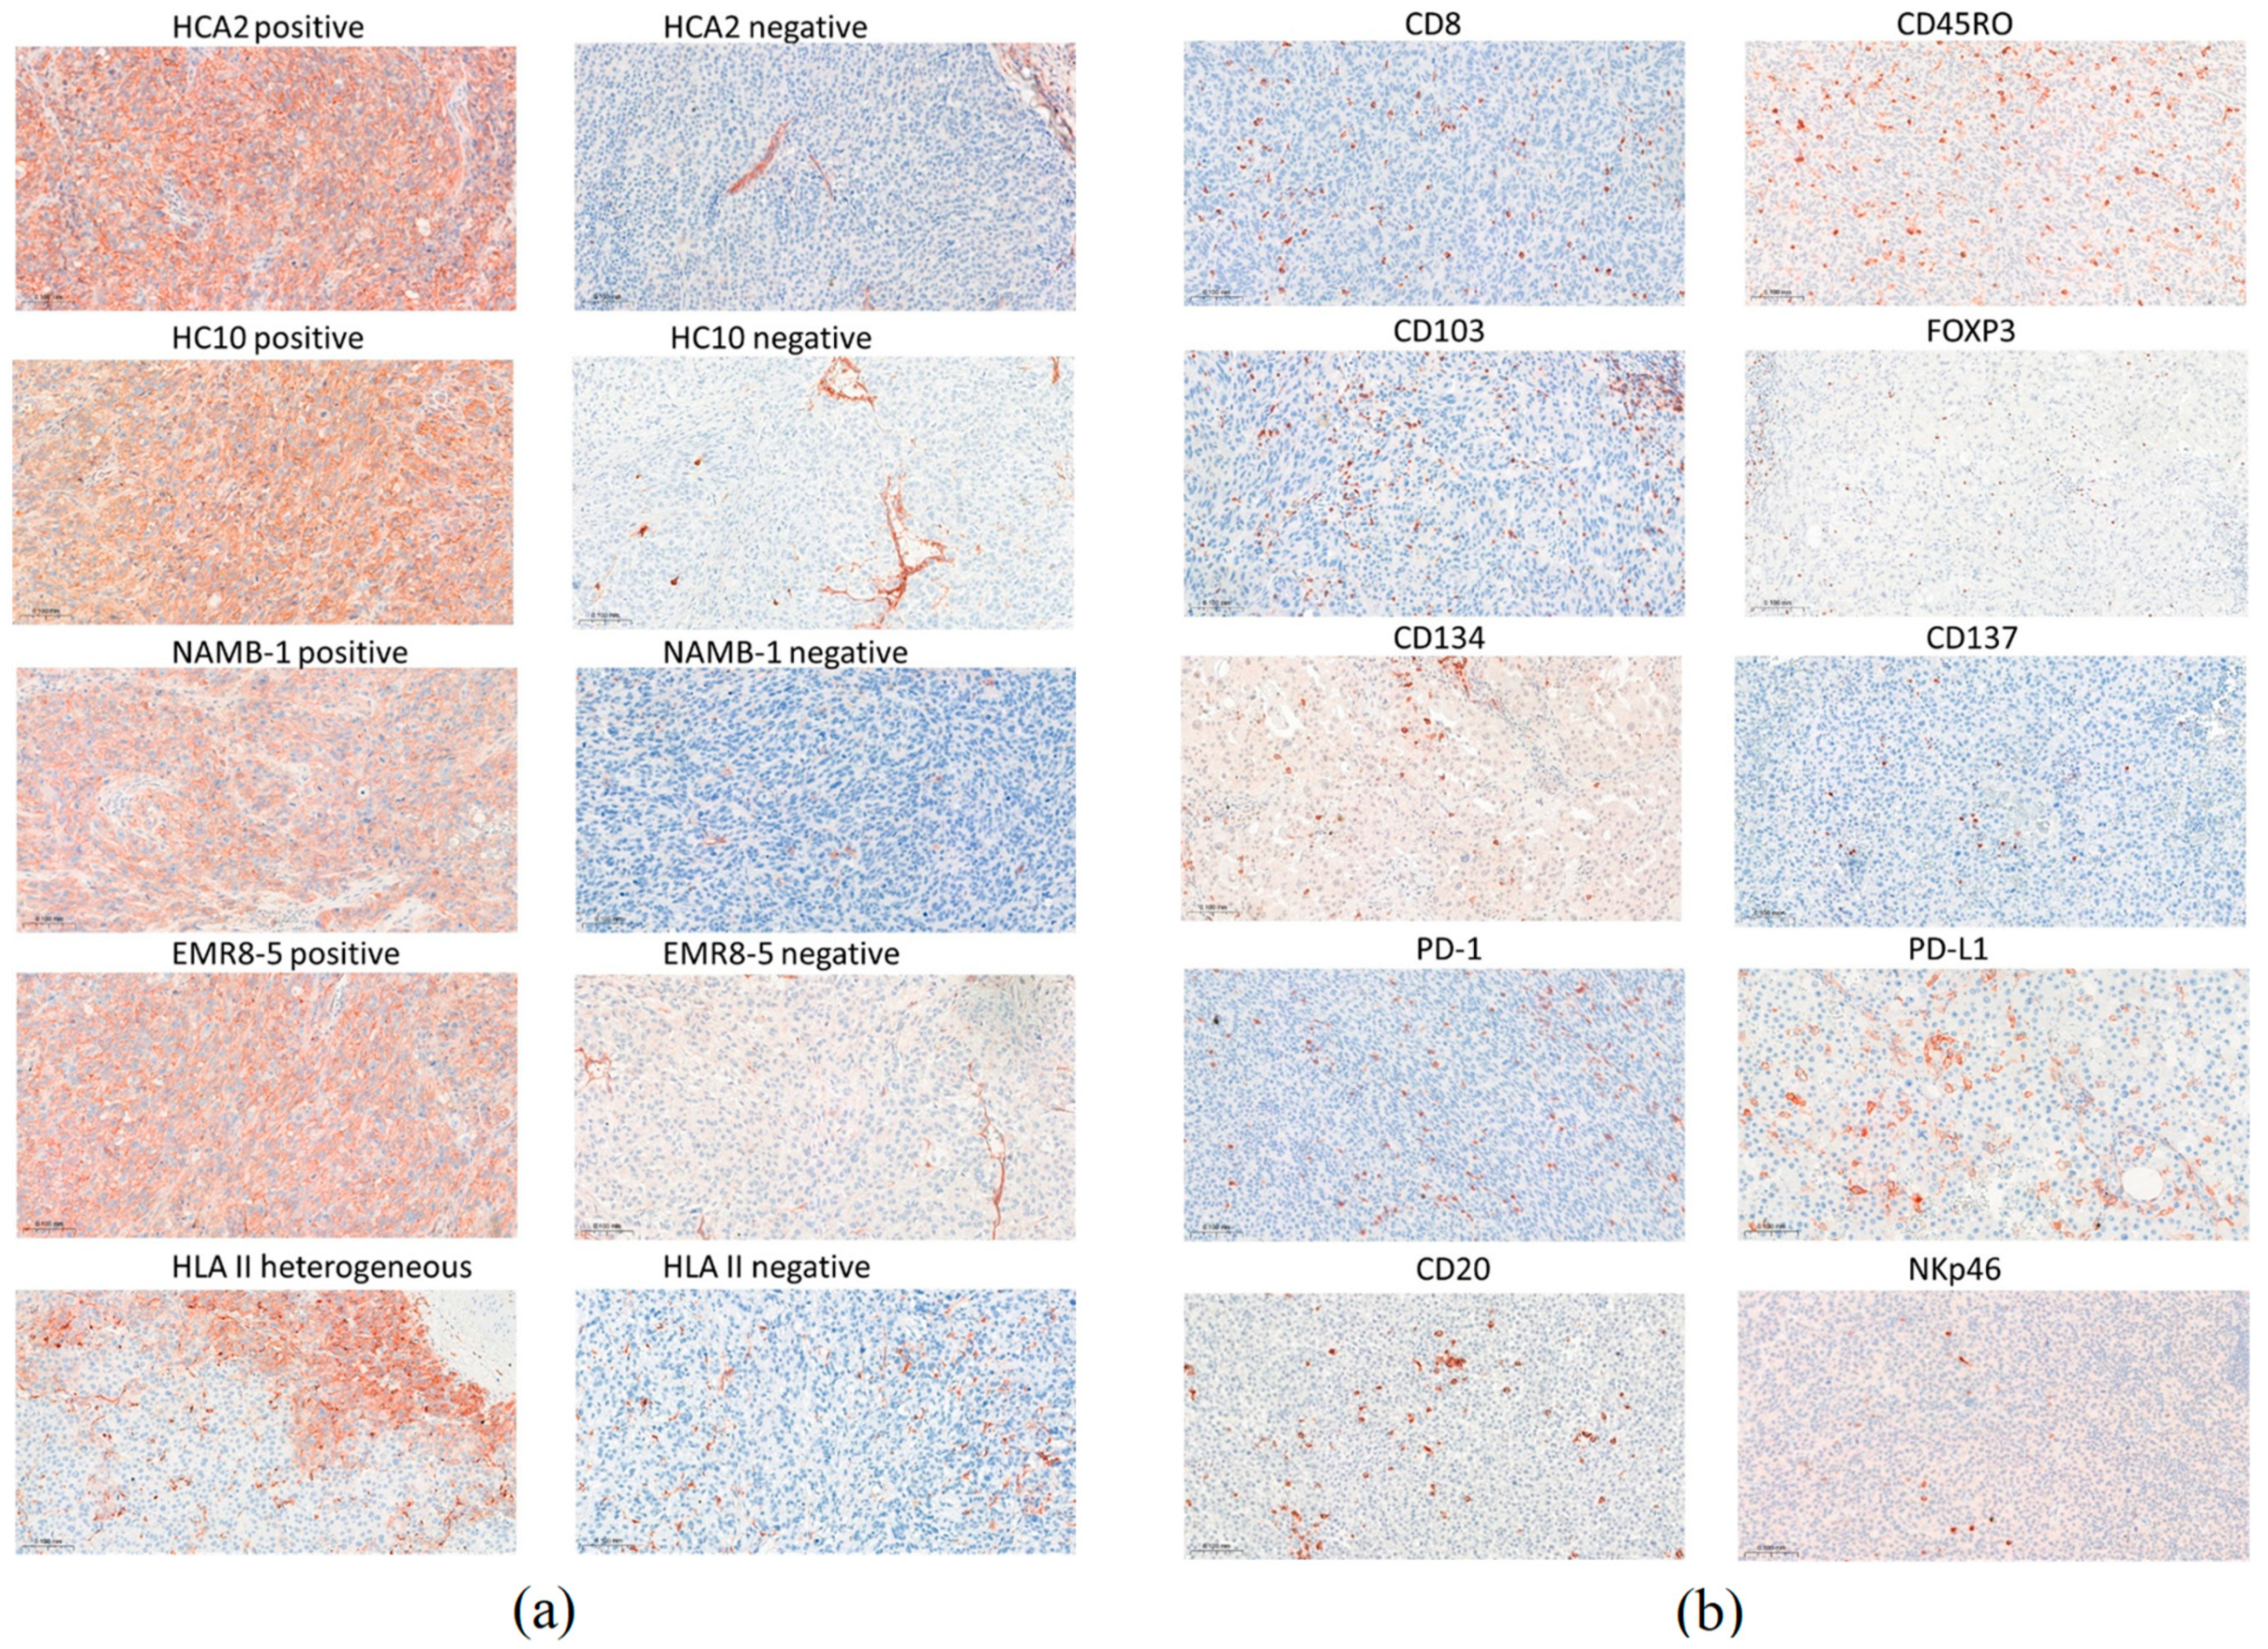
2.2. Immunohistochemical Staining
2.3. Evaluation of the Immune Reactions
2.4. Statistical Analysis
3. Results
4. Discussion
5. Conclusions
Supplementary Materials
Author Contributions
Funding
Institutional Review Board Statement
Informed Consent Statement
Data Availability Statement
Acknowledgments
Conflicts of Interest
Correction Statement
Note on Previous Publication
References
- Topalian, S.L.; Taube, J.M.; Anders, R.A.; Pardoll, D.M. Mechanism-driven biomarkers to guide immune checkpoint blockade in cancer therapy. Nat. Rev. Cancer 2016, 16, 275–287. [Google Scholar] [CrossRef]
- Sharma, P.; Hu-Lieskovan, S.; Wargo, J.A.; Ribas, A. Primary, adaptive, and acquired resistance to cancer immunotherapy. Cell 2017, 168, 707–723. [Google Scholar] [CrossRef]
- Monette, A.; Warren, S.; Barrett, J.C.; Garnett-Benson, C.; Shalper, K.A.; Taube, J.M.; Topp, B.; Snyder, A. Biomarker development for PD-(L)1 axis inhibition: A consensus view from the SITC Biomarkers Committee. J. Immunother. Cancer 2024, 12, e009427. [Google Scholar] [CrossRef]
- Tumeh, P.C.; Harview, C.L.; Yearley, J.H.; Shintaku, I.P.; Taylor, E.J.M.; Robert, L.; Chmielowski, B.; Spasic, M.; Henry, G.; Ciobanu, V.; et al. PD-1 blockade induces responses by inhibiting adaptive immune resistance. Nature 2014, 515, 568–571. [Google Scholar] [CrossRef]
- Taube, J.M.; Klein, A.; Brahmer, J.B.; Xu, H.; Pan, X.; Kim, J.H.; Chen, L.; Pardoll, D.M.; Topalian, S.L.; Anders, R.A. Association of PD-1, PD-1 ligands, and other features of the tumor immune microenvironment with response to anti-PD-1 therapy. Clin. Cancer Res. 2014, 20, 5064–5074. [Google Scholar] [CrossRef]
- Ayers, M.; Lunceford, J.; Nebozhyn, M.; Murphy, E.; Loboda, A.; Kaufman, D.R.; Albright, A.; Cheng, J.D.; Kang, S.P.; Shankaran, V.; et al. IFN-γ-related mRNA profile predicts clinical response to PD-1 blockade. J. Clin. Investig. 2017, 127, 2930–2940. [Google Scholar] [CrossRef]
- Sade-Feldman, M.; Jiao, Y.J.; Chen, J.H.; Rooney, M.S.; Barzily-Rokni, M.; Eliane, J.P.; Bjorgaard, S.L.; Hammond, M.R.; Vitzthum, H.; Blackmon, S.M.; et al. Resistance to checkpoint blockade therapy through inactivation of antigen presentation. Nat. Commun. 2017, 8, 1136. [Google Scholar] [CrossRef]
- Topalian, S.L.; Sznol, M.; McDermott, D.F.; Kluger, H.M.; Carvajal, R.D.; Sharfman, W.H.; Brahmer, J.R.; Lawrence, D.P.; Atkins, M.B.; Powderly, J.D.; et al. Survival, durable tumor remission, and long-term safety in patients with advanced melanoma receiving nivolumab. J. Clin. Oncol. 2014, 32, 1020–1030. [Google Scholar] [CrossRef]
- Larkin, J.; Chiarion-Sileni, V.; Gonzalez, R.; Grob, J.J.; Cowey, C.L.; Lao, C.D.; Schadendorf, D.; Dummer, R.; Smylie, M.; Rutkowski, P.; et al. Combined nivolumab and ipilimumab or monotherapy in untreated melanoma. N. Engl. J. Med. 2015, 373, 23–34. [Google Scholar] [CrossRef]
- Ribas, A.; Hamid, O.; Daud, A.; Hodi, F.S.; Wolchok, J.D.; Kefford, R.; Joshua, A.M.; Patnaik, A.; Hwu, W.J.; Weber, J.S.; et al. Association of pembrolizumab with tumor response and survival among patients with advanced melanoma. JAMA 2016, 315, 1600–1609. [Google Scholar] [CrossRef]
- Daud, A.I.; Wolchok, J.D.; Robert, C.; Hwu, W.J.; Weber, J.S.; Ribas, A.; Hodi, F.S.; Joshua, A.M.; Kefford, R.; Hersey, P.; et al. Programmed death ligand 1 expression and response to the anti-programmed death 1 antibody pembrolizumab in melanoma. J. Clin. Oncol. 2016, 34, 4102–4109. [Google Scholar] [CrossRef] [PubMed]
- Morrison, C.; Pabla, S.; Conroy, J.M.; Nesline, M.K.; Glenn, S.T.; Dressman, D.; Papanicolau-Sengos, A.; Burgher, B.; Andreas, J.; Giamo, V.; et al. Predicting response to checkpoint inhibitors in melanoma beyond PD-L1 and mutational burden. J. Immunother. Cancer 2018, 6, 32. [Google Scholar] [PubMed]
- Gide, T.N.; Quek, C.; Menzies, A.M.; Tasker, A.T.; Shang, P.; Holst, J.; Madore, J.; Lim, S.Y.; Velickovic, R.; Wongchenko, M.; et al. Distinct immune cell populations define response to anti-PD-1 monotherapy and anti-PD-1/anti-CTLA-4 combined therapy. Cancer Cell 2019, 35, 238–255. [Google Scholar] [CrossRef]
- Placke, J.M.; Kimmig, M.; Griewank, K.; Herbst, R.; Terheyden, P.; Utikal, J.; Pföhler, C.; Ulrich, J.; Kreuter, A.; Mohr, P.; et al. Correlation of tumor PD-L1 expression in different tissue types and outcome of PD-1-based immunotherapy in metastatic melanoma—Analysis of the DeCOG prospective multicenter cohort study ADOREG/TRIM. eBiomedicine 2023, 96, 104774. [Google Scholar] [CrossRef]
- Chen, P.L.; Roh, W.; Reuben, A.; Cooper, Z.A.; Spencer, C.N.; Prieto, P.A.; Miller, J.P.; Bassett, R.L.; Gopalakrishnan, V.; Wani, K.; et al. Analysis of immune signatures in longitudinal tumor samples yields insight into biomarkers of response and mechanisms of resistance to immune checkpoint blockade. Cancer Discov. 2016, 6, 827–837. [Google Scholar] [CrossRef]
- Uryvaev, A.; Passhak, M.; Hershkovits, D.; Sabo, E.; Bar-Sela, G. The role of tumor-infiltrating lymphocytes (TILs) as a predictive biomarker of response to anti-PD1 therapy in patients with metastatic non-small cell lung cancer or metastatic melanoma. Med. Oncol. 2018, 35, 25. [Google Scholar] [CrossRef]
- Wong, P.F.; Wei, W.; Smithy, J.W.; Acs, B.; Toki, M.I.; Blenman, K.R.M.; Zelterman, D.; Kluger, H.M.; Rimm, D.L. Multiplex quantitative analysis of tumor-infiltrating lymphocytes and immunotherapy outcome in metastatic melanoma. Clin. Cancer Res. 2019, 25, 2442–2449. [Google Scholar] [CrossRef]
- Adegoke, N.A.; Gide, T.N.; Mao, Y.; Quek, C.; Patrick, E.; Carlino, M.S.; Lo, S.N.; Menzies, A.M.; Pires da Silva, I.; Vargara, I.A.; et al. Classification of the tumor immune microenvironment and associations with outcomes in patients with metastatic melanoma treated with immunotherapies. J. Immunother. Cancer 2023, 11, e007144. [Google Scholar] [CrossRef]
- Daud, A.I.; Loo, K.; Pauli, M.L.; Sanchez-Rodriguez, R.; Munoz Sandoval, P.; Taravati, K.; Tsai, K.; Nosrati, A.; Nardo, L.; Alvarado, M.D.; et al. Tumor immune profiling predicts response to anti-PD1 therapy in human melanoma. J. Clin. Investig. 2016, 126, 3447–3452. [Google Scholar] [CrossRef]
- Cai, L.; Michelakos, T.; Yamada, T.; Fan, S.; Wang, X.; Schwab, J.H.; Ferrone, C.R.; Ferrone, S. Defective HLA class I antigen processing machinery in cancer. Cancer Immunol. Immunother. 2018, 67, 999–1009. [Google Scholar] [CrossRef]
- Zaretsky, J.M.; Garcia-Diaz, A.; Shin, D.S.; Escuin-Ordinas, H.; Hugo, W.; Hu-Lieskovan, S.; Torrejon, D.Y.; Abril-Rodriguez, G.; Sandoval, S.; Barthly, L.; et al. Mutations associated with acquired resistance to PD-1 blockade in melanoma. N. Engl. J. Med. 2016, 375, 819–829. [Google Scholar] [CrossRef] [PubMed]
- Maggs, L.; Sadagopan, A.; Moghaddam, A.S.; Ferrone, S. HLA class I antigen processing machinery defects in antitumor immunity and immunotherapy. Trends Cancer 2021, 7, 1089–1101. [Google Scholar] [CrossRef] [PubMed]
- Johnson, D.B.; Estrada, M.V.; Salgado, R.; Sanchez, V.; Doxie, D.B.; Opalenik, S.R.; Vilgelm, A.E.; Feld, E.; Johnson, A.S.; Greenplate, A.R.; et al. Melanoma-specific MHC-II expression represents a tumour-autonomous phenotype and predicts response to anti-PD-1/PD-L1 therapy. Nat. Commun. 2016, 7, 10582. [Google Scholar] [CrossRef] [PubMed]
- Rodig, S.J.; Gusenleitner, D.; Jackson, D.G.; Gjini, E.; Giobbie-Hurder, A.; Jin, C.; Chang, H.; Lovitch, S.B.; Horak, C.; Weber, J.S.; et al. MHC proteins confer differential sensitivity to CTLA-4 and PD-1 blockade in untreated metastatic melanoma. Sci. Transl. Med. 2018, 10, eaar3342. [Google Scholar] [CrossRef] [PubMed]
- Ladányi, A.; Papp, E.; Mohos, A.; Balatoni, T.; Liszkay, G.; Oláh, J.; Varga, A.; Lengyel, Z.; Emri, G.; Ferrone, S. Role of the anatomic site in the association of HLA class I antigen expression level in metastases with clinical response to ipilimumab therapy in patients with melanoma. J. Immunother. Cancer 2020, 8, e000209. [Google Scholar] [CrossRef]
- Balatoni, T.; Mohos, A.; Papp, E.; Sebestyén, T.; Liszkay, G.; Oláh, J.; Varga, A.; Lengyel, Z.; Emri, G.; Gaudi, I.; et al. Tumor-infiltrating immune cells as potential biomarkers predicting response to treatment and survival in patients with metastatic melanoma receiving ipilimumab therapy. Cancer Immunol. Immunother. 2018, 64, 141–151. [Google Scholar] [CrossRef]
- Wolchok, J.D.; Hoos, A.; O’Day, S.; Weber, J.S.; Hamid, O.; Lebbé, C.; Maio, M.; Binder, M.; Bohnsack, O.; Nichol, G.; et al. Guidelines for the evaluation of immune therapy activity in solid tumors: Immune-related response criteria. Clin. Cancer Res. 2009, 15, 7412–7420. [Google Scholar] [CrossRef]
- Gonzalez-Ericsson, P.I.; Wulfkhule, J.D.; Gallagher, R.I.; Sun, X.; Axelrod, M.L.; Sheng, Q.; Luo, N.; Gomez, H.; Sanchez, V.; Sanders, M.; et al. Tumor-specific major histocompatibility-II expression predicts benefit to anti-PD-1/L1 therapy in patients with HER2-negative primary breast cancer. Clin. Cancer Res. 2021, 27, 5299–5306. [Google Scholar] [CrossRef]
- Bartlett, E.K.; Fetsch, P.A.; Filie, A.C.; Abati, A.; Steinberg, S.M.; Wunderlich, J.R.; White, D.E.; Stephens, D.J.; Marincola, F.M.; Rosenberg, S.A.; et al. Human melanoma metastases demonstrate nonstochastic site-specific antigen heterogeneity that correlates with T-cell infiltration. Clin. Cancer Res. 2014, 20, 2607–2616. [Google Scholar] [CrossRef]
- Gaida, M.M.; Welsch, T.; Herpel, E.; Tschaharganeh, D.F.; Fischer, L.; Schirmacher, P.; Hänsch, G.M.; Bergmann, F. MHC class II expression in pancreatic tumors: A link to intratumoral inflammation. Virchows Arch. 2012, 460, 47–60. [Google Scholar] [CrossRef]
- Kitano, S.; Tsuji, T.; Liu, C.; Hirschhorn-Cymerman, D.; Kyi, C.; Mu, Z.; Allison, J.P.; Gnjatic, S.; Yuan, J.D.; Wolchok, J.D. Enhancement of tumor-reactive cytotoxic CD4+ T cell responses after ipilimumab treatment in four advanced melanoma patients. Cancer Immunol. Res. 2013, 1, 235–244. [Google Scholar] [CrossRef] [PubMed]
- Axelrod, M.L.; Cook, R.S.; Johnson, D.B.; Balko, J.M. Biological consequences of MHC-II expression by tumor cells in cancer. Clin. Cancer Res. 2019, 25, 2392–2402. [Google Scholar] [CrossRef] [PubMed]
- Pyke, R.M.; Thompson, W.K.; Salem, R.M.; Font-Burgada, J.; Zanetti, M.; Carter, H. Evolutionary pressure against MHC class II binding cancer mutations. Cell 2018, 175, 416–428. [Google Scholar] [CrossRef] [PubMed]
- Ott, P.A.; Hu-Lieskovan, S.; Chmielowski, B.; Govindan, R.; Naing, A.; Bhardwaj, N.; Margolin, K.; Awad, M.M.; Hellmann, M.D.; Lin, J.J.; et al. A phase Ib trial of personalized neoantigen therapy plus anti-PD-1 in patients with advanced melanoma, non-small cell lung cancer, or bladder cancer. Cell 2020, 183, 347–362. [Google Scholar] [CrossRef]
- Hall, M.S.; Teer, J.K.; Yu, X.; Branthoover, H.; Snedal, S.; Rodriguez-Valentin, M.; Nagle, L.; Scott, E.; Schachner, B.; Innamarato, P.; et al. Neoantigen-specific CD4+ tumor-infiltrating lymphocytes are potent effectors identified within adoptive cell therapy products for metastatic melanoma patients. J. Immunother. Cancer 2023, 11, e007288. [Google Scholar] [CrossRef]
- Riaz, N.; Havel, J.J.; Makarov, V.; Desrichard, A.; Urba, W.J.; Sims, J.S.; Hodi, F.S.; Martín-Algarra, S.; Mandal, R.; Sharfman, W.H.; et al. Tumor and microenvironment evolution during immunotherapy with nivolumab. Cell 2017, 171, 934–949. [Google Scholar] [CrossRef]
- Edwards, J.; Wilmott, J.S.; Madore, J.; Gide, T.N.; Quek, C.; Tasker, A.; Ferguson, A.; Chen, J.; Hewavisenti, R.; Hersey, P.; et al. CD103+ tumor-resident CD8+ T cells are associated with improved survival in immunotherapy-naïve melanoma patients and expand significantly during anti-PD-1 treatment. Clin. Cancer Res. 2018, 24, 3036–3045. [Google Scholar] [CrossRef]
- Ladányi, A.; Somlai, B.; Gilde, K.; Fejös, Z.; Gaudi, I.; Tímár, J. T-cell activation marker expression on tumor-infiltrating lymphocytes as prognostic factor in cutaneous malignant melanoma. Clin. Cancer Res. 2004, 10, 521–530. [Google Scholar] [CrossRef]
- Petty, J.K.; He, K.; Corless, C.L.; Vetto, J.T.; Weinberg, A.D. Survival in human colorectal cancer correlates with expression of the T-cell costimulatory molecule OX-40 (CD134). Am. J. Surg. 2002, 183, 512–518. [Google Scholar] [CrossRef]
- Massarelli, E.; Lam, V.K.; Parra, E.R.; Rodriguez-Canales, J.; Behrens, C.; Diao, L.; Wang, J.; Blando, J.; Byers, L.A.; Yanamandra, N.; et al. High OX-40 expression in the tumor immune infiltrate is a favorable prognostic factor of overall survival in non-small cell lung cancer. J. Immunother. Cancer 2019, 7, 351. [Google Scholar] [CrossRef]
- Amaria, R.N.; Reddy, S.M.; Tawby, H.A.; Davies, M.A.; Ross, M.I.; Glitza, I.C.; Cormier, J.N.; Lewis, C.; Hwu, W.J.; Hanna, E.; et al. Neoadjuvant immune checkpoint blockade in high-risk resectable melanoma. Nat. Med. 2018, 24, 1649–1654. [Google Scholar] [CrossRef] [PubMed]
- Nelson, B.H. CD20+ B cells: The other tumor-infiltrating lymphocytes. J. Immunol. 2010, 185, 4977–4982. [Google Scholar] [CrossRef] [PubMed]
- Flynn, N.J.; Somasundaram, R.; Arnold, K.M.; Sims-Mourtada, J. The multifaceted roles of B cells in solid tumors: Emerging treatment opportunities. Targerted Oncol. 2017, 12, 139–152. [Google Scholar] [CrossRef] [PubMed]
- Linton, P.J.; Bautista, B.; Biederman, E.; Bradley, E.S.; Harbertson, J.; Kondrack, R.M.; Padrick, R.C.; Bradley, L.M. Costimulation via OX40L expressed by B cells is sufficient to determine the extent of primary CD4 cell expansion and Th2 cytokine secretion in vivo. J. Exp. Med. 2003, 197, 875–883. [Google Scholar] [CrossRef] [PubMed]
- Ladányi, A.; Kiss, J.; Mohos, A.; Somlai, B.; Liszkay, G.; Gilde, K.; Fejős, Z.; Gaudi, I.; Dobos, J.; Tímár, J. Prognostic impact of B-cell density in cutaneous melanoma. Cancer Immunol. Immunother. 2011, 60, 1729–1738. [Google Scholar] [CrossRef]
- Lu, S.; Stein, J.E.; Rimm, D.L.; Wang, D.W.; Bell, J.M.; Johnson, D.B.; Sosman, J.A.; Schalper, K.A.; Anders, R.A.; Wang, H.; et al. Comparison of biomarker modalities for predicting response to PD-1/PD-L1 checkpoint blockade: A systematic review and meta-analysis. JAMA Oncol. 2019, 5, 1195–1204. [Google Scholar] [CrossRef]
- Berry, S.; Giraldo, N.A.; Green, B.F.; Cottrell, T.R.; Stein, J.E.; Engle, E.L.; Xu, H.; Ogurtsova, A.; Roberts, C.; Wang, D.; et al. Analysis of multispectral imaging with the AstroPath platform informs efficacy of PD-1 blockade. Science 2021, 372, eaba2609. [Google Scholar] [CrossRef]
- Attrill, G.H.; Owen, C.N.; Ahmed, T.; Vergara, I.A.; Colebatch, A.J.; Conway, J.W.; Nahar, K.J.; Thompson, J.F.; Pires da Silva, I.; Carlino, M.S.; et al. Higher proportions of CD39+ tumor-resident cytotoxic T cells predict recurrence-free survival in patients with stage III melanoma treated with adjuvant immunotherapy. J. Immunother. Cancer 2022, 10, e004771. [Google Scholar] [CrossRef]
- Toki, M.I.; Merritt, C.R.; Wong, P.F.; Smithy, J.W.; Kluger, H.M.; Syrigos, K.N.; Ong, G.T.; Warren, S.E.; Beechem, J.M.; Rimm, D.L. High-plex predictive marker discovery for melanoma immunotherapy-treated patients using digital spatial profiling. Clin. Cancer Res. 2019, 25, 5503–5512. [Google Scholar] [CrossRef]
- Herbst, R.S.; Soria, J.C.; Kowanetz, M.; Fine, G.D.; Hamid, O.; Gordon, M.S.; Sosman, J.A.; McDermott, D.F.; Powderly, J.D.; Gettinger, S.N.; et al. Predictive correlates of response to the anti-PD-L1 antibody MPDL3280A in cancer patients. Nature 2014, 515, 563–567. [Google Scholar] [CrossRef]
- Tang, H.; Liang, Y.; Anders, R.A.; Taube, J.M.; Qiu, X.; Mulgaonkar, A.; Liu, X.; Harrington, S.M.; Guo, J.; Xin, Y.; et al. PD-L1 on host cells is essential for PD-L1 blockade-mediated tumor regression. J. Clin. Investig. 2018, 128, 580–588. [Google Scholar] [CrossRef] [PubMed]
- Lin, H.; Wei, S.; Hurt, E.M.; Green, M.D.; Zhao, L.; Vatan, L.; Szeliga, W.; Herbst, R.; Harms, P.W.; Fecher, L.A.; et al. Host expression of PD-L1 determines efficacy of PD-L1 pathway blockade-mediated tumor regression. J. Clin. Investig. 2018, 128, 805–815. [Google Scholar] [CrossRef] [PubMed]
- Ladányi, A.; Hegyi, B.; Balatoni, T.; Liszkay, G.; Rohregger, R.; Waldnig, C.; Dudás, J.; Ferrone, S. HLA class I downregulation in progressing metastases of melanoma patients treated with ipilimumab. Pathol. Oncol. Res. 2022, 28, 1610297. [Google Scholar] [CrossRef] [PubMed]
- Hegyi, B.; Csikó, K.G.; Balatoni, T.; Neumark, A.R.; Bőcs, K.; Tóth, E.; Fröhlich, G.; Liszkay, G.; Ferrone, S.; Ladányi, A. Tumor-infiltrating immune cells and HLA expression as potential biomarkers predicting response to PD-1 inhibitor therapy in stage IV melanoma. Mol. Oncol. 2024, 18 (Suppl. S1), 1609. [Google Scholar] [CrossRef]


| Responder (CR, PR) n = 28 | Non-Responder (SD, PD) n = 12 | p Value | |
|---|---|---|---|
| Age, years: median (range) | 62 (27–87) | 53 (34–77) | NS a |
| Gender | |||
| female | 11 | 2 | |
| male | 17 | 10 | NS b |
| ECOG performance status | |||
| 0 | 27 | 8 | |
| 1 | 1 | 4 | 0.0223 b |
| BRAF mutation status | |||
| wild type | 20 | 10 | |
| mutant | 8 | 2 | NS b |
| LDH level | |||
| normal | 23 | 4 | |
| >ULN | 5 | 8 | 0.0075 b |
| Anti-PD-1 drug | |||
| nivolumab | 9 | 8 | |
| pembrolizumab | 19 | 4 | NS b |
| Line of therapy | |||
| 1 | 20 | 8 | |
| 2–5 | 8 | 4 | NS b |
| PFS, months: median (range) | 27 (4–90+) | 3 (1–11) | 0.0000 a |
| OS, months: median (range) | 46 (13–91+) | 9 (4–62+) | 0.0002 a |
| Responder (CR, PR) n = 28 | Non-Responder (SD, PD) n = 12 | p Value a | |
|---|---|---|---|
| HLA class I; Ab clone (cutoff score) | |||
| HCA2 b (≥1.3) | 16/27 (59%) | 5/12 (42%) | 0.4877 |
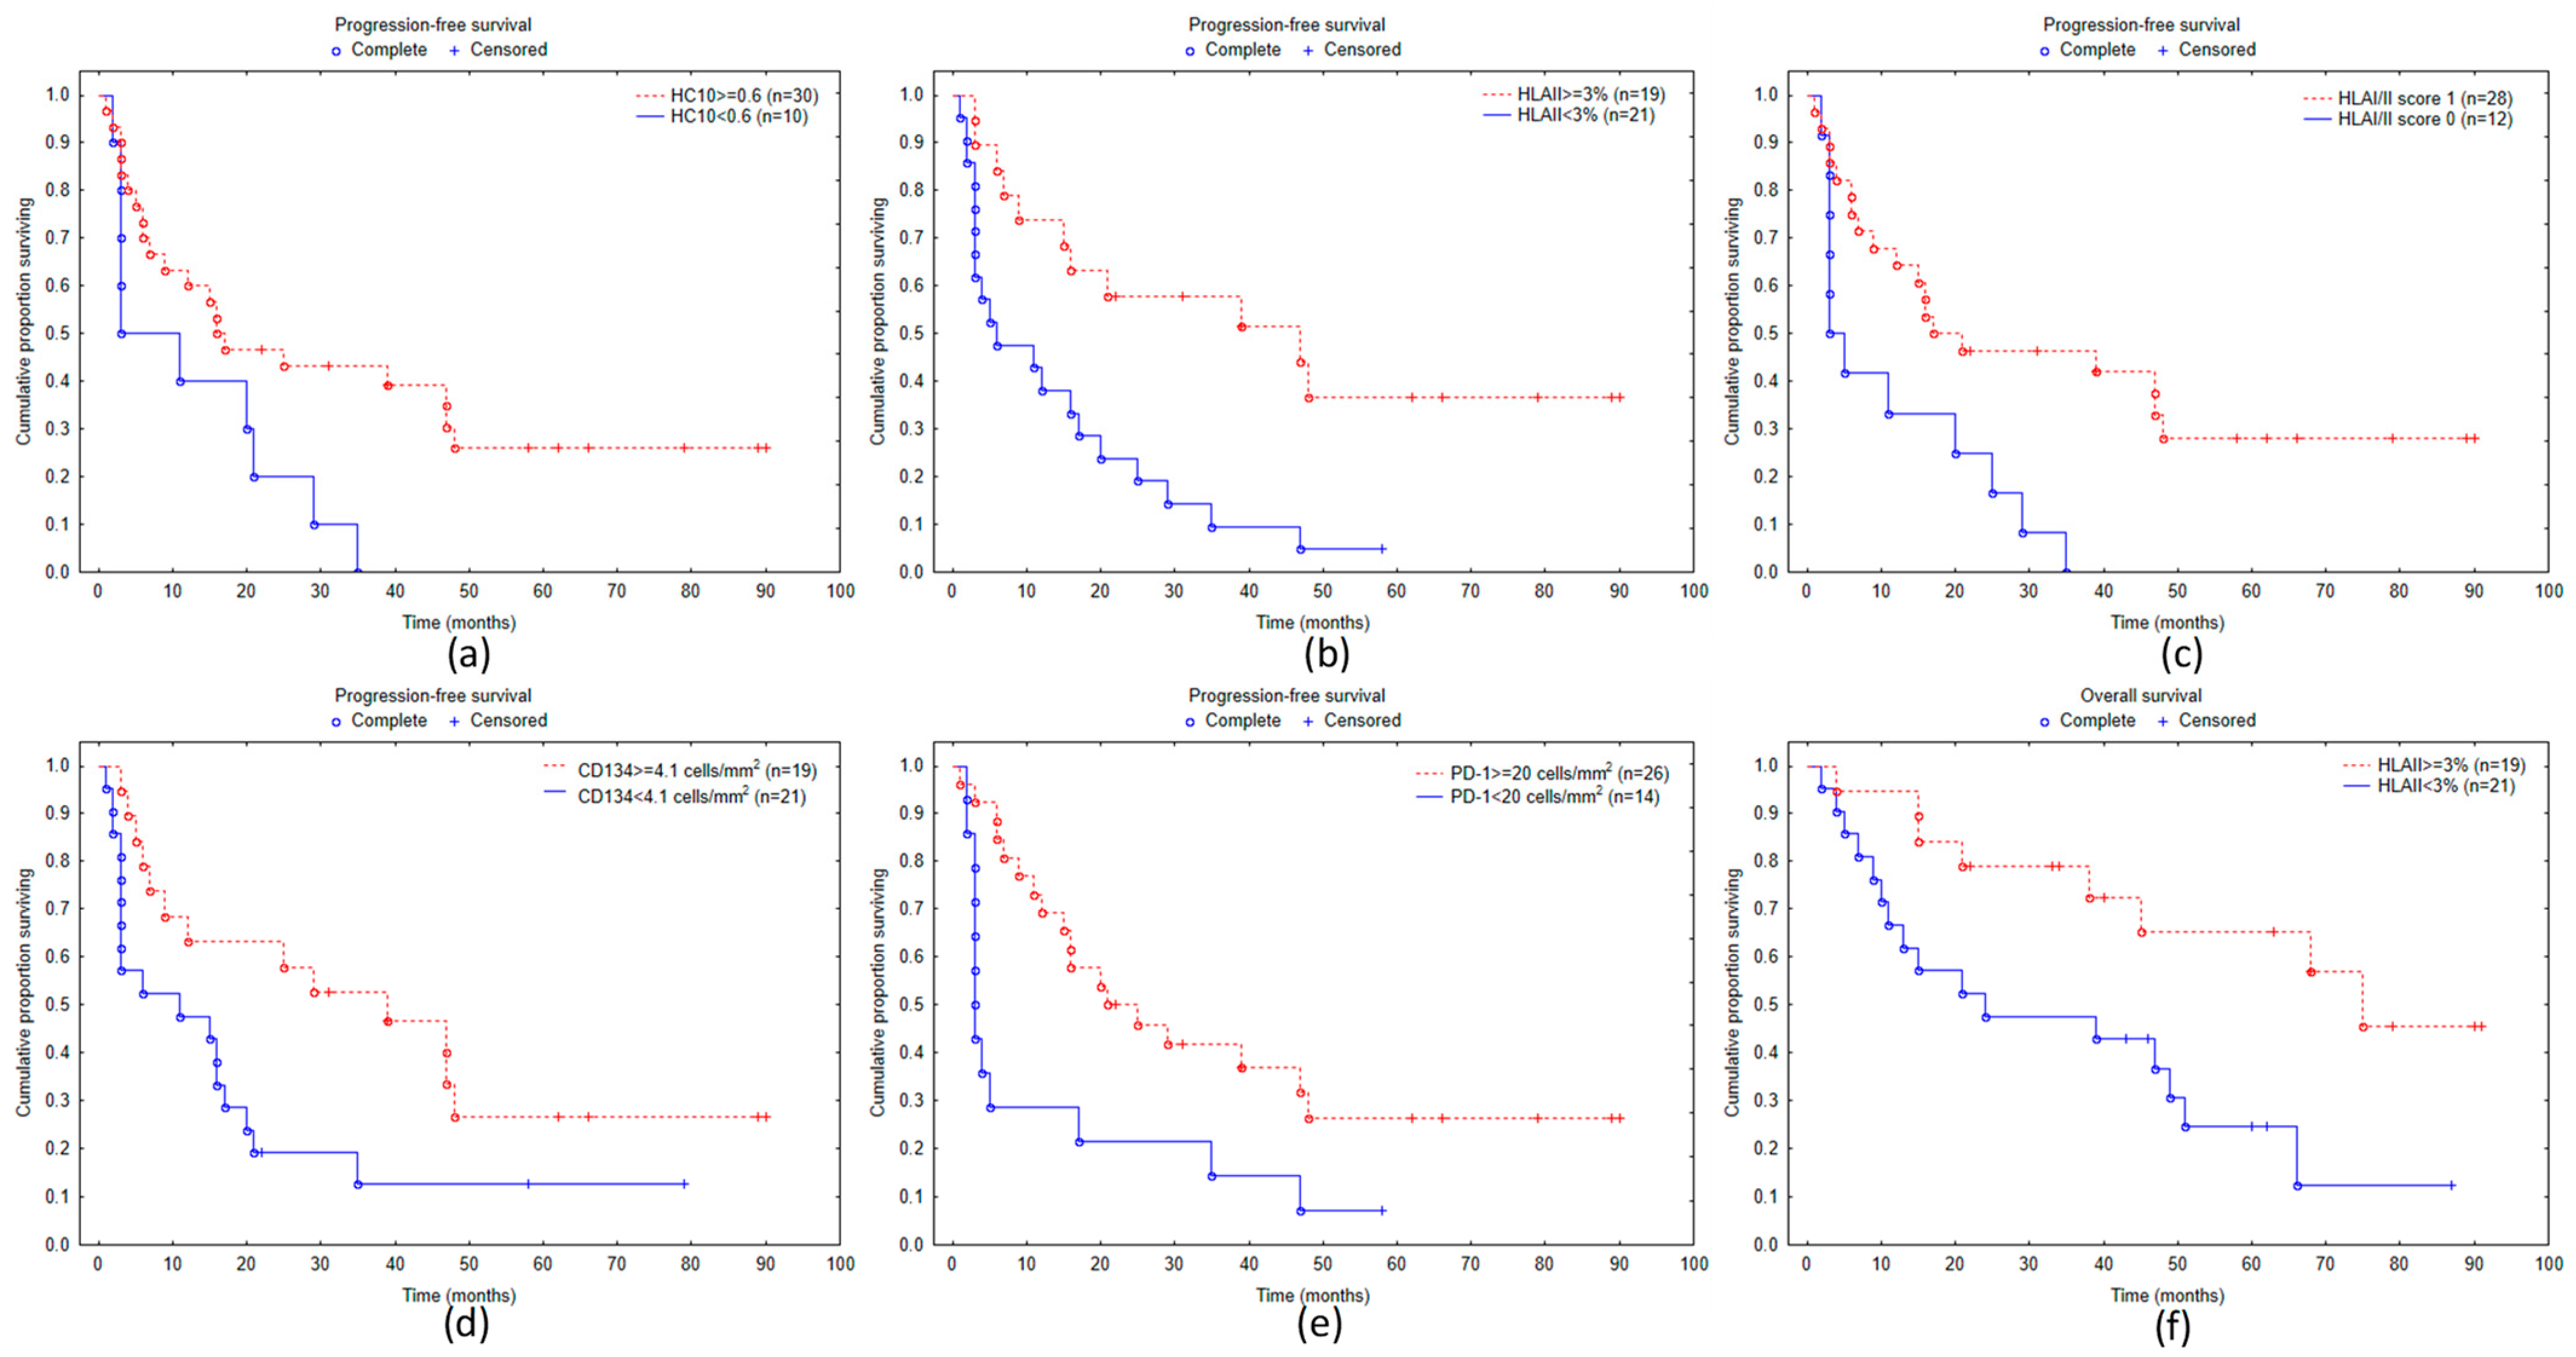
| HC10 (≥0.6) | 24/28 (86%) | 6/12 (50%) | 0.0411 |
| NAMB-1 (≥1.7) | 14/28 (50%) | 3/12 (25%) | 0.1788 |
| EMR8-5 (≥1.4) | 20/28 (71%) | 4/12 (33%) | 0.0367 |
| HLA class II (cutoff: ≥3%) | 17/28 (61%) | 2/12 (17%) | 0.0158 |
| HLA I/II score c (cutoff: ≥3) | 24/28 (86%) | 4/12 (33%) | 0.0019 |
| Density of Labeled Cells (n/mm2), Median (Range) | |||
|---|---|---|---|
| Immune Cell Marker | Responder (CR, PR) n = 28 | Non-Responder (SD, PD) n = 12 | p Value a |
| CD8 | 96.0 (12.8–540.8) | 31.2 (1.6–347.2) | 0.0112 |
| CD45RO | 416.8 (64.0–769.6) | 194.4 (83.2–774.4) | 0.1918 |
| CD20 | 18.4 (0.0–195.2) | 7.2 (0.0–27.2) | 0.0093 |
| NKp46 | 3.0 (0.0–16.3) | 1.3 (0.0–10.6) | 0.3132 |
| FOXP3 | 24.0 (4.8–100.8) | 16.0 (6.4–108.8) | 0.1084 |
| CD134 | 4.9 (0.0–68.0) | 2.5 (0.0–10.7) | 0.0390 |
| CD137 | 7.4 (1.1–37.3) | 3.8 (0.2–17.0) | 0.2992 |
| CD103 | 76.0 (17.6–246.4) | 29.6 (1.6–131.2) | 0.0077 |
| PD-1 | 71.2 (4.8–393.6) | 13.6 (0.0–326.4) | 0.0011 |
| PD-L1 | 86.4 (1.6–705.6) | 16.8 (0.0–123.2) | 0.0046 |
| Proportion of Cases with High Cell Density (%) | |||
| Immune Cell Marker (Cutoff) | Responder (CR, PR) n = 28 | Non-Responder (SD, PD) n = 12 | p Value b |
| CD8 (≥54 cells/mm2) | 20/28 (71%) | 3/12 (25%) | 0.0130 |
| CD45RO (≥264 cells/mm2) | 18/28 (64%) | 3/12 (25%) | 0.0378 |
| CD20 (≥28 cells/mm2) | 10/28 (36%) | 0/12 (0%) | 0.0188 |
| NKp46 (≥3.4 cells/mm2) | 13/28 (46%) | 3/12 (25%) | 0.2969 |
| FOXP3 (≥20 cells/mm2) | 18/28 (64%) | 3/12 (25%) | 0.0378 |
| CD134 (≥4.1 cells/mm2) | 17/28 (61%) | 2/12 (17%) | 0.0158 |
| CD137 (≥6.7 cells/mm2) | 14/28 (50%) | 3/12 (25%) | 0.1788 |
| CD103 (≥36 cells/mm2) | 21/28 (75%) | 4/12 (33%) | 0.0297 |
| PD-1 (≥20 cells/mm2) | 23/28 (82%) | 3/12 (25%) | 0.0010 |
| PD-L1 (≥54 cells/mm2) | 19/28 (68%) | 1/12 (8%) | 0.0012 |
Disclaimer/Publisher’s Note: The statements, opinions and data contained in all publications are solely those of the individual author(s) and contributor(s) and not of MDPI and/or the editor(s). MDPI and/or the editor(s) disclaim responsibility for any injury to people or property resulting from any ideas, methods, instructions or products referred to in the content. |
© 2024 by the authors. Licensee MDPI, Basel, Switzerland. This article is an open access article distributed under the terms and conditions of the Creative Commons Attribution (CC BY) license (https://creativecommons.org/licenses/by/4.0/).
Share and Cite
Hegyi, B.; Csikó, K.G.; Balatoni, T.; Fröhlich, G.; Bőcs, K.; Tóth, E.; Mohos, A.; Neumark, A.R.; Menyhárt, C.D.; Ferrone, S.; et al. Tumor-Infiltrating Immune Cells and HLA Expression as Potential Biomarkers Predicting Response to PD-1 Inhibitor Therapy in Stage IV Melanoma Patients. Biomolecules 2024, 14, 1609. https://doi.org/10.3390/biom14121609
Hegyi B, Csikó KG, Balatoni T, Fröhlich G, Bőcs K, Tóth E, Mohos A, Neumark AR, Menyhárt CD, Ferrone S, et al. Tumor-Infiltrating Immune Cells and HLA Expression as Potential Biomarkers Predicting Response to PD-1 Inhibitor Therapy in Stage IV Melanoma Patients. Biomolecules. 2024; 14(12):1609. https://doi.org/10.3390/biom14121609
Chicago/Turabian StyleHegyi, Barbara, Kristóf György Csikó, Tímea Balatoni, Georgina Fröhlich, Katalin Bőcs, Erika Tóth, Anita Mohos, Anna Rebeka Neumark, Csenge Dorottya Menyhárt, Soldano Ferrone, and et al. 2024. "Tumor-Infiltrating Immune Cells and HLA Expression as Potential Biomarkers Predicting Response to PD-1 Inhibitor Therapy in Stage IV Melanoma Patients" Biomolecules 14, no. 12: 1609. https://doi.org/10.3390/biom14121609
APA StyleHegyi, B., Csikó, K. G., Balatoni, T., Fröhlich, G., Bőcs, K., Tóth, E., Mohos, A., Neumark, A. R., Menyhárt, C. D., Ferrone, S., & Ladányi, A. (2024). Tumor-Infiltrating Immune Cells and HLA Expression as Potential Biomarkers Predicting Response to PD-1 Inhibitor Therapy in Stage IV Melanoma Patients. Biomolecules, 14(12), 1609. https://doi.org/10.3390/biom14121609