
Fast and Simple Protocol for N-Glycome Analysis of Human Blood Plasma Proteome

 , , , , , , , and
Abstract
1. Introduction
2. Materials and Methods
2.1. Materials
2.2. Methods
2.2.1. Blood Plasma Preparation
2.2.2. Isolation of N-Glycans
2.2.3. Separation of the N-Glycan Fraction by Capillary Gel Electrophoresis
2.2.4. Electropherogram Analysis
3. Results
4. Discussion
5. Conclusions
Author Contributions
Funding
Institutional Review Board Statement
Informed Consent Statement
Data Availability Statement
Acknowledgments
Conflicts of Interest
References
- Dotz, V.; Wuhrer, M. N-glycome signatures in human plasma: Associations with physiology and major diseases. FEBS Lett. 2019, 593, 2966–2976. [Google Scholar] [CrossRef] [PubMed]
- Schjoldager, K.T.; Narimatsu, Y.; Joshi, H.J.; Clausen, H. Global view of human protein glycosylation pathways and functions. Nat. Rev. Mol. Cell Biol. 2020, 21, 729–749. [Google Scholar] [CrossRef] [PubMed]
- Varki, A. Biological roles of glycans. Glycobiology 2017, 27, 3–49. [Google Scholar] [CrossRef]
- Reily, C.; Stewart, T.J.; Renfrow, M.B.; Novak, J. Glycosylation in health and disease. Nat. Rev. Nephrol. 2019, 15, 346–366. [Google Scholar] [CrossRef] [PubMed]
- Malaker, S.A. Glycoproteomics: Charting new territory in mass spectrometry and glycobiology. J. Mass Spectrom. 2024, 59, e5034. [Google Scholar] [CrossRef]
- Timoshchuk, A.; Sharapov, S.; Aulchenko, Y.S. Twelve Years of Genome-Wide Association Studies of Human Protein N-Glycosylation. Engineering 2023, 26, 17–31. [Google Scholar] [CrossRef]
- Gornik, O.; Wagner, J.; Pučić, M.; Knežević, A.; Redžić, I.; Lauc, G. Stability of N-glycan profiles in human plasma. Glycobiology 2009, 19, 1547–1553. [Google Scholar] [CrossRef]
- Rudman, N.; Gornik, O.; Lauc, G. Altered N-glycosylation profiles as potential biomarkers and drug targets in diabetes. FEBS Lett. 2019, 593, 1598–1615. [Google Scholar] [CrossRef] [PubMed]
- Pinho, S.S.; Reis, C.A. Glycosylation in cancer: Mechanisms and clinical implications. Nat. Rev. Cancer 2015, 15, 540–555. [Google Scholar] [CrossRef]
- Pan, L.; Aguilar, H.A.; Wang, L.; Iliuk, A.; Tao, W.A. Three-Dimensionally Functionalized Reverse Phase Glycoprotein Array for Cancer Biomarker Discovery and Validation. J. Am. Chem. Soc. 2016, 138, 15311–15314. [Google Scholar] [CrossRef]
- Pirillo, A.; Svecla, M.; Catapano, A.L.; Holleboom, A.G.; Norata, G.D. Impact of protein glycosylation on lipoprotein metabolism and atherosclerosis. Cardiovasc. Res. 2021, 117, 1033–1045. [Google Scholar] [CrossRef] [PubMed]
- Gudelj, I.; Lauc, G. Protein N-Glycosylation in Cardiovascular Diseases and Related Risk Factors. Curr. Cardiovasc. Risk Rep. 2018, 12, 16. [Google Scholar] [CrossRef]
- Videira, P.A.Q.; Castro-Caldas, M. Linking Glycation and Glycosylation With Inflammation and Mitochondrial Dysfunction in Parkinson’s Disease. Front. Neurosci. 2018, 12, 381. [Google Scholar] [CrossRef] [PubMed]
- Xu, M.; Jin, H.; Ge, W.; Zhao, L.; Liu, Z.; Guo, Z.; Wu, Z.; Chen, J.; Mao, C.; Zhang, X.; et al. Mass Spectrometric Analysis of Urinary N-Glycosylation Changes in Patients with Parkinson’s Disease. ACS Chem. Neurosci. 2023, 14, 3507–3517. [Google Scholar] [CrossRef]
- Lauc, G.; Trbojević-Akmačić, I. (Eds.) The Role of Glycosylation in Health and Disease; Springer Nature: Berlin/Heidelberg, Germany, 2021; Volume 1325. [Google Scholar] [CrossRef]
- Krištić, J.; Vučković, F.; Menni, C.; Klarić, L.; Keser, T.; Beceheli, I.; Pučić-Baković, M.; Novokmet, M.; Mangino, M.; Thaqi, K.; et al. Glycans are a novel biomarker of chronological and biological ages. J. Gerontol. A Biol. Sci. Med. Sci. 2014, 69, 779–789. [Google Scholar] [CrossRef]
- Huffman, J.E.; Knežević, A.; Vitart, V.; Kattla, J.; Adamczyk, B.; Novokmet, M.; Igl, W.; Pučić, M.; Zgaga, L.; Johannson, Å.; et al. Polymorphisms in B3GAT1, SLC9A9 and MGAT5 are associated with variation within the human plasma N-glycome of 3533 European adults. Hum. Mol. Genet. 2011, 20, 5000–5011. [Google Scholar] [CrossRef]
- Bondt, A.; Selman, M.H.J.; Deelder, A.M.; Hazes, J.M.W.; Willemsen, S.P.; Wuhrer, M.; Dolhain, R.J.E.M. Association between galactosylation of immunoglobulin G and improvement of rheumatoid arthritis during pregnancy is independent of sialylation. J. Proteome Res. 2013, 12, 4522–4531. [Google Scholar] [CrossRef]
- Clerc, F.; Reiding, K.R.; Jansen, B.C.; Kammeijer, G.S.M.; Bondt, A.; Wuhrer, M. Human plasma protein N-glycosylation. Glycoconj. J. 2016, 33, 309–343. [Google Scholar] [CrossRef] [PubMed]
- Zhou, R.Z.; Vetrano, D.L.; Grande, G.; Duell, F.; Jönsson, L.; Laukka, E.J.; Fredolini, C.; Winblad, B.; Tjernberg, L.; Schedin-Weiss, S. A glycan epitope correlates with tau in serum and predicts progression to Alzheimer’s disease in combination with APOE4 allele status. Alzheimer’s Dement. 2023, 19, 3244–3249. [Google Scholar] [CrossRef]
- Zhou, R.Z.; Duell, F.; Axenhus, M.; Jönsson, L.; Winblad, B.; Tjernberg, L.O.; Schedin-Weiss, S. A glycan biomarker predicts cognitive decline in amyloid- and tau-negative patients. Brain Commun. 2024, 6, fcae371. [Google Scholar] [CrossRef]
- Zhou, R.Z.; Vetrano, D.L.; Grande, G.; Zhao,, J.; Lang, , M. New Insight into Protein Glycosylation in the Development of Alzheimer’s Disease. Cell Death Discov 2023, 19, 314. [Google Scholar] [CrossRef]
- Reiding, K.R.; Bondt, A.; Hennig, R.; Gardner, R.A.; O’Flaherty, R.; Trbojevic-Akmacic, I.; Shubhakar, A.; Hazes, J.M.W.; Reichl, U.; Fernandes, D.L.; et al. High-throughput Serum N-Glycomics: Method Comparison and Application to Study Rheumatoid Arthritis and Pregnancy-associated Changes. Mol. Cell. Proteomics 2019, 18, 3–15. [Google Scholar] [CrossRef] [PubMed]
- Hennig, R.; Cajic, S.; Borowiak, M.; Hoffmann, M.; Kottler, R.; Reichl, U.; Rapp, E. Towards personalized diagnostics via longitudinal study of the human plasma N-glycome. Biochim. Biophys. Acta 2016, 1860, 1728–1738. [Google Scholar] [CrossRef] [PubMed]
- Leonova, O.N.; Elgaeva, E.E.; Golubeva, T.S.; Peleganchuk, A.V.; Krutko, A.V.; Aulchenko, Y.S.; Tsepilov, Y.A. A protocol for recruiting and analyzing the disease-oriented Russian disc degeneration study (RuDDS) biobank for functional omics studies of lumbar disc degeneration. PLoS ONE 2022, 17, e0267384. [Google Scholar] [CrossRef] [PubMed]
- Virtanen, P.; Gommers, R.; Oliphant, T.E.; Haberland, M.; Reddy, T.; Cournapeau, D.; Burovski, E.; Peterson, P.; Weckesser, W.; Bright, J.; et al. SciPy 1.0: Fundamental algorithms for scientific computing in Python. Nat. Methods 2020, 17, 261–272. [Google Scholar] [CrossRef]
- Harris, C.R.; Millman, K.J.; van der Walt, S.J.; Gommers, R.; Virtanen, P.; Cournapeau, D.; Wieser, E.; Taylor, J.; Berg, S.; Smith, N.J.; et al. Array programming with NumPy. Nature 2020, 585, 357–362. [Google Scholar] [CrossRef]
- Meert, W.; Hendrickx, K.; Van Craenendonck, T.; Robberechts, P.; Blockeel, H.; Davis, J. DTAIDistance, Version v2.3.10; Zenodo: Geneva, Switzerland, 2020. [Google Scholar] [CrossRef]
- Gonzales, R.C.; Woods, R.E. Intensity Transformations and Spatial Filtering. In Digital Image Processing; Pearson Education: New York, NY, USA, 2018; p. 1022. [Google Scholar]
- Ye, J.; Tian, Z.; Wei, H.; Li, Y. Baseline correction method based on improved asymmetrically reweighted penalized least squares for the Raman spectrum. Appl. Opt. 2020, 59, 10933. [Google Scholar] [CrossRef]

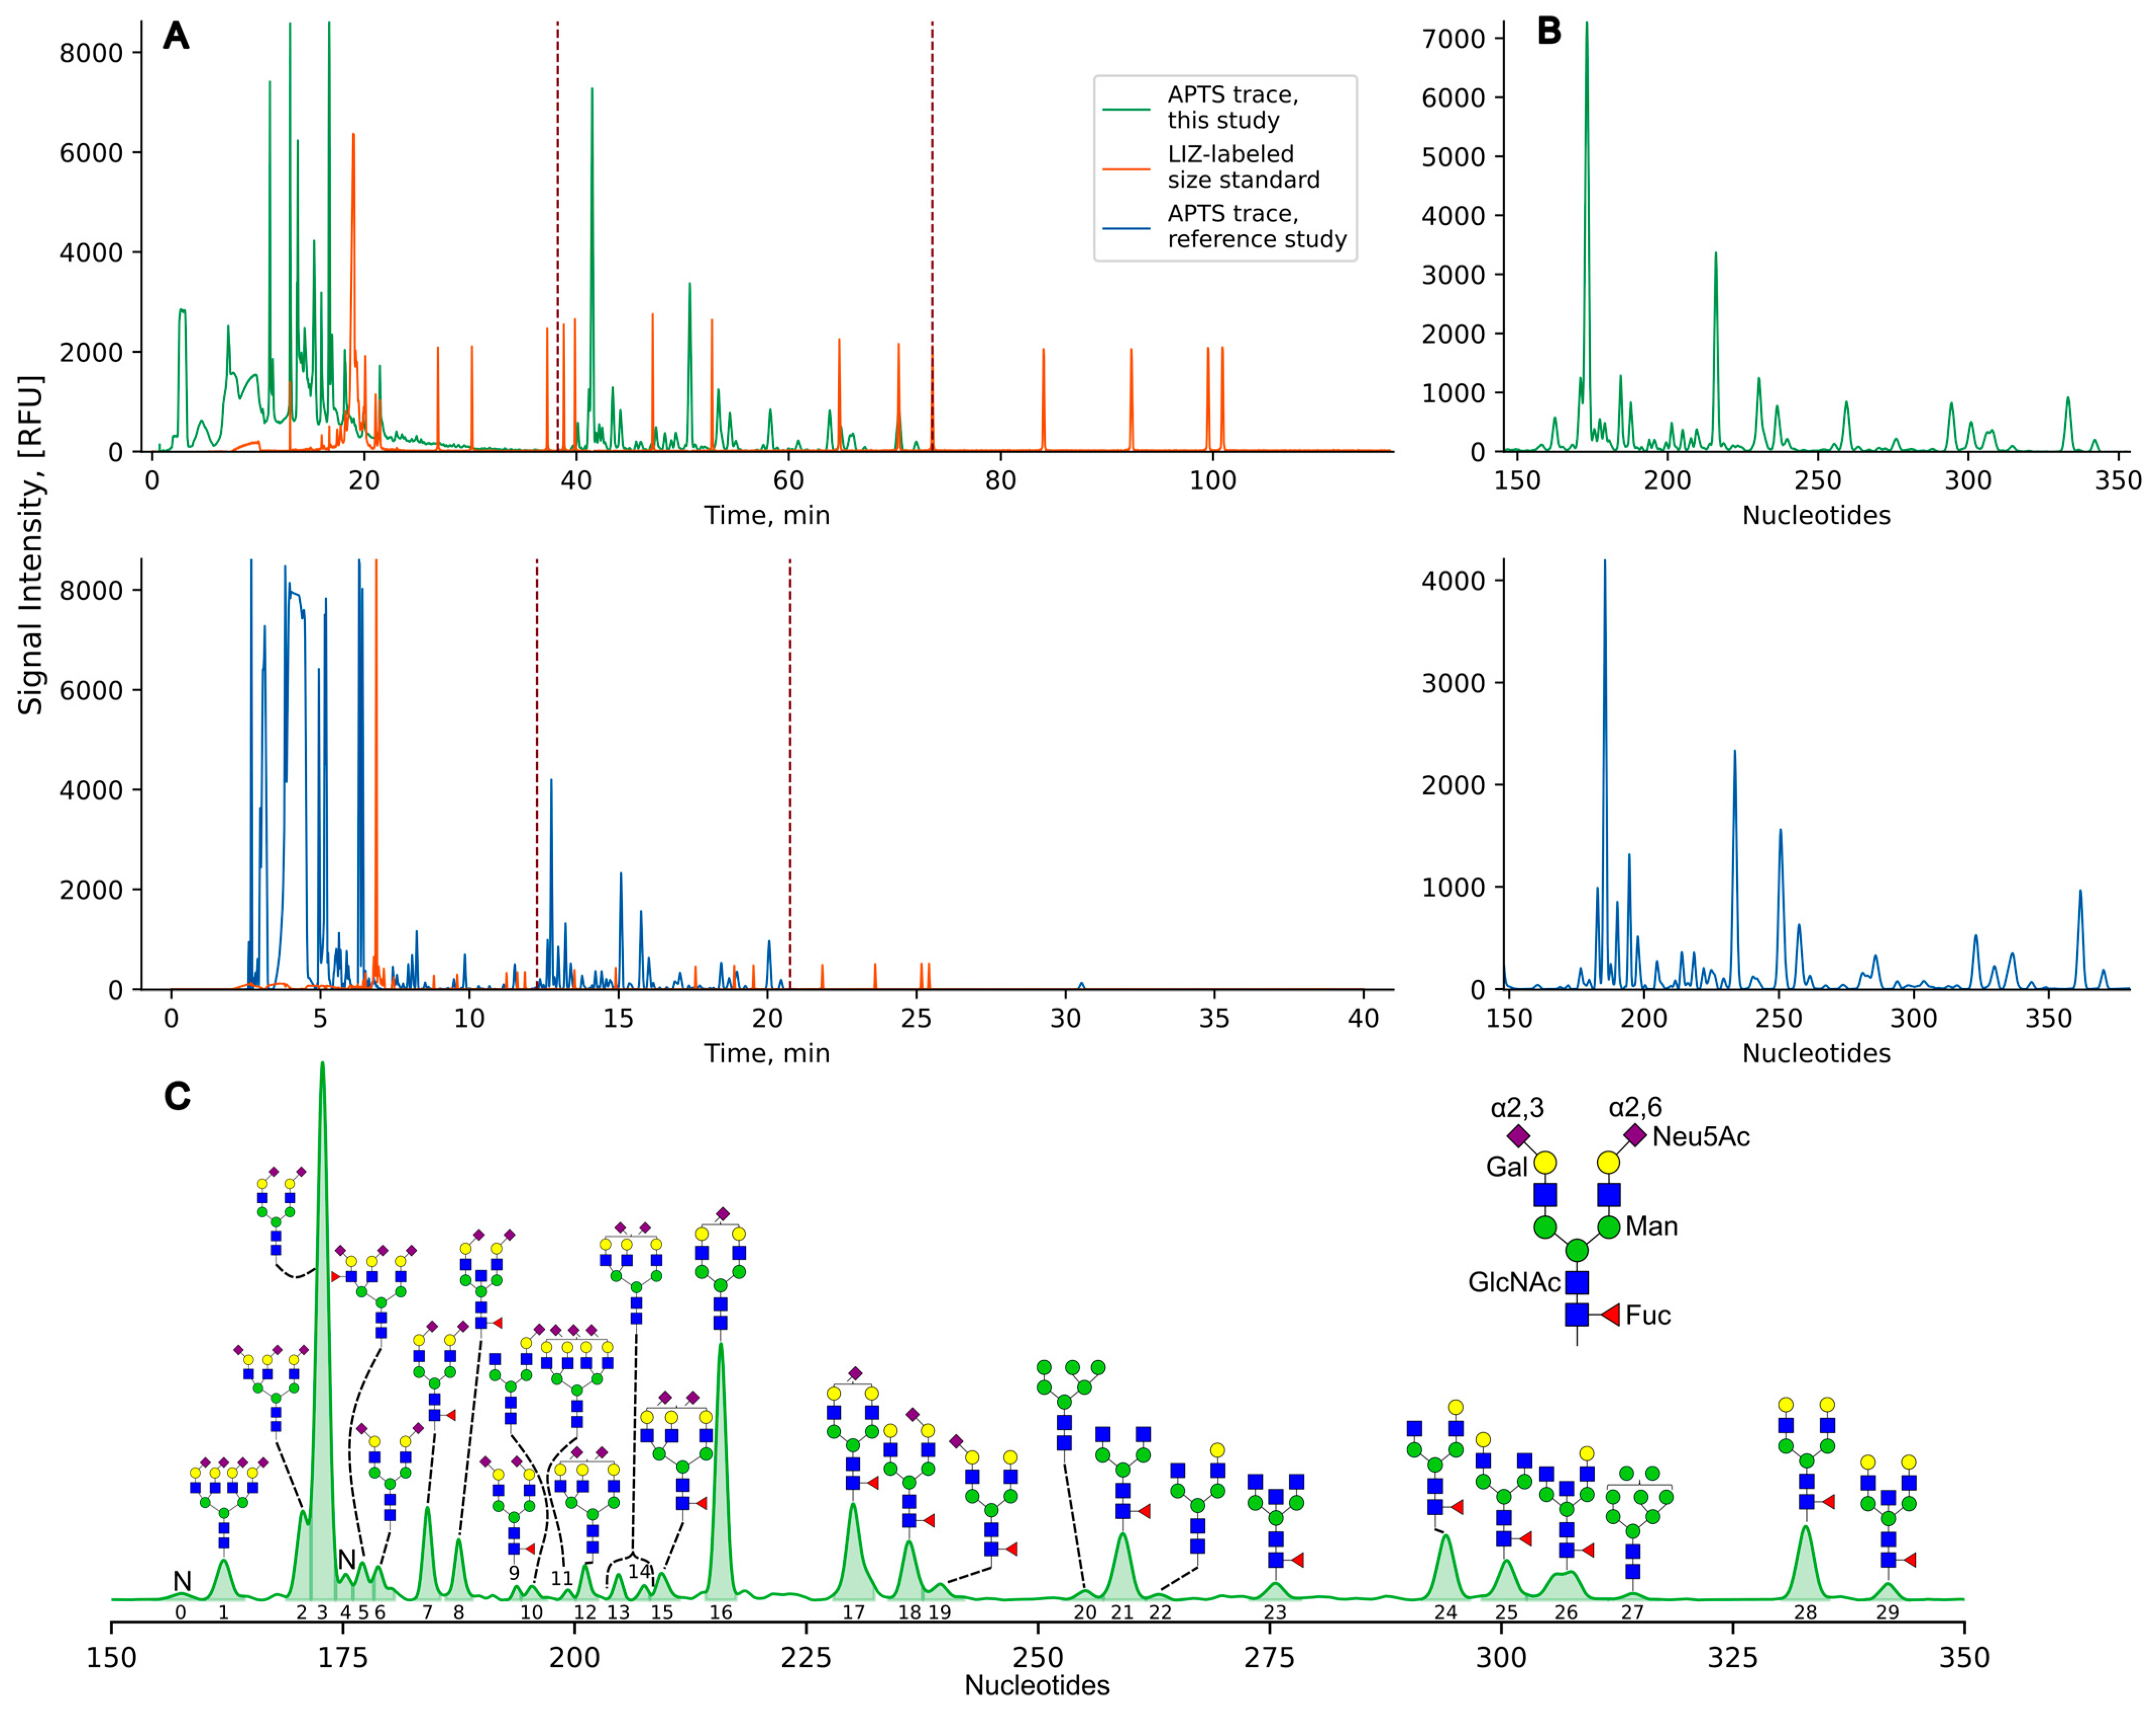
| Peak ID | DTW | Visual | Result | Structure | Peak ID | DTW | Visual | Result | Structure |
|---|---|---|---|---|---|---|---|---|---|
| 0 | NA | NA | NA a | NA | 15 | 19 | 19 | 19, 20 d | A3F1G3S2 A3F1G3S[6,6]2 FA2G1S[6]1 FA3G3S[6,6]2 |
| 1 | 1 | 1 | 1 | A4G4S[6,6,6,6]4 | 16 | 22 | 22 | 22 | A2G2S[6]1 FA2[6]BG1S[6]1 |
| 2 | 3 | 3 | 3 | A3G3S[3,6,6]3 | 17 | 25 | 25 | 25 | FA2G2S[6]1 M5 |
| 3 | 4 | 4 | 4 | A2G2S[6,6]2 | 18 | 26 | 26 | 26 | FA2BG2S[6]1 FA2[6]G2S[3]1 |
| 4 | 5 | NA | NA b | NA | 19 | 27 | 27 | 27 | FA2[3]G2S[3]1 |
| 5 | 5, 6 | NA | 5 b | A3F1G3S[3,6,6]3 | 20 | 30 | 30 | 30 | M6 A3G3S[6]1 |
| 6 | 6 | 6 | 6 | A2G2S[3,6]2 | 21 | 31 | 31 | 31 | FA2 A3G3S[6]1 |
| 7 | 7 | 7 | 7 | FA2G2S[6,6]2 | 22 | 32 | 32 | 32 | A2[6]G1 |
| 8 | 9 | 9 | 9 | A1[3]G1S[3]1 FA2G2S[3,6]2 | 23 | 35 | 35 | 35 | FA2B |
| 9 | 11 | 11 | 11 | FA2G2S[3,3]2 A4G4S[3,3,6]3 | 24 | 39 | 39 | 39 | FA2[6]G1 |
| 10 | 15 | NA | 12 c | FA1[3]G1S[6]1 FA1[6]G1S[3]1 A2[6]G1S[6]1 | 25 | 40 | 40 | 40 | FA2[3]G1 |
| 11 | 15 | 15 | 15 | A4G4S[3,3,3]3 | 26 | 41 | 41 | 41 | A2G2 FA2[6]BG1 |
| 12 | 16 | 16 | 16 | A3G3S [6,6]2 | 27 | 41 | 42 | 42 e | M8 FA2[3]BG1 |
| 13 | 17 | 17 | 17 | A3G3S[3,6]2 | 28 | 45 | 45 | 45 | FA2G2 M9 |
| 14 | 18 | 18 | 18 | A3G3S[3,6]2 | 29 | 46 | 46 | 46 | FA2BG2 |
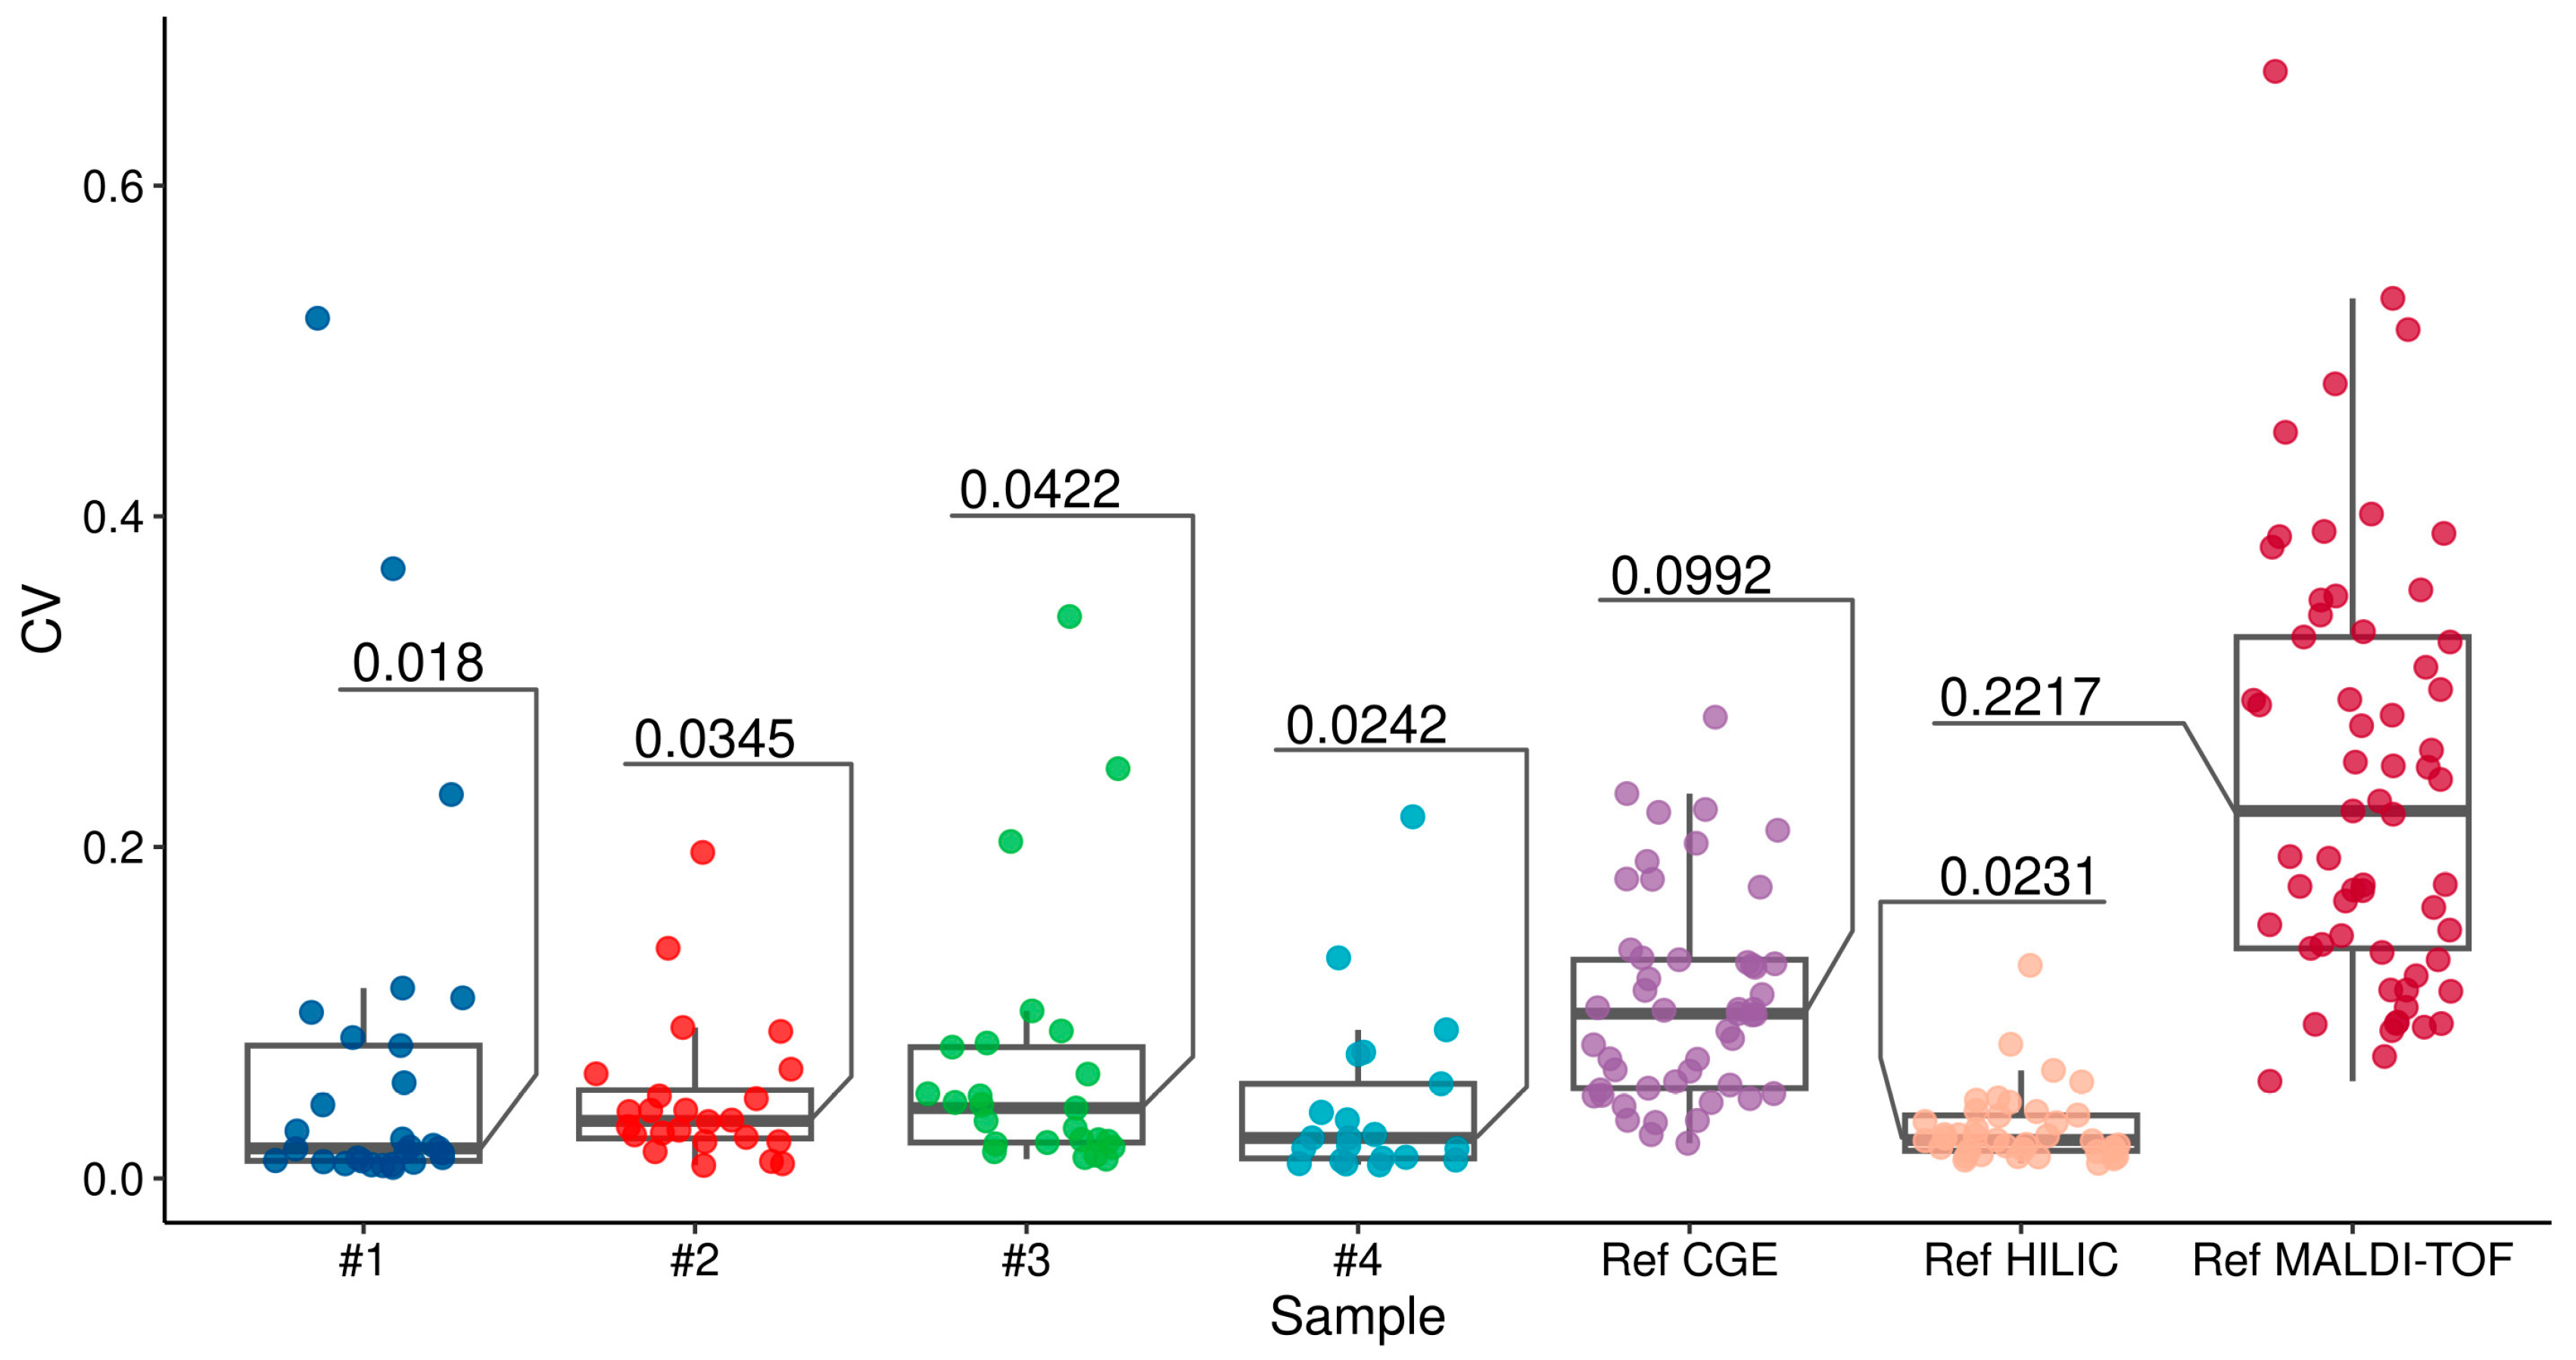
| Sample | Pearson’s ρ | Pearson’s ρ, MH-Normalized | Median Lag of MCC | Median CV, TA-Normalized Peak Area | Median CV, MH-Normalized Peak Height |
|---|---|---|---|---|---|
| No. 1 | 0.985 | 0.883 | 2.50 | 0.018 | 0.0147 |
| No. 2 | 0.97 | 0.758 | 1.50 | 0.0345 | 0.0407 |
| No. 3 | 0.795 | 0.616 | 9.50 | 0.0422 | 0.0371 |
| No. 4 | 0.836 | 0.728 | 2.50 | 0.0242 | 0.0241 |
Disclaimer/Publisher’s Note: The statements, opinions and data contained in all publications are solely those of the individual author(s) and contributor(s) and not of MDPI and/or the editor(s). MDPI and/or the editor(s) disclaim responsibility for any injury to people or property resulting from any ideas, methods, instructions or products referred to in the content. |
© 2024 by the authors. Licensee MDPI, Basel, Switzerland. This article is an open access article distributed under the terms and conditions of the Creative Commons Attribution (CC BY) license (https://creativecommons.org/licenses/by/4.0/).
Share and Cite
Maslov, D.E.; Timoshchuk, A.N.; Bondar, A.A.; Golubev, M.P.; Soplenkova, A.G.; Hanic, M.; Sharapov, S.Z.; Leonova, O.N.; Aulchenko, Y.S.; Golubeva, T.S. Fast and Simple Protocol for N-Glycome Analysis of Human Blood Plasma Proteome. Biomolecules 2024, 14, 1551. https://doi.org/10.3390/biom14121551
Maslov DE, Timoshchuk AN, Bondar AA, Golubev MP, Soplenkova AG, Hanic M, Sharapov SZ, Leonova ON, Aulchenko YS, Golubeva TS. Fast and Simple Protocol for N-Glycome Analysis of Human Blood Plasma Proteome. Biomolecules. 2024; 14(12):1551. https://doi.org/10.3390/biom14121551
Chicago/Turabian StyleMaslov, Denis E., Anna N. Timoshchuk, Alexander A. Bondar, Maxim P. Golubev, Anna G. Soplenkova, Maja Hanic, Sodbo Z. Sharapov, Olga N. Leonova, Yurii S. Aulchenko, and Tatiana S. Golubeva. 2024. "Fast and Simple Protocol for N-Glycome Analysis of Human Blood Plasma Proteome" Biomolecules 14, no. 12: 1551. https://doi.org/10.3390/biom14121551
APA StyleMaslov, D. E., Timoshchuk, A. N., Bondar, A. A., Golubev, M. P., Soplenkova, A. G., Hanic, M., Sharapov, S. Z., Leonova, O. N., Aulchenko, Y. S., & Golubeva, T. S. (2024). Fast and Simple Protocol for N-Glycome Analysis of Human Blood Plasma Proteome. Biomolecules, 14(12), 1551. https://doi.org/10.3390/biom14121551