
A 20-Year Longitudinal Study of Plasma Chitotriosidase Activity in Treated Gaucher Disease Type 1 and 3 Patients—A Qualitative and Quantitative Approach

 ,
, 

Abstract
1. Introduction
2. Material and Methods
- (a)
- type of GD and genotype for GBA1 gene (detailed characteristics are provided in a Supplementary Table S1).
- (b)
- splenectomy (yes/no).
- (c)
- genotype for CHIT1 gene (including CHIT1 24 bp-dup homozygote [Hm], heterozygote [Ht], and wild type [WT]).
2.1. Laboratory Analyzes
CHIT1 Genotyping
2.2. Statistical Analysis and Data Visualization
3. Results
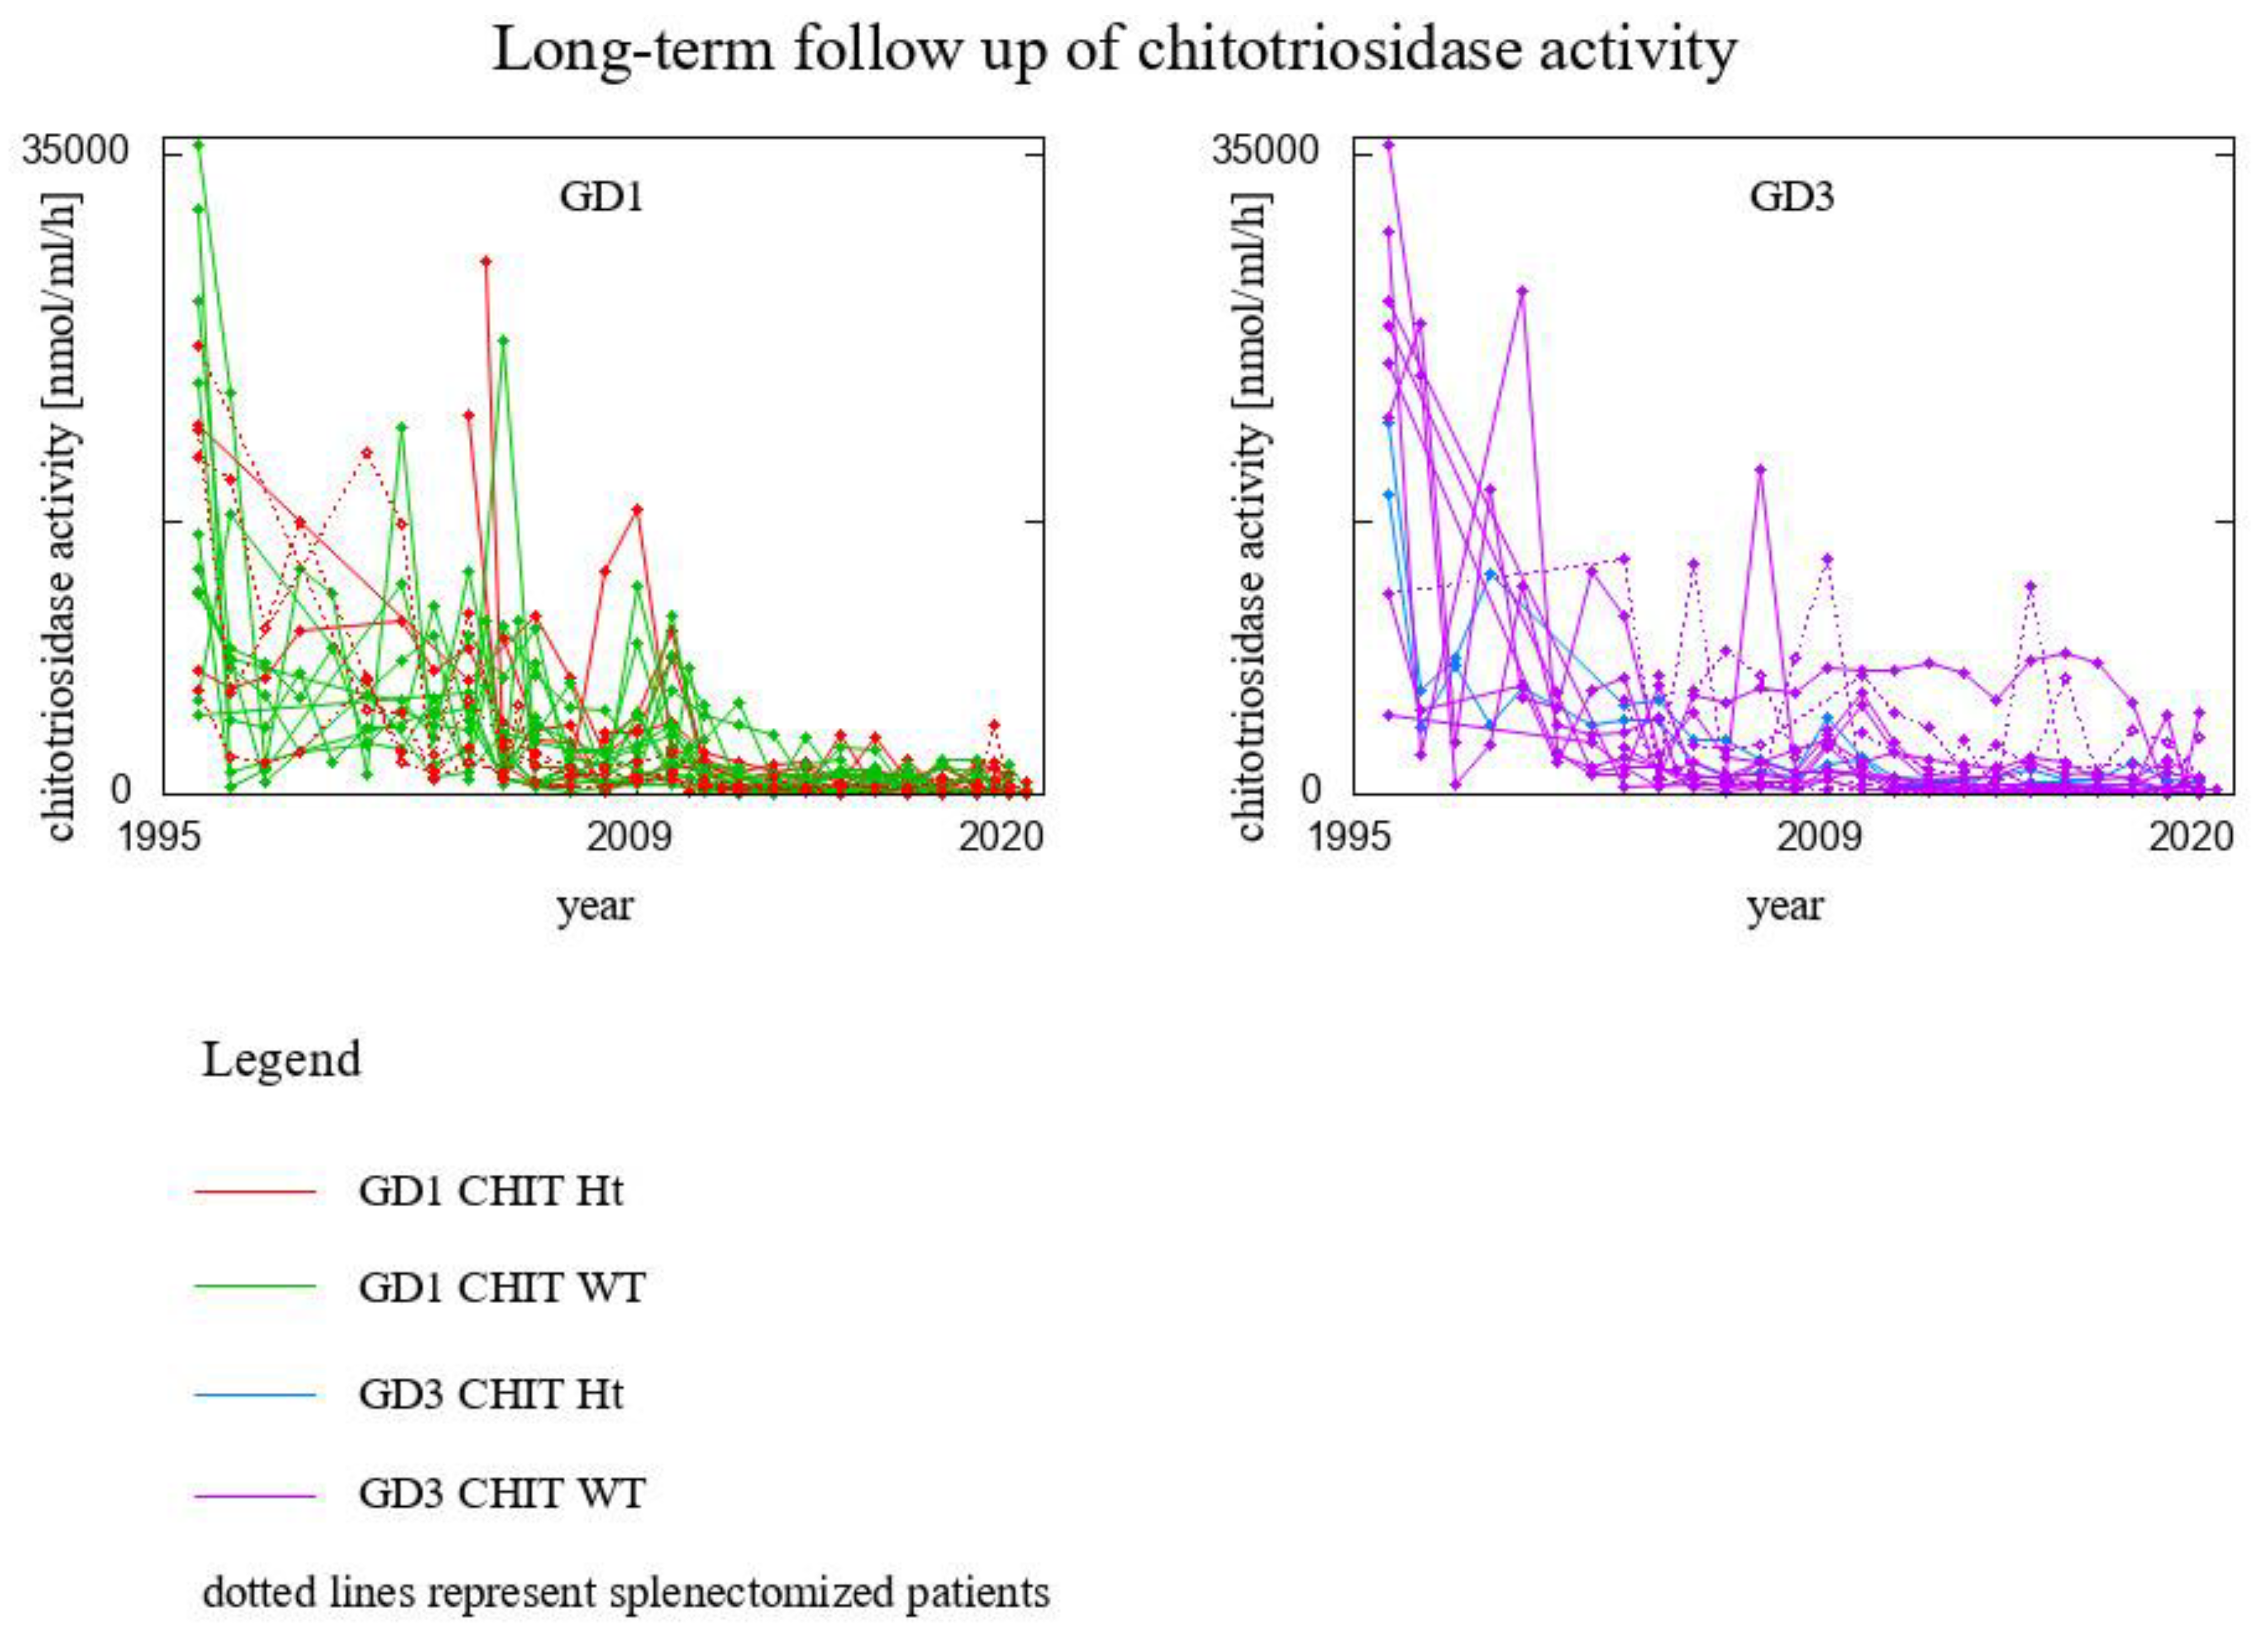
- 8 GD1 patients CHIT1 24 bp-dup Ht (2 of them splenectomised)
- 20 GD1 patients CHIT1 WT (2 of them splenectomised)
- 2 GD3 patients CHIT1 24 bp-dup Ht
- 16 GD3 patients CHIT1 WT (6 of them splenectomised)
- 6 GD1 patients CHIT1 24 bp-dup Ht
- 18 GD1 patients CHIT1 WT
- 2 GD3 patients CHIT1 24 bp-dup Ht
- 12 GD3 patients CHIT1 WT
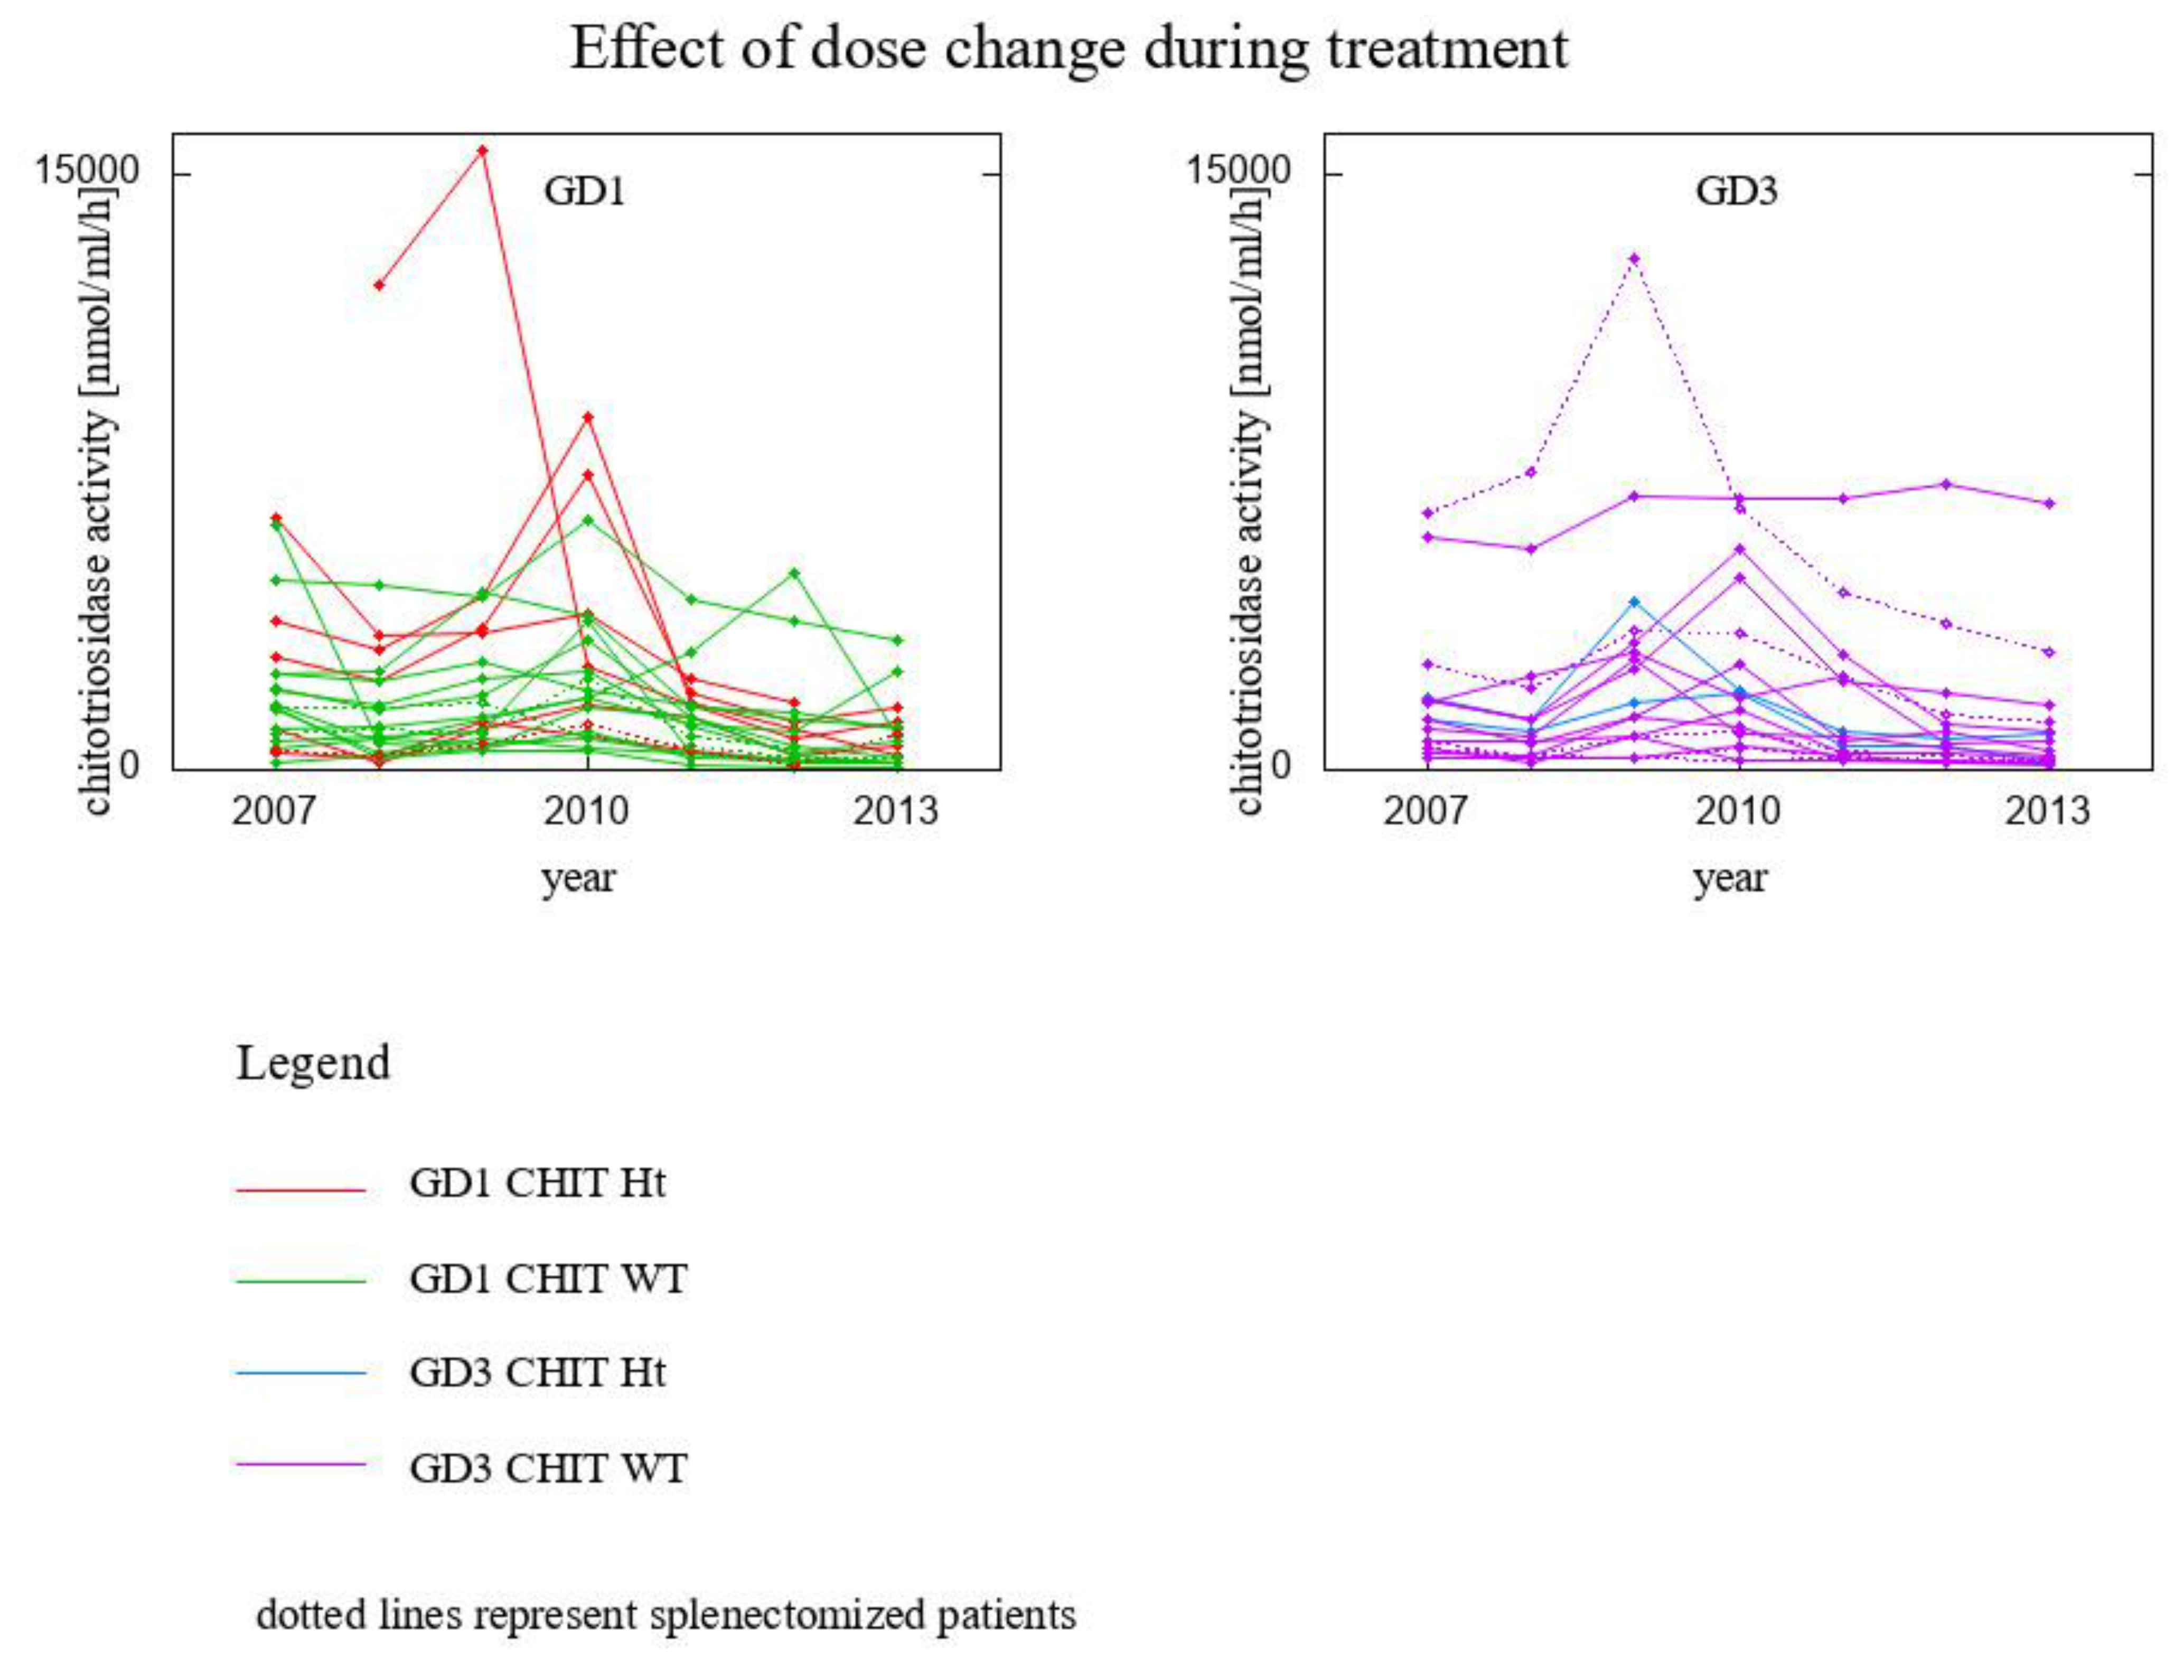
- 3 GD1 patients CHIT1 24 bp-dup Ht (1 of them splenectomised)
- 13 GD1 patients CHIT1 WT (1 of them spelnectomised)
- 10 GD3 patients CHIT1 WT (3 of them splenectomised)
- 7 GD1 patients CHIT1 24 bp-dup Ht (1 of them splenectomised)
- 15 GD1 patients CHIT1 WT (2 of then splenectomised)
- 2 GD3 patients CHIT1 24 bp-dup Ht
- 14 GD3 patients CHIT1 WT (5 of them splenectomised)
4. Discussion
5. Conclusions
Supplementary Materials
Author Contributions
Funding
Institutional Review Board Statement
Informed Consent Statement
Data Availability Statement
Acknowledgments
Conflicts of Interest
References
- Grabowski, G.A.; Petsko, G.A.; Kolodny, E.H. Gaucher Disease. In The Online Metabolic and Molecular Bases of Inherited Disease; Valle, D.L., Antonarakis, S., Ballabio, A., Beaudet, A.L., Mitchell, G.A., Eds.; McGraw Hill: New York, NY, USA, 2019; Available online: https://ommbid.mhmedical.com/content.aspx?bookid=2709§ionid=225546056 (accessed on 23 December 2022).
- Hollak, C.E.; van Weely, S.; van Oers, M.H.; Aerts, J.M. Marked elevation of plasma chitotriosidase activity: A novel hallmark of Gaucher disease. J. Clin. Investig. 1994, 93, 1288–1292. [Google Scholar] [CrossRef] [PubMed]
- Guo, Y.; He, W.; Boer, A.M.; Wevers, R.A.; de Bruijn, A.M.; Groener, J.E.; Hollak, C.E.; Aerts, J.M.; Galjaard, H.; van Diggelen, O.P. Elevated plasma chitotriosidase activity in various lysosomal storage disorders. J. Inherit. Metab. Dis. 1995, 18, 717–722. [Google Scholar] [CrossRef] [PubMed]
- Aerts, J.M.; Hollak, C.E.; van Breemen, M.; Maas, M.; Groener, J.E.; Boot, R.G. Identification and use of biomarkers in Gaucher disease and other lysosomal storage diseases. Acta Paediatr. Suppl. 2005, 94, 43–46. [Google Scholar] [CrossRef] [PubMed]
- Aerts, J.M.; Kallemeijn, W.W.; Wegdam, W.; Joao Ferraz, M.; van Breemen, M.J.; Dekker, N.; Kramer, G.; Poorthuis, B.J.; Groener, J.E.; Cox-Brinkman, J.; et al. Biomarkers in the diagnosis of lysosomal storage disorders: Proteins, lipids, and inhibodies. J. Inherit. Metab. Dis. 2011, 34, 605–619. [Google Scholar] [CrossRef]
- Grabowski, G.A. Phenotype, diagnosis, and treatment of Gaucher’s disease. Lancet 2008, 372, 1263–1271. [Google Scholar] [CrossRef]
- Qi, X.; Grabowski, G.A. Molecular and cell biology of acid beta-glucosidase and prosaposin. Prog. Nucleic Acid. Res. Mol. Biol. 2001, 66, 203–239. [Google Scholar]
- Czartoryska, B.; Tylki-Szymańska, A.; Górska, D. Serum chitotriosidase activity in Gaucher patients on enzyme replacement therapy (ERT). Clin. Biochem. 1998, 31, 417–420. [Google Scholar] [CrossRef]
- Czartoryska, B.; Tylki-Szymańska, A.; Lugowska, A. Changes in serum chitotriosidase activity with cessation of replacement enzyme (cerebrosidase) administration in Gaucher disease. Clin. Biochem. 2000, 33, 147–149. [Google Scholar] [CrossRef]
- Schoonhoven, A.; Rudensky, B.; Elstein, D.; Zimran, A.; Hollak, C.E.; Groener, J.E.; Aerts, J.M. Monitoring of Gaucher patients with a novel chitotriosidase assay. Clin. Chim. Acta 2007, 381, 136–139. [Google Scholar] [CrossRef]
- Van Dussen, L.; Hendriks, E.J.; Groener, J.E.; Boot, R.G.; Hollak, C.E.; Aerts, J.M. Value of plasma chitotriosidase to assess non-neuronopathic Gaucher disease severity and progression in the era of enzyme replacement therapy. J. Inherit. Metab. Dis. 2014, 37, 991–1001. [Google Scholar] [CrossRef]
- Vigan, M.; Stirnemann, J.; Caillaud, C.; Froissart, R.; Boutten, A.; Fantin, B.; Belmatoug, N.; Mentré, F. Modeling changes in biomarkers in Gaucher disease patients receiving enzyme replacement therapy using a pathophysiological model. Orphanet. J. Rare Dis. 2014, 9, 95. [Google Scholar] [CrossRef] [PubMed]
- Raskovalova, T.; Deegan, P.B.; Mistry, P.K.; Pavlova, E.; Yang, R.; Zimran, A.; Berger, J.; Bourgne, C.; Pereira, B.; Labarère, J.; et al. Accuracy of chitotriosidase activity and CCL18 concentration in assessing type I Gaucher disease severity. A systematic review with meta-analysis of individual participant data. Haematologica 2021, 106, 437–445. [Google Scholar] [CrossRef] [PubMed]
- Boot, R.G.; Renkema, G.H.; Verhoek, M.; Strijland, A.; Bliek, J.; De Meulemeester, T.M.; Mannens, M.M.; Aerts, J.M. The human chitotriosidase gene: Nature of inherited enzyme deficiency. J. Biol. Chem. 1998, 273, 25680–25685. [Google Scholar] [CrossRef] [PubMed]
- Deegan, P.B.; Moran, M.T.; McFarlane, I.; Schofield, J.P.; Boot, R.G.; Aerts, J.M.; Cox, T.M. Clinical evaluation of chemokine and enzymatic biomarkers of Gaucher disease. Blood Cells Mol. Dis. 2005, 35, 259–267. [Google Scholar] [CrossRef]
- Drugan, C.; Drugan, T.C.; Grigorescu-Sido, P.; Naşcu, I. Modelling long-term evolution of chitotriosidase in non-neuronopathic Gaucher disease. Scand. J. Clin. Lab. Investig. 2017, 77, 275–282. [Google Scholar] [CrossRef]
- Hollak, C.E.; vom Dahl, S.; Aerts, J.M.; Belmatoug, N.; Bembi, B.; Cohen, Y.; Collin-Histed, T.; Deegan, P.; van Dussen, L.; Giraldo, P.; et al. Force majeure: Therapeutic measures in response to restricted supply of imiglucerase (Cerezyme) for patients with Gaucher disease. Blood Cells Mol. Dis. 2010, 44, 41–47. [Google Scholar] [CrossRef]
- Deroma, L.; Sechi, A.; Dardis, A.; Macor, D.; Liva, G.; Ciana, G.; Bembi, B. Did the temporary shortage in supply of imiglucerase have clinical consequences? Retrospective observational study on 34 Italian Gaucher type I patients. JIMD Rep. 2013, 7, 117–122. [Google Scholar]
- Giraldo, P.; Irún, P.; Alfonso, P.; Dalmau, J.; Fernández-Galán, M.A.; Figueredo, A.; Hernández-Rivas, J.M.; Julia, A.; Luño, E.; Marín-Jimenez, F.; et al. Evaluation of Spanish Gaucher disease patients after a 6-month imiglucerase shortage. Blood Cells Mol. Dis. 2011, 46, 115–118. [Google Scholar] [CrossRef]
- Deegan, P.B.; Cox, T.M. Imiglucerase in the treatment of Gaucher disease: A history and perspective. Drug Des. Devel. Ther. 2012, 6, 81–106. [Google Scholar]
- Machaczka, M.; Kämpe Björkvall, C.; Wieremiejczyk, J.; Paucar Arce, M.; Myhr-Eriksson, K.; Klimkowska, M.; Hägglund, H.; Svenningsson, P. Impact of imiglucerase supply shortage on clinical and laboratory parameters in Norrbottnian patients with Gaucher disease type 3. Arch. Immunol. Ther. Exp. 2015, 63, 65–71. [Google Scholar] [CrossRef]
- Poorthuis, B.J.H.M.; Aerts, J.M.F.G. Glycosphingolipids. In Laboratory Guide to the Methods in Biochemical Genetics; Blau, N., Duran, M., Gibson, K.M., Eds.; Springer: Berlin/Heidelberg, Germany, 2008; pp. 362–363. [Google Scholar]
- Tylki-Szymańska, A.; Szymańska-Rożek, P.; Hasiński, P.; Ługowska, A. Plasma chitotriosidase activity versus plasma glucosylsphingosine in wide spectrum of Gaucher disease phenotypes—A statistical insight. Mol. Genet. Metab. 2018, 123, 495–500. [Google Scholar] [CrossRef] [PubMed]


| Genotype for GBA1 Gene/Genotype for CHIT1 Gene | Fitted Exponential Function | Chitotriosidase Activity Half-Life (Months) | Age at Start of ERT (Years) | |
|---|---|---|---|---|
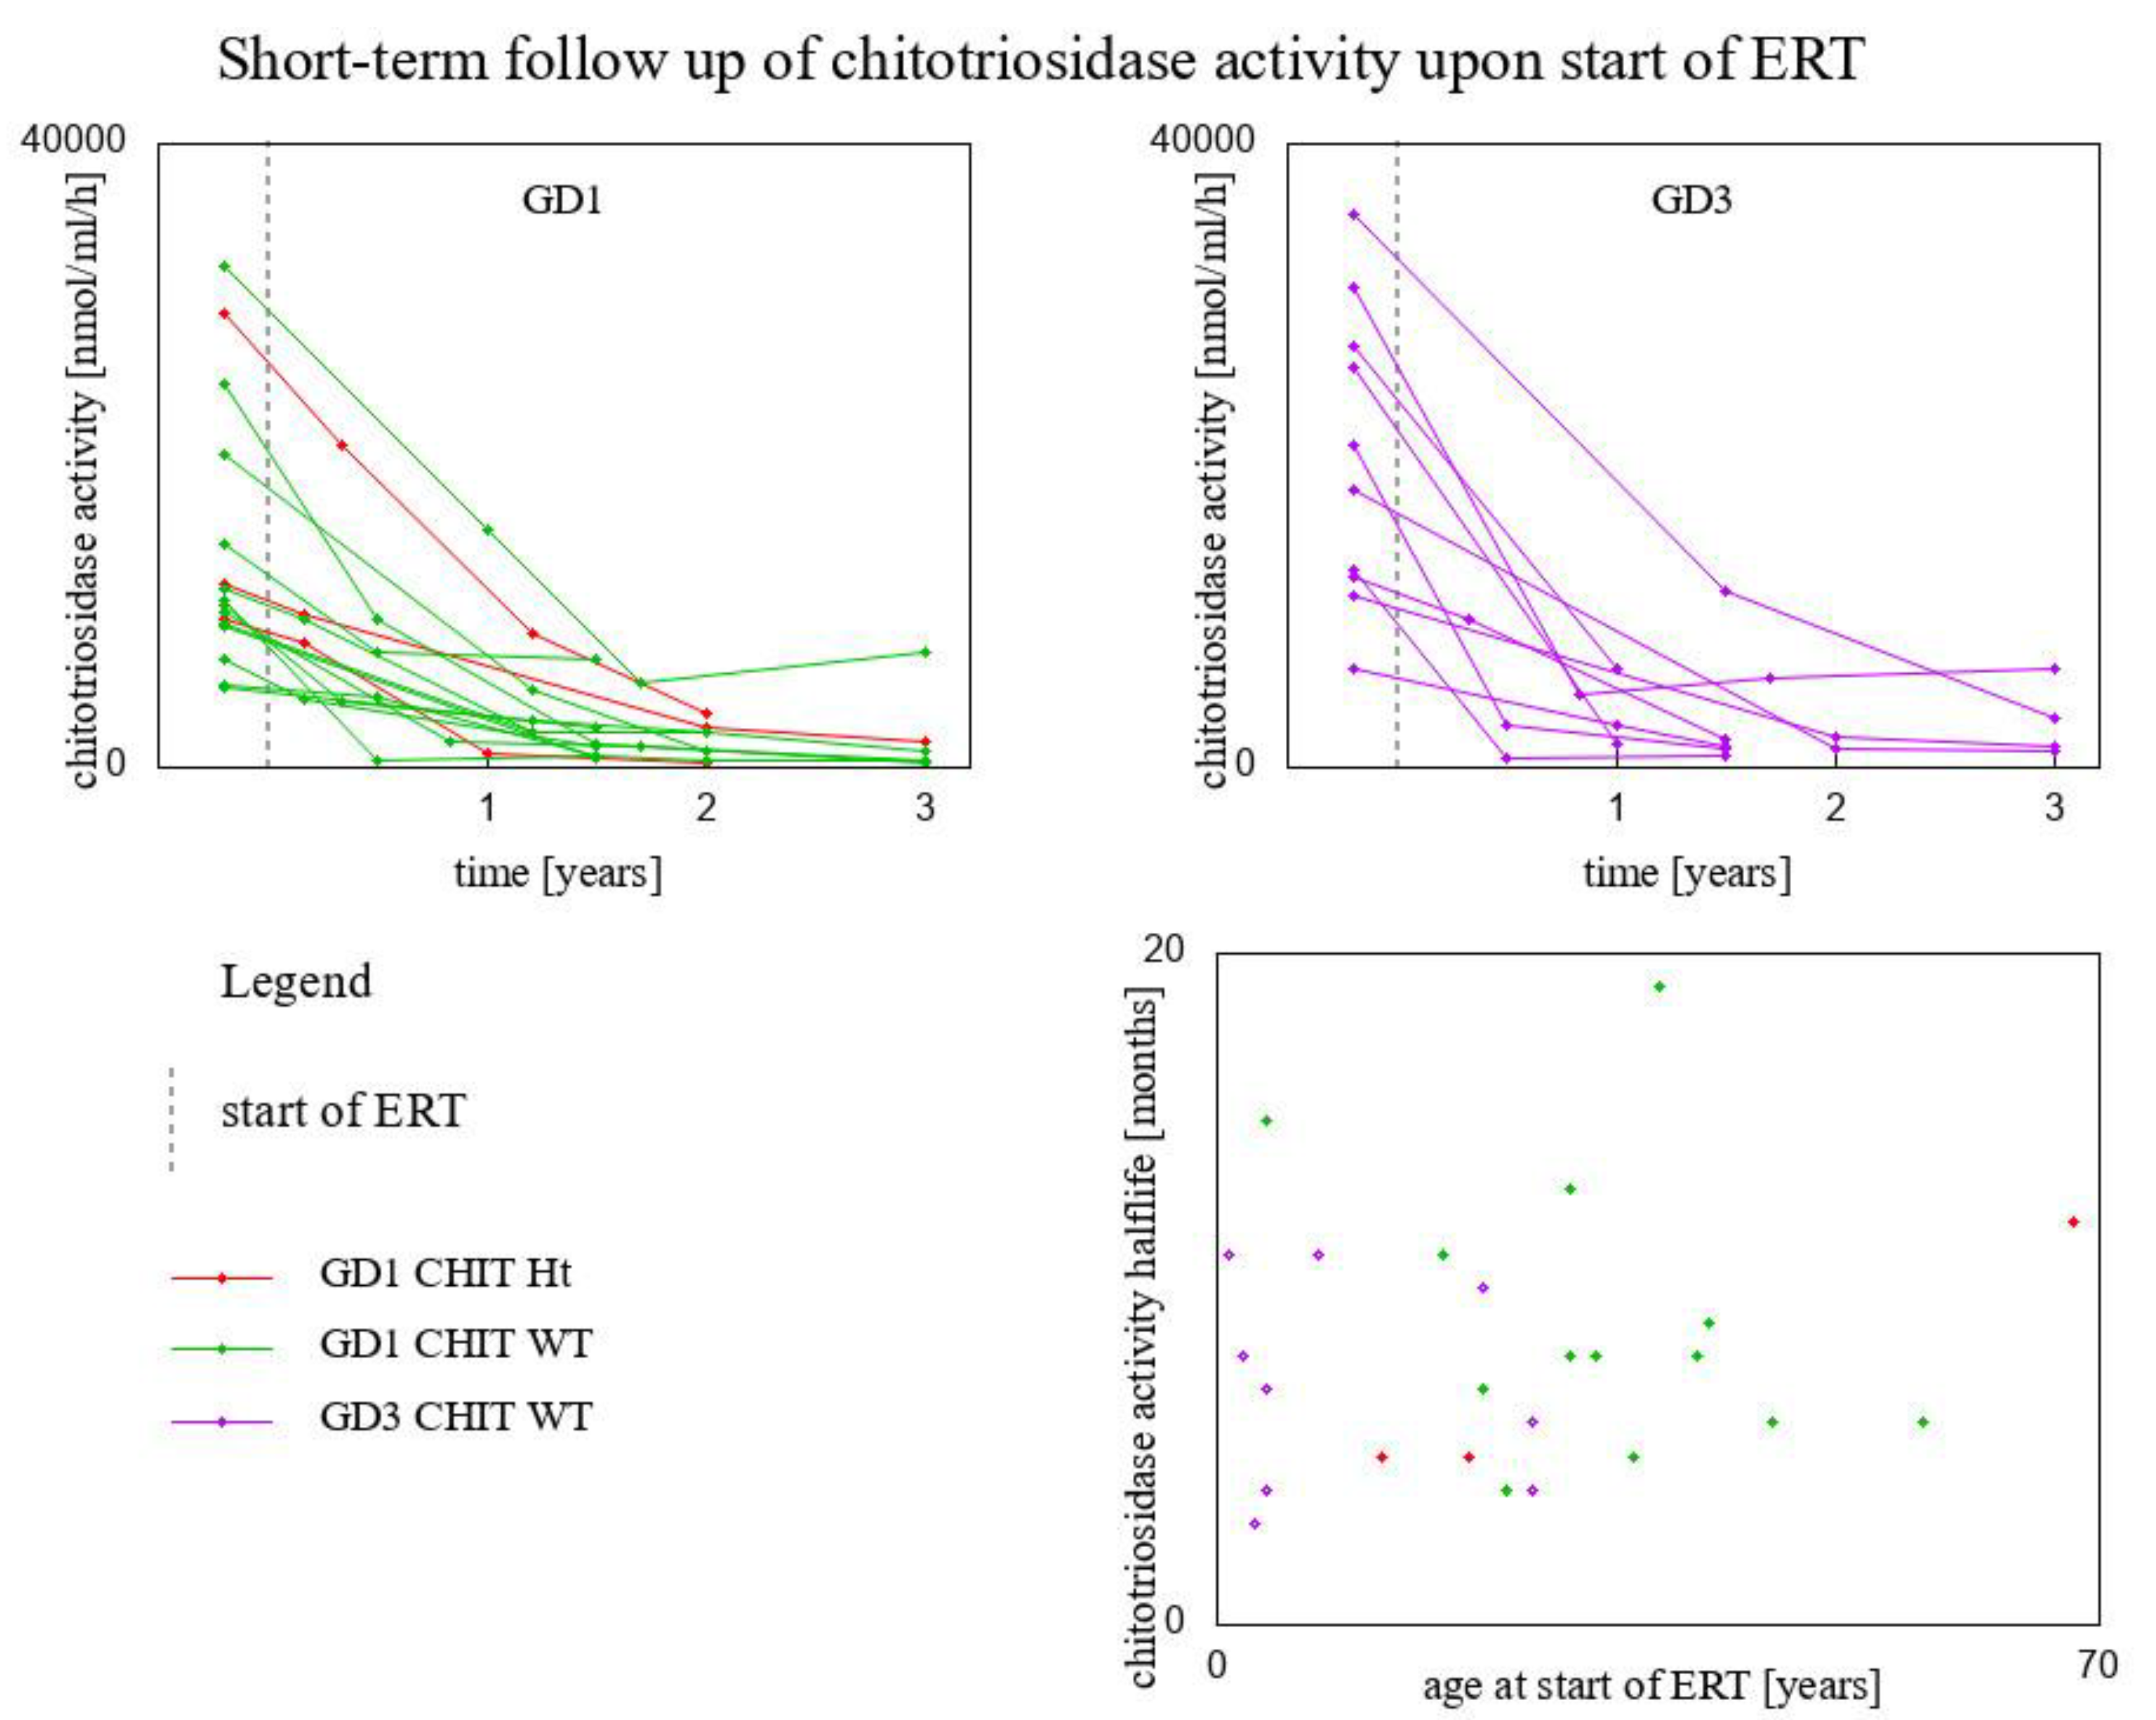
| Type 1 GD/CHIT1 24 bp-dup Ht | y = 2920 × 10−1.061x | 8 | 54 | |
| Type 1 GD/CHIT1 24 bp-dup Ht | y = 9560 × 10−1.779x | 5 | 20 | |
| Type 1 GD/CHIT1 24 bp-dup Ht | y = 11,758 × 10−0.669x | 12 | 68 | |
| Type 1 GD/CHIT1 WT | y = 20,100 × 10−1.803x | 5 | 13 | |
| Type 1 GD/CHIT1 WT | y = 9960× 10−1.226x | 7 | 21 | |
| Type 1 GD/CHIT1 WT | y = 9280 × 10−0.753x | 11 | 18 | |
| Type 1 GD/CHIT1 WT | y = 5292 × 10−0.936x | 9 | 39 | |
| Type 1 GD/CHIT1 WT | y = 10,388 × 10−1.006x | 8 | 28 | |
| Type 1 GD/CHIT1 WT | y = 24,600 × 10−1.466x | 6 | 56 | |
| Type 1 GD/CHIT1 WT | y = 9110 × 10−1.755x | 5 | 33 | |
| Type 1 GD/CHIT1 WT | y = 14,300 × 10−0.564x | 15 | 4 | |
| Type 1 GD/CHIT1 WT | y = 32,100 × 10−0.635x | 13 | 28 | |
| Type 1 GD/CHIT1 WT | y = 10,648 × 10−2.244x | 4 | 23 | |
| Type 1 GD/CHIT1 WT | y = 5180 × 10−0.427x | 19 | 35 | |
| Type 1 GD/CHIT1 WT | y = 11,540 × 10−1.362x | 6 | 44 | |
| Type 1 GD/CHIT1 WT | y = 6872 × 10−1.108x | 8 | 38 | |
| Type 3 GD/CHIT1 WT | y = 6325 × 10−0.968x | 8 | 30 | |
| Type 3 GD/CHIT1 WT | y = 35,500 × 10−0.793x | 10 | 21 | |
| Type 3 GD/CHIT1 WT | y = 12,700 × 10−2.331x | 4 | 25 | |
| Type 3 GD/CHIT1 WT | y = 12,232 × 10−1.257x | 7 | 4 | |
| Type 3 GD/CHIT1 WT | y = 20,633 × 10−2.148x | 4 | 4 | |
| Type 3 GD/CHIT1 WT | y = 30,848 × 10−0.73x | 11 | 1 | |
| Type 3 GD/CHIT1 WT | y = 11,017 × 10−0.734x | 11 | 8 | |
| Type 3 GD/CHIT1 WT | y = 17,770 × 10−1.059x | 8 | 2 | |
| Type 3 GD/CHIT1 WT | y = 27,090 × 10−1.456x | 6 | 25 | |
| Type 3 GD/CHIT1 WT | y = 25,649 × 10−2.844x | 3 | 3 |
Disclaimer/Publisher’s Note: The statements, opinions and data contained in all publications are solely those of the individual author(s) and contributor(s) and not of MDPI and/or the editor(s). MDPI and/or the editor(s) disclaim responsibility for any injury to people or property resulting from any ideas, methods, instructions or products referred to in the content. |
© 2023 by the authors. Licensee MDPI, Basel, Switzerland. This article is an open access article distributed under the terms and conditions of the Creative Commons Attribution (CC BY) license (https://creativecommons.org/licenses/by/4.0/).
Share and Cite
Szymańska-Rożek, P.; Czartoryska, B.; Kleinotiene, G.; Lipiński, P.; Tylki-Szymańska, A.; Ługowska, A. A 20-Year Longitudinal Study of Plasma Chitotriosidase Activity in Treated Gaucher Disease Type 1 and 3 Patients—A Qualitative and Quantitative Approach. Biomolecules 2023, 13, 436. https://doi.org/10.3390/biom13030436
Szymańska-Rożek P, Czartoryska B, Kleinotiene G, Lipiński P, Tylki-Szymańska A, Ługowska A. A 20-Year Longitudinal Study of Plasma Chitotriosidase Activity in Treated Gaucher Disease Type 1 and 3 Patients—A Qualitative and Quantitative Approach. Biomolecules. 2023; 13(3):436. https://doi.org/10.3390/biom13030436
Chicago/Turabian StyleSzymańska-Rożek, Paulina, Barbara Czartoryska, Grazina Kleinotiene, Patryk Lipiński, Anna Tylki-Szymańska, and Agnieszka Ługowska. 2023. "A 20-Year Longitudinal Study of Plasma Chitotriosidase Activity in Treated Gaucher Disease Type 1 and 3 Patients—A Qualitative and Quantitative Approach" Biomolecules 13, no. 3: 436. https://doi.org/10.3390/biom13030436
APA StyleSzymańska-Rożek, P., Czartoryska, B., Kleinotiene, G., Lipiński, P., Tylki-Szymańska, A., & Ługowska, A. (2023). A 20-Year Longitudinal Study of Plasma Chitotriosidase Activity in Treated Gaucher Disease Type 1 and 3 Patients—A Qualitative and Quantitative Approach. Biomolecules, 13(3), 436. https://doi.org/10.3390/biom13030436