Article

EVI2B Is a Prognostic Biomarker and Is Correlated with Monocyte and Macrophage Infiltration in Osteosarcoma Based on an Integrative Analysis

1
Department of Oral and Maxillofacial & Head and Neck Oncology, Shanghai Ninth People’s Hospital, Shanghai Jiao Tong University School of Medicine, Shanghai 200011, China
2
Shanghai Key Laboratory of Stomatology & Shanghai Research Institute of Stomatology, National Clinical Research Center of Stomatology, Shanghai 200011, China
*
Authors to whom correspondence should be addressed.
These authors contributed equally to this work.
Biomolecules 2023, 13(2), 327; https://doi.org/10.3390/biom13020327
Submission received: 16 November 2022 / Revised: 25 January 2023 / Accepted: 3 February 2023 / Published: 8 February 2023
(This article belongs to the Section Bioinformatics and Systems Biology)

Abstract

:
Osteosarcoma (OS) is the most common malignant bone tumor. However, treatment strategies have not changed over the past 30 years. The relationship between OS and the immune microenvironment may provide a basis for the establishment of novel therapeutic targets. In this study, a large-scale gene expression dataset (GSE42352) was used to identify key genes in OS. A Target-OS dataset from the Cancer Genome Atlas was used as a validation set. Ecotropic viral integration site 2B (EVI2B) was significantly upregulated in OS tumor samples. Differentially expressed genes (DEGs) were identified between samples with high and low EVI2B expression in both the test and validation cohorts. The top three functions of DEGs determined by a gene set enrichment analysis (GSEA) were chemokine signaling, cytokine–cytokine receptor interaction, and Human T-cell leukemia virus 1 infection. A prognostic prediction model including EVI2B, DOCK2, and CD33 was constructed by a Cox regression analysis. This model indicated that EVI2B is an independent protective prognostic marker in OS. An analysis of immune infiltration further showed that high EVI2B expression levels were correlated with high levels of macrophage infiltration. Protein expression data derived from the Human Protein Atlas suggested EVI2B to be highly expressed in monocytes. Finally, we validated the elevated expression of EVI2B in OS cell lines and OS tissue samples; these results were consistent with those of the analyses of the GSE42352 and Target-OS datasets. Our integrative bioinformatics analysis and experimental results provide clear evidence for the prognostic value of EVI2B in OS and its close relationship with monocyte and macrophage infiltration.

1. Introduction

Osteosarcoma (OS) is the most common malignant bone tumor. It typically has a bimodal age distribution, with the highest incidence during adolescence, followed by a plateau, and a small peak in elderly individuals [1,2]. OS occurs disproportionately in the metaphysis of long bones, most commonly occurs in the distal femur (43%), proximal tibia (23%), or humerus (10%) [3]. The typical symptoms of OS are local swelling and pain, and the most life-threatening problems are local recurrence and distal metastasis to the lung. Current treatment strategies for OS have been in use since the mid-19th century, including intensive multidrug chemotherapy and surgical resection; these strategies have raised the 5-year survival rates to 60%, with no additional improvement in the past few decades. Patients who have metastatic or recurrent disease have a particularly low 5-year survival rate of below 30% [4,5,6,7].
OS is characterized by significant somatic copy number alterations (SCNA) and structural variation (SV), with few common features between tumors, except for mutations in the tumor suppressors RB1 and TP53 [8]. These characteristics present an extreme challenge with respect to the identification of somatic therapeutic targets for OS. Despite the genomic complexity and intratumor heterogeneity, OS is thought to be targetable and opportunities are emerging to exploit genome-level abnormalities [9,10,11]. Immunotherapy is also thought to have potential applications in OS and many immune-related therapeutic indicators, including PD-1, PD-L1, HER2, IGF2R, CTLA-4, and GD2, are highly expressed in tumor samples [12,13,14,15,16,17,18]. However, the development of new treatment strategies and biomarkers for OS has been hampered by various complications, and clinical translation is still mostly confined to pre-clinical studies [12,16,17,18,19,20]. Therefore, genome-wide analyses are needed to provide new research directions.
With the aim of exploring diagnostic and prognostic factors in OS, we used datasets from the Gene Expression Omnibus (GEO) database (GSE42352) and The Cancer Genome Atlas (TCGA, Target-OS) as test and validation sets. Based on these two datasets, we identified and further characterized EVI2B, a key gene with prognostic and diagnostic value in OS, developed a prediction model, and evaluated associations between gene expression and immune infiltration. The identification and discovery of this new prognostic marker can empower clinical decisions, and has great significance for clinical staging and predicting the outcome of clinical therapies.

2. Materials and Methods

2.1. Data Acquisition and Differentially Expressed Gene Analysis

We found that EVI2B in the GSE42352 dataset was significantly differentially expressed between 15 normal samples and 103 OS samples, suggesting that this gene is a candidate biomarker for diagnosis or prognosis in OS. The samples from 103 patients with OS in GSE42352 were divided into a high-expression group (n = 52) and a low-expression group (n = 51) according to the level of EVI2B (setting the median value as a cut-off). Differentially expressed genes (DEGs) between the high and low EVI2B expression groups were identified using the limma package in R [21]. |log2(Fold Change)| > 1 and adjusted p < 0.05 were set as threshold values for significant DEGs. The DEG results were visualized using the pheatmap and ggplot2 packages in R. The validation cohort was derived from TCGA Target-OS (dataset https://ocg.cancer.gov/programs/target/data-matrix, accessed on 15 July 2021). Applying the same method used for the test set, 101 samples in Target-OS were divided into high expression (n = 51) and low expression (n = 50) groups according to the median EVI2B value.

2.2. Functional Analysis of DEGs

Gene Ontology (GO) terms in the three broad categories BP (biological process), MF (molecular function), and CC (cellular component) were analyzed using the enrichGO function of the clusterProfiler R package [22]. Kyoto Encyclopedia of Genes and Genomes (KEGG) analyses were performed using KOBAS 3.0 (http://kobas.cbi.pku.edu.cn accessed on 15 July 2021). Adjusted p-values (false-discovery rate [FDR]) of less than 0.05 were considered statistically significant. GO and KEGG results were visualized using the ggplot2 package in R. A gene set enrichment analysis (GSEA) was performed to elucidate the functional and pathway differences between the high- and low-EVI2B groups. The GSEA was performed using the clusterProfiler package and results were visualized using the RColorBrewer package in R.

2.3. Protein–Protein Interaction (PPI) Network Analysis

DEGs from GSE42352 were uploaded to STRING (https://string-db.org accessed on 15 July 2021) and a confidence value of greater than 0.4 was set for the PPI network analysis. Cytoscape (version 3.7.2) [23] was used to visualize the network. Molecular complex detection (MCODE) [24] and cytoHubba were applied to screen hub genes in the PPI network.

2.4. ceRNA Network

The limma package was used to obtain differentially expressed lncRNAs in the Target-OS dataset. A list of highly conserved microRNAs that were predicted targets of the lncRNAs was obtained using miRcode (http://www.mircode.org/index.php, accessed on 15 July 2021). Then, mRNA targets of miRNAs were predicted using miRDB (http://www.mirdb.org/cgi-bin/search.cgi, accessed on 15 July 2021), miRTarBase (http://mirtarbase.cuhk.edu.cn, accessed on 15 July 2021) [25], and TargetScan (http://www.targetscan.org, accessed on 15 July 2021) [26]. The intersection between mRNAs obtained from the Target-OS dataset and predicted mRNAs was obtained and used for the construction of a ceRNA network.

2.5. Analysis of Immune Infiltration and Correlations with EVI2B Expression

The CIBERSORT package [27] was used to compare the abundance of 22 kinds of immune cells between the high and low EVI2B expression groups in GSE42352, including different T cells, B cells, plasma cells, natural killer cells, and various myeloid subsets. Correlations between the expression of different immune cells and EVI2B in the two groups were also analyzed. The Wilcoxon rank-sum test and Spearman correlation coefficients were used to evaluate associations between EVI2B expression and immune cells.

2.6. Expression of EVI2B in Different Tissues and Immune Cells

Human Protein Atlas (HPA) (https://www.proteinatlas.org, accessed on 15 July 2021) was used to analyze the protein and mRNA expression levels of EVI2B in different tissues. Three datasets including HPA scaled dataset, Monaco scaled dataset, and Schmiedel dataset in HPA were used to analyze the expression of EVI2B in various immune cells.

2.7. Tissue Samples and Cell Culture

Paired fresh OS tissues and their corresponding adjacent normal tissues were collected from patients at the Ninth People’s Hospital, Shanghai Jiao Tong University School of Medicine. All patients were well informed about the study and provided written informed consent, and the process was approved by the Ethics Committee of the Ninth People’s Hospital, Shanghai Jiao Tong University School of Medicine. The OS cell lines 143B U-2 OS, Saos-2, HOS, MNNG/HOS, SJSA-1, and MG-63 were obtained from the American Type Culture Collection (Manassas, VA, USA). Fibroblast cells were cultured from adjacent normal tissues of patients with OS. All cells were cultured in 90% DMEM (Gibco, Grand Island, NY, USA) supplemented with antibiotics (1 × penicillin/streptomycin 100 U/mL, Gibco) and 10% heat-inactivated fetal bovine serum (FBS; Gibco). The cells were incubated at 37 °C in a humidified and 5% CO2 incubator.

2.8. PCR Analysis

Total RNA was extracted from cells by TRIzol reagent (Invitrogen, Thermo Scientific, Shanghai, China), and RNA was reverse-transcribed into cDNA using the Reverse Transcription Kit (QIAGEN, Valencia, CA, USA). qPCR analyses were performed with SYBR-Green (Takara, Kusatsu, Japan), and the gene expression levels were normalized against the level of GAPDH. The primers for EVI2B were as follows: forward, GTGGACACCTGAACAATACAT; reverse, TTTGTGGGGTTTGTTTGTTAC. The primers for GAPDH were as follows: forward, ATGACATCAAGAAGGTGGTGAAGCAGG; reverse, GCGTCAAAGGTGGAGGAGTGGGT.

2.9. Immunohistochemical Staining

Paraffin-embedded tissues were used for immunohistochemical staining for EVIB2 detection. The slides were dried at 60 °C, dewaxed with methanol, and rehydrated with alcohol. Then, the slides were immersed in 3% hydrogen peroxide and labeled with antibodies overnight. The anti-EVI2B (1:100; NBP1-85342) antibody was purchased from Novus (St. Charles, MO, USA).

2.10. Statistical Analysis

Statistical analyses were performed using R (4.0.2). EVI2B expression was compared between normal and tumor tissues by Wilcoxon rank-sum tests. An ROC curve was generated to evaluate the performance of EVI2B as a diagnostic marker using the pROC package in GSE42352. Univariate and multivariate Cox regression analyses were performed to identify risk biomarkers for OS using the Target datasets. A risk score for each patient was calculated as the sum of the scores for each parameter, obtained by multiplying the value of each biomarker and its coefficient. According to the median risk scores, patients were divided into low- and high-risk groups. Survival analyses, including associations between overall survival and disease-free survival and EVI2B and biomarkers, were performed using the survival package. All statistical analyses were two-sided, and p-values of <0.05 were considered significant.

3. Results

3.1. Identification of Differentially Expressed Genes

The GSE42352 dataset, including 15 normal tissues and 103 OS tissues, was chosen as the test set. EVI2B was significantly upregulated in the OS samples compared with normal tissues (Figure 1A). An ROC analysis revealed that EVI2B can be used as a marker to distinguish tumors from non-tumors in OS (Figure 1B, AUC = 0.860). Then, samples from 103 patients with OS in GSE42352 were divided into high-expression (n = 50) and low-expression groups (n = 51) according to the median EVI2B expression level. In total, 151 DEGs were identified in the comparison between groups (as summarized in a volcano plot and heatmap in Figure 1C,E). In the Target-OS dataset derived from TCGA, chosen as the validation set, 543 DEGs were obtained (Figure 1D,F).

3.2. Functional Cluster Analysis of DEGs in GSE42352

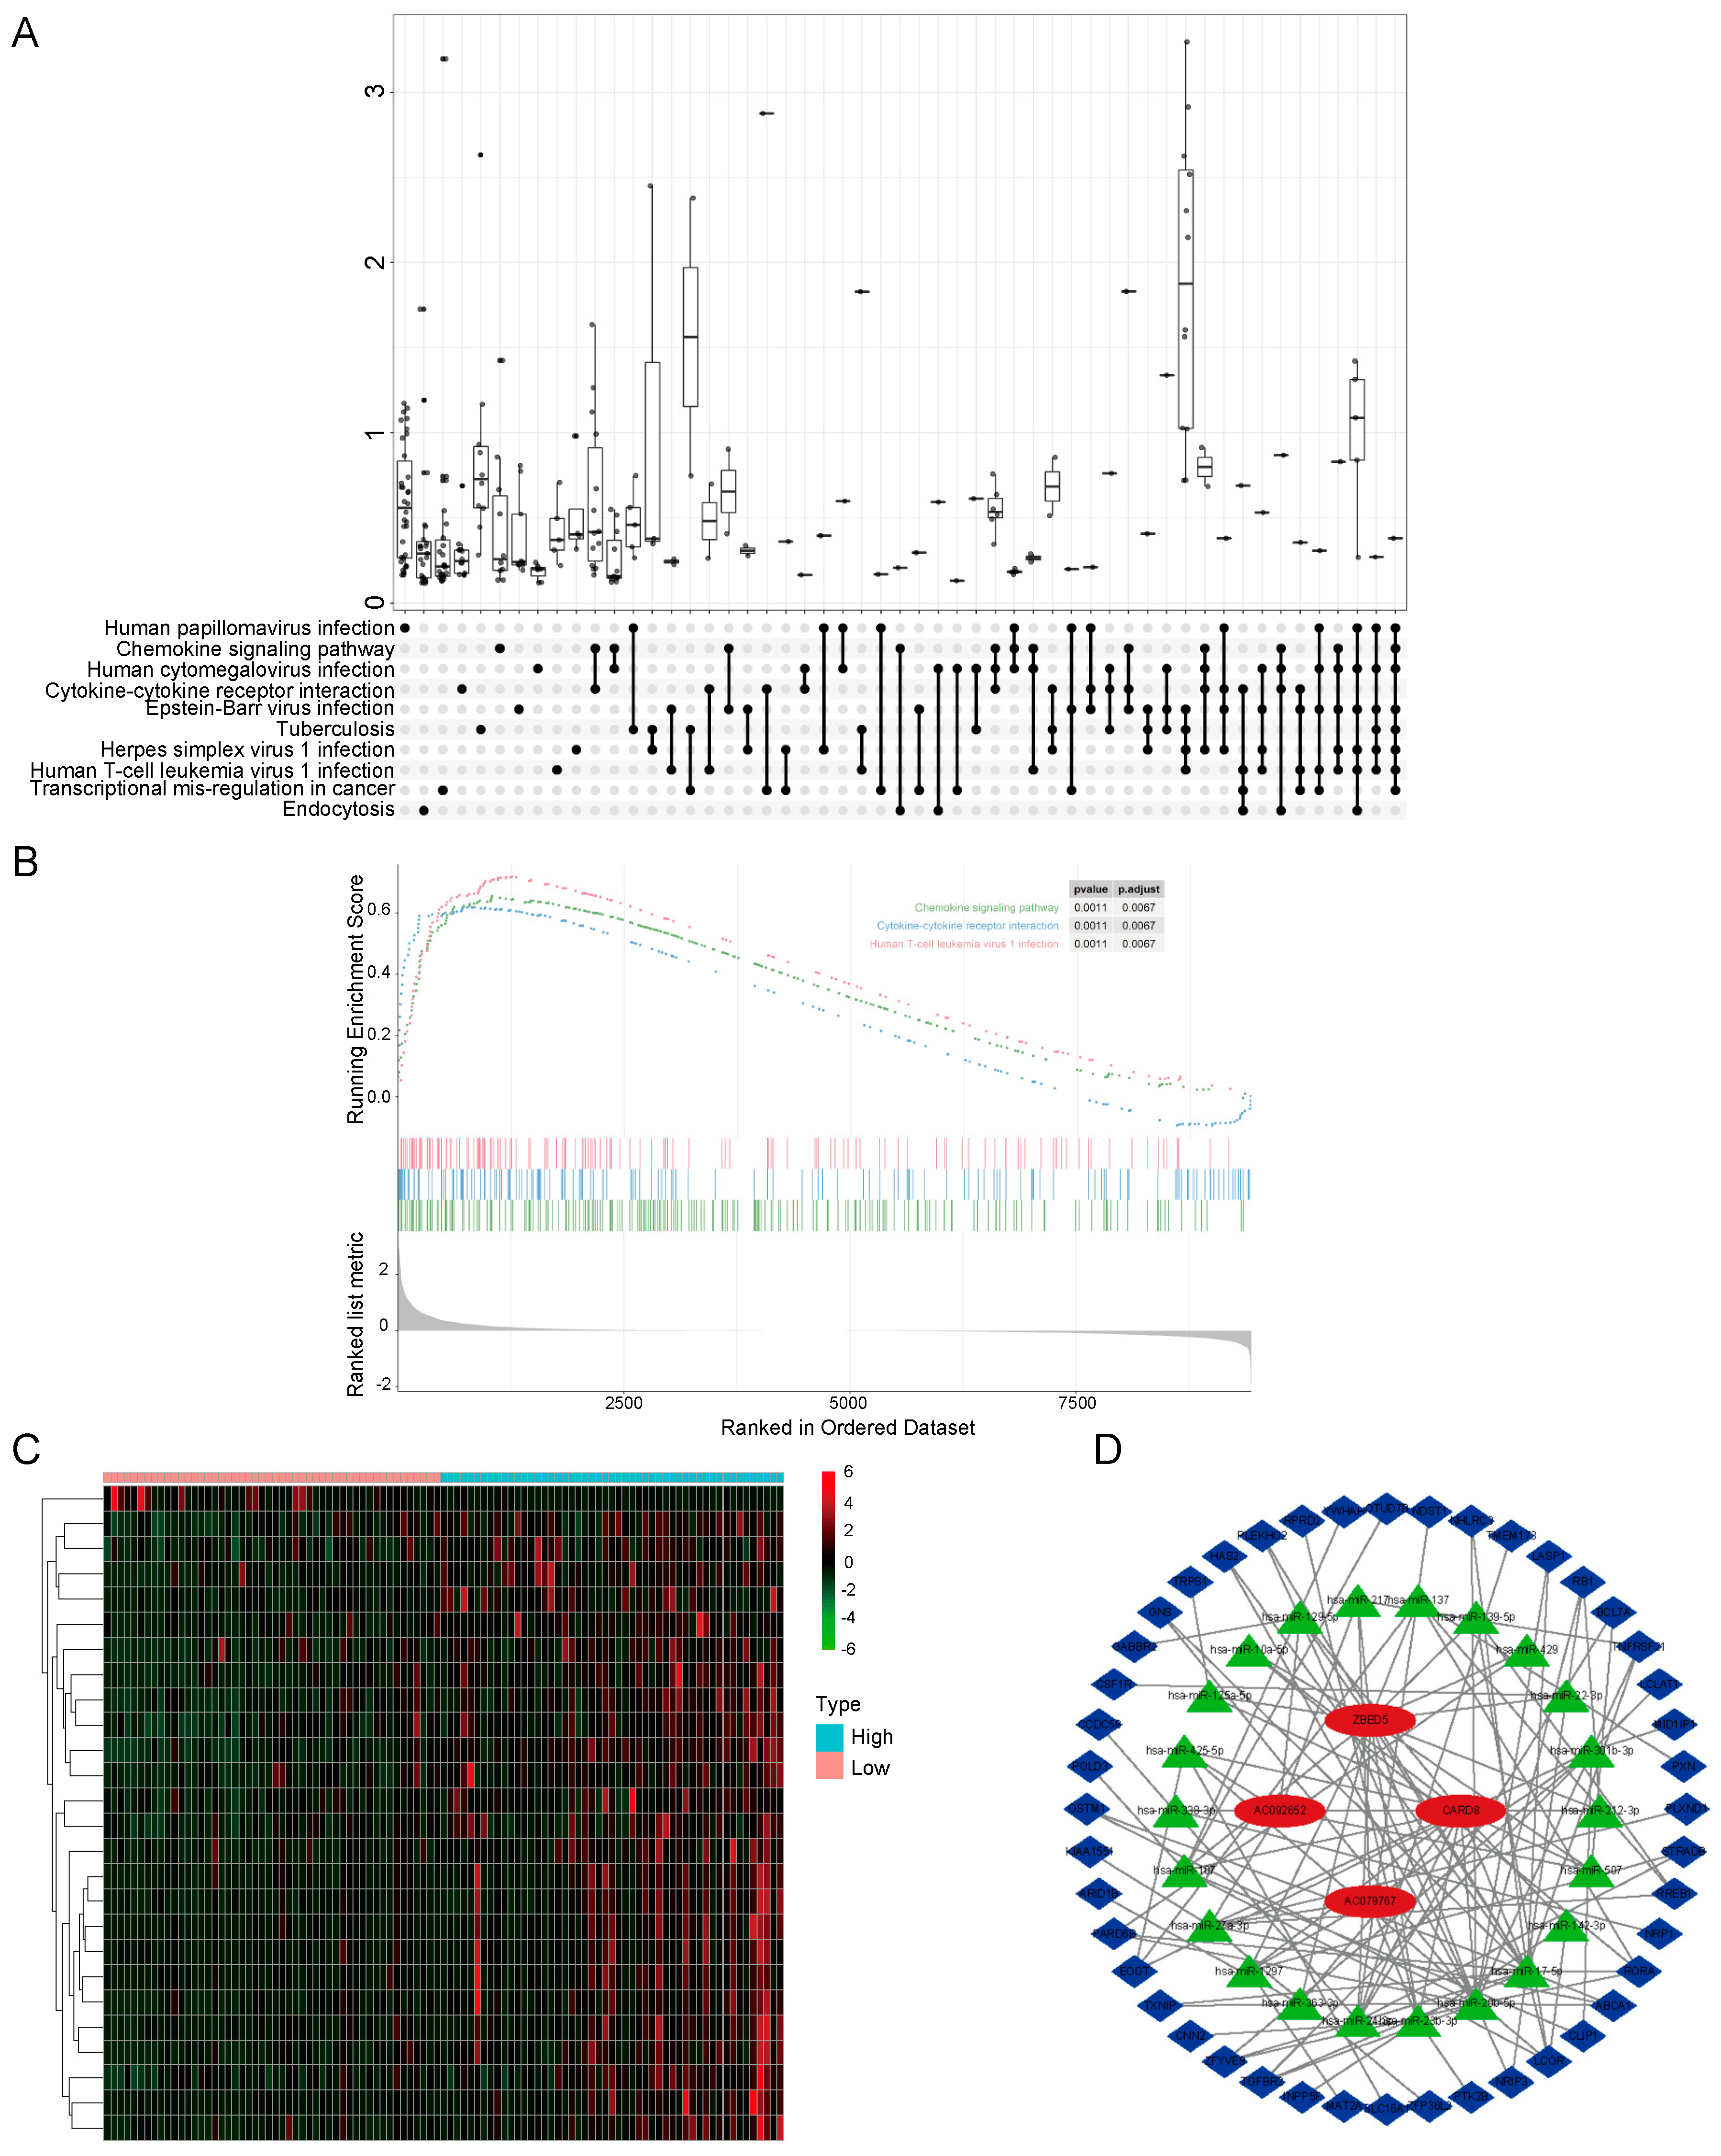
The functions of DEGs in patients with OS were predicted by GO and KEGG enrichment analyses. The top enriched GO terms in the BP, MF, and CC groups were immune response (GO:0006955), peptide antigen binding (GO:0042605), and extracellular exosome (GO:0070062), respectively (Figure S1 and Table S1). A KEGG pathway enrichment analysis using the KOBAS database indicated the DEGs were mainly involved in metabolic pathways, immune-related pathways, such as Th1 and Th2 cell differentiation, Th17 cell differentiation, and cancer-related pathways, such as autophagy, PI3K−Akt, MAPK, and Toll-like receptor signaling pathways (Figure S2 and Table S2). GSEA results are summarized in Figure 2A. The top three pathways were chemokine signaling, cytokine–cytokine receptor interaction, and Human T-cell leukemia virus 1 infection, which are related to the immune response (Figure 2B).

3.3. Construction of a ceRNA Network

In the Target dataset, 26 differentially expressed lncRNAs were found (Table S3) and were visualized by a heatmap (Figure 2C). Additionally, 22 miRNAs predicted to target the lncRNAs were identified using miRcode. miRDB, miRTarBase, and TargetScan were used to predict mRNAs able to interact with the miRNAs. Finally, the intersection of the predicted mRNAs and DEGs in the Targets dataset was obtained, yielding 44 genes. Using these loci, a ceRNA network was constructed (Figure 2D).

3.4. PPI Network Analysis and Identification of Hub Genes

To identify hub genes among the DEGs identified in the GSE42352 dataset, a PPI network was constructed (Figure 3A). Five groups of hub genes were selected using the MCODE function in Cytoscape and the group with the highest value is shown in Figure 3B. We also used the cytoHub function to filter the key genes in the PPI network. The top 20 genes are shown in Figure 3C; these genes were similar to the hub genes obtained using MCODE.

3.5. Prognostic Analysis and Construction of a Prediction Model for Osteosarcoma

Kaplan–Meier curves for overall survival and disease-free survival were plotted to analyze prognosis for patients with different EVI2B expression levels (Figure 4A,B). Log-rank tests revealed that high levels of EVI2B are significantly associated with a better prognosis. We further aimed to develop a gene-signature-based risk model. First, we obtained overlapping DEGs between the GSE42352 and Target datasets, for a total of 64 genes (Figure 4C). A univariate Cox regression analysis was performed using the Target dataset to identify the top ten survival-related genes. Next, multivariate Cox regression analysis was performed to further identify genes with strongest correlations (Table 1). EVIB2, DOCK2, and CD33 were finally selected as prognostic biomarkers. Risk scores were calculated (Figure 4D). As determined by Kaplan–Meier curves for overall survival (Figure 4E), a higher risk score was associated with a poorer prognosis in the Target dataset. In an ROC analysis of the risk model, the AUC value was 0.725, indicating that it had good accuracy for the prediction of prognosis in OS (Figure 4F).

3.6. Correlation between EVI2B and Infiltrating Immune Cells

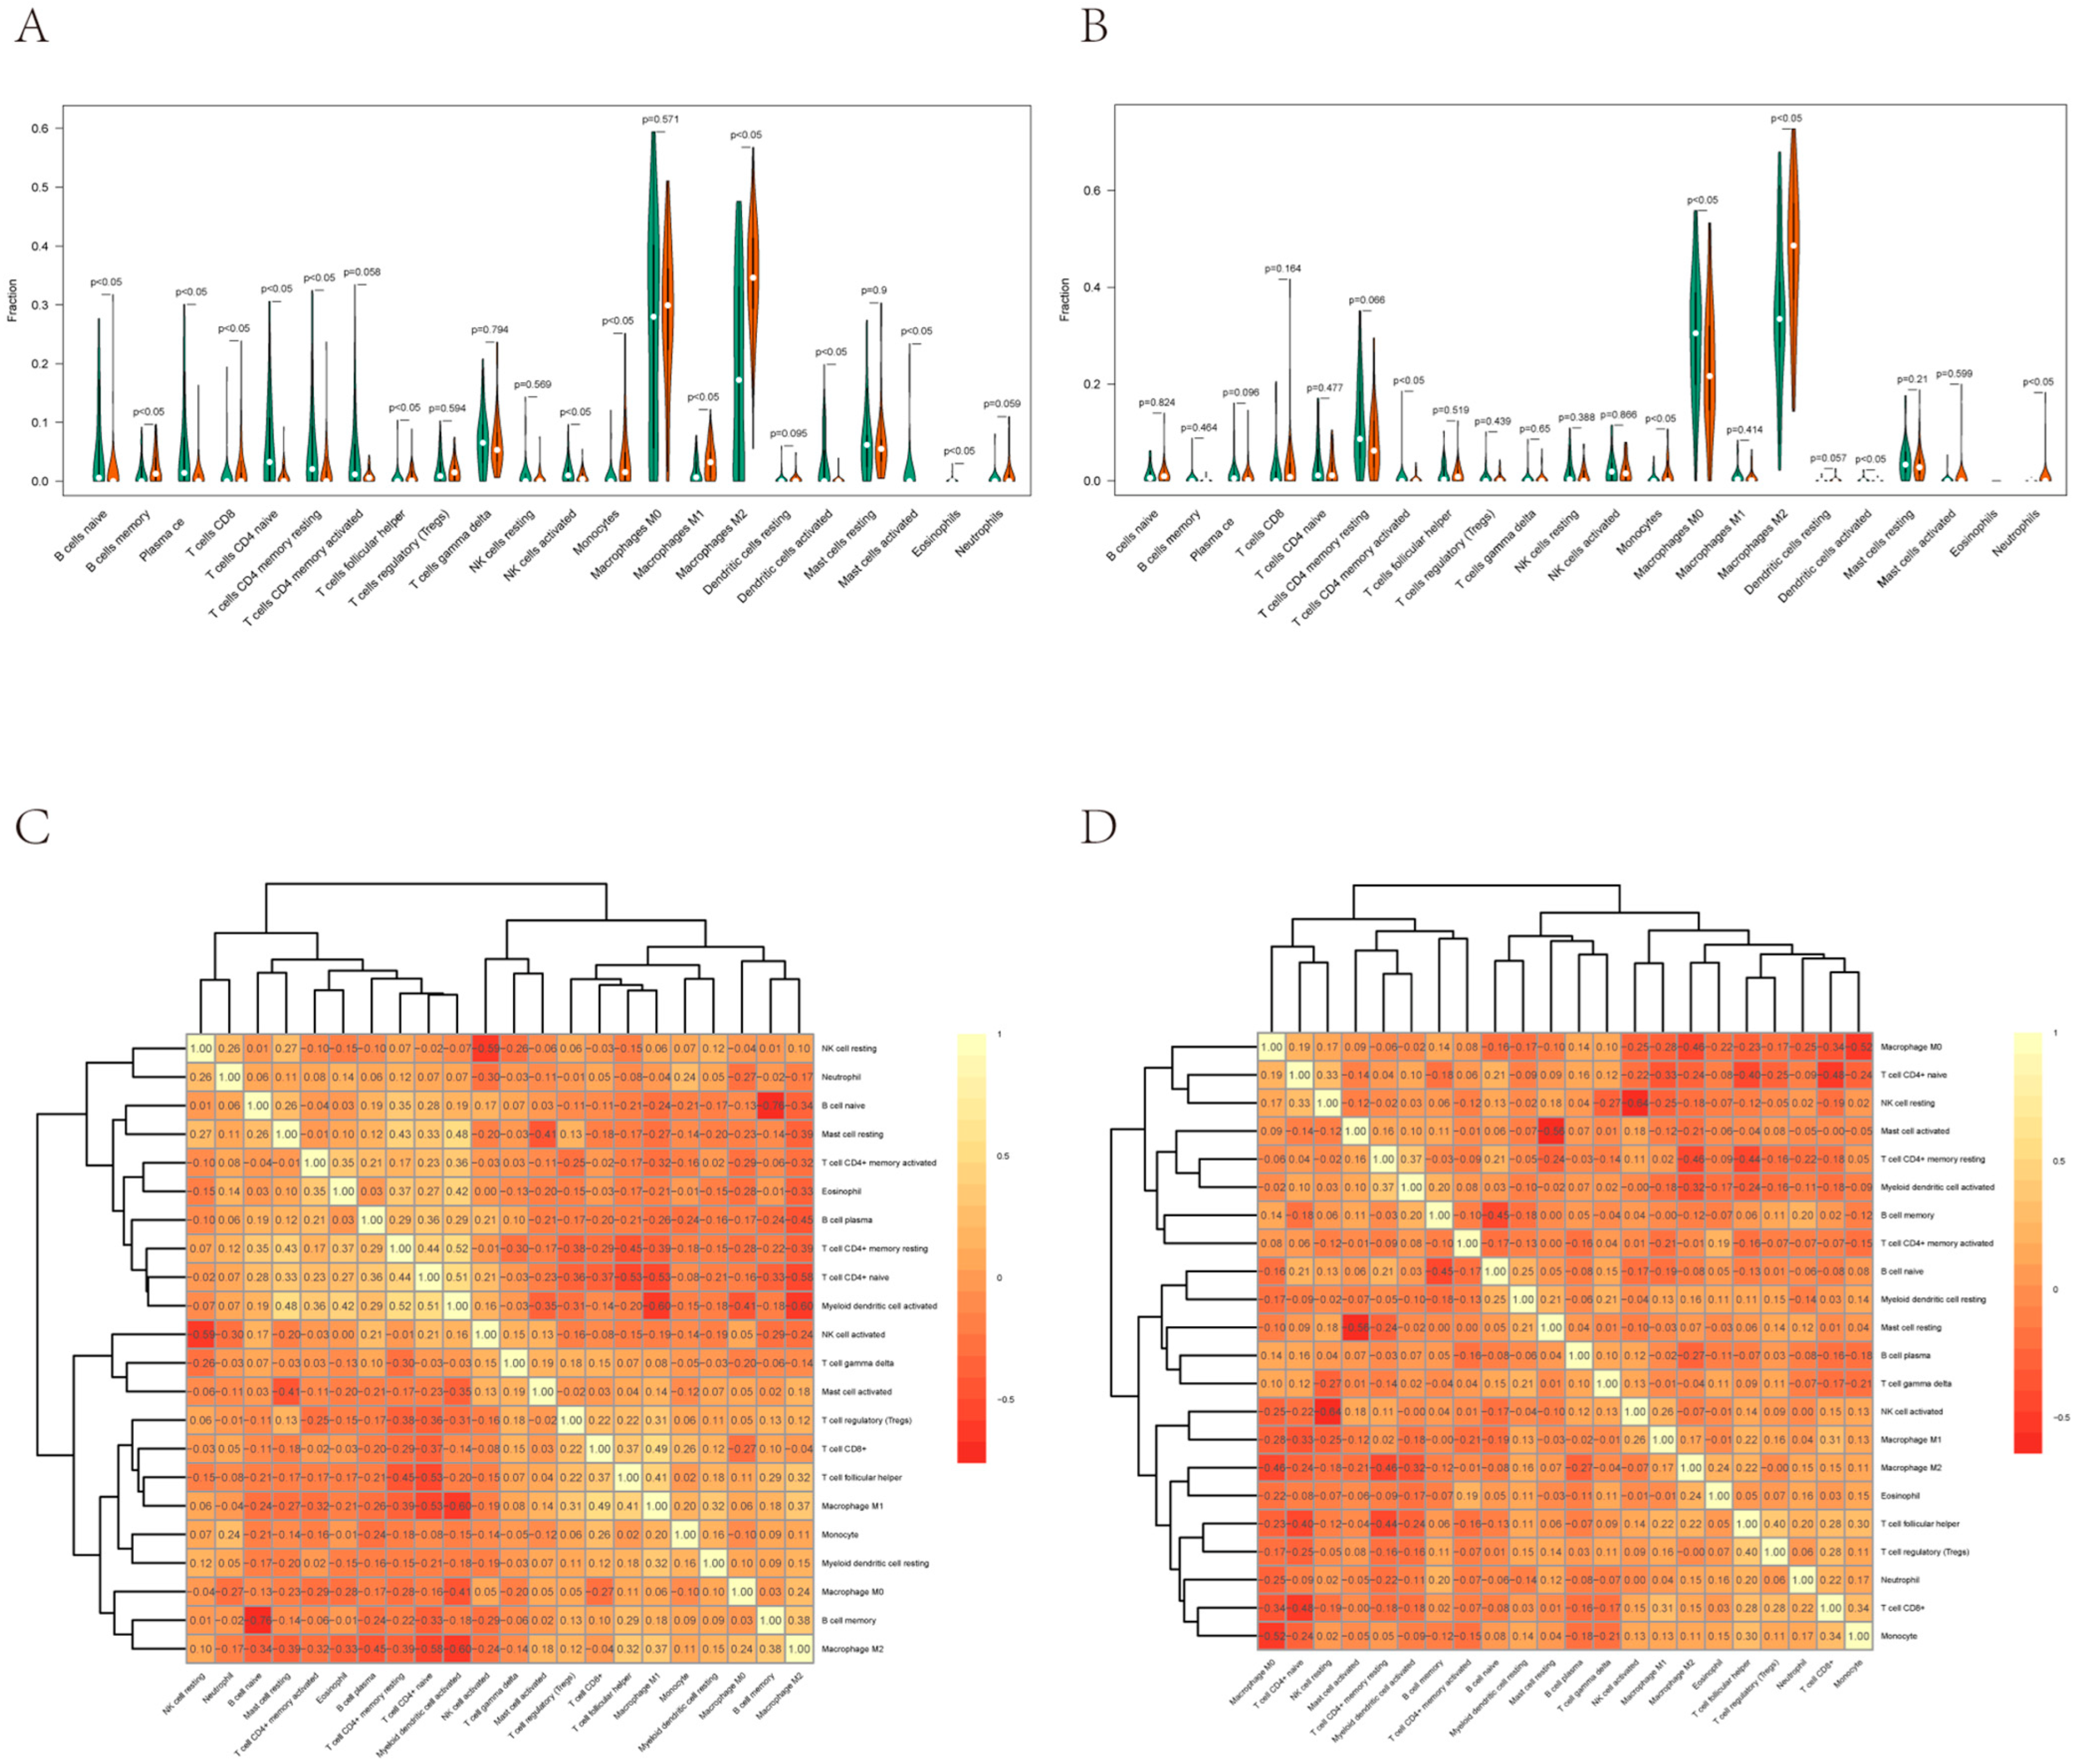
The relative abundances of 22 kinds of immune cells were calculated using CIBERSORT. The levels of several immune cells differed significantly between the groups with high and low EVI2B expression (Figure 5A,B). In these immune cells, M2 macrophages were significantly upregulated in the low-EVI2B-expression group in both datasets. The correlations among immune cell types were visualized in a heatmap (Figure 5C,D). M2 macrophages were negatively correlated with activated dendritic cells and naïve CD4+ T cells (R < −0.5).
Since EVI2B is associated with a low risk for OS and may play a key role in the immune microenvironment in this cancer, we further investigated the relationship between immune cells and prognosis in 47 samples with low EVIB2 expression. M0 macrophages, activated myeloid dendritic cells, CD4+ memory activated T cells, neutrophils, monocytes, and M2 macrophages were selected based on their significant differences between groups with low and high EVI2B expression. Samples were divided into high and low groups according to the infiltration abundance score calculated using CIBERSORT. Although the difference was not statistically significant (owing to the small sample size), a survival difference can be observed in the plots (Figure S3). Further studies with larger sample sizes are required to validate this finding.

3.7. EVI2B Expression in Immune Cells

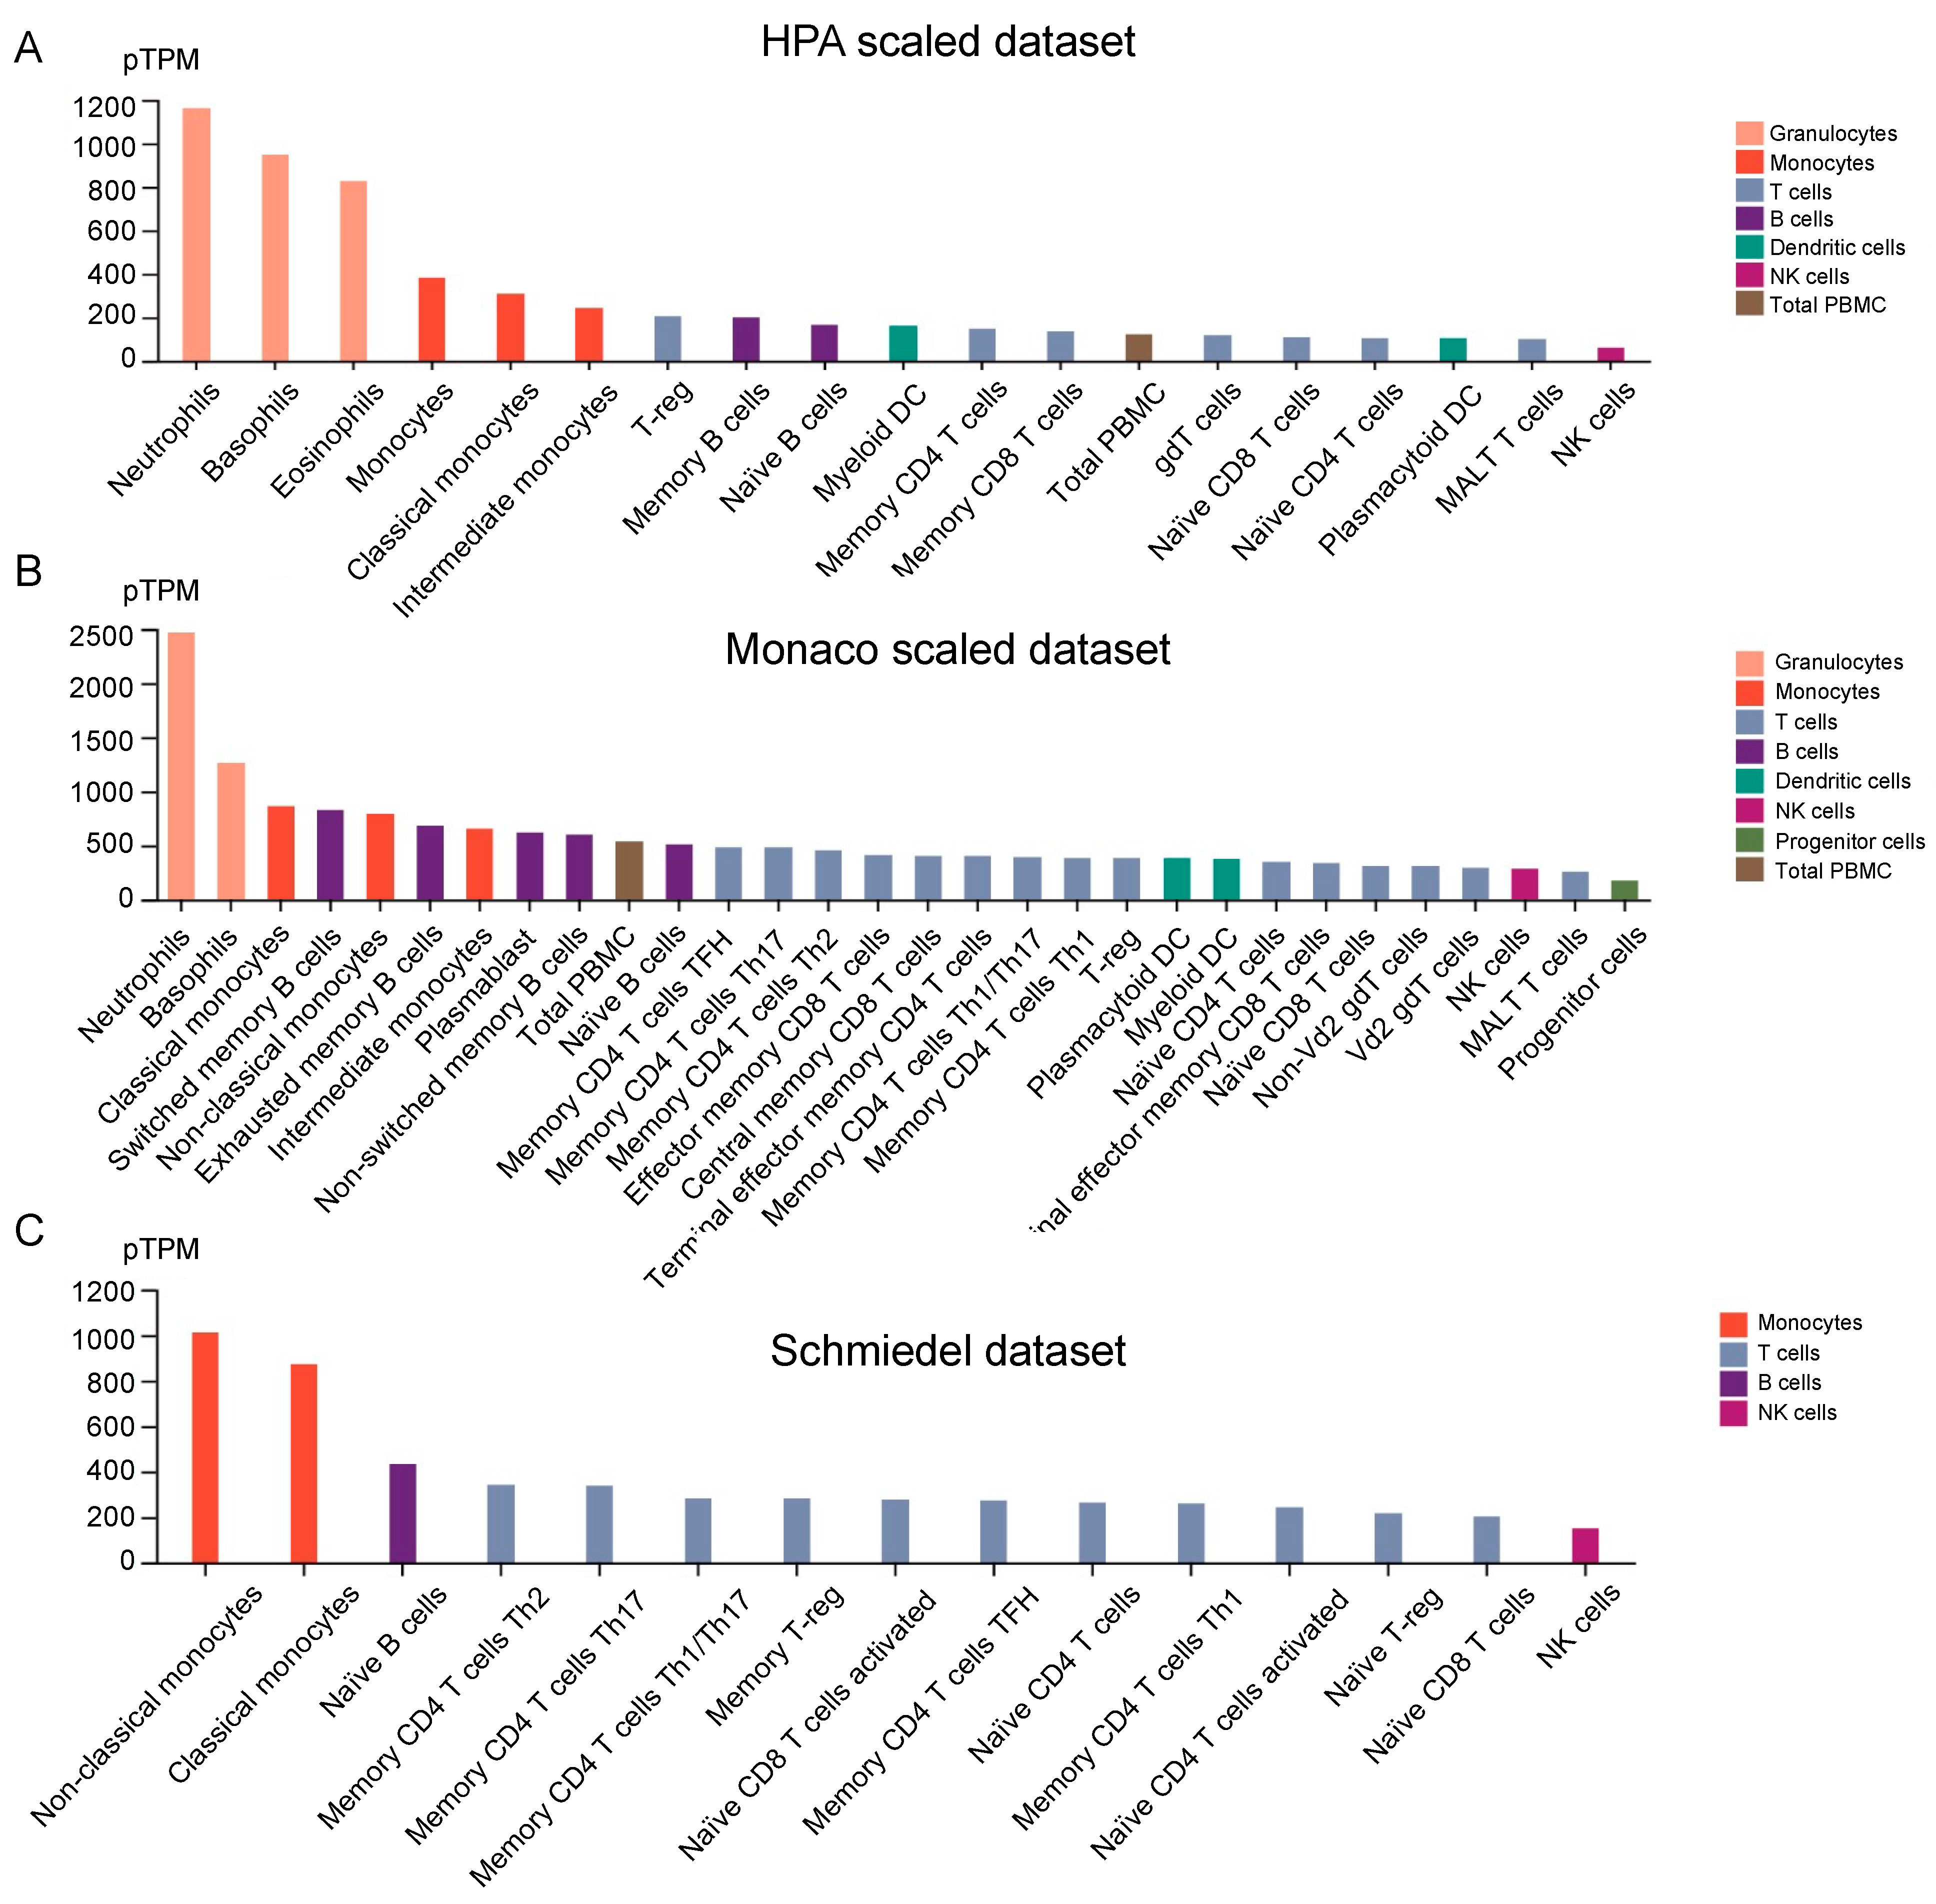
We used three datasets in HPA to analyze the expression of EVI2B in different immune cells (Figure 6A–C) and different tissues (Figure S4). EVI2B was highly expressed in monocytes, especially in neutrophils.

3.8. EVI2B Is Upregulated in Osteosarcoma Cell Lines and Tissues

Six cell lines and five jaw osteosarcoma (JOS) tissue samples were used to investigate the mRNA expression of EVI2B by qPCR. Compared with levels in fibroblast cells, EVI2B expression was remarkably higher in all OS cell lines (Figure 7A). In three of five JOS tissues, the expression of EVI2B was upregulated (Figure 7B). To further explore the protein expression of EVI2B, we collected 27 JOS samples. Immunohistochemical results showed that the protein levels of EVI2B in tumor tissues were higher than those in adjacent normal tissues (Figure 7C,D).

4. Discussion

The most recent major breakthrough in the treatment of OS was reported in the mid-19th century, when the clinical efficacy combination of doxorubicin, cisplatin, and methotrexate was established [5]. Despite tremendous and ongoing efforts, research aimed at the development of new therapeutic strategies for patients with recurrent or metastatic OS has been relatively unproductive. Moreover, biomarkers for diagnosis or stratifying patients for specific therapeutic options are lacking. For the past few years, major advances in next-generation sequencing technology have provided extensive data for research [28,29,30,31]. In view of the difficulty in obtaining and preserving fresh OS samples, high-throughput platforms and databases are particularly promising for the detection of candidate diagnostic indicators and therapeutic targets [32,33,34,35]. We evaluated the GSE42352 GEO dataset, including 103 OS tissue samples, to eliminate heterogeneity. In this dataset, DEGs in OS of were enriched in immune-related signaling pathways, including chemokine signaling, cytokine–cytokine receptor interaction, and Human T-cell leukemia virus 1 infection. EVI2B (Ecotropic viral integration site 2B, CD361) was significantly upregulated in OS samples. We validated the upregulation of EVI2B at both the mRNA and protein levels in cell lines and fresh tumor tissues (using fibroblasts and adjacent normal tissues for comparison), supporting the reliability of our findings. We also constructed a ceRNA network consisting of 44 genes for OS. We then obtained 20 genes from the PPI network based on DEGs expected to contribute to prognosis in OS. Among these genes, EVIB2, DOCK2, and CD33 were finally selected as prognostic biomarkers.
Tumor cells can gain a growth advantage via immune escape. Immunotherapy, a new therapeutic approach, has become one of the five pillars of tumor therapy, along with surgery, cytotoxic chemotherapy, molecularly targeted therapy, and radiation therapy [36]. Preclinical and clinical studies have advanced rapidly in the past few years. However, the lack of therapeutic methods and poor treatment efficacy in patients with recurrent or metastatic OS emphasizes the need for further analyses of the effects of immunotherapy. Many immune-related therapeutic indicators, including PD-1, PD-L1, HER2, IGF2R, CTLA-4, and GD2, are highly expressed in tumor samples [12,13,14,15,16,17,18,37]. However, the efficacy of immunotherapy in patients with unselected OS is limited [38,39,40,41]. The most highly dysregulated gene in our study, EVI2B, encodes a type I transmembrane protein and is embedded in intron 27b of the neurofibromatosis type 1 (NF1) gene; it is transcribed in the opposite direction to that of the NF1 gene [42]. During the Ninth HLDA Workshop (HLDA9), EVI2B was identified as one of eighteen new cell-surface molecules expressed on B cells [43]. Its function is not yet fully understood. EVI2B is a downstream target of CCAAT/enhancer binding protein alpha (C/EBPα), playing an important role in myeloid differentiation and the function of hematopoietic progenitors, thereby contributing to the onset of leukemia, consistent with our findings that the expression of EVI2B was highest in mature granulocytes [44]. Furthermore, some studies in the field of osteoarthritis have demonstrated that some bone marrow mesenchymal stem-cell-derived cells, including neutrophils (EVI2B highly expressed in OS), can affect the differentiation or function of (OBs) or osteoclasts (OCs) [45,46,47]. OCs are considered to be highly specialized macrophages and closely related to the immune microenvironment and immunotherapy. For example, it has been shown that the presence of osteoclasts can affect the cytotoxicity of NK cells and the loss of surface receptors on osteoclasts is correlated with a decreased expansion and function of NK cells [48]. Additionally, PD-1 blockade inhibits bone cancer pain by inhibiting osteoclast formation, partly [49]. In view of the findings of this study and previous research, we speculated the dysregulation of EVI2B on immune cell may alter the bone homeostasis by affecting the generation or function of OBs or OCs, thus affecting the corresponding response to therapy and prognosis. These findings may also explain the poor efficacy of dendritic cell vaccines against OS in clinical trials [40,50,51]. In addition to EVI2B, we also identified DOCK2 and CD33 as prognostic markers for OS; these genes are important for immune regulation [52,53,54]. The discovery of these biomarkers improves our understanding of the immune microenvironment in OS and provides an important basis for the development of future immunotherapy strategies.
However, there were some inevitable limitations of our study. For example, the overexpression of EVI2B is associated with the postoperative recurrence of colorectal cancer [55], differing from the above research findings. Additionally, hemizygosity of genes, including EVI2B in the deleted region around the neurofibromin locus, may contribute to a severe phenotype in patients with NF1 [56]. Although we preliminarily explored the biological process by which EVI2B contributes to OS by an enrichment analysis, the detailed mechanism requires further biomedical experiments. The precise role of this gene in the immune microenvironment and its impact on the response to immunotherapy should be focuses of future research.
Furthermore, considering the obvious intra-tumoral heterogeneity of OS, the lack of multi-locus sampling data within a single tumor sample in these public databases limits the value of the biomarker and prognostic prediction model. Although we confirmed the elevated mRNA expression levels of EVI2B in six OS cell lines compared with levels in fibroblasts by qPCR, this difference was not as clear in the five fresh OS tissues samples. Additionally, the specific genomic characteristics of OS, including SCNV and SV, challenge the utility of the newly established biomarker. Epigenetic abnormalities in tumors were not analyzed. We were also unable to conduct sample sequencing and subsequent bioinformation analyses of a larger cohort for internal validation. Further studies are therefore still warranted.
In conclusion, genomic data for OS obtained from the GEO and TCGA databases were integrated to obtain a system-level view of gene expression profiles. We found that the upregulated hub gene EVI2B and several key immune-related signal pathways are involved in the development of OS and built a prognostic prediction model consisting of EVI2B, DOCK2, and CD33. These findings provide new insights into the genomic underpinnings of the pathogenesis of OS and potential therapeutic targets for immunotherapy.

Supplementary Materials

The following supporting information can be downloaded at: https://www.mdpi.com/article/10.3390/biom13020327/s1, Figure S1 GO enrichment analysis. (A) Bar chart of GO enrichment analysis. The length represents gene enrichment amount and color represents significance. (B) Bubble diagram of GO enrichment analysis. The bubble size represents gene enrichment number and color represents significance. (C–E) GO enrichment analysis was performed on all the DEGs. Top30 enrichment results obtained by GSEA method were, respectively presented in the form of GO enrichment graph (C), bubble graph (D), and heat map (E); Figure S2 KEGG enrichment analysis. (A) Bar chart of KEGG enrichment analysis of KOBAS database. The length represents the number of gene enrichment, and the color increases from blue to red with increasing significance. (B) The bubble diagram of KEGG enrichment analysis in KOBAS database. The bubble size represents the number of gene enrichment, and the color increases from blue to red with increasing significance. (C) Osteoclast differentiation pathway. (D) Cancer-related pathway. (E) MAPK signaling pathway. (F) PI3K-Akt signaling pathway; Figure S3 Survival analysis of immune cells in low EVI2B expression group. (A) Survival analysis of macrophage M0. (B) Survival analysis of dendritic cell activated. (C) Survival analysis of T cell CD4+ memory activated. (D) Survival analysis of neutrophil. (E) Survival analysis of monocyte. (F) Survival analysis of macrophage M2; Figure S4 RNA and protein expression of EVI2B in different tissues. (A) Protein expression level of EVI2B was analyzed in HPA database. (B) RNA expression level of EVI2B was analyzed in HPA database; Table S1. The top ten GO enrichment item of DEGs in GSE42352; Table S2. KEGG enrichment items through KOBAS database of DEGs in GSE42352; Table S3. Differentially expressed lncRNAs in Target-OS samples.

Author Contributions

T.J. and W.C. conceived the project and designed the research. Z.L. carried out the data downloading and analyzing. Z.D. performed the experiments. R.Y. interpreted the data and made the figures. Z.D. and Z.L. wrote the manuscript. The study supervisors are W.C. and T.J. All authors have read and agreed to the published version of the manuscript.

Funding

This work was supported by the National Natural Science Foundation of China (Grant No.81872189 to T. Ji; Grant No.81672745 to W. Cao), Clinical Research Project of Multi-Disciplinary Team, Shanghai Ninth People’s Hospital, Shanghai Jiaotong University School of Medicine (Grant No.201701016 to T. Ji), Construction of oral cancer specific disease cohort database (T. Ji) and Biobank Program of Shanghai Ninth People’s Hospital, Shanghai Jiao Tong University School og Medicine (Grant No. YBKB202213 to T. Ji).

Institutional Review Board Statement

The study was conducted according to the guidelines of the Declaration of Helsinki and the Ethics Committee of Shanghai Ninth People’s Hospital Affiliated to Shanghai Jiao Tong University School of Medicine (protocol code: SH9H-2019-T180-2 and date of approval 29 August 2019).

Informed Consent Statement

Informed consent was obtained from all subjects involved in the study.

Data Availability Statement

The data supporting the findings of this study are available from the corresponding author upon reasonable request.

Acknowledgments

We are grateful to the patients for their valuable participation in this study. We also wish to acknowledge Hanhan Shi for her help in figure editing.

Conflicts of Interest

The authors declare that the research was conducted in the absence of any commercial or financial relationships that could be construed as a potential conflict of interest.

References

  1. Sadykova, L.R.; Ntekim, A.I.; Muyangwa-Semenova, M.; Rutland, C.S.; Jeyapalan, J.N.; Blatt, N.; A Rizvanov, A. Epidemiology and Risk Factors of Osteosarcoma. Cancer Investig. 2020, 38, 259–269. [Google Scholar] [CrossRef]
  2. Mirabello, L.; Troisi, R.J.; Savage, S.A. International osteosarcoma incidence patterns in children and adolescents, middle ages and elderly persons. Int. J. Cancer 2009, 125, 229–234. [Google Scholar] [CrossRef]
  3. Isakoff, M.S.; Bielack, S.S.; Meltzer, P.; Gorlick, R. Osteosarcoma: Current Treatment and a Collaborative Pathway to Success. J. Clin. Oncol. 2015, 33, 3029–3035. [Google Scholar] [CrossRef]
  4. Bernthal, N.M.; Federman, N.; Eilber, F.R.; Nelson, S.D.; Eckardt, J.J.; Eilber, F.C.; Tap, W.D. Long-term results (>25 years) of a randomized, prospective clinical trial evaluating chemotherapy in patients with high-grade, operable osteosarcoma. Cancer 2012, 118, 5888–5893. [Google Scholar] [CrossRef]
  5. Link, M.P.; Goorin, A.M.; Miser, A.W.; Green, A.A.; Pratt, C.B.; Belasco, J.B.; Pritchard, J.; Malpas, J.S.; Baker, A.R.; Kirkpatrick, J.A.; et al. The effect of adjuvant chemotherapy on relapse-free survival in patients with osteo-sarcoma of the extremity. N. Engl. J. Med. 1986, 314, 1600–1606. [Google Scholar] [CrossRef]
  6. Davis, L.E.; Bolejack, V.; Ryan, C.W.; Ganjoo, K.N.; Loggers, E.T.; Chawla, S.; Agulnik, M.; Livingston, M.B.; Reed, D.; Keedy, V.; et al. Randomized Double-Blind Phase II Study of Regorafenib in Patients With Metastatic Osteosarcoma. J. Clin. Oncol. 2019, 37, 1424–1431. [Google Scholar] [CrossRef]
  7. Dirksen, U.; Brennan, B.; Le Deley, M.C.; Cozic, N.; Van Den Berg, H.; Bhadri, V.; Brichard, B.; Claude, L.; Craft, A.; Amler, S.; et al. High-Dose Chemotherapy Compared With Standard Chemotherapy and Lung Radiation in Ewing Sarcoma With Pulmonary Metastases: Results of the European Ewing Tumour Working Initiative of Na-tional Groups, 99 Trial and EWING 2008. J. Clin. Oncol. 2019, 37, 3192–3202. [Google Scholar] [CrossRef]
  8. Sayles, L.C.; Breese, M.R.; Koehne, A.L.; Leung, S.G.; Lee, A.G.; Liu, H.-Y.; Spillinger, A.; Shah, A.T.; Tanasa, B.; Straessler, K.; et al. Genome-Informed Targeted Therapy for Osteosarcoma. Cancer Discov. 2019, 9, 46–63. [Google Scholar] [CrossRef]
  9. Savage, S.A.; Mirabello, L. Bone cancer: Is the osteosarcoma genome targetable? Nat. Rev. Endocrinol. 2017, 13, 506–508. [Google Scholar] [CrossRef]
  10. Cheng, D.-D.; Li, J.; Li, S.-J.; Yang, Q.-C.; Fan, C.-Y. CNOT1 cooperates with LMNA to aggravate osteosarcoma tumorigenesis through the Hedgehog signaling pathway. Mol. Oncol. 2017, 11, 388–404. [Google Scholar] [CrossRef] [Green Version]
  11. Shao, Y.W.; Wood, G.A.; Lu, J.; Tang, Q.-L.; Liu, J.; Molyneux, S.; Chen, Y.; Fang, H.; Adissu, H.; McKee, T.; et al. Cross-species genomics identifies DLG2 as a tumor suppressor in osteosarcoma. Oncogene 2018, 38, 291–298. [Google Scholar] [CrossRef]
  12. Ahmed, N.; Brawley, V.S.; Hegde, M.; Robertson, C.; Ghazi, A.; Gerken, C.; Liu, E.; Dakhova, O.; Ashoori, A.; Corder, A.; et al. Human Epidermal Growth Factor Receptor 2 (HER2) –Specific Chimeric Antigen Receptor–Modified T Cells for the Immunotherapy of HER2-Positive Sarcoma. J. Clin. Oncol. 2015, 33, 1688–1696. [Google Scholar] [CrossRef]
  13. Butch, E.R.; Mead, P.E.; Diaz, V.A.; Tillman, H.; Stewart, E.; Mishra, J.K.; Kim, J.; Bahrami, A.; Dearling, J.L.; Packard, A.B.; et al. Positron Emission Tomography Detects In Vivo Expression of Disialoganglioside GD2 in Mouse Models of Primary and Metastatic Osteosarcoma. Cancer Res. 2019, 79, 3112–3124. [Google Scholar] [CrossRef]
  14. Karkare, S.; Allen, K.J.H.; Jiao, R.; Malo, M.E.; Dawicki, W.; Helal, M.; Godson, D.L.; Dickinson, R.; MacDonald-Dickinson, V.; Yang, R.; et al. Detection and targeting insulin growth factor receptor type 2 (IGF2R) in osteosarcoma PDX in mouse models and in canine osteosarcoma tumors. Sci. Rep. 2019, 9, 11476. [Google Scholar] [CrossRef]
  15. Köksal, H.; Müller, E.; Inderberg, E.M.; Bruland, Ø.; Wälchli, S. Treating Osteosarcoma with CAR T cells. Scand. J. Immunol. 2019, 89, e12741. [Google Scholar] [CrossRef]
  16. Wang, S.-D.; Li, H.-Y.; Li, B.-H.; Xie, T.; Zhu, T.; Sun, L.-L.; Ren, H.-Y.; Ye, Z.-M. The role of CTLA-4 and PD-1 in anti-tumor immune response and their potential efficacy against osteosarcoma. Int. Immunopharmacol. 2016, 38, 81–89. [Google Scholar] [CrossRef]
  17. Wang, Y.; Yu, W.; Zhu, J.; Wang, J.; Xia, K.; Liang, C.; Tao, H. Anti-CD166/4-1BB chimeric antigen receptor T cell therapy for the treatment of osteosarcoma. J. Exp. Clin. Cancer Res. 2019, 38, 168. [Google Scholar] [CrossRef]
  18. Yu, W.; Wang, Y.; Zhu, J.; Jin, L.; Liu, B.; Xia, K.; Wang, J.; Gao, J.; Liang, C.; Tao, H. Autophagy inhibitor enhance ZnPc/BSA nanoparticle induced photodynamic therapy by sup-pressing PD-L1 expression in osteosarcoma immunotherapy. Biomaterials 2019, 192, 128–139. [Google Scholar] [CrossRef]
  19. Mason, N.J.; Gnanandarajah, J.S.; Engiles, J.B.; Gray, F.; Laughlin, D.; Gaurnier-Hausser, A.; Wallecha, A.; Huebner, M.; Paterson, Y. Immunotherapy with a HER2-Targeting Listeria Induces HER2-Specific Im-munity and Demonstrates Potential Therapeutic Effects in a Phase I Trial in Canine Osteosarcoma. Clin. Cancer Res. 2016, 22, 4380–4390. [Google Scholar] [CrossRef]
  20. Miwa, S.; Yamamoto, N.; Hayashi, K.; Takeuchi, A.; Igarashi, K.; Tsuchiya, H. Therapeutic Targets for Bone and Soft-Tissue Sarcomas. Int. J. Mol. Sci. 2019, 20, 170. [Google Scholar] [CrossRef] [Green Version]
  21. Love, M.I.; Huber, W.; Anders, S. Moderated estimation of fold change and dispersion for RNA-seq data with DESeq2. Genome Biol. 2014, 15, 550. [Google Scholar] [CrossRef]
  22. Yu, G.; Wang, L.-G.; Han, Y.; He, Q.-Y. clusterProfiler: An R Package for Comparing Biological Themes Among Gene Clusters. OMICS J. Integr. Biol. 2012, 16, 284–287. [Google Scholar] [CrossRef]
  23. Shannon, P.; Markiel, A.; Ozier, O.; Baliga, N.S.; Wang, J.T.; Ramage, D.; Amin, N.; Schwikowski, B.; Ideker, T. Cytoscape: A software environment for integrated models of Biomolecular Interaction Networks. Genome Res. 2003, 13, 2498–2504. [Google Scholar] [CrossRef]
  24. Bader, G.D.; Hogue, C.W.V. An automated method for finding molecular complexes in large protein interaction networks. BMC Bioinform. 2003, 4, 2–27. [Google Scholar] [CrossRef]
  25. Chou, C.H.; Shrestha, S.; Yang, C.D.; Chang, N.W.; Lin, Y.L.; Liao, K.W.; Huang, W.C.; Sun, T.H.; Tu, S.J.; Lee, W.H.; et al. miRTarBase update 2018: A resource for experimentally validated microRNA-target interactions. Nucleic Acids Res. 2018, 46, D296–D302. [Google Scholar] [CrossRef]
  26. Lewis, B.P.; Burge, C.B.; Bartel, D.P. Conserved Seed Pairing, Often Flanked by Adenosines, Indicates that Thousands of Human Genes are MicroRNA Targets. Cell 2005, 120, 15–20. [Google Scholar] [CrossRef]
  27. Newman, A.M.; Liu, C.L.; Green, M.R.; Gentles, A.J.; Feng, W.; Xu, Y.; Hoang, C.D.; Diehn, M.; Alizadeh, A.A. Robust enumeration of cell subsets from tissue expression profiles. Nat. Methods 2015, 12, 453–457. [Google Scholar] [CrossRef]
  28. Gu, W.; Miller, S.; Chiu, C.Y. Clinical Metagenomic Next-Generation Sequencing for Pathogen Detection. Annu. Rev. Pathol. Mech. Dis. 2019, 14, 319–338. [Google Scholar] [CrossRef]
  29. Mardis, E.R. Next-generation DNA sequencing methods. Annu. Rev. Genom. Hum. Genet. 2008, 9, 387–402. [Google Scholar] [CrossRef]
  30. Metzker, M.L. Sequencing technologies—the next generation. Nat. Rev. Genet. 2009, 11, 31–46. [Google Scholar] [CrossRef] [Green Version]
  31. van Dijk, E.L.; Auger, H.; Jaszczyszyn, Y.; Thermes, C. Ten years of next-generation sequencing technology. Trends Genet. 2014, 30, 418–426. [Google Scholar] [CrossRef]
  32. Acin-Albiac, M.; Filannino, P.; Gobbetti, M.; Di Cagno, R. Microbial high throughput phenomics: The potential of an irreplaceable omics. Comput. Struct. Biotechnol. J. 2020, 18, 2290–2299. [Google Scholar] [CrossRef]
  33. Govindarajan, M.; Wohlmuth, C.; Waas, M.; Bernardini, M.Q.; Kislinger, T. High-throughput approaches for precision medicine in high-grade serous ovarian cancer. J. Hematol. Oncol. 2020, 13, 134. [Google Scholar] [CrossRef]
  34. Haley, B.; Roudnicky, F. Functional Genomics for Cancer Drug Target Discovery. Cancer Cell 2020, 38, 31–43. [Google Scholar] [CrossRef]
  35. Jung, H.; Winefield, C.; Bombarely, A.; Prentis, P.; Waterhouse, P. Tools and Strategies for Long-Read Sequencing and De Novo Assembly of Plant Ge-nomes. Trends Plant Sci. 2019, 24, 700–724. [Google Scholar] [CrossRef]
  36. Zaidi, N.; Jaffee, E.M. Immunotherapy transforms cancer treatment. J. Clin. Investig. 2018, 129, 46–47. [Google Scholar] [CrossRef]
  37. Torabi, A.; Amaya, C.N.; Wians, F.H., Jr.; Bryan, B.A. PD-1 and PD-L1 expression in bone and soft tissue sarcomas. Pathology 2017, 49, 506–513. [Google Scholar] [CrossRef]
  38. Le Cesne, A.; Marec-Berard, P.; Blay, J.Y.; Gaspar, N.; Bertucci, F.; Penel, N.; Bompas, E.; Cousin, S.; Toulmonde, M.; Bessede, A.; et al. Programmed cell death 1 (PD-1) targeting in patients with advanced osteosarcomas: Results from the PEMBROSARC study. Eur. J. Cancer 2019, 119, 151–157. [Google Scholar] [CrossRef]
  39. Canter, R.J.; Grossenbacher, S.K.; Foltz, J.A.; Sturgill, I.R.; Park, J.S.; Luna, J.I.; Kent, M.S.; Culp, W.T.N.; Chen, M.; Modiano, J.F.; et al. Radiotherapy enhances natural killer cell cytotoxicity and localization in pre-clinical canine sarcomas and first-in-dog clinical trial. J. Immunother. Cancer 2017, 5, 98. [Google Scholar] [CrossRef]
  40. Miwa, S.; Nishida, H.; Tanzawa, Y.; Takeuchi, A.; Hayashi, K.; Yamamoto, N.; Mizukoshi, E.; Nakamoto, Y.; Kaneko, S.; Tsuchiya, H. Phase 1/2 study of immunotherapy with dendritic cells pulsed with autologous tumor lysate in patients with refractory bone and soft tissue sarcoma. Cancer 2017, 123, 1576–1584. [Google Scholar] [CrossRef] [Green Version]
  41. Merchant, M.S.; Bernstein, D.; Amoako, M.; Baird, K.; Fleisher, T.A.; Morre, M.; Steinberg, S.M.; Sabatino, M.; Stroncek, D.F.; Venkatasan, A.M.; et al. Adjuvant Immunotherapy to Improve Outcome in High-Risk Pediatric Sarcomas. Clin. Cancer Res. 2016, 22, 3182–3191. [Google Scholar] [CrossRef] [PubMed]
  42. Kaufmann, D.; Gruener, S.; Braun, F.; Stark, M.; Griesser, J.; Hoffmeyer, S.; Bartelt, B. EVI2B, a gene lying in an intron of the neurofibromatosis type 1 (NF1) gene, is as the NF1 gene involved in differentiation of melanocytes and keratinocytes and is overexpressed in cells derived from NF1 neurofi-bromas. DNA Cell Biol. 1999, 18, 345–356. [Google Scholar] [CrossRef] [PubMed]
  43. Matesanz-Isabel, J.; Sintes, J.; Llinàs, L.; de Salort, J.; Lázaro, A.; Engel, P. New B-cell CD molecules. Immunol. Lett. 2011, 134, 104–112. [Google Scholar] [CrossRef] [PubMed]
  44. Zjablovskaja, P.; Kardosova, M.; Danek, P.; Angelisova, P.; Benoukraf, T.; Wurm, A.A.; Kalina, T.; Sian, S.; Balastik, M.; Delwel, R.; et al. EVI2B is a C/EBPalpha target gene required for granulocytic differentiation and functionality of hematopoietic progenitors. Cell Death Differ. 2017, 24, 705–716. [Google Scholar] [CrossRef] [PubMed]
  45. Kitamura, H.; Kawata, H.; Takahashi, F.; Higuchi, Y.; Furuichi, T.; Ohkawa, H. Bone marrow neutrophilia and suppressed bone turnover in human interleukin-6 transgenic mice. A cellular relationship among hematopoietic cells, osteoblasts, and osteoclasts mediated by stromal cells in bone marrow. Am. J. Pathol. 1995, 147, 1682–1692. [Google Scholar]
  46. Roodman, G.D. Regulation of osteoclast differentiation. Ann. N. Y. Acad. Sci. 2006, 1068, 100–109. [Google Scholar] [CrossRef]
  47. Sterrett, J.D. The osteoclast and periodontitis. J. Clin. Periodontol. 1986, 13, 258–269. [Google Scholar] [CrossRef]
  48. Jewett, A.; Kos, J.; Kaur, K.; Safaei, T.; Sutanto, C.; Chen, W.; Wong, P.; Namagerdi, A.K.; Fang, C.; Fong, Y.; et al. Natural Killer Cells: Diverse Functions in Tumor Immunity and Defects in Pre-neoplastic and Neoplastic Stages of Tumorigenesis. Mol. Ther.-Oncolytics 2020, 16, 41–52. [Google Scholar] [CrossRef]
  49. Wang, K.; Gu, Y.; Liao, Y.; Bang, S.; Donnelly, C.; Chen, O.; Tao, X.; Mirando, A.J.; Hilton, M.J.; Ji, R.-R. PD-1 blockade inhibits osteoclast formation and murine bone cancer pain. J. Clin. Investig. 2020, 130, 3603–3620. [Google Scholar] [CrossRef]
  50. Krishnadas, D.K.; Shusterman, S.; Bai, F.; Diller, L.; Sullivan, J.E.; Cheerva, A.C.; George, R.E.; Lucas, K.G. A phase I trial combining decitabine/dendritic cell vaccine targeting MAGE-A1, MAGE-A3 and NY-ESO-1 for children with relapsed or therapy-refractory neuroblastoma and sarcoma. Cancer Immunol. Immunother. 2015, 64, 1251–1260. [Google Scholar] [CrossRef]
  51. Himoudi, N.; Wallace, R.; Parsley, K.L.; Gilmour, K.; Barrie, A.-U.; Howe, K.; Dong, R.; Sebire, N.J.; Michalski, A.; Thrasher, A.J.; et al. Lack of T-cell responses following autologous tumour lysate pulsed dendritic cell vaccination, in patients with relapsed osteosarcoma. Clin. Transl. Oncol. 2012, 14, 271–279. [Google Scholar] [CrossRef]
  52. Chen, Y.; Meng, F.; Wang, B.; He, L.; Liu, Y.; Liu, Z. Dock2 in the development of inflammation and cancer. Eur. J. Immunol. 2018, 48, 915–922. [Google Scholar] [CrossRef]
  53. Kunimura, K.; Uruno, T.; Fukui, Y. DOCK family proteins: Key players in immune surveillance mechanisms. Int. Immunol. 2020, 32, 5–15. [Google Scholar] [CrossRef]
  54. Läubli, H.; Varki, A. Sialic acid–binding immunoglobulin-like lectins (Siglecs) detect self-associated molecular patterns to regulate immune responses. Cell. Mol. Life Sci. 2020, 77, 593–605. [Google Scholar] [CrossRef]
  55. Huang, M.Y.; Wang, H.M.; Tok, T.S.; Chang, H.J.; Chang, M.S.; Cheng, T.L.; Wang, J.Y.; Lin, S.R. EVI2B, ATP2A2, S100B, TM4SF3, and OLFM4 as potential prognostic markers for postoperative Taiwanese colorectal cancer patients. DNA Cell Biol. 2012, 31, 625–635. [Google Scholar] [CrossRef]
  56. Jenne, D.E.; Tinschert, S.; Reimann, H.; Lasinger, W.; Thiel, G.; Hameister, H.; Kehrer-Sawatzki, H. Molecular Characterization and Gene Content of Breakpoint Boundaries in Patients with Neurofibromatosis Type 1 with 17q11.2 Microdeletions. Am. J. Hum. Genet. 2001, 69, 516–527. [Google Scholar] [CrossRef] [Green Version]
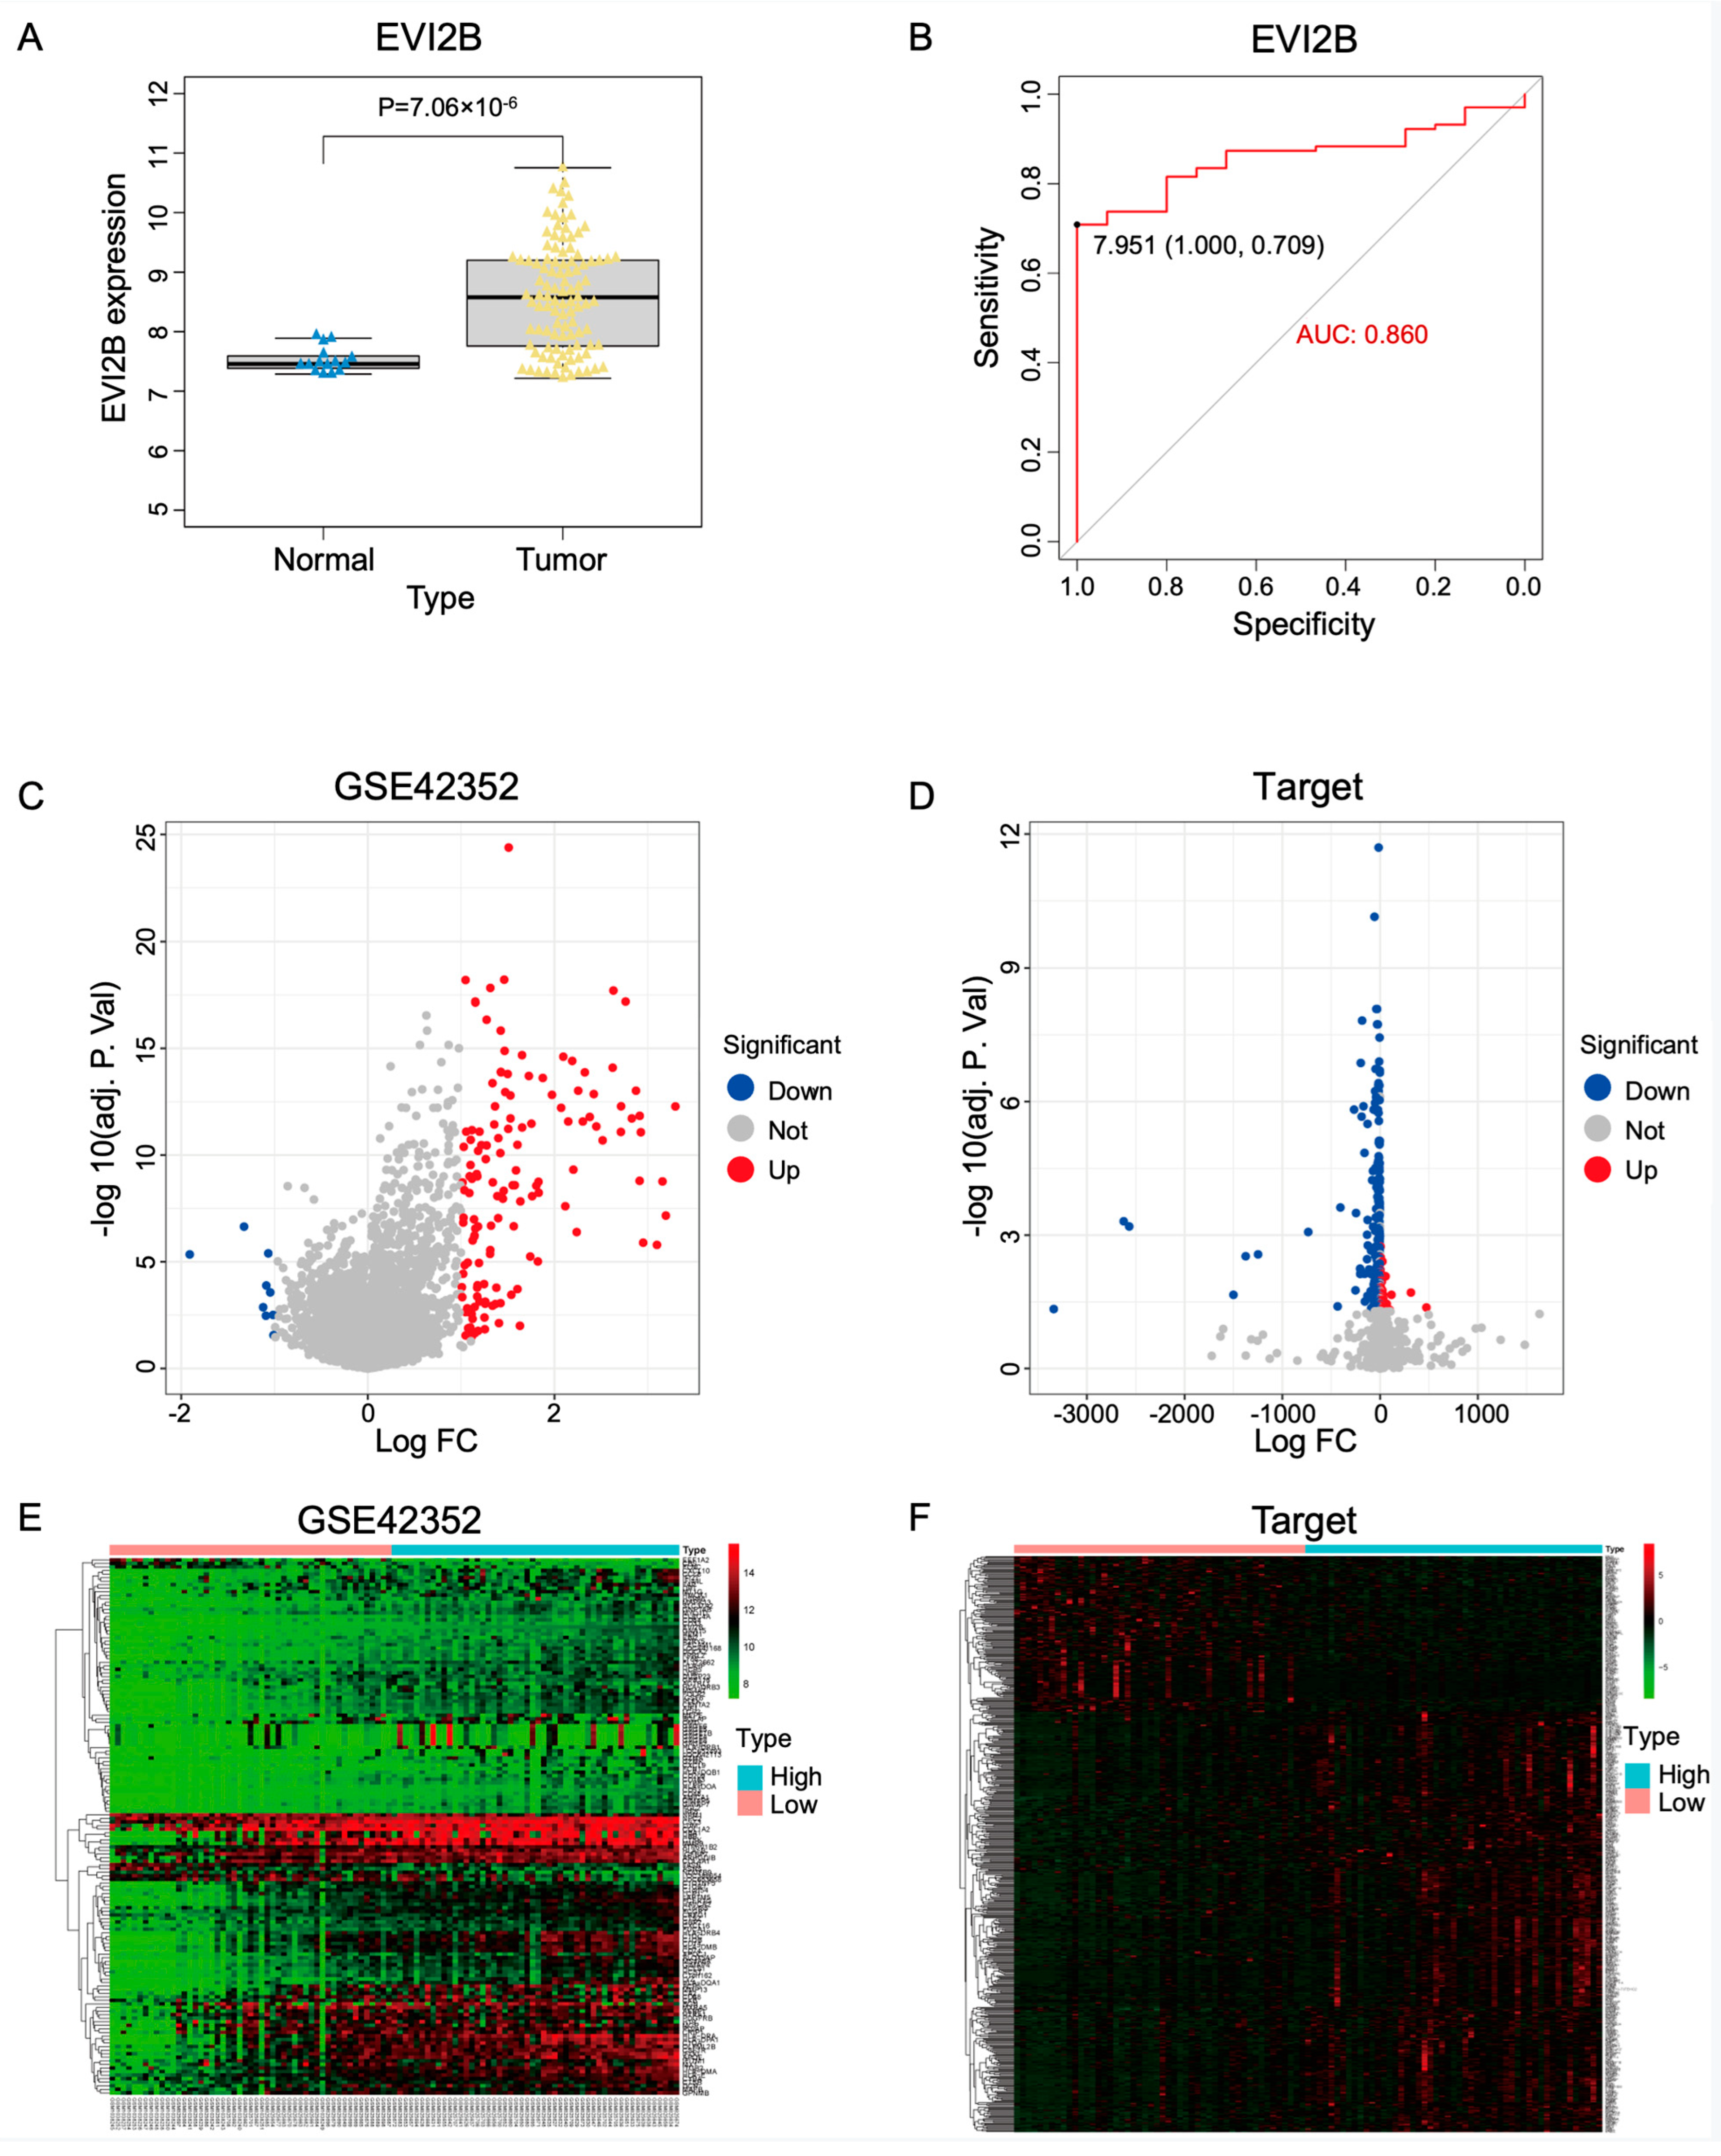
Figure 1. Analysis of EVI2B and DEGs (A) EVI2B expression was significantly lower in tumor tissues than in normal tissues. (B) The area under ROC curve (AUC) for EVI2B in the test set was used to evaluate its diagnostic performance for osteosarcoma. (C) The GSE42352 dataset (test set) was divided into high- and low-expression groups according to the median expression of EVI2B. Significant DEGs between groups are shown in a volcano plot. (D) The Target−OS dataset (validation set) was divided into high- and low-expression groups according to the median expression of EVI2B. Significant DEGs between groups are shown in a volcano plot. (E) DEGs between high- and low-EVI2B-expression groups in the GSE42352 dataset are presented in a heat map. (F) DEGs between high- and low-EVI2B-expression groups in the Target−OS dataset are presented in a heat map.
Biomolecules 13 00327 g001
Figure 2. GSEA and ceRNA network construction. (A,B) The ssGSEA package was used for GO and KEGG enrichment analyses of all DEGs. The KEGG enrichment results are presented in the form of an upset plot (A). The top three terms in the GSEA were chemokine signaling, cytokine−cytokine receptor interaction, and Human T-cell leukemia virus 1 infection. (C) Differentially expressed lncRNA heat map for the validation set. (D) Based on the differentially expressed lncRNAs and mRNAs, a ceRNA network was constructed: green represents mRNAs, blue represents miRNAs, and red represents lncRNAs.
Biomolecules 13 00327 g002
Figure 3. PPI network: (A) A PPI interaction network was constructed by using the molecular interaction list obtained from STRING database. (B) Hub gene sets obtained using MCODE of Cytoscape. (C) The top 20 hub genes obtained using cytoHubba of Cytoscape.
Biomolecules 13 00327 g003
Figure 4. The prognostic value of EVI2B and the construction of a prediction model in osteosarcoma. (A) Effect of EVI2B on overall survival (OS) in osteosarcoma. (B) Effect of EVI2B on disease-free survival (DFS) in osteosarcoma. (C) Venn diagram showing the intersection between the differentially expressed genes in the test set with those in the validation set. (D) Risk curve of the three-gene set (top), survival state (middle), and risk heat map (bottom). (E) The three-gene set (EVI2B, DOCK2, and CD33) was a significant determinant prognosis based on overall survival in osteosarcoma, as determined by a multivariate Cox analysis. EVI2B and DOCK2 are highly expressed and CD33 is lowly expressed in low-risk group. EVI2B and DOCK2 are lowly expressed and CD33 is highly expressed in high-risk group. (F) ROC curve analysis of the accuracy of the model for the prediction of survival and prognosis in osteosarcoma.
Biomolecules 13 00327 g004
Figure 5. Differences in immune cell infiltration and correlations. (A,B) The CIBERSORT package was used to calculate differences in the infiltration of 22 kinds of immune cells between the high and low EVI2B expression groups in 103 osteosarcoma samples from the test set (A) and validation set (B). Green represents the low expression group and orange represents the high expression group in the violin plot. (C,D) Heat map of immune cell correlations in the test set (C) and validation set (D). Darker colors indicate a more significant correlation.
Biomolecules 13 00327 g005
Figure 6. Protein expression level of EVI2B in different immune cells from HPA. (A) Protein expression level of EVI2B in the HPA scaled dataset. (B) Protein expression level of EVI2B in the Monaco scaled dataset. (C) Protein expression level of EVI2B in the Schmiedel dataset.
Biomolecules 13 00327 g006
Figure 7. EVI2B expression in osteosarcoma cell lines and tissue samples. (A) Comparison of mRNA expression levels between different OS cell lines and fibroblast cells. (B) Comparison of mRNA expression levels in five OS tissue samples and adjacent normal tissues. (C) Immunohistochemical scores for 27 paired OS tumor tissues and adjacent normal tissues. (D) Representative immunohistochemical results for tumor and normal tissues in two patients with OS. *** p < 0.001.
Biomolecules 13 00327 g007
Table 1. Multivariate cox regression analysis of three key genes.
idcoefexp (coef)se (coef)zPr (>|z|)
DOCK2−1.33040.26430.4440−2.99620.0027
EVI2B−8.71780.00024.6785−1.86340.0624
CD331.04522.84390.64221.62750.1036
Disclaimer/Publisher’s Note: The statements, opinions and data contained in all publications are solely those of the individual author(s) and contributor(s) and not of MDPI and/or the editor(s). MDPI and/or the editor(s) disclaim responsibility for any injury to people or property resulting from any ideas, methods, instructions or products referred to in the content.