
Mechanical Responses of a Single Myelin Layer: A Molecular Simulation Study

Abstract
:1. Introduction
2. Materials and Methods
3. Results
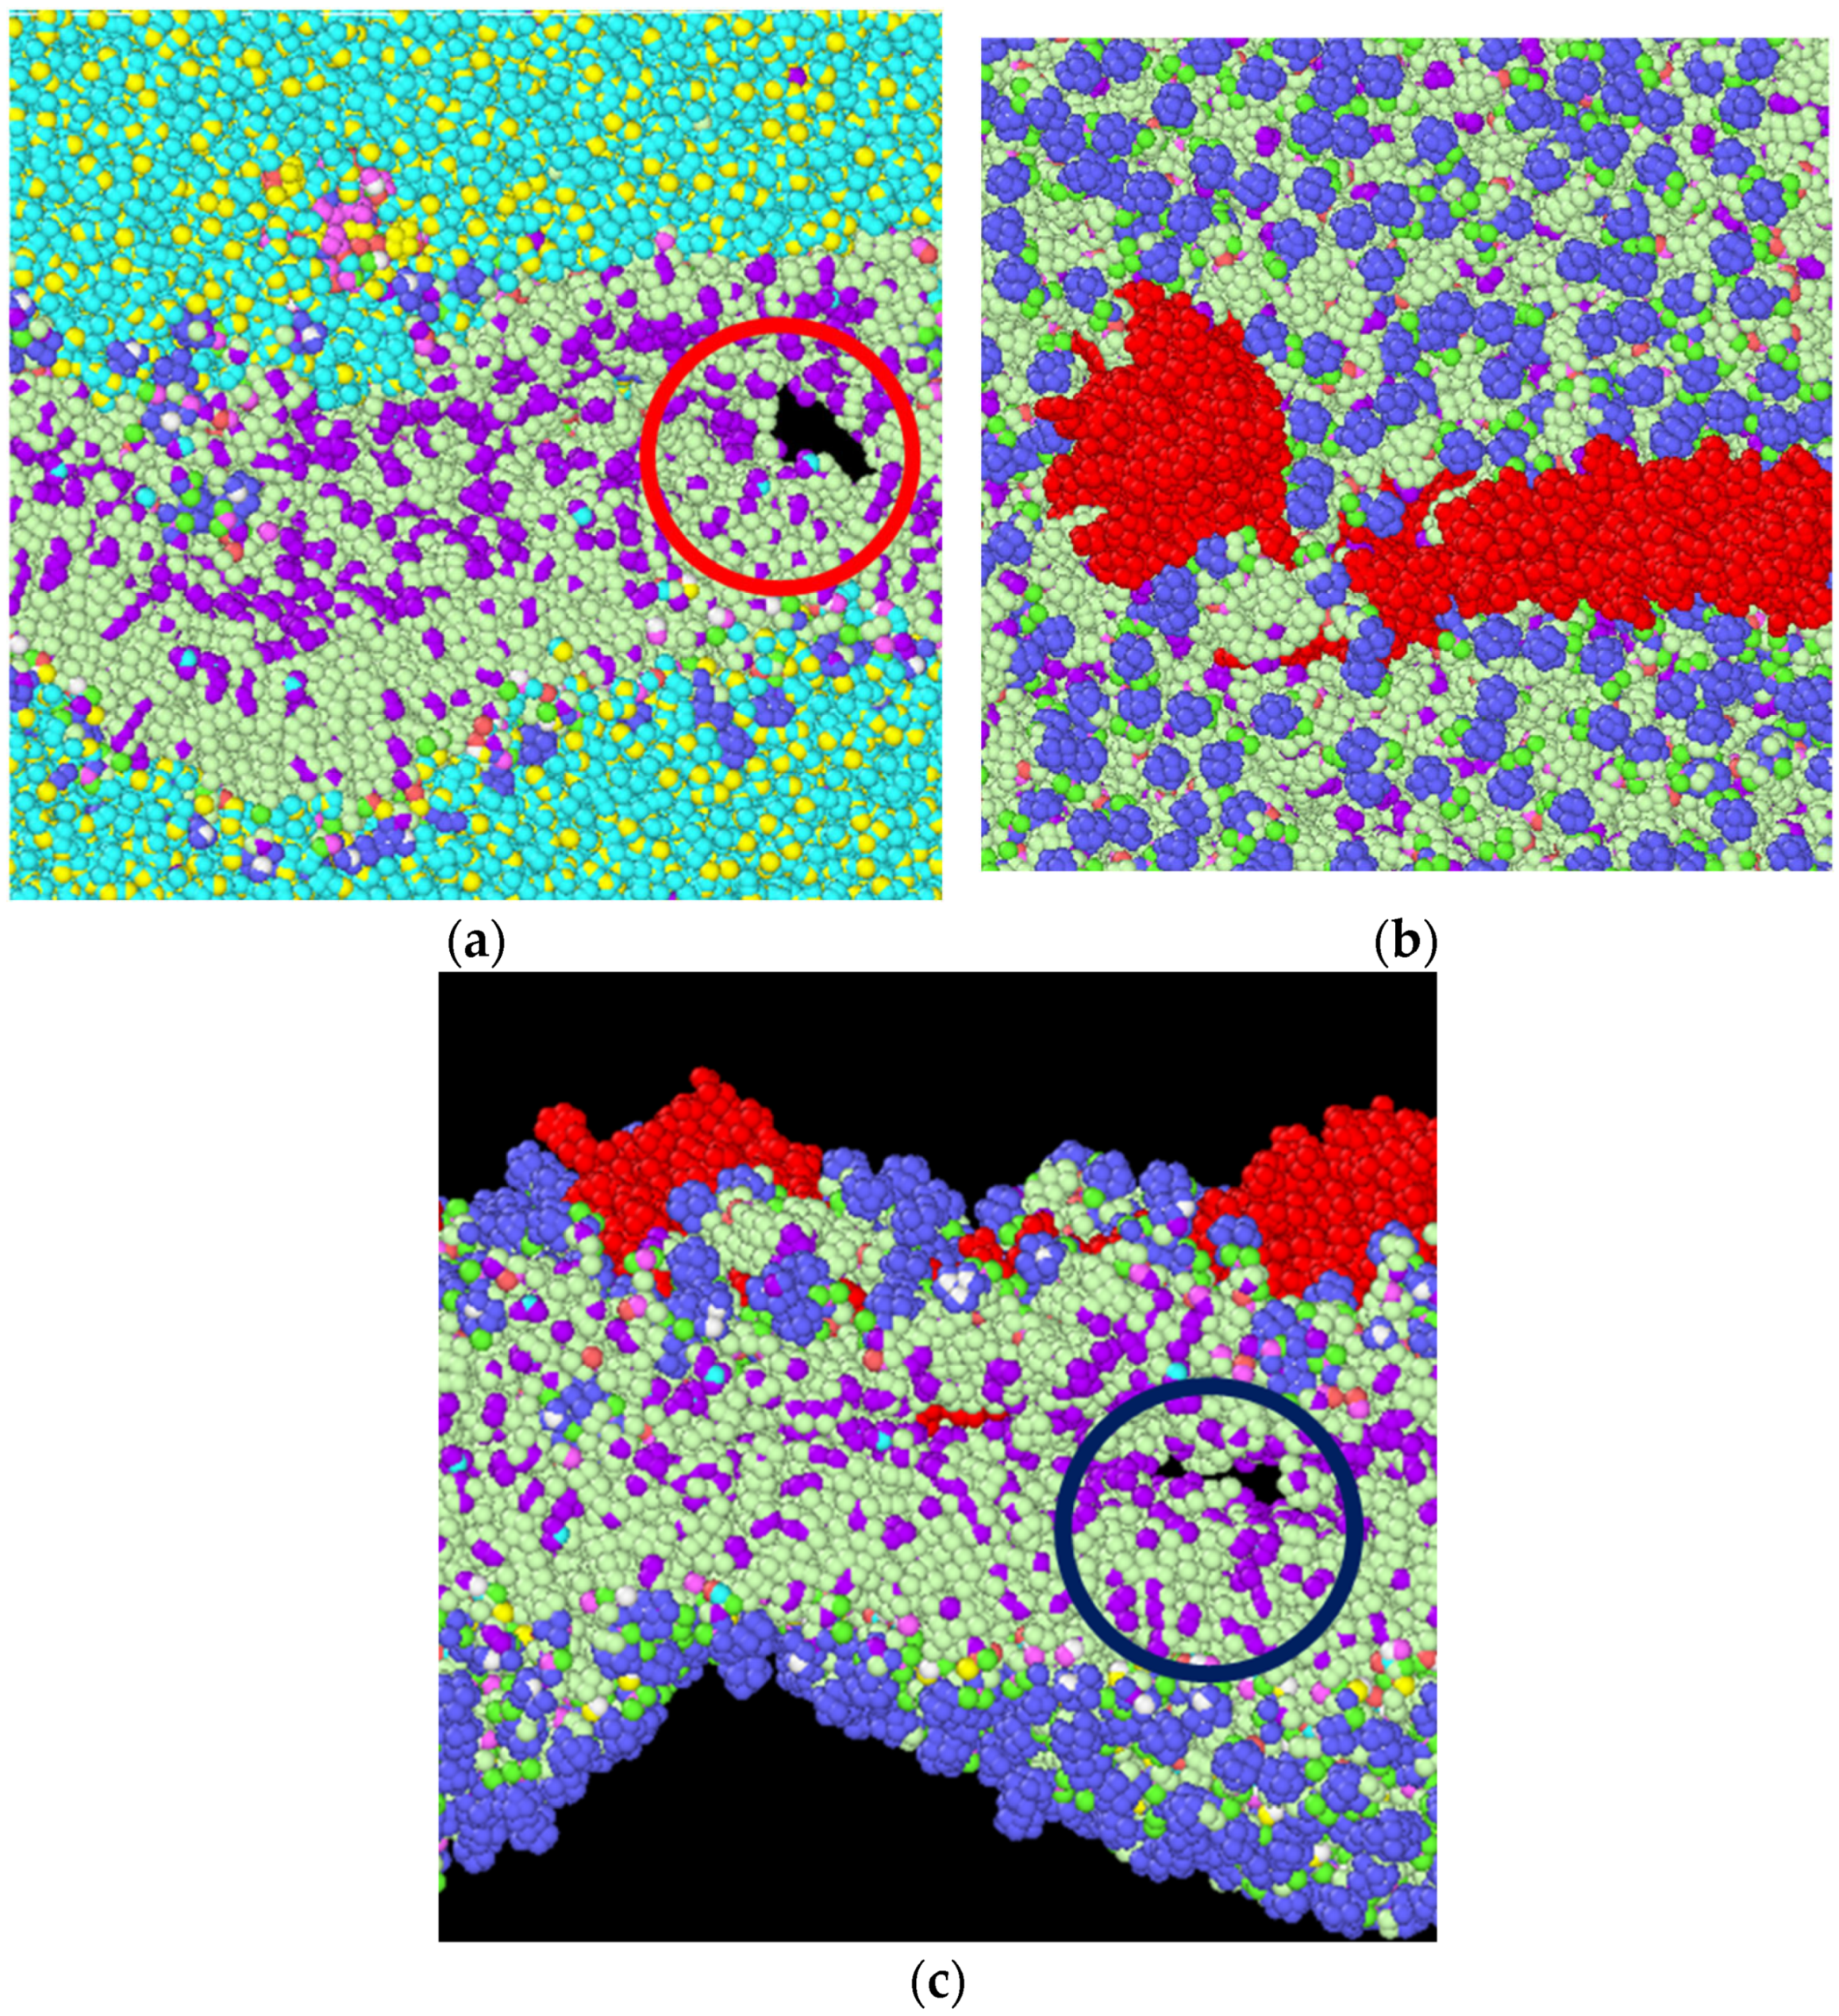
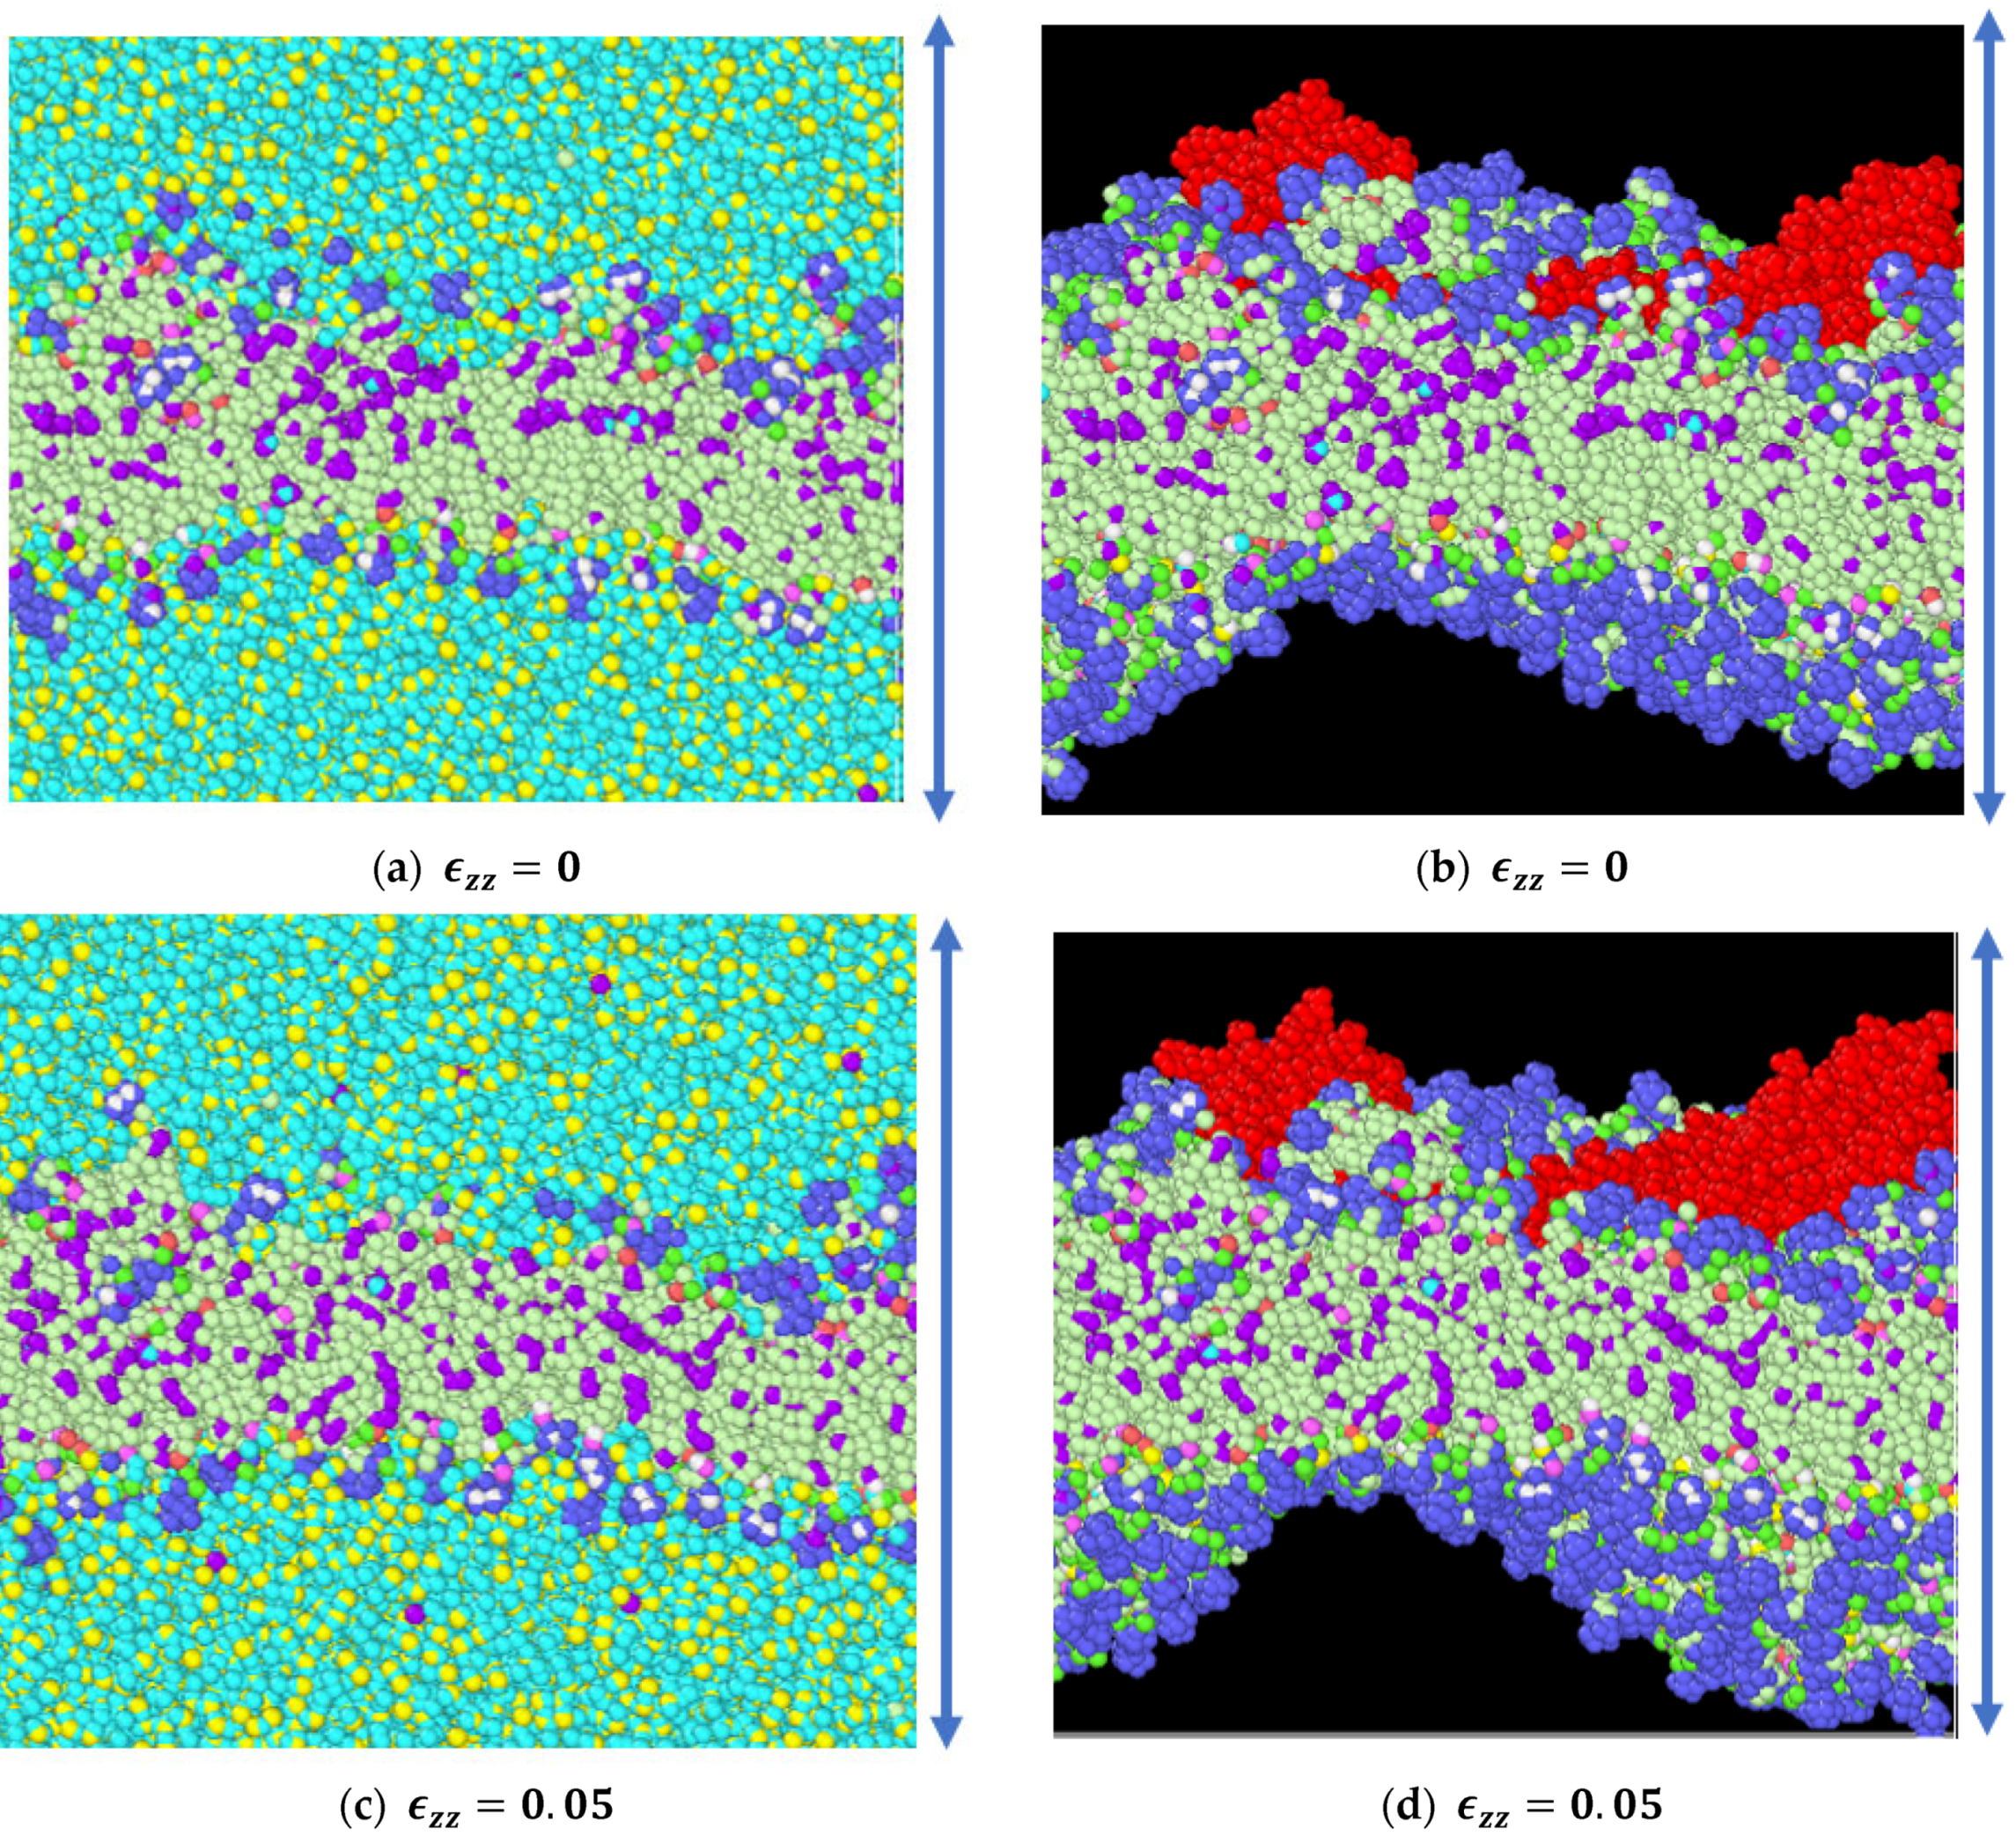
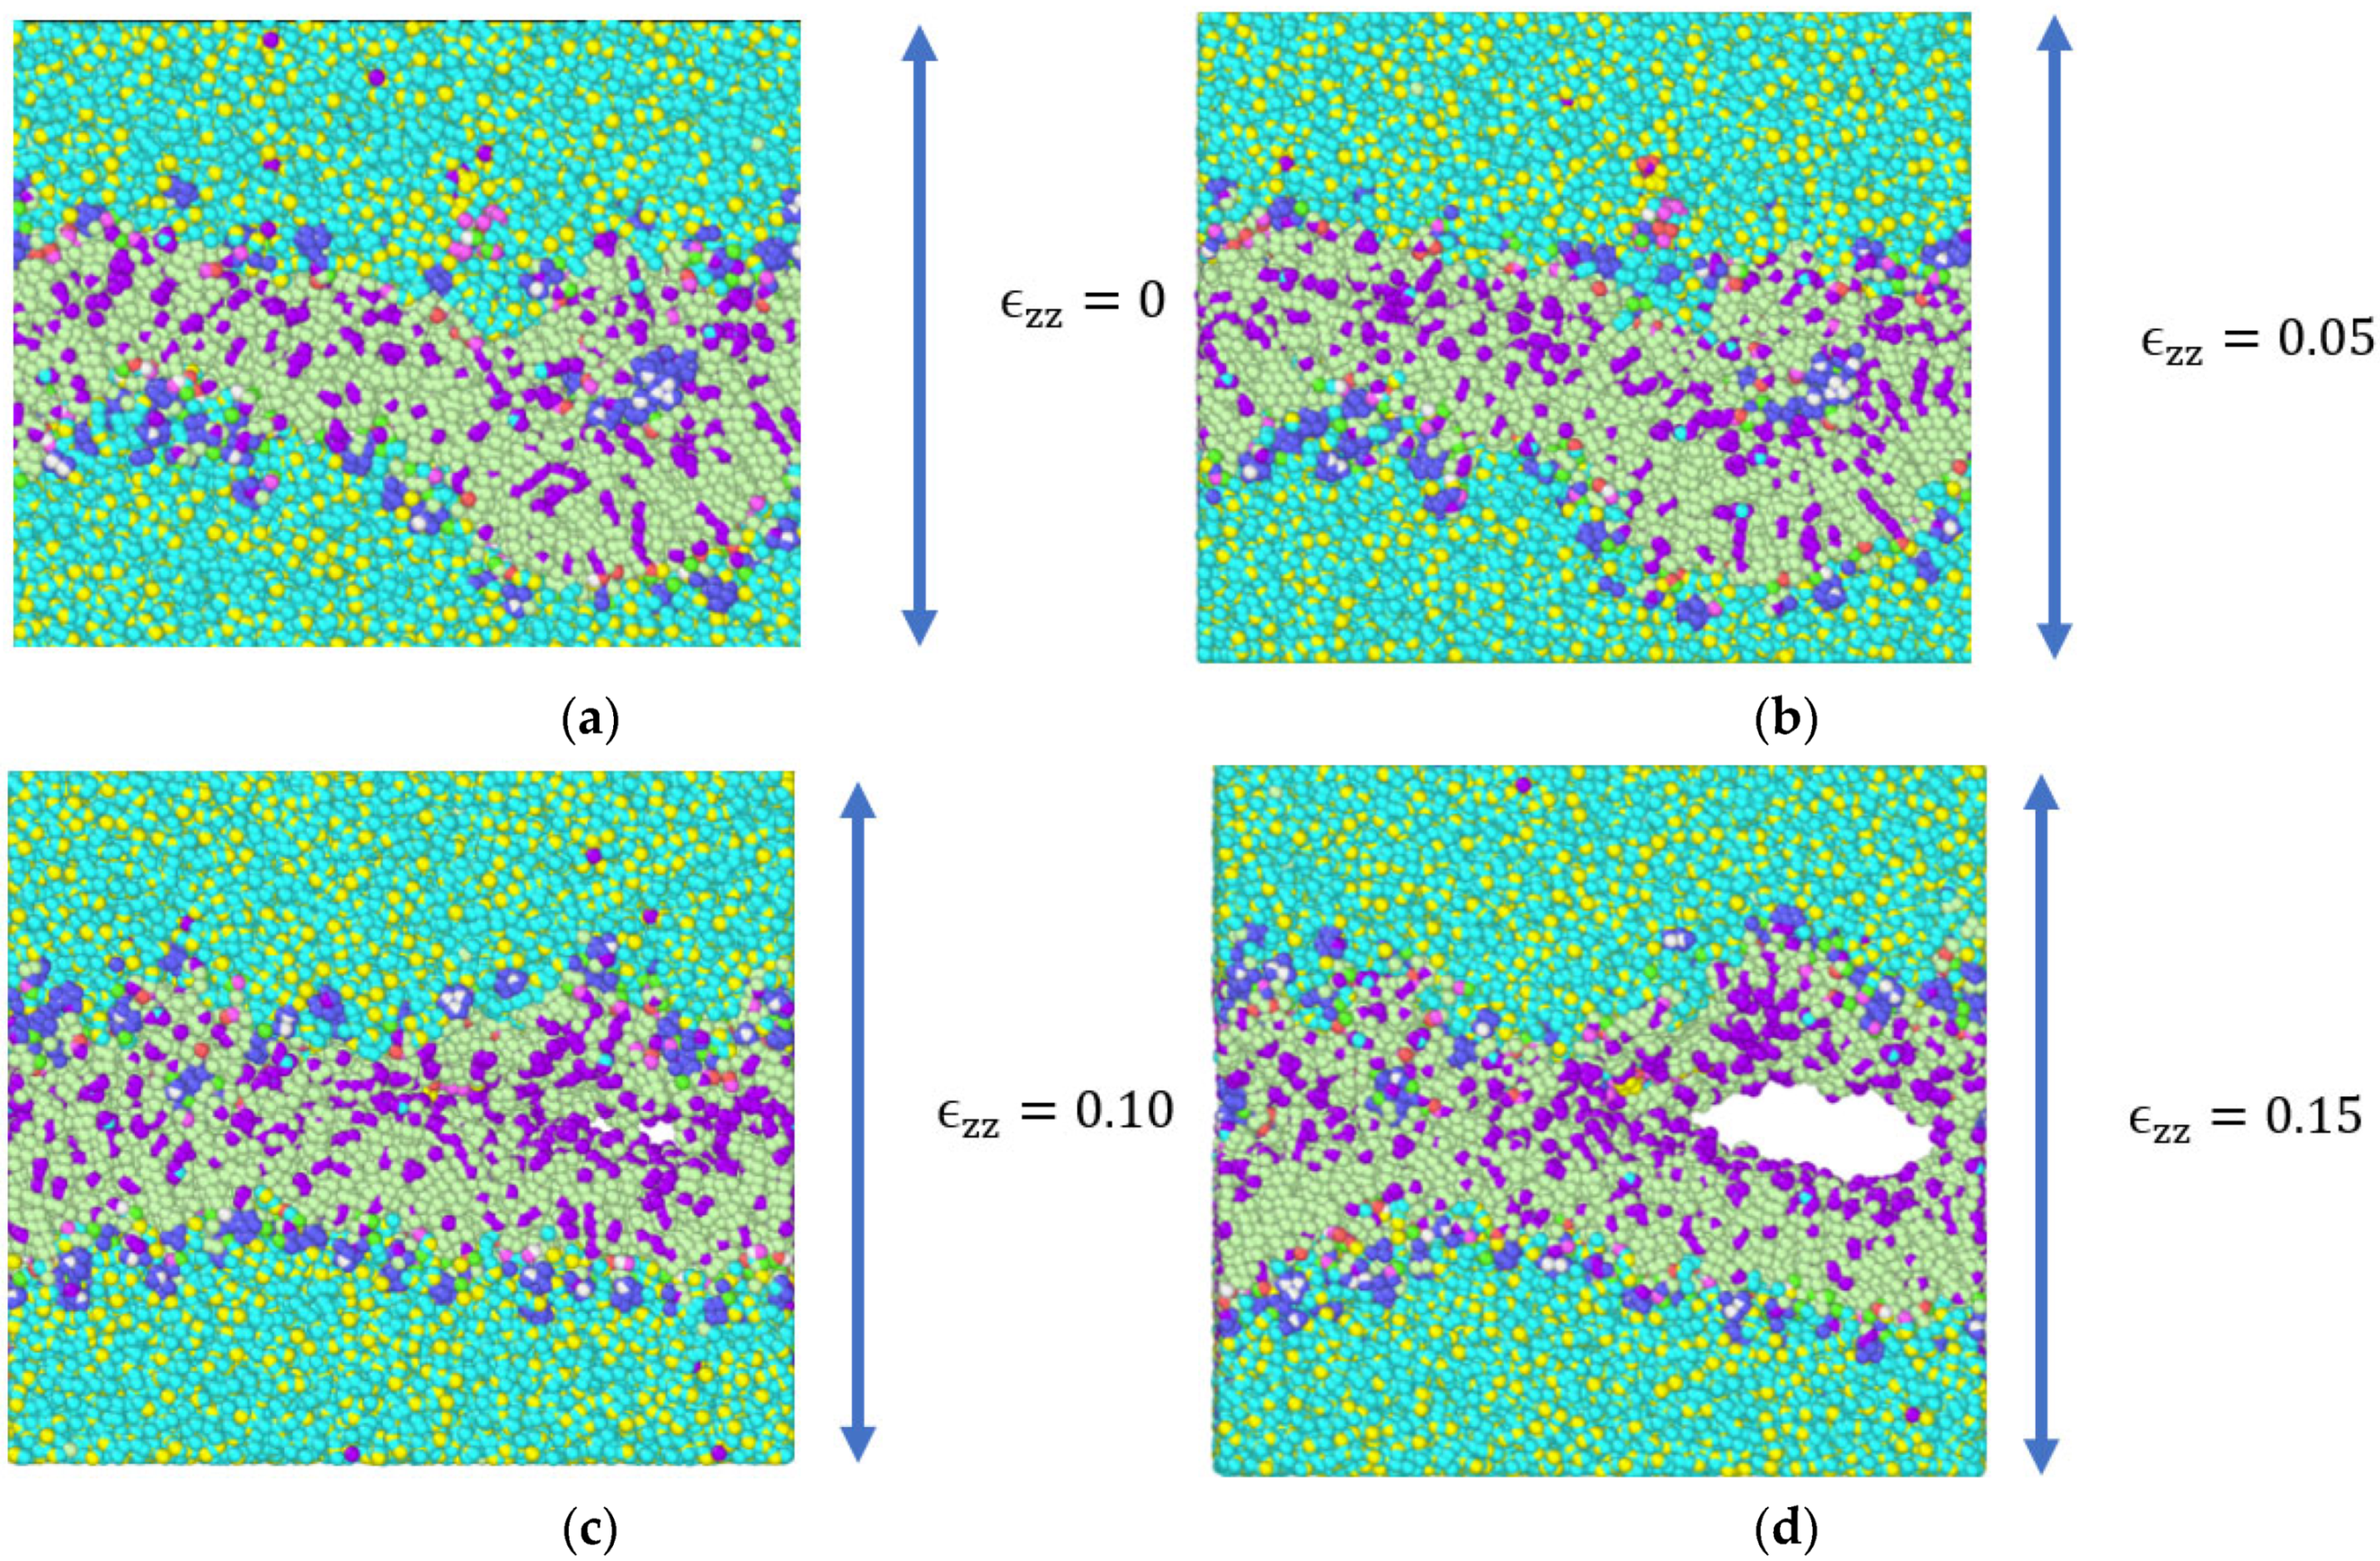
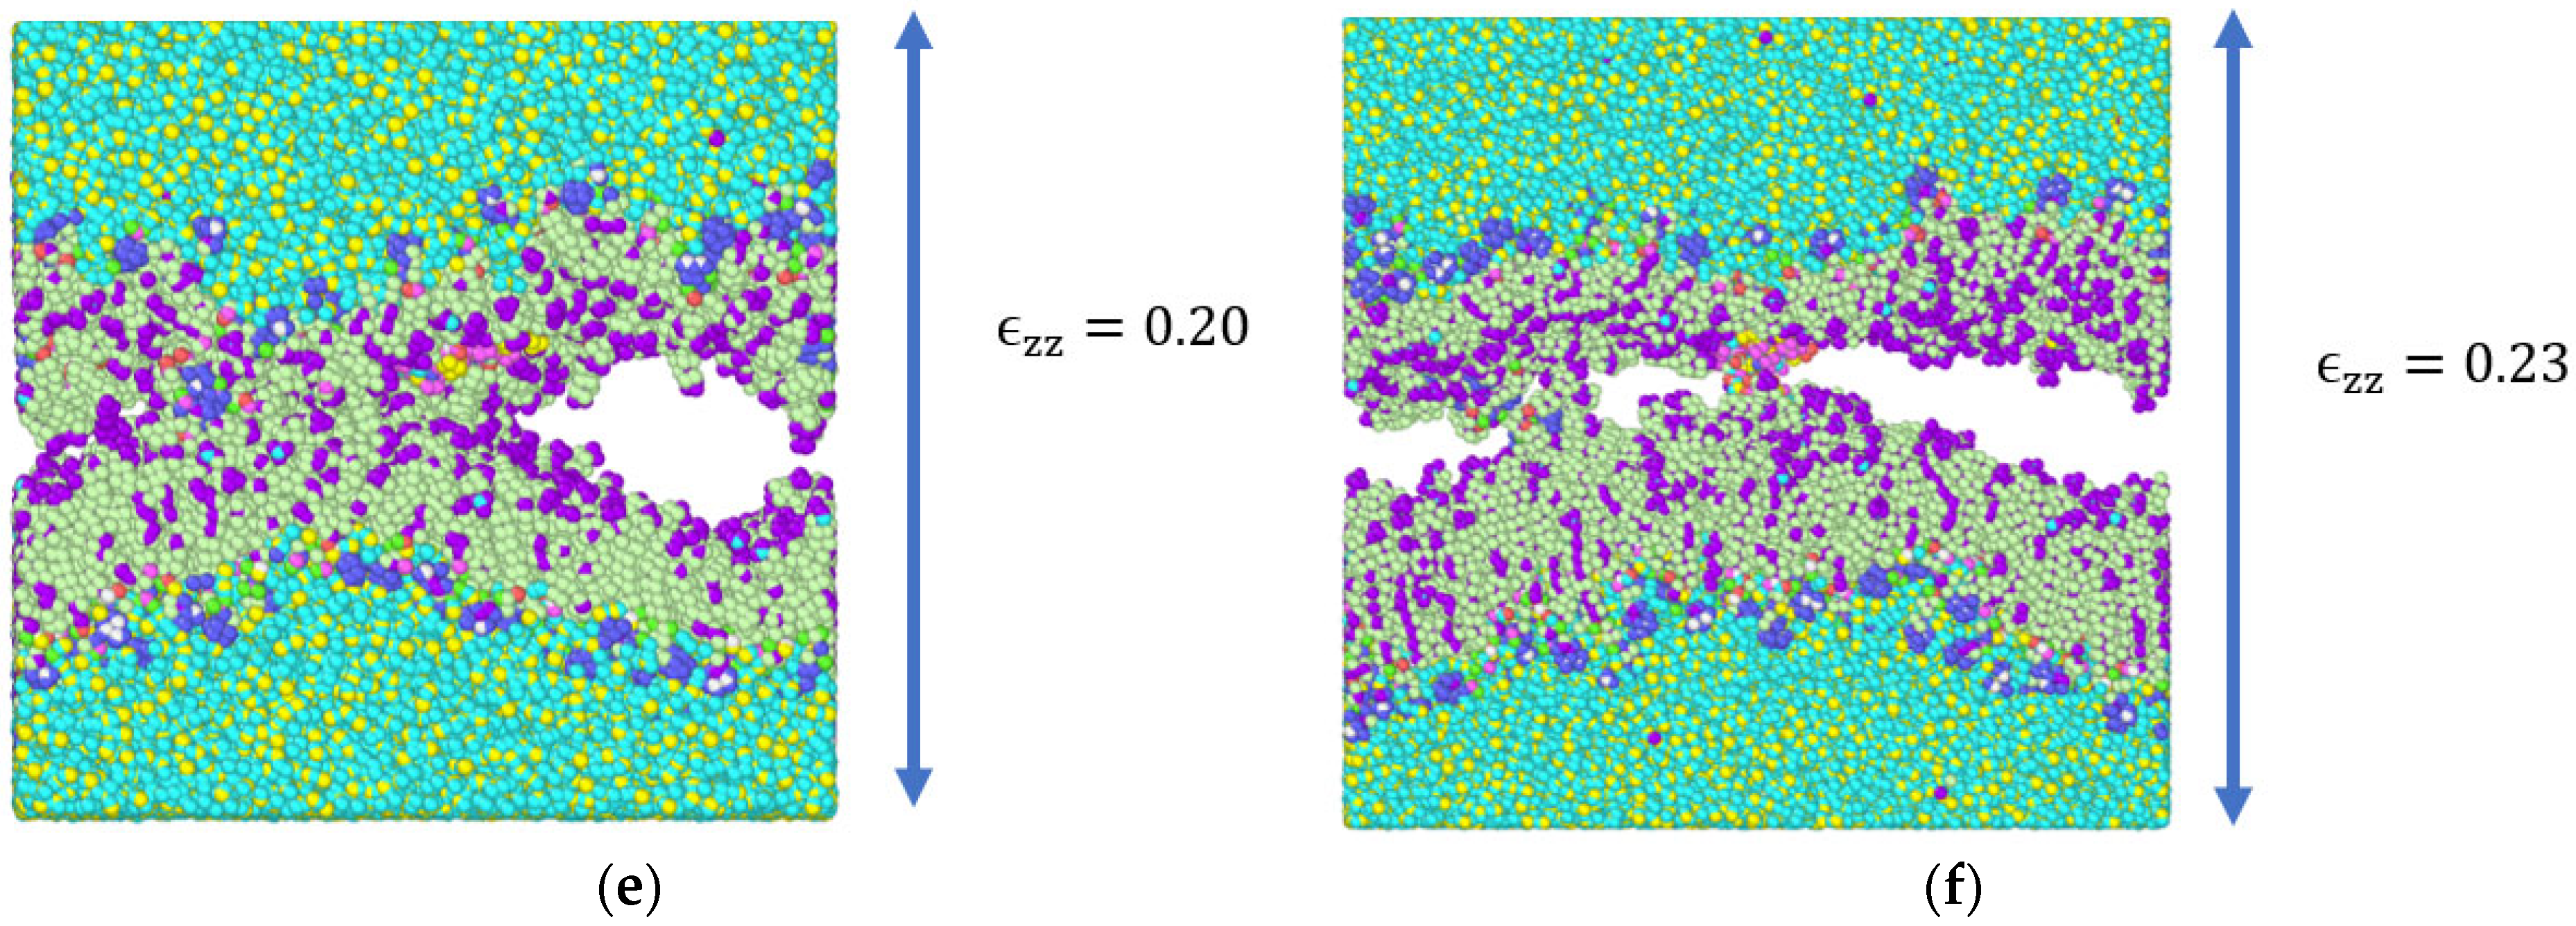
3.1. Stress Strain Response for the Representative Model
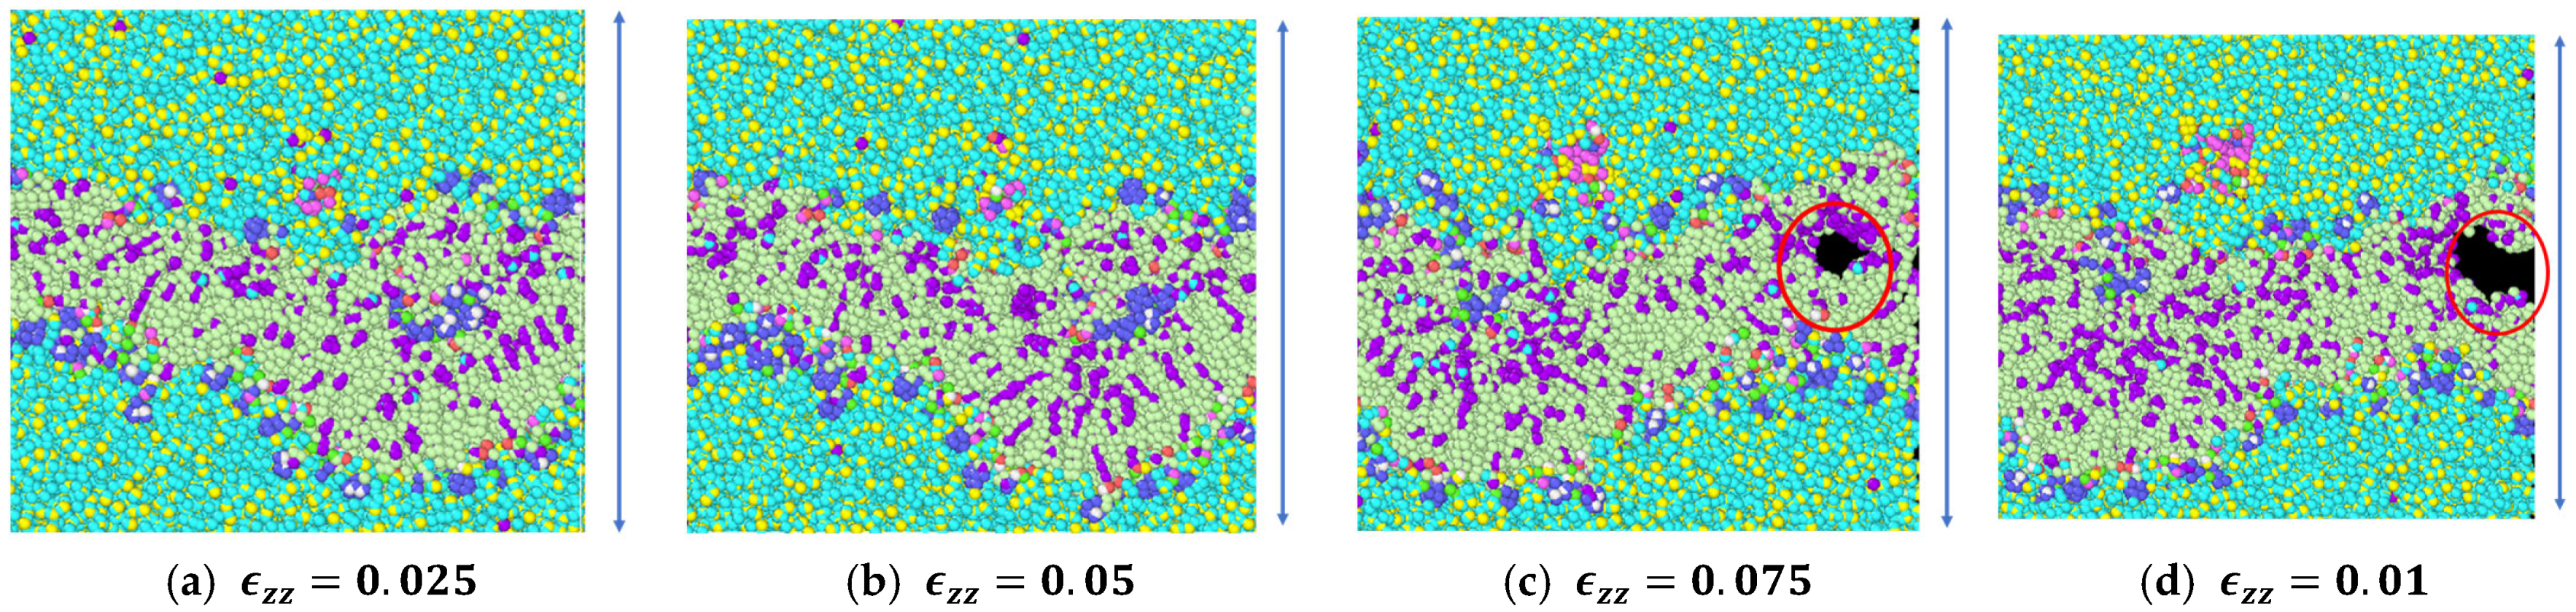
3.2. Stress Strain Response for the Bilayer and Protein
4. Discussion
5. Conclusions
Author Contributions
Funding
Institutional Review Board Statement
Informed Consent Statement
Data Availability Statement
Acknowledgments
Conflicts of Interest
Appendix A
Appendix B


References
- Salzer, J.L.; Zalc, B. Myelination. Curr. Biol. 2016, 26, R971–R975. [Google Scholar] [CrossRef]
- Salzer, J.L. Schwann cell myelination. Cold Spring Harb. Perspect. Biol. 2015, 7, a020529. [Google Scholar] [CrossRef]
- Poitelon, Y.; Kopec, A.M.; Belin, S. Myelin fat facts: An overview of lipids and fatty acid metabolism. Cells 2020, 9, 812. [Google Scholar] [CrossRef]
- Williams, K.A.; Deber, C.M.; Klrschner, O.A. The structure and function of central nervous system myelin. Crit. Rev. Clin. Lab. Sci. 1993, 30, 29–64. [Google Scholar] [CrossRef]
- Campagnoni, A.T. Molecular biology of myelin proteins from the central nervous system. J. Neurochem. 1988, 51, 1–14. [Google Scholar] [CrossRef]
- Weil, M.T.; Ruhwedel, T.; Meschkat, M.; Sadowski, B.; Möbius, W. Transmission electron microscopy of oligodendrocytes and myelin. Methods Mol. Biol. 2019, 1936, 343–375. [Google Scholar]
- Simons, M.; Lyons, D.A. Axonal selection and myelin sheath generation in the central nervous system. Curr. Opin. Cell Biol. 2013, 25, 512–519. [Google Scholar] [CrossRef]
- Maxwell, W.L. Damage to myelin and oligodendrocytes: A role in chronic outcomes following traumatic brain injury? Brain Sci. 2013, 3, 1374–1394. [Google Scholar] [CrossRef]
- Armstrong, R.C.; Mierzwa, A.J.; Marion, C.M.; Sullivan, G.M. White matter involvement after TBI: Clues to axon and myelin repair capacity. Exp. Neurol. 2016, 275, 328–333. [Google Scholar] [CrossRef]
- Marion, C.M.; McDaniel, D.P.; Armstrong, R.C. Sarm1 deletion reduces axon damage, demyelination, and white matter atrophy after experimental traumatic brain injury. Exp. Neurol. 2019, 321, 113040. [Google Scholar] [CrossRef]
- Armstrong, R.C.; Mierzwa, A.J.; Sullivan, G.M.; Sanchez, M.A. Myelin and oligodendrocyte lineage cells in white matter pathology and plasticity after traumatic brain injury. Neuropharmacology 2016, 110, 654–659. [Google Scholar] [CrossRef]
- Mu, J.; Li, M.; Wang, T.; Li, X.; Bai, M.; Zhang, G.; Kong, J. Myelin damage in diffuse axonal injury. Front. Neurosci. 2019, 13, 217. [Google Scholar] [CrossRef]
- Kant, A.; Johnson, V.E.; Arena, J.D.; Dollé, J.P.; Smith, D.H.; Shenoy, V.B. Modeling links softening of myelin and spectrin scaffolds of axons after a concussion to increased vulnerability to repeated injuries. Proc. Natl. Acad. Sci. USA 2021, 118, e2024961118. [Google Scholar] [CrossRef]
- Johnson, V.E.; Stewart, W.; Weber, M.T.; Cullen, D.K.; Siman, R.; Smith, D.H. SNTF immunostaining reveals previously undetected axonal pathology in traumatic brain injury. Acta Neuropathol. 2016, 131, 115–135. [Google Scholar] [CrossRef]
- Taib, T.; Leconte, C.; Van Steenwinckel, J.; Cho, A.H.; Palmier, B.; Torsello, E.; Lai Kuen, R.; Onyeomah, S.; Ecomard, K.; Benedetto, C.; et al. Neuroinflammation, myelin and behavior: Temporal patterns following mild traumatic brain injury in mice. PLoS ONE 2017, 12, e0184811. [Google Scholar] [CrossRef]
- Mierzwa, A.J.; Marion, C.M.; Sullivan, G.M.; McDaniel, D.P.; Armstrong, R.C. Components of myelin damage and repair in the progression of white matter pathology after mild traumatic brain injury. J. Neuropathol. Exp. Neurol. 2015, 74, 218–232. [Google Scholar] [CrossRef]
- Liu, M.C.; Akle, V.; Zheng, W.; Kitlen, J.; O’Steen, B.; Larner, S.F.; Dave, J.R.; Tortella, F.C.; Hayes, R.L.; Wang, K.K. Extensive degradation of myelin basic protein isoforms by calpain following traumatic brain injury. J. Neurochem. 2006, 98, 700–712. [Google Scholar] [CrossRef]
- Mouzon, B.C.; Bachmeier, C.; Ferro, A.; Ojo, J.O.; Crynen, G.; Acker, C.M.; Davies, P.; Mullan, M.; Stewart, W.; Crawford, F. Chronic neuropathological and neurobehavioral changes in a repetitive mild traumatic brain injury model. Ann. Neurol. 2014, 75, 241–254. [Google Scholar] [CrossRef]
- Olbrich, K.; Rawicz, W.; Needham, D.; Evans, E. Water permeability and mechanical strength of polyunsaturated lipid bilayers. Biophys. J. 2000, 79, 321–327. [Google Scholar] [CrossRef]
- Burke, K.A.; Yates, E.A.; Legleiter, J. Amyloid-forming proteins alter the local mechanical properties of lipid membranes. Biochemistry 2013, 52, 808–817. [Google Scholar] [CrossRef]
- Picas, L.; Rico, F.; Scheuring, S. Direct measurement of the mechanical properties of lipid phases in supported bilayers. Biophys. J. 2012, 102, L01–L03. [Google Scholar] [CrossRef]
- Brannigan, G.; Brown, F.L. Composition dependence of bilayer elasticity. J. Chem. Phys. 2005, 122, 74905. [Google Scholar] [CrossRef] [PubMed]
- Kelley, E.G.; Butler, P.D.; Ashkar, R.; Bradbury, R.; Nagao, M. Scaling relationships for the elastic moduli and viscosity of mixed lipid membranes. Proc. Natl. Acad. Sci. USA 2020, 117, 23365–23373. [Google Scholar] [CrossRef]
- Eid, J.; Razmazma, H.; Jraij, A.; Ebrahimi, A.; Monticelli, L. On calculating the bending modulus of lipid bilayer membranes from buckling simulations. J. Phys. Chem. B 2020, 124, 6299–6311. [Google Scholar] [CrossRef]
- Nademi, Y.; Tang, T.; Uludağ, H. Nature of bilayer lipids affects membranes deformation and pore resealing during nanoparticle penetration. Mater. Sci. Eng. C 2022, 132, 112530. [Google Scholar] [CrossRef]
- Ayton, G.; Smondyrev, A.M.; Bardenhagen, S.G.; McMurtry, P.; Voth, G.A. Calculating the bulk modulus for a lipid bilayer with nonequilibrium molecular dynamics simulation. Biophys. J. 2022, 82, 1226–1238. [Google Scholar] [CrossRef] [PubMed]
- Drücker, P.; Iacovache, I.; Bachler, S.; Zuber, B.; Babiychuk, E.B.; Dittrich, P.S.; Draeger, A. Membrane deformation and layer-by-layer peeling of giant vesicles induced by the pore-forming toxin pneumolysin. Biomater. Sci. 2019, 7, 3693–3705. [Google Scholar] [CrossRef]
- Kondrashov, O.V.; Akimov, S.A. The Possibility of Pore Formation in Lipid Membranes by Several Molecules of Amphipathic Peptides. Biochem. Suppl. Ser. A Membr. Cell Biol. 2022, 16, 338–350. [Google Scholar] [CrossRef]
- Soubias, O.; Sodt, A.J.; Teague, W.E.; Hines, K.G.; Gawrisch, K. Physiological changes in bilayer thickness induced by cholesterol control GPCR rhodopsin function. Biophys. J. 2023, 122, 973–983. [Google Scholar] [CrossRef] [PubMed]
- Faizi, H.A.; Dimova, R.; Vlahovska, P.M. A vesicle microrheometer for high-throughput viscosity measurements of lipid and polymer membranes. Biophys. J. 2022, 121, 910–918. [Google Scholar] [CrossRef]
- Galimzyanov, T.R.; Bashkirov, P.V.; Blank, P.S.; Zimmerberg, J.; Batishchev, O.V.; Akimov, S.A. Monolayerwise application of linear elasticity theory well describes strongly deformed lipid membranes and the effect of solvent. Soft Matter 2020, 16, 1179–1189. [Google Scholar] [CrossRef] [PubMed]
- Pinigin, K.V.; Kondrashov, O.V.; Jiménez-Munguía, I.; Alexandrova, V.V.; Batishchev, O.V.; Galimzyanov, T.R.; Akimov, S.A. Elastic deformations mediate interaction of the raft boundary with membrane inclusions leading to their effective lateral sorting. Sci. Rep. 2020, 10, 4087. [Google Scholar] [CrossRef]
- Montanino, A.; Saeedimasine, M.; Villa, A.; Kleiven, S. Localized axolemma deformations suggest mechanoporation as axonal injury trigger. Front. Neurol. 2020, 11, 25. [Google Scholar] [CrossRef]
- Zhang, L.; Tian, X.; Wang, C. In Vitro Application of Langmuir Monolayer Model: The interfacial Behavior of Myelin Basic Protein with a Plasma Membrane Model. J. Membr. Biol. 2022, 255, 71–78. [Google Scholar] [CrossRef]
- Gupta, M.; Weaver, D.F. Microsecond molecular dynamics studies of cholesterol-mediated myelin sheath degeneration in early Alzheimer’s disease. Phys. Chem. Chem. Phys. 2020, 24, 222–239. [Google Scholar] [CrossRef] [PubMed]
- Eberle, D.; Fodelianaki, G.; Kurth, T.; Jagielska, A.; Möllmert, S.; Ulbricht, E.; Wagner, K.; Taubenberger, A.V.; Träber, N.; Escolano, J.C.; et al. Acquired demyelination but not genetic developmental defects in myelination leads to brain tissue stiffness changes. Brain Multiphys. 2020, 1, 100019. [Google Scholar] [CrossRef]
- Tiwari, A.; Pradhan, S.; Sannigrahi, A.; Jha, S.; Chattopadhyay, K.; Biswas, M.; Saleem, M. In vitro reconstitution demonstrates the amyloid-beta mediated myelin membrane deformation. BioRxiv 2021. [Google Scholar] [CrossRef]
- Bianchi, F.; Hofmann, F.; Smith, A.J.; Ye, H.; Thompson, M.S. Probing multi-scale mechanics of peripheral nerve collagen and myelin by X-ray diffraction. J. Mech. Behav. Biomed. Mater. 2018, 87, 205–212. [Google Scholar] [CrossRef]
- Saeedimasine, M.; Montanino, A.; Kleiven, S.; Villa, A. Elucidating axonal injuries through molecular modelling of myelin sheaths and nodes of Ranvier. Front. Mol. Biosci. 2021, 8, 669897. [Google Scholar] [CrossRef]
- Stadelmann, C.; Timmler, S.; Barrantes-Freer, A.; Simons, M. Myelin in the central nervous system: Structure, function, and pathology. Physiol. Rev. 2019, 99, 1381–1431. [Google Scholar] [CrossRef]
- Sherman, D.L.; Brophy, P.J. Mechanisms of axon ensheathment and myelin growth. Nat. Rev. Neurosci. 2005, 6, 683–690. [Google Scholar] [CrossRef]
- Laule, C.; Vavasour, I.M.; Kolind, S.H.; Li, D.K.; Traboulsee, T.L.; Moore, G.W.; MacKay, A.L. Magnetic resonance imaging of myelin. Neurotherapeutics 2007, 4, 460–484. [Google Scholar] [CrossRef] [PubMed]
- Uranova, N.A.; Vikhreva, O.V.; Rachmanova, V.I.; Orlovskaya, D.D. Ultrastructural alterations of myelinated fibers and oligodendrocytes in the prefrontal cortex in schizophrenia: A postmortem morphometric study. Schizophr. Res. Treat. 2011, 2011, 325789. [Google Scholar] [CrossRef] [PubMed]
- Wu, E.L.; Cheng, X.; Jo, S.; Rui, H.; Song, K.C.; Dávila-Contreras, E.M.; Qi, Y.; Lee, J.; Monje-Galvan, V.; Venable, R.M.; et al. CHARMM-GUI membrane builder toward realistic biological membrane simulations. J. Comput. Chem. 2014, 35, 1997–2004. [Google Scholar] [CrossRef] [PubMed]
- Ruskamo, S.; Yadav, R.P.; Sharma, S.; Lehtimäki, M.; Laulumaa, S.; Aggarwal, S.; Simons, M.; Bürck, J.; Ulrich, A.S.; Juffer, A.H.; et al. Atomic resolution view into the structure–function relationships of the human myelin peripheral membrane protein P2. Acta Crystallogr. D Biol. Crystallogr. 2014, 70, 165–176. [Google Scholar] [CrossRef] [PubMed]
- Garcia, P.; Ucurum, Z.; Bucher, R.; Svergun, D.I.; Huber, T.; Lustig, A.; Konarev, P.V.; Marino, M.; Mayans, O. Molecular insights into the self-assembly mechanism of dystrophia myotonica kinase. FASEB J. 2006, 20, 1142–1151. [Google Scholar] [CrossRef]
- Huang, J.; Rauscher, S.; Nawrocki, G.; Ran, T.; Feig, M.; De Groot, B.L.; Grubmüller, H.; MacKerell, A.D., Jr. CHARMM36m: An improved force field for folded and intrinsically disordered proteins. Nat. Methods 2017, 14, 71–73. [Google Scholar] [CrossRef]
- Vanommeslaeghe, K.; MacKerell, A.D., Jr. CHARMM additive and polarizable force fields for biophysics and computer-aided drug design. Biochim. Biophys. Acta 2015, 1850, 861–871. [Google Scholar] [CrossRef]
- Khan, M.I.; Ferdous, S.F.; Adnan, A. Mechanical behavior of actin and spectrin subjected to high strain rate: A molecular dynamics simulation study. Comput. Struct. Biotechnol. J. 2021, 19, 1738–1749. [Google Scholar] [CrossRef]
- Thompson, A.P.; Aktulga, H.M.; Berger, R.; Bolintineanu, D.S.; Brown, W.M.; Crozier, P.S.; in’t Veld, P.J.; Kohlmeyer, A.; Moore, S.G.; Nguyen, T.D.; et al. LAMMPS-a flexible simulation tool for particle-based materials modeling at the atomic, meso, and continuum scales. Comput. Phys. Commun. 2022, 271, 108171. [Google Scholar] [CrossRef]
- Stukowski, A. Visualization and analysis of atomistic simulation data with OVITO–the Open Visualization Tool. Model. Simul. Mat. Sci. Eng. 2009, 18, 15012. [Google Scholar] [CrossRef]
- Subramaniyan, A.K.; Sun, C.T. Continuum interpretation of virial stress in molecular simulations. Int. J. Solids Struct. 2008, 45, 4340–4346. [Google Scholar] [CrossRef]
- Ruskamo, S.; Raasakka, A.; Pedersen, J.S.; Martel, A.; Škubník, K.; Darwish, T.; Porcar, L.; Kursula, P. Human myelin proteolipid protein structure and lipid bilayer stacking. Cell. Mol. Life Sci. 2022, 79, 419. [Google Scholar] [CrossRef]
- Kaliman, P.; Catalucci, D.; Lam, J.T.; Kondo, R.; Gutiérrez, J.C.P.; Reddy, S.; Palacín, M.; Zorzano, A.; Chien, K.R.; Ruiz-Lozano, P. Myotonic dystrophy protein kinase phosphorylates phospholamban and regulates calcium uptake in cardiomyocyte sarcoplasmic reticulum. J. Biol. Chem. 2005, 280, 8016–8021. [Google Scholar] [CrossRef]
- Nemati, A.; Pishkenari, H.N.; Meghdari, A.; Sohrabpour, S. Directing the diffusive motion of fullerene-based nanocars using nonplanar gold surfaces. Phys. Chem. Chem. Phys. 2018, 20, 332–344. [Google Scholar] [CrossRef]
- Che, J.; Çağın, T.; Goddard Iii, W.A. Generalized extended empirical bond-order dependent force fields including nonbond interactions. Theor. Chem. Acc. 1999, 102, 346–354. [Google Scholar] [CrossRef]
- Kholmurodov, K.; Abasheva, M.; Yasuoka, K. Molecular dynamics simulations of valinomycin interactions with potassium and sodium ions in water solvent. Adv. Biosci. Biotechnol. 2010, 1, 216–223. [Google Scholar] [CrossRef]
- Künneke, S.; Krüger, D.; Janshoff, A. Scrutiny of the failure of lipid membranes as a function of headgroups, chain length, and lamellarity measured by scanning force microscopy. Biophys. J. 2004, 86, 1545–1553. [Google Scholar] [CrossRef] [PubMed]
- Kim, J.; Adams, A.A.; Gokina, P.; Zambrano, B.; Jayakumaran, J.; Dobrowolski, R.; Maurel, P.; Pfister, B.J.; Kim, H.A. Mechanical stretch induces myelin protein loss in oligodendrocytes by activating Erk1/2 in a calcium-dependent manner. Glia 2020, 68, 2070–2085. [Google Scholar] [CrossRef] [PubMed]
- Moransard, M.; Bednar, M.; Frei, K.; Gassmann, M.; Ogunshola, O.O. Erythropoietin reduces experimental autoimmune encephalomyelitis severity via neuroprotective mechanisms. J. Neuroinflamm. 2007, 14, 1–13. [Google Scholar] [CrossRef] [PubMed]
- Margulies, S.S.; Thibault, L.E. A proposed tolerance criterion for diffuse axonal injury in man. J. Biomech. 1992, 25, 917–923. [Google Scholar] [CrossRef] [PubMed]
- Kleiven, S. Predictors for traumatic brain injuries evaluated through accident reconstructions. Stapp Car Crash J. 2007, 51, 81–114. [Google Scholar]
- Khalin, I.; Adarsh, N.; Schifferer, M.; Wehn, A.; Groschup, B.; Misgeld, T.; Klymchenko, A.; Plesnila, N. Size-Selective transfer of lipid Nanoparticle-Based drug carriers across the blood brain barrier via vascular occlusions following traumatic brain injury. Small 2022, 18, 2200302. [Google Scholar] [CrossRef] [PubMed]
- Walter, J.; Schwarting, J.; Plesnila, N.; Terpolilli, N.A. Influence of organic solvents on secondary brain damage after experimental traumatic brain injury. Neurotrauma Rep. 2020, 1, 148–156. [Google Scholar] [CrossRef] [PubMed]
- Moonen, S.; Koper, M.J.; Van Schoor, E.; Schaeverbeke, J.M.; Vandenberghe, R.; von Arnim, C.A.; Tousseyn, T.; De Strooper, B.; Thal, D.R. Pyroptosis in Alzheimer’s disease: Cell type-specific activation in microglia, astrocytes and neurons. Acta Neuropathol. 2023, 145, 175–195. [Google Scholar] [CrossRef]


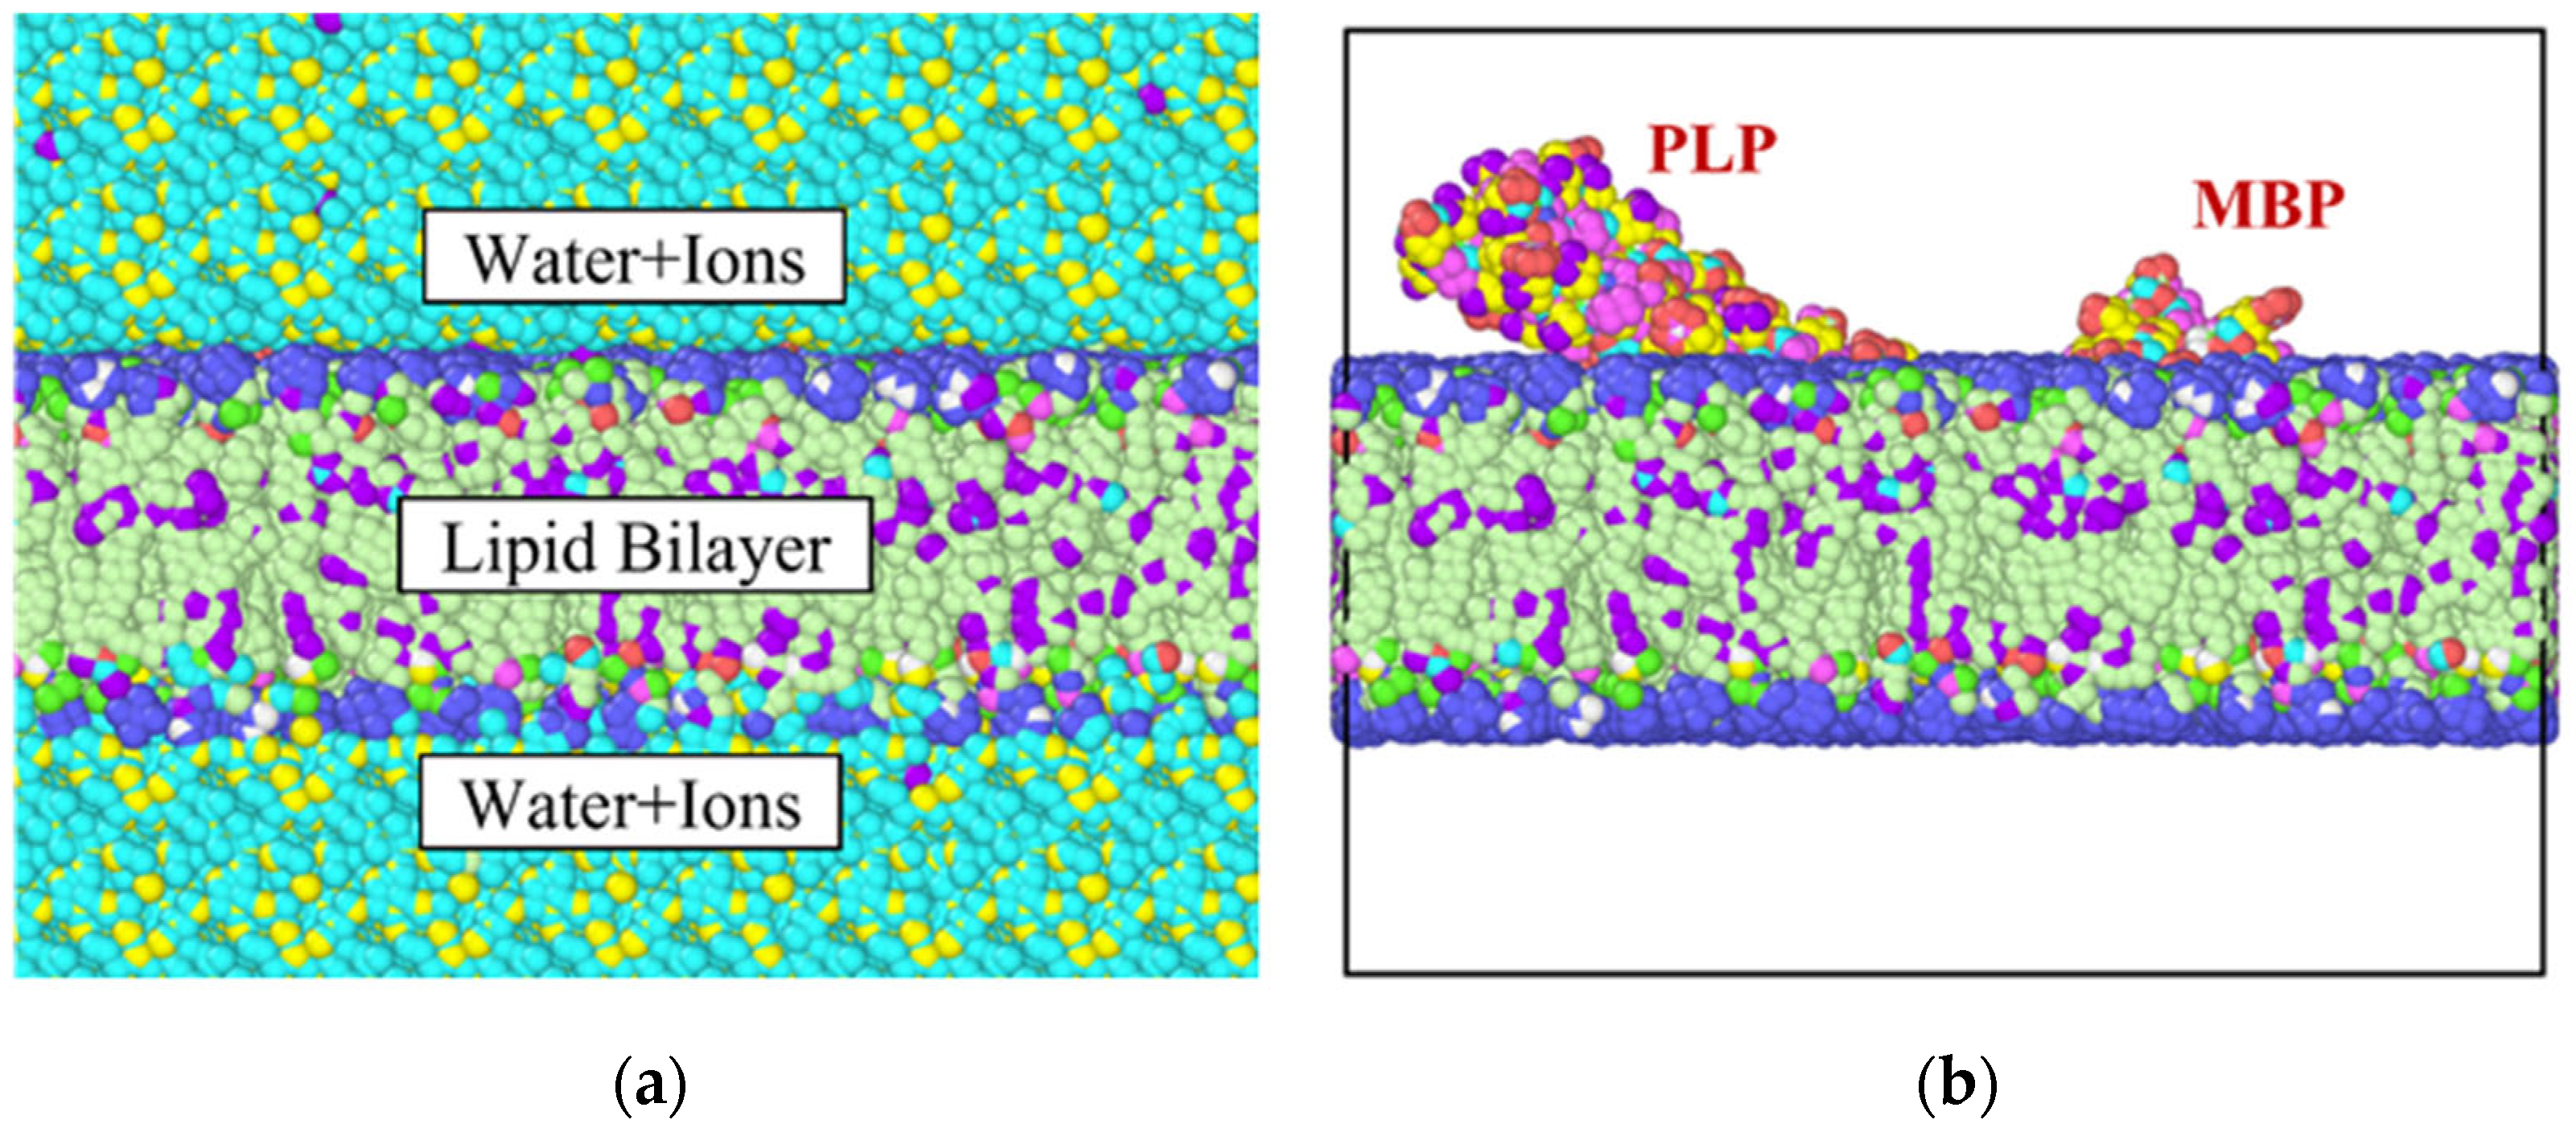
| Constituent | Composition (%) |
|---|---|
| Water | 61.24 |
| Lipid | 36.50 |
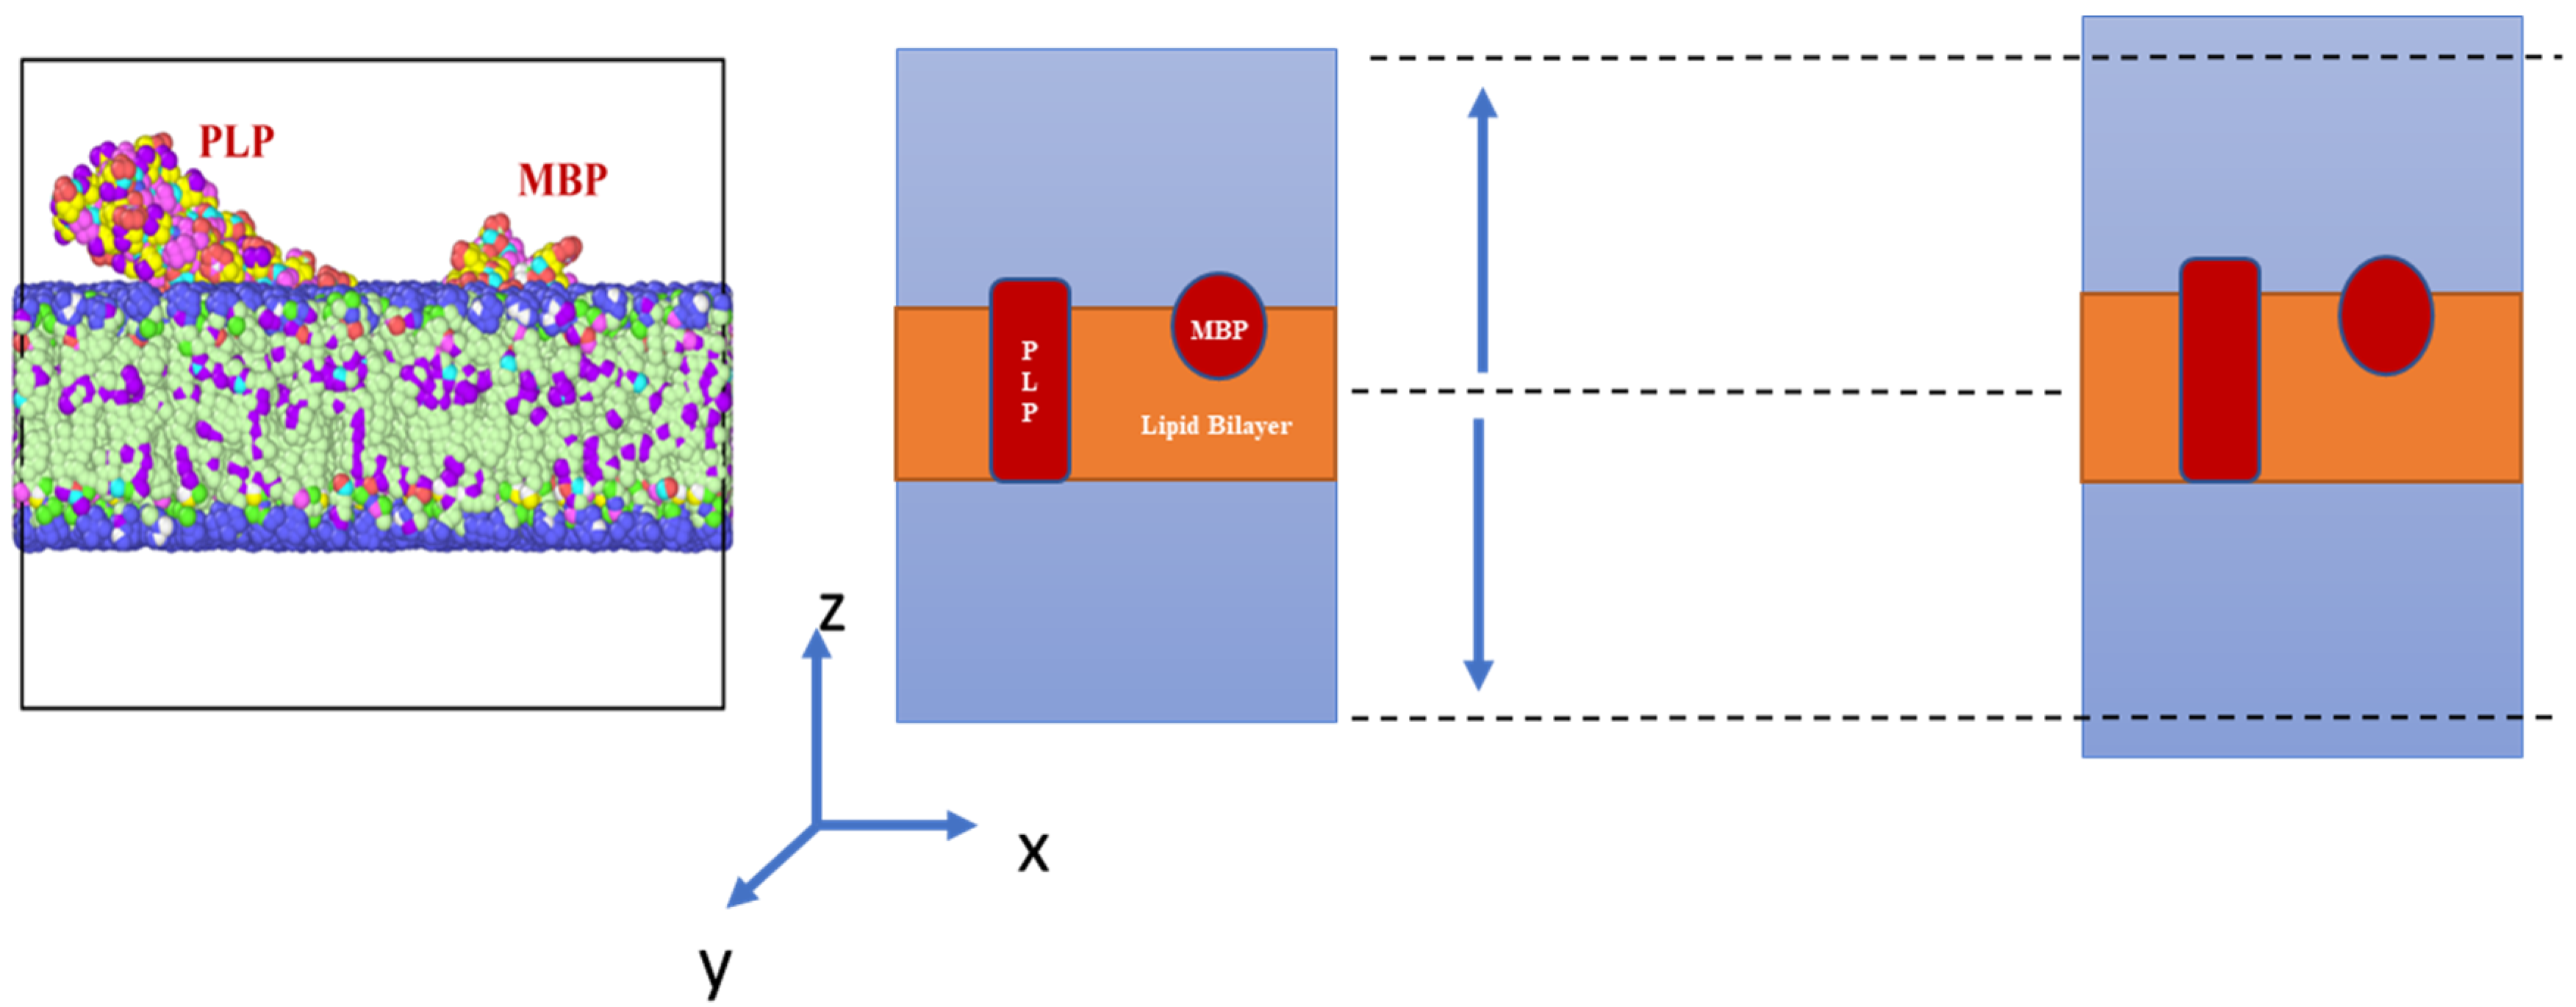
| MBP (myelin basic protein) | 0.86 |
| PLP (proteolipid protein) | 1.28 |
| Ions (K+, Cl−) | 0.12 |
| Component | Modulus of Elasticity (E) MPa | Poisson’s Ration () |
|---|---|---|
| Total system | 70.86 | 0.491 |
| Lipid bilayer and protein | 24.21 | 0.496 |
| Component | Average Tensile Stress () MPa |
|---|---|
| PLP | 63.09 |
| MBP | 64.44 |
Disclaimer/Publisher’s Note: The statements, opinions and data contained in all publications are solely those of the individual author(s) and contributor(s) and not of MDPI and/or the editor(s). MDPI and/or the editor(s) disclaim responsibility for any injury to people or property resulting from any ideas, methods, instructions or products referred to in the content. |
© 2023 by the authors. Licensee MDPI, Basel, Switzerland. This article is an open access article distributed under the terms and conditions of the Creative Commons Attribution (CC BY) license (https://creativecommons.org/licenses/by/4.0/).
Share and Cite
Maliha, F.; Adnan, A. Mechanical Responses of a Single Myelin Layer: A Molecular Simulation Study. Biomolecules 2023, 13, 1525. https://doi.org/10.3390/biom13101525
Maliha F, Adnan A. Mechanical Responses of a Single Myelin Layer: A Molecular Simulation Study. Biomolecules. 2023; 13(10):1525. https://doi.org/10.3390/biom13101525
Chicago/Turabian StyleMaliha, Fairuz, and Ashfaq Adnan. 2023. "Mechanical Responses of a Single Myelin Layer: A Molecular Simulation Study" Biomolecules 13, no. 10: 1525. https://doi.org/10.3390/biom13101525
APA StyleMaliha, F., & Adnan, A. (2023). Mechanical Responses of a Single Myelin Layer: A Molecular Simulation Study. Biomolecules, 13(10), 1525. https://doi.org/10.3390/biom13101525