Abstract
Background: Epitranscriptomic mechanisms, such as A-to-I RNA editing mediated by ADAR deaminases, contribute to cancer heterogeneity and patients’ stratification. ADAR enzymes can change the sequence, structure, and expression of several RNAs, affecting cancer cell behavior. In glioblastoma, an overall decrease in ADAR2 RNA level/activity has been reported. However, no data on ADAR2 protein levels in GBM patient tissues are available; and most data are based on ADARs overexpression experiments. Methods: We performed IHC analysis on GBM tissues and correlated ADAR2 levels and patients’ overall survival. We silenced ADAR2 in GBM cells, studied cell behavior, and performed a gene expression/editing analysis. Results: GBM tissues do not all show a low/no ADAR2 level, as expected by previous studies. Although, different amounts of ADAR2 protein were observed in different patients, with a low level correlating with a poor patient outcome. Indeed, reducing the endogenous ADAR2 protein in GBM cells promotes cell proliferation and migration and changes the cell’s program to an anchorage-independent growth mode. In addition, deep-seq data and bioinformatics analysis indicated multiple RNAs are differently expressed/edited upon siADAR2. Conclusion: ADAR2 protein is an important deaminase in GBM and its amount correlates with patient prognosis.
1. Introduction
Glioblastoma (GBM) is a common malignant highly aggressive brain tumor in humans affecting both children and adults that accounts for about 80% of malignant gliomas [1]. Patients diagnosed with GBM have a poor prognosis with an average survival time of 12–18 months after diagnosis [2].
A-to-I RNA editing is one of the most common epitranscriptomic events in humans and is emerging as an important player in cancer, acting as one of the primary sources of tumor heterogeneity [3,4,5,6]. A-to-I RNA editing changes nucleotides within double-stranded RNAs (dsRNAs) thanks to the action of ADAR (Adenosine DeAminases acting on RNA) enzymes. This epitranscriptomic modification can modulate both the sequence and level of RNAs by changing the splicing pattern, codons, RNA folding, and microRNA levels [7].
There are three ADAR proteins in mammals, ADAR1 (also known as ADAR), ADAR2 (also known as ADARB1), and ADAR3 (also known as ADARB2), that share a similar protein structure [8,9,10].
In mammals, ADAR2 is crucial for the generation of different protein isoforms starting from the same mRNA in the central nervous system [11,12], and accumulating studies are now underlining the importance of ADAR2-mediated editing in key RNAs (coding and non-coding) involved in several diseases affecting the brain [13,14,15], with its role now emerging in different cancers [16,17,18,19,20,21,22].
More than a thousand recoding sites were identified in humans [23,24], particularly in neuronal tissues. Recently, a weighted average over all known recoding sites, known as the recoding editing index (REI), has been introduced that well correlates with the ADAR2 RNA level [5,25,26].
Several ADAR2 substrates have been identified to be central in GBM, acting over cell cycle checkpoints [17,19] or modulating cell migration/invasion behaviour [5,27]. Nevertheless, we are still far from having a complete picture of the role played by ADAR2 in GBM. Herein, we added a new piece of the puzzle by analyzing the distribution and expression of ADAR2 protein in tissues of GBM patients and exploring the role played by the endogenous ADAR2 deaminase in GBM cells.
2. Results
2.1. The ADAR2 Protein Level Correlates with GBM Patients’ Outcome
Previous studies demonstrated that the ADAR2 mRNA level is extremely low compared with normal brain or astrocytes [5,28]; however, poor information concerning ADAR2 protein in GBM tissues is available. Moreover, our recent study demonstrated consistent differences between RNA and protein levels regarding the other active deaminase ADAR1 [29].
We then analyzed the ADAR2 protein level and localization in GBM tissues (39 samples) from a cohort of homogeneously treated patients (Supplementary Table S1) by performing a series of immunohistochemistry (IHC) experiments. As a result, we found that ADAR2 protein is differently expressed among patients, with several GBM tissues (21 samples) showing low or no ADAR2 while others (18 samples) displayed a high protein level (Figure 1a). Of note, ADAR2 protein, when expressed, correctly localizes within the cell nuclei of the tumor tissues.
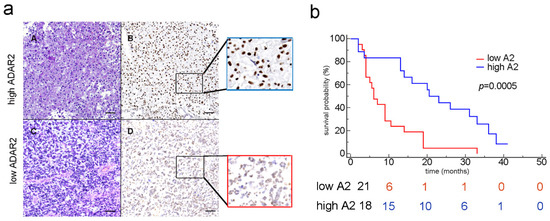
Figure 1.
ADAR2 correlates with patients’ overall survival. (a) IHC analysis (H&E and the corresponding ADAR2 antibody staining) of two glioblastoma tissues (examples of high and low ADAR2 levels). Subpanels A and B show a representative GBM case with high ADAR2 expression; in subpanels C and D, a GBM case with low ADAR2 expression is shown; scale bar: 200 µm. (b) Kaplan–Meier curve comparing the survival of GBM patients (n = 39) stratified by ADAR2 levels. The red and blue lines represent low and high ADAR2 expression, respectively, following the scores indicated in Material and Methods (p = 0.0005; HR 3.954; 95% CI from 1834 to 8525).
Considering patient survival curves and ADAR2 protein (Kaplan–Meier analysis), we found that patients showing a low level of ADAR2 (score between 0 and 3, see Materials) exhibited a poor outcome (p = 0.0005) (Figure 1b, red line). The risk table indeed confirmed that, within ten months post-diagnosis, those patients showing low ADAR2 survived less (6 patients) than those who expressed a high level of ADAR2 (15 patients), and these differences were maintained over time (Figure 1b). However, no significant correlation was observed if the RNA of ADAR2 was analyzed by interrogating The Cancer Genome Atlas (TCGA) for the glioblastoma patient cohort (data not shown).
Overall, we show that ADAR2 protein is heterogeneously expressed among patients’ tissue samples and, when present, is correctly localized within the cells’ nuclei. Moreover, the ADAR2 protein level, but not its transcript, inversely correlates with the patients’ overall survival.
2.2. ADAR2 Loss Is Sufficient to Switch Cell Program to an Anchorage-Independent Growth Mode
We analyzed the endogenous ADAR2 level (mRNA and protein) in several human GBM cell lines (A172, T98G, U118MG, U87MG, LN18, and U138-MG) that show diverse abilities to give rise to a growing tumor mass if implanted in a mouse model (www.atcc.org, accessed on 1 January 2022) (Figure 2a,b).
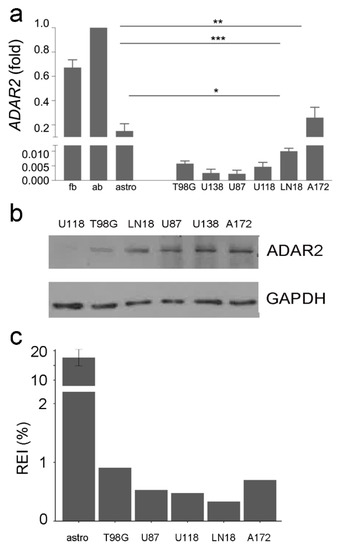
Figure 2.
ADAR2 expression level and activity across GBM cell lines. (a) ADAR2 expression (qRT-PCR) in normal brain (fetal and adult), astrocytes, and glioblastoma cell lines (T98G, U138-MG, U87-MG, U118-MG, LN-18, and A172). Ct values were normalized to GAPDH mRNA levels. Mean ± standard deviation (n = 3), values are representative as means ± SD, * p ≤ 0.05; ** p ≤ 0.01; *** p ≤ 0.001. Of note, ADAR2 activity is more robust in the whole brain (either adult or fetal) because of neuronal cells, where ADAR2 is highly active. (b) Western blotting analysis showing the ADAR2 level in glioblastoma cell lines. No control was added as the ADAR2 level was too high. (c) The recoding editing index (REI) in normal astrocytes (×10), T98-G, U87-MG, U118-MG, LN-18, and A172 glioblastoma cells lines is shown. REI values were calculated as the weighted average of editing levels over all known recording sites from the highly accurate list.
The ADAR2 editing activity in the cell lines was also investigated by RNA-Seq analysis, calculating the overall A-to-I editing events at the recoding sites (REI-index) (Figure 2c). Despite an overall decrease in ADAR2 expression/activity compared with controls, we found differences among GBM cell lines with discrepancies between RNA, protein and activity levels (Figure 2). The A172 cells, a non-tumorigenic cell line, display a high ADAR2 level and activity among cells (Figure 2). In contrast, the highly aggressive U87MG and U118MG cell lines show a low ADAR2 level and activity (Figure 2).
To investigate whether ADAR2 levels may reflect distinctive cancer cell profiles, we evaluated cell proliferation fluctuations upon ADAR2 silencing in representative cell lines. First, we silenced at a similar extent (fold) the endogenous ADAR2 in A172 cells (ATCC, CRL-1620) and U87MG (ATCC, HTB-14). Decreased levels of ADAR2 enhanced cell proliferation in both cell lines (Figure 3a,b, Supplementary Figure S1a). Then, we generated stable clones of siADAR2 in A172 cells (an attempt that failed in all the other cell lines), and clones expressing ADAR2 at different levels were selected. We found that an ADAR2 progressive decrease leads to a gradual increase in cell proliferation, with the minimal ADAR2 level corresponding to the more aggressive cell behavior in terms of cell proliferation (Figure 3c, Supplementary Figure S1b).
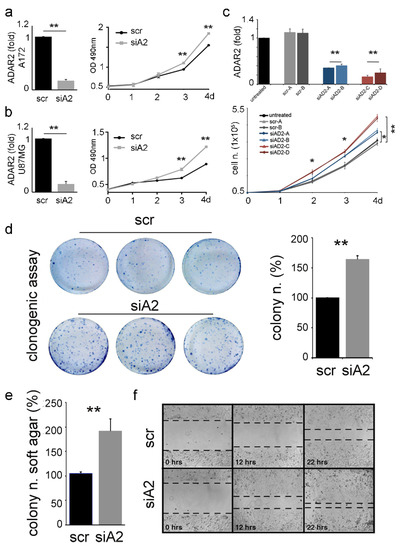
Figure 3.
ADAR2 loss promotes proliferation, migration, and anchorage-independent growth of cancer cells. ADAR2 knockdown (qRT-PCR at 96 h, on the left) and cell proliferation (MTS, on the right) are shown in A172 (a) and U87-MG (b) cell lines. Ct values were normalized to GAPDH mRNA levels. Mean ± standard deviation (n = 3), t-test p < 0.01 **. (c) ADAR2 mRNA in A172 untreated cells (black), scrambles (SCR-A, -B in light and dark grey), and different levels of ADAR2 knockdown (siAD2-A,-B in light and dark blue; siAD2-C,-D in light and dark red) are shown in A172 cells. Mean ± standard error of mean (s.e.m.) p < 0.01 **. Ct values were normalized to β-actin levels. The expression levels were calculated as a relative-fold increase compared with the untreated cells arbitrarily set to 1. Below, 5 × 10⁴ of A172 un-transfected (untreated), A172 scramble (SCR-A and SCR-B), and silenced ADAR2 cells (siAD2-A, -B, -C, -D) were seeded and proliferation was monitored over 4 days. Mean ± s.e.m (n = 3), t-test, p < 0.05 *, p < 0.01 **. (d) Colony formation ability of A172 scramble (scr) and siADAR2 (siAD2) cells 10 days post-seeding (left panel, a photograph of three representative plates per cell line) quantification is shown on the right, mean ± standard deviation (n = 4), t-test, p < 0.01 **. (e) siADAR2 and control cells were seeded (2 × 10⁵ cells/well) to monitor the formation of anchorage-independent colonies after 15 days. Mean ± standard deviation (n = 3), t-test p < 0.01 **. (f) Representative photographs of scramble (scr) and siADAR2 (siAD2) A172 cells at 0, 12, and 22 hours after scratching the surface of a monolayer of cells. The wound-healing assay was performed within an interval time in which the cells do not divide.
Stable siADAR2-A172 (with >50% decreased ADAR2 level, Supplementary Figure S1c) and control were generated and tested for their ability to grow in an anchorage-dependent and -independent mode. We report that a significantly higher number of anchorage-dependent colonies were generated by siADAR2 cells (Figure 3d), and this is independent of the cell number seeded (1000 or 1500 cells/well) (data not shown). Then, we tested whether the silenced cells also acquired the ability to grow independently of a solid surface. To this aim, we performed a soft-agar colony-formation assay, and cells were seeded and left to grow for two weeks. The assay indicated a significantly higher number of colonies in the siADAR2 cells (doubling their number) than the control (Figure 3e). Finally, we found that siADAR2 cells showed higher migratory behavior than control cells (Figure 3f).
Overall, our data indicate that ADAR2 loss switches cell programs towards a more aggressive cell behavior and an anchorage-independent growth mode.
2.3. Modulation of Cancer-Related Genes upon ADAR2 Silencing
To identify genes being modulated/edited by ADAR2 in siADAR2 GBM cell lines, we performed deep-sequencing analysis of RNA extracted from controls and siADAR2 A172 and U87MG cells. Three replicates were sequenced for each condition in both cell lines, from which some “outliers” were discarded on the basis of the sample-to-sample distance matrix (Supplementary Figure S2a). Bioinformatics analysis of RNA-Seq data highlighted the presence of 1339 and 987 transcripts significantly modulated (FDR ≤ 0.05) in both cell lines, respectively (Figure 4a and Supplementary Table S2). We concentrated on genes significantly overexpressed in both cell lines following ADAR2 silencing. Using gene list enrichment analysis tools (i.e., Enrichr [30]), we found some shared molecular pathways belonging to specific cancer signatures, such as hypoxia, glycolysis, and epithelial–mesenchymal transition pathways, with the latter being the most representative one, with seven genes (Figure 4b). Interestingly, among the seven genes upregulated by ADAR2 in both of the GBM cell lines appeared ADAM12, MMP1, and SERPINE1, which were recently identified as key extracellular matrix (ECM) regulator genes in several cancer types [31]. Moreover, ADAM12 was previously identified among the ADAR2-edi-miR-589-3p-modulated genes [16]. Together with ADAM12, the glycoprotein pentraxin-3 (PTX3) is also a critical protein promoting cell invasiveness of various cancers [32]. Therefore, we validated by qRT-PCRs the expression of both ADAM12 and PTX3 in siADAR2 glioblastoma cells (A172 and U87MG) (Figure 4c).
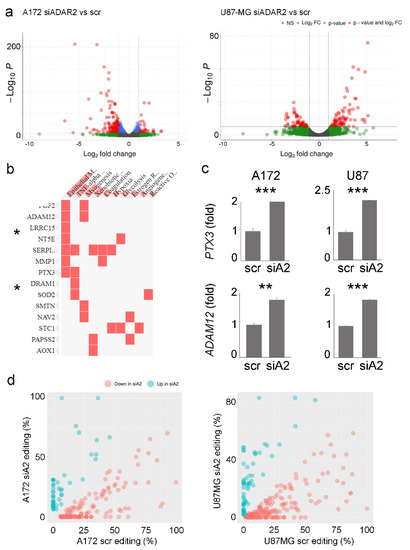
Figure 4.
Gene expression profile and RNA editing pattern changes upon ADAR2 silencing. (a) Volcano plots showing the effect of ADAR2 silencing on the A172 and U87-MG cell lines transcriptome in terms of significance levels and fold changes in gene expression as calculated by DESeq2. The cut-off for log2FC is >|2| and the cut-off for the p.adj value is 1 × 10⁻⁶. (b) Gene enrichment analysis showing the pathways in which common genes are significantly upregulated in A172 siADAR2 and U87MG siADAR2, * p < 0.05. (c) qRT-PCR showing the expression levels of PTX3 and ADAM12 transcripts in control and siADAR2 A172 and U87-MG cells. Mean ± standard deviation t-test, ** p ≤ 0.01, *** ≤ 0.001. (d) Scatter plots reporting the editing levels (%) for sites significantly (t-test, p-value < 0.05) modulated between scramble (scr) versus silenced ADAR2 (siA2) cell lines. The under-edited sites in siADAR2 are shown in light red, while the upregulated sites are shown in cyan.
A genome-wide screening of the RNA editing profile in both A172 and U87MG cell lines (siADAR2 and controls) was also performed. Taking advantage of the strand-oriented feature of the analyzed RNA-Seqs, de novo research of the edited sites was performed with an (as expected) enrichment of A/G mismatches to indicate a good signal-to-noise ratio (Supplementary Figure S2b). As a result, we identified 218 and 243 differentially edited sites in siADAR2 and controls in A172 and U87MG cell lines, respectively (t-test, p-value < 0.05), with most of the sites showing a significant decrease in editing (Figure 4d and Supplementary Table S3). Almost all of the modulated sites are localized within Alu repeats with a preferential enrichment in the 3’UTR according to the Gencode v40 annotation.
3. Discussion
Glioblastoma is a fast-growing malignant brain tumor still incurable in both children and adults. Genetic and epigenetic alterations are key mechanisms in GBM development and dictate the criteria for cancer classification by altering both sequences and expression of target transcripts [33,34,35]. Additionally, recent studies underlined the essential role of epitranscriptomic mechanisms in cancer, such as A-to-I RNA editing mediated by the active ADAR enzymes (ADAR1–2) [36]. By introducing Inosines within the target genes, editing enzymes alter the sequence, splicing, folding, transport, binding, and expression of multiple RNAs. Therefore, A-to-I RNA editing events can contribute to cancer heterogeneity and progression [3,5]. ADAR2 RNA level and editing activity are decreased in GBM compared with controls [5,17,18,28,37], and several ADAR2 target genes have been identified as critical players in GBM proliferation/migration, indicating ADAR2 editing to be an important event to inhibit GBM progression [5,16,27]. On the contrary, the ADAR1 protein upregulation, promoted by METTL3, plays a protumoral role in GBM, yet in an editing-independent mode [29].
Previous studies on RNA editing and cancers are mainly based on the whole transcriptome analysis of homogenized tissues (including different cell types) and reported as the average of multiple patients’ tissues; however, this approach can mask differences among different patients and among diverse tissues/cells and does not take into consideration the ADAR protein level.
Indeed, there is a lack of studies on the ADAR2 protein expression pattern in GBM tissues, in the light of recent research underlining discrepancies between the RNA/protein of the other active human deaminase ADAR1 [29] and in Drosophila dADAR [38].
Herein, we performed IHC on GBM samples and found that ADAR2 protein is heterogeneously expressed among different patients, with some cancer tissues showing low or no ADAR2, and others presenting a high protein level that is correctly localized within cell nuclei. This finding is quite surprising as a substantial overall decrease in ADAR2 RNA has been previously reported. Moreover, we show that the ADAR2 protein level, but not its RNA, inversely correlates with patients’ overall survival, identifying ADAR2 protein as a possible prognostic factor.
Discrepancies between protein and RNA of ADAR2 and GBM patients’ survival could be explained by taking into account different factors: (1) the expression of the ADAR2 protein in the nucleus was analyzed only in the cancer cells, while TCGA evaluates the overall expression of ADAR2 RNA in the tumor mass; (2) the patients we analyzed are part of a unicentric cohort of GBM patients with a homogeneous clinical-therapeutic treatment, differently from the TCGA cohort; and (3) post-transcriptional modification events can introduce differences between the ADAR2 transcript and its protein, as recently shown with ADAR1 [29]. Yet, future studies on a larger cohort of GBM patients will be necessary to further investigate what is reported herein.
Together with GBM tissues, different patterns of ADAR2 protein levels were also detected among GBM cell lines. Decreasing the endogenous ADAR2 levels is sufficient to accelerate cell proliferation regardless of the original ADAR2 protein level. Moreover, cells showing non-tumorigenic ability in vivo and high ADAR2 protein levels can switch from an anchorage-dependent to an anchorage-independent growth mode by decreasing the ADAR2 level.
Deep-sequencing analysis of scr and siADAR2 in A172 and U87MG cell lines highlighted the presence of genes modulated in both cell lines and belonging to the hypoxia, glycolysis, and epithelial–mesenchymal transition pathways, being significantly upregulated upon ADAR2 silencing. Both PTX3 and ADAM12 are among the upregulated genes in siADAR2 cells (in both A172 and U87MG cell lines), and both of these genes belong to the epithelial–mesenchymal transition pathways. The overexpression of ADAM12 upon ADAR2 silencing fitted well with previous results indicating ADAM12 as an indirect ADAR2 target gene [16]. Indeed, ADAR2 edits at an extremely high level (almost 100%) the miR-589-3p within its seed sequence in the normal brain, while a consistent editing decrease at this site is observed in glioblastoma. The edited version of miR-589-3p targets and inhibits ADAM12, while the loss of editing releases ADAM12 transcript, which can be expressed, increasing cell invasion and proliferation. We analyzed miRNome from scr and siADAR2 cell line (A172) and found a significant reduction in editing events within the miR 589-3p seed (data not shown).
We reported that ADAR2 can control the level of the glycoprotein pentraxin-3 (PTX3). PTX3 is a promoter of cell invasiveness and is involved in the progression of various cancers, including glioblastoma, where it correlates with the disease grade [39], thanks to its downstream target genes involved in migration and invasion [40]. This is the first study showing an epitranscriptomic control of PTX3 that can be of great interest for a better understanding of the role/action of PTX3 in different cancers and for future therapeutic interventions crossing immunity, tissues remodeling, and cancer [41]. Indeed, epitranscriptomic changes, which include multiple RNA modification events, is emerging as an important player in cancer [42].
GBM is characterized by highly invasive and infiltrative cells, leading to tumor recurrence and poor prognosis. Herein, we demonstrated that ADAR2 could be a possible prognostic factor and a potential therapeutic target as it inhibits key cancer features and controls multiple essential genes important to GBM progression.
4. Materials and Methods
4.1. Human Tissues
This study includes a unique collecting center including a cohort of 39 unselected adult patients, collected from 2018 to 2019, with GBM in the supratentorial compartment. Patients underwent craniotomy for tumor resection at the Institute of Neurosurgery (Policlinico “A. Gemelli”, IRCCS, Catholic University of Sacred Heart, Rome, Italy) with the histology confirmed GBM (World Health Organization grade IV; Università Cattolica del Sacro Cuore di Roma, UCSC). Immunophenotypical characterization, as well as molecular analysis of O6-methylguanine-DNA methyltransferase (MGMT) promoter methylation and isocitrate dehydrogenase 1 or 2 (IDH1/IDH2) mutation, were assessed as previously described [43]. The patients were treated postoperatively homogeneously with adjuvant radiotherapy and temozolomide (TMZ, Stupp protocol). Patients, aged from 42 to 72 years at the time of primary surgery, received radiotherapy and concomitant TMZ followed by six cycles of adjuvant TMZ according to the Stupp protocol [43]. The main clinical and biological features of the GBM patients are reported in Supplementary Table S1. All patient data were collected anonymously; written informed consent, as part of the routine diagnosis and treatment procedures, was obtained from patients or their guardians according to the Declaration of Helsinki; and the study adhered to good clinical practice guidelines. Overall survival (OS) was calculated from the date of surgery when a diagnosis of GBM was established until death.
4.2. Cell Culture and ADAR2 Knockdown
The well-characterized human glioblastoma cell lines T98G, U138MG, U87MG, U118MG, LN18, and A172 were obtained from American Type Culture Collection (ATCC) and routinely maintained in Dulbecco’s modified Eagle’s medium (DMEM) supplemented with 10% fetal bovine serum (Gibco-Life Technologies, Carlsbad, CA, USA), 100 U/mL penicillin, and 100 μg/mL streptomycin at 37 °C in 5% CO2. All of the cell lines originated from adult male patients. Human primary astrocytes (NHA–Human Astrocytes, CC-2565, Lonza Group AG, Basel, Swiss) were maintained for a few passages in ABMTM astrocyte cell basal medium following the manufacturer’s instructions. Both fetal (cat n. 636530) and adult (cat n. 636526) human brain RNA were obtained from Clontech-Takara, Kyoto, Japan. For ADAR2 transient silencing in A172 and U87MG cells, the ADAR2 siRNA pool (ON-TARGETplus SMARTpool for the siRNA, 1: GCCCAGGACUCAAGUAUGA, 2: GCAAUGGCCACUCCAAGUA, 3: GGAGAUCCUUGCUCAGAUU, and 4: ACAUGAACUGAACGGUUAA) and the negative control pool (ON-TARGET Plus Nontargeting pool, 1: UAGCGACUAAACACAUCAA, 2: UAAGGCUAUGAAGAGAUAC, 3: AUGUAUUGGCCUGUAUUAG, and 4: AUGAACGUGAAUUGCUCAA) were used in accordance with the manufacturer’s instructions (Dharmacon). The BLOCK-iTTM inducible Pol II miR RNAi Expression Vector Kit by EmGFP (Invitrogen, Waltham, MA, USA) was used to obtain stable A172 cell lines silenced for ADAR2 and its control. The specific sequence (UAAUCUUGGAGCGUAGUAAGU) to silence ADAR2 (selected by Block-iT RNAi Designer) and the scramble sequence (provided by the kit) were cloned in the pcDNATM6.2-GW/EmGFP-miR vector according to the manufacturer’s instructions. A172 cells were transfected with Lipofectamine 2000 (Invitrogen-Life Technologies). For stable clones, the cells were maintained under blasticidin selection (20 μg/mL). Immediately after transfection, cells were selected according to their GFP expression units (MIF = mean index fluorescent).
4.3. RNA Isolation
Total RNA was isolated using TRIzol reagent (Invitrogen, Waltham, MA, USA). The procedure was performed according to the manufacturer’s recommendations. RNA concentration and purity (A260/A280 nm ratio) were evaluated using a NanoDrop ND-2000 (Thermo Scientific, Waltham, MA, USA). RNA quality was assessed by gel electrophoresis or by an Agilent 2100 Bioanalyzer microfluidics-based platform (Agilent Technologies, Santa Clara, CA, USA).
4.4. Real-Time PCR (qRT-PCR)
Here, 1 μg of total RNA (pre-treated with DNase I) was used to generate cDNA by the ImProm-II Reverse Transcription System (Promega Corporation, Madison, WI, USA) using random hexamer primers according to the manufacturer’s instructions. GAPDH and/or β-Actin were used as controls for the normalization of mRNAs. The relative amount of each substrate was calculated by the 2−ΔΔCt method [44]. Expression levels were represented as a relative-fold increase compared with the control sample, arbitrarily set to 1. All qRT-PCR reactions were performed in duplicates and repeated at least two times from independent experiments. All of the primers were supplied by Applied Biosystems: ADAR2, ID Hs00953730_m1; GAPDH, ID Hs99999905_m1; β-actin, ID Hs99999903_m1; ADAM12, ID Hs01106101_m1; and PTX3, ID Hs00173615_m1.
4.5. Immunoblotting
Total protein extracts were isolated with RIPA lysis buffer in the presence of a protease inhibitor mixture and phosphatase inhibitor cocktail (Sigma-Aldrich, Burlington, MA, USA). Protein extracts were quantified with BCA Protein Assay Kit (Pierce Biotechnology, Inc., Waltham, MA, USA). Equal amounts of total cellular lysates (30 μg) were separated by SDS-PAGE, transferred on nitrocellulose membrane, analysed by immunoblotting with the appropriate antibodies, and then revealed by ECL (GE Healthcare). The antibodies used in this study were anti-ADAR2 (1:200, Sigma-Aldrich, Burlington, MA, USA) and anti-β-actin (1:5000, Santa Cruz Biotechnology, Santa Cruz, CA, USA).
4.6. Immunohistochemistry
Formalin-fixed, paraffin-embedded sections (3 μm thick) were mounted on positively charged glass slides. Deparaffinization and antigen retrieval were performed using the PT link instrument (Agilent Dako, Santa Clara, CA, USA) and the EnVisionTM FLEX, low pH solution (Agilent Dako, Santa Clara, CA, USA). Endogenous peroxidase was blocked by hydrogen peroxide (Sigma-Aldrich, Burlington, MA, USA), and then sections were incubated ON at 4 °C with mouse monoclonal antibody anti-ADAR2 (1.3.1): sc-73409, 1:100 dilution (Santa Cruz Biotechnology, Santa Cruz, CA, USA) followed by EnVision FLEX/HRP (Agilent Dako, Santa Clara, CA, USA). 3,3′-Diaminobenzidine was used as the enzyme substrate to observe the specific antibody localization, and Mayer hematoxylin was used as a nuclear counterstain. The staining intensity of tissue slides was evaluated independently by two observers (V.C. and M.M.) who were blinded to the patients’ characteristics and survival, as previously described [29]. Cases with disagreement were discussed using a multi-headed microscope until agreement was achieved. To assess differences in staining intensity, an immunoreactivity scoring system was applied. ADAR2 expression in each specimen was scored according to the extent (percent of stained cells) and intensity of nuclear expression staining. The score for the percentage of stained cells was scaled as 0 for no IHC signal at all, 1 for 1–30%, 2 for 31–70%, and 3 for 71–100% of tumor cells stained. The score for IHC intensity was scaled as 0 for no IHC signal, 1 for weak, 2 for moderate, and 3 for strong IHC signals. The final score used in the analysis was calculated by multiplying the extent score and intensity score, with a maximum score equal to 9. An immunohistochemical score between 0 and 3 was defined as a low protein expression level, while a score from 4 to 9 was defined as a high protein expression level.
4.7. Statistical Analysis
The statistical analyses were performed using two-tailed Student’s t-test and the values are represented as means ± SD, and statistical significance was set at p ≤ 0.05. Kaplan-–Meier survival curves were plotted and differences in survival between groups of patients were compared using the log-rank test and Gehan–Breslow–Wilcoxon performed by GraphPad Prism 7 software. Overall survival (OS) was calculated from the date of surgery to death or end of follow-up. Experiments were repeated independently multiple times and similar results were obtained.
4.8. MTS Colorimetric Assay
Here, 2 × 10³ cells/well were seeded onto a 96-well plate and cell proliferation was measured daily by3-(4,5-dimethylthiazol-2-yl)-5-(3-carboxymethoxyphenyl)-2-(4-sulfophenyl)-2H-tetrazolium inner salt (MTS) using CellTiter 96 AQueous One Solution Cell Proliferation Assay (Promega Corporation, Madison, WI, USA). The absorbance intensity was determined on a microplate reader at 490 nm. The assay was repeated three times in triplicate.
4.9. Proliferation and Clonogenic Assay
Here, 5 × 10⁴ cells were seeded in 35 mm dishes and live cells (Trypan blue dye exclusion) were determined daily, from day 1 to day 4. The assay was repeated at least three times in duplicate. To evaluate cell colony-forming ability, cells were seeded in 60 mm dishes with 1000 or 1500 cells per dish and, after 10 days, the colonies were stained with methylene blue and counted (>50 cells equaled one colony). The assay was repeated four times in triplicate.
4.10. Soft Agar Assay
The knocked-out ADAR2 and control cells were mixed with DMEM (10% FCS) medium containing 0.33% Noble agar (Sigma-Aldrich, Burlington, MA, USA). Then, 2 × 10⁵ cells were re-suspended and seeded in triplicate into six-well plates coated with 0.5% agar in DMEM (10% Fetal Calf Serum). After solidification at room temperature, plates were incubated in a 5% CO2 incubator at 37 °C for 15 days and the medium was refreshed every 5 days. The number of colonies per field was counted under the contrast-phase Eclipse E600 microscope (Nikon Corporation, Tokyo, Japan). Two independent experiments were carried out in triplicate.
4.11. Monolayer Wounding Assay
For the evaluation of in vitro cell motility, a monolayer-wounding assay was performed. Cells were allowed to form a monolayer on a culture dish surface and, when they were approaching 100% cell confluence, a wound was made by scratching the monolayer with a pipette tip. After the scratching, the cells were incubated in 5% CO2 at 37 °C for a further 24 h. Photographs (10× magnification using Leica DMi8 microscope) of the wound were taken at various time points. Three independent series of experiments were performed. The wound area was measured by the program Image J software (NIH, Bethesda, MD, USA). The percentage of wound closure was estimated by the following equation: wound closure % = [1 − (wound area at Tt/wound area at T0)] × 100%, with T0 being the time immediately after wound and Tt being the time 12 h post-wound.
4.12. Bioinformatic Data Analysis
RNA-seq experiments from normal astrocytes from the adult temporal lobe (ten biological replicates) and glioblastoma cell lines (A172, U87MG, U118MG, LN18, and T98G) were downloaded from the NCBI SRA portal, respectively, as part of the SRP064454 dataset [45] and the Cancer Cell Line Encyclopedia (SRP186687) project, and transformed into fastq files. mRNA-sequencings for the ADAR2-silenced A172 and U87MG glioblastoma cell lines were performed with a stranded and paired-end protocol on the Illumina NextSeq 500 platform at GenomiX4Life, thus obtaining ~80 million total reads per sample (2 × 75 bp). All of the preprocessing steps to trim the adapters and remove the low-quality reads were performed with the dedicated fastp [46] tool version 0.23.2. The mean quality per base was fixed at a phred-score of 20 and reads with more than 30% of unqualified bases (-q20 -u30-l55 --detect_adapter_for_pe) were removed. Reads shorter than 55 bases were also removed. GRCh38/hg38 human reference genome was used for all analyses. Cleaned reads were aligned with STAR (2.7.9a) [47] using the ENCODE standard options onto a consensus version of the reference (GRCh38) human genome. The 1000 Genomes Project VCF file with consensus SNVs and InDels was provided at the genome generation stage and the alternative alleles in this VCF were inserted to the reference genome to create a ”transformed” genome. At the mapping stage, the reads were mapped to the transformed genome and the alignments were transformed back to the original (reference) coordinates. Alignments in BAM format were sorted by genomic coordinates and indexed by SAMtools. PCR duplicates were marked using Picard tools (MarkDuplicates) version 2.25.4 and considered only for RNA editing analysis. Gene expression analysis: quantification was obtained with the featureCounts tool of the Subread [48] 2.0.2 package (parameters ‘--countReadPairs’ and ‘-p’) and the gencode annotation v40. The counts’ normalization and differential gene expression analysis were performed using the well-known Bioconductor package in R DESeq2 [49] version 1.36.0, following the manufacturer’s instructions. Gene set enrichment analysis was performed using the Enrichr web tool [50].
RNA editing analysis: candidate RNA editing sites were detected using a slightly modified version of the protocol recently published by Lo Giudice and Picardi [25] based on the REDItools [51] python suite and the use of a differential filtering scheme with RNA editing candidates in repetitive non-Alu regions and non-repetitive regions undergoing more stringent filters compared with those applied for sites in Alu repetitive elements. Briefly, after the first round of the REDItoolDnaRna script and subsequent filtering (sites reported in dbSNP v.151 or cell lines specific somatic mutations obtained from CCLE were removed), reads harboring the variations were extracted and re-aligned using PBLAT [52]. The putative editing sites obtained were further subjected to a second run of REDItool excluding duplicated reads and sequences known to align on multiple genome locations by Blat. The remaining A-to-G variants were finally annotated using ANNOVAR and Gencode genes. Differential editing analysis was performed by comparing editing levels in controls and siADAR2 samples with unpaired Welch’s t-test, and significantly differentially edited sites were considered those that showed a p-value < 0.05. Plotting and statistics were carried out using specific R packages.
5. Conclusions
Epitranscriptomic changes play an emerging role in cancer and include several RNA modification events [42]. Among them, A-to-I RNA editing mediated by the ADAR enzymes is one of the most abundant in humans. Herein, we show that ADAR2 loss promotes cell proliferation and switches the cell program towards more aggressive cell behavior. Most importantly, we report that the ADAR2 protein level can be considered a possible prognostic factor for GBM patients as it is positively associated with patient overall survival.
Supplementary Materials
The following supporting information can be downloaded at: https://www.mdpi.com/article/10.3390/biom12081142/s1, Figure S1: western blotting analysis of siAdar2 cells lines; Figure S2: heatmap, clustering and Distributions of single nucleotide variants of de novo RNA editing analysis; Table S1: Clinical and pathological features of Glioblastoma patients; Table S2: gene expression analysis of siADAR2 cells vs controls; Table S3: RNA editing analysis of siADAR2 cells vs controls.
Author Contributions
F.G., V.C., and V.T. performed the experiments. D.A.S. performed the bioinformatic and statistical analysis. M.M. provided GBM tissues for IHC studies, analyzed the data, and generated the KM curve. F.L. critically discussed the data and read and revised the manuscript. A.G. designed, coordinated, and supervised the study and wrote the manuscript. All authors have read and agreed to the published version of the manuscript.
Funding
This work was supported by the AIRC (Associazione Italiana Ricerca sul Cancro) IG grants (n. 13202) to A.G. and by the Mia Neri Foundation e Cassa di Sovvenzioni e Risparmio fra il Personale della Banca d’Italia to A.G.
Institutional Review Board Statement
The study was conducted in accordance with the Declaration of Helsinki, and approved by the Institutional Review Board (or Ethics Committee) the Catholic University School of Medicine, Rome, Italy Prot. 12045/15.
Informed Consent Statement
Informed consent was obtained from all subjects involved in the study.
Data Availability Statement
The data presented in this study are available on request from the corresponding author.
Acknowledgments
The authors would like to thank the experimental support of Roberta Stefanelli for the previous effort of transfection and qRT-PCR.
Conflicts of Interest
The authors declare no conflict of interest.
References
- Thakkar, J.P.; Dolecek, T.A.; Horbinski, C.; Ostrom, Q.T.; Lightner, D.D.; Barnholtz-Sloan, J.S.; Villano, J.L. Epidemiologic and molecular prognostic review of glioblastoma. Cancer Epidemiol. Biomark. Prev. 2014, 23, 1985–1996. [Google Scholar] [CrossRef] [PubMed]
- Hanif, F.; Muzaffar, K.; Perveen, K.; Malhi, S.M.; Simjee Sh, U. Glioblastoma Multiforme: A Review of its Epidemiology and Pathogenesis through Clinical Presentation and Treatment. Asian Pac. J. Cancer Prev. 2017, 18, 3–9. [Google Scholar] [CrossRef] [PubMed]
- Han, L.; Liang, H. RNA editing in cancer: Mechanistic, prognostic, and therapeutic implications. Mol. Cell Oncol. 2016, 3, e1117702. [Google Scholar] [CrossRef] [PubMed]
- Han, L.; Diao, L.; Yu, S.; Xu, X.; Li, J.; Zhang, R.; Yang, Y.; Werner, H.M.J.; Eterovic, A.K.; Yuan, Y.; et al. The Genomic Landscape and Clinical Relevance of A-to-I RNA Editing in Human Cancers. Cancer Cell 2015, 28, 515–528. [Google Scholar] [CrossRef]
- Silvestris, D.A.; Picardi, E.; Cesarini, V.; Fosso, B.; Mangraviti, N.; Massimi, L.; Martini, M.; Pesole, G.; Locatelli, F.; Gallo, A. Dynamic inosinome profiles reveal novel patient stratification and gender-specific differences in glioblastoma. Genome Biol. 2019, 20, 33. [Google Scholar] [CrossRef]
- Peng, X.; Xu, X.; Wang, Y.; Hawke, D.H.; Yu, S.; Han, L.; Zhou, Z.; Mojumdar, K.; Jeong, K.J.; Labrie, M.; et al. A-to-I RNA Editing Contributes to Proteomic Diversity in Cancer. Cancer Cell 2018, 33, 817–828.e817. [Google Scholar] [CrossRef]
- Shevchenko, G.; Morris, K.V. All I’s on the RADAR: Role of ADAR in gene regulation. FEBS Lett. 2018, 592, 2860–2873. [Google Scholar] [CrossRef]
- Keegan, L.P.; Gallo, A.; O’Connell, M.A. Development. Survival is impossible without an editor. Science 2000, 290, 1707–1709. [Google Scholar] [CrossRef]
- Bass, B.L. RNA editing by adenosine deaminases that act on RNA. Annu. Rev. biochem. 2002, 71, 817–846. [Google Scholar] [CrossRef]
- Gallo, A.; Locatelli, F. ADARs: Allies or enemies? The importance of A-to-I RNA editing in human disease: From cancer to HIV-1. Biol. Rev. Camb. Philos. Soc. 2011, 87, 95–110. [Google Scholar] [CrossRef]
- Jacobs, M.M.; Fogg, R.L.; Emeson, R.B.; Stanwood, G.D. ADAR1 and ADAR2 expression and editing activity during forebrain development. Dev. Neurosci. 2009, 31, 223–237. [Google Scholar] [CrossRef]
- Tariq, A.; Jantsch, M.F. Transcript diversification in the nervous system: A to I RNA editing in CNS function and disease development. Front. Neurosci. 2012, 6, 99. [Google Scholar] [CrossRef]
- Moore, S.; Alsop, E.; Lorenzini, I.; Starr, A.; Rabichow, B.E.; Mendez, E.; Levy, J.L.; Burciu, C.; Reiman, R.; Chew, J.; et al. ADAR2 mislocalization and widespread RNA editing aberrations in C9orf72-mediated ALS/FTD. Acta Neuropathol. 2019, 138, 49–65. [Google Scholar] [CrossRef]
- Tomaselli, S.; Galeano, F.; Massimi, L.; Di Rocco, C.; Lauriola, L.; Mastronuzzi, A.; Locatelli, F.; Gallo, A. ADAR2 editing activity in newly diagnosed versus relapsed pediatric high-grade astrocytomas. BMC Cancer 2013, 13, 255. [Google Scholar] [CrossRef][Green Version]
- Wright, A.; Vissel, B. The essential role of AMPA receptor GluR2 subunit RNA editing in the normal and diseased brain. Front. Mol. Neurosci. 2012, 5, 34. [Google Scholar] [CrossRef]
- Cesarini, V.; Silvestris, D.A.; Tassinari, V.; Tomaselli, S.; Alon, S.; Eisenberg, E.; Locatelli, F.; Gallo, A. ADAR2/miR-589-3p axis controls glioblastoma cell migration/invasion. Nucleic Acids Res. 2018, 46, 2045–2059. [Google Scholar] [CrossRef]
- Galeano, F.; Rossetti, C.; Tomaselli, S.; Cifaldi, L.; Lezzerini, M.; Pezzullo, M.; Boldrini, R.; Massimi, L.; Di Rocco, C.M.; Locatelli, F.; et al. ADAR2-editing activity inhibits glioblastoma growth through the modulation of the CDC14B/Skp2/p21/p27 axis. Oncogene 2013, 32, 998–1009. [Google Scholar] [CrossRef]
- Maas, S.; Patt, S.; Schrey, M.; Rich, A. Underediting of glutamate receptor GluR-B mRNA in malignant gliomas. Proc. Natl. Acad. Sci. USA 2001, 98, 14687–14692. [Google Scholar] [CrossRef]
- Tomaselli, S.; Galeano, F.; Alon, S.; Raho, S.; Galardi, S.; Polito, V.A.; Presutti, C.; Vincenti, S.; Eisenberg, E.; Locatelli, F.; et al. Modulation of microRNA editing, expression and processing by ADAR2 deaminase in glioblastoma. Genome Biol. 2015, 16, 5. [Google Scholar] [CrossRef]
- Wei, J.; Li, Z.; Du, C.; Qi, B.; Zhao, X.; Wang, L.; Bi, L.; Wang, G.; Zhang, X.; Su, X.; et al. Abnormal expression of an ADAR2 alternative splicing variant in gliomas downregulates adenosine-to-inosine RNA editing. Acta Neurochir. 2014, 156, 1135–1142. [Google Scholar] [CrossRef]
- Chen, Y.B.; Liao, X.Y.; Zhang, J.B.; Wang, F.; Qin, H.D.; Zhang, L.; Shugart, Y.Y.; Zeng, Y.X.; Jia, W.H. ADAR2 functions as a tumor suppressor via editing IGFBP7 in esophageal squamous cell carcinoma. Int. J. Oncol. 2017, 50, 622–630. [Google Scholar] [CrossRef] [PubMed]
- Sakata, K.I.; Maeda, K.; Sakurai, N.; Liang, S.; Nakazawa, S.; Yanagihara, K.; Kubo, T.; Yoshiyama, H.; Kitagawa, Y.; Hamada, J.I.; et al. ADAR2 Regulates Malignant Behaviour of Mesothelioma Cells Independent of RNA-editing Activity. Anticancer Res. 2020, 40, 1307–1314. [Google Scholar] [CrossRef]
- Mansi, L.; Tangaro, M.A.; Lo Giudice, C.; Flati, T.; Kopel, E.; Schaffer, A.A.; Castrignano, T.; Chillemi, G.; Pesole, G.; Picardi, E. REDIportal: Millions of novel A-to-I RNA editing events from thousands of RNAseq experiments. Nucleic Acids Res. 2021, 49, D1012–D1019. [Google Scholar] [CrossRef]
- Gabay, O.; Shoshan, Y.; Kopel, E.; Ben-Zvi, U.; Mann, T.D.; Bressler, N.; Cohen-Fultheim, R.; Schaffer, A.A.; Roth, S.H.; Tzur, Z.; et al. Landscape of adenosine-to-inosine RNA recoding across human tissues. Nat. Commun. 2022, 13, 1184. [Google Scholar] [CrossRef]
- Lo Giudice, C.; Tangaro, M.A.; Pesole, G.; Picardi, E. Investigating RNA editing in deep transcriptome datasets with REDItools and REDIportal. Nat. Protoc. 2020, 15, 1098–1131. [Google Scholar] [CrossRef]
- Jimeno, S.; Prados-Carvajal, R.; Fernandez-Avila, M.J.; Silva, S.; Silvestris, D.A.; Endara-Coll, M.; Rodriguez-Real, G.; Domingo-Prim, J.; Mejias-Navarro, F.; Romero-Franco, A.; et al. ADAR-mediated RNA editing of DNA:RNA hybrids is required for DNA double strand break repair. Nat. Commun. 2021, 12, 5512. [Google Scholar] [CrossRef]
- Kawahara, Y.; Zinshteyn, B.; Sethupathy, P.; Iizasa, H.; Hatzigeorgiou, A.G.; Nishikura, K. Redirection of silencing targets by adenosine-to-inosine editing of miRNAs. Science 2007, 315, 1137–1140. [Google Scholar] [CrossRef]
- Paz, N.; Levanon, E.Y.; Amariglio, N.; Heimberger, A.B.; Ram, Z.; Constantini, S.; Barbash, Z.S.; Adamsky, K.; Safran, M.; Hirschberg, A.; et al. Altered adenosine-to-inosine RNA editing in human cancer. Genome Res. 2007, 17, 1586–1595. [Google Scholar] [CrossRef]
- Tassinari, V.; Cesarini, V.; Tomaselli, S.; Ianniello, Z.; Silvestris, D.A.; Ginistrelli, L.C.; Martini, M.; De Angelis, B.; De Luca, G.; Vitiani, L.R.; et al. ADAR1 is a new target of METTL3 and plays a pro-oncogenic role in glioblastoma by an editing-independent mechanism. Genome Biol. 2021, 22, 51. [Google Scholar] [CrossRef]
- Xie, Z.; Bailey, A.; Kuleshov, M.V.; Clarke, D.J.B.; Evangelista, J.E.; Jenkins, S.L.; Lachmann, A.; Wojciechowicz, M.L.; Kropiwnicki, E.; Jagodnik, K.M.; et al. Gene Set Knowledge Discovery with Enrichr. Curr. Protoc. 2021, 1, e90. [Google Scholar] [CrossRef] [PubMed]
- Yu, C.; You, M.; Zhang, P.; Zhang, S.; Yin, Y.; Zhang, X. A five-gene signature is a prognostic biomarker in pan-cancer and related with immunologically associated extracellular matrix. Cancer Med. 2021, 10, 4629–4643. [Google Scholar] [CrossRef] [PubMed]
- Ma, Y.J.; Doni, A.; Garlanda, C. Editorial: Interactions of Pentraxins and Complement in Infection, Inflammation, and Cancer. Front. Immunol. 2022, 13, 861359. [Google Scholar] [CrossRef] [PubMed]
- de Souza, C.F.; Sabedot, T.S.; Malta, T.M.; Stetson, L.; Morozova, O.; Sokolov, A.; Laird, P.W.; Wiznerowicz, M.; Iavarone, A.; Snyder, J.; et al. A Distinct DNA Methylation Shift in a Subset of Glioma CpG Island Methylator Phenotypes during Tumor Recurrence. Cell Rep. 2018, 23, 637–651. [Google Scholar] [CrossRef] [PubMed]
- Liu, A.; Hou, C.; Chen, H.; Zong, X.; Zong, P. Genetics and Epigenetics of Glioblastoma: Applications and Overall Incidence of IDH1 Mutation. Front. Oncol. 2016, 6, 16. [Google Scholar] [CrossRef]
- Romani, M.; Pistillo, M.P.; Banelli, B. Epigenetic Targeting of Glioblastoma. Front. Oncol. 2018, 8, 448. [Google Scholar] [CrossRef]
- Fritzell, K.; Xu, L.D.; Lagergren, J.; Ohman, M. ADARs and editing: The role of A-to-I RNA modification in cancer progression. Semin. Cell Dev. Biol. 2017, 23, 50–57. [Google Scholar] [CrossRef]
- Cenci, C.; Barzotti, R.; Galeano, F.; Corbelli, S.; Rota, R.; Massimi, L.; Di Rocco, C.; O’Connell, M.A.; Gallo, A. Down-regulation of RNA editing in pediatric astrocytomas: ADAR2 editing activity inhibits cell migration and proliferation. J. Biol. Chem. 2008, 283, 7251–7260. [Google Scholar] [CrossRef]
- Deng, P.; Khan, A.; Jacobson, D.; Sambrani, N.; McGurk, L.; Li, X.; Jayasree, A.; Hejatko, J.; Shohat-Ophir, G.; O’Connell, M.A.; et al. Adar RNA editing-dependent and -independent effects are required for brain and innate immune functions in Drosophila. Nat. Commun. 2020, 11, 1580. [Google Scholar] [CrossRef]
- Wang, Z.; Wang, X.; Zou, H.; Dai, Z.; Feng, S.; Zhang, M.; Xiao, G.; Liu, Z.; Cheng, Q. The Basic Characteristics of the Pentraxin Family and Their Functions in Tumor Progression. Front. Immunol. 2020, 11, 1757. [Google Scholar] [CrossRef]
- Wesley, U.V.; Sutton, I.; Clark, P.A.; Cunningham, K.; Larrain, C.; Kuo, J.S.; Dempsey, R.J. Enhanced expression of pentraxin-3 in glioblastoma cells correlates with increased invasion and IL8-VEGF signaling axis. Brain Res. 2022, 1776, 147752. [Google Scholar] [CrossRef]
- Rajkovic, I.; Denes, A.; Allan, S.M.; Pinteaux, E. Emerging roles of the acute phase protein pentraxin-3 during central nervous system disorders. J. Neuroimmunol. 2016, 292, 27–33. [Google Scholar] [CrossRef]
- Boccaletto, P.; Baginski, B. MODOMICS: An Operational Guide to the Use of the RNA Modification Pathways Database. Methods Mol. Biol. 2021, 2284, 481–505. [Google Scholar] [CrossRef]
- D’Alessandris, Q.G.; Biffoni, M.; Martini, M.; Runci, D.; Buccarelli, M.; Cenci, T.; Signore, M.; Stancato, L.; Olivi, A.; De Maria, R.; et al. The clinical value of patient-derived glioblastoma tumorspheres in predicting treatment response. Neuro-Oncology 2017, 19, 1097–1108. [Google Scholar] [CrossRef]
- Livak, K.J.; Schmittgen, T.D. Analysis of relative gene expression data using real-time quantitative PCR and the 2(-Delta Delta C(T)) Method. Methods 2001, 25, 402–408. [Google Scholar] [CrossRef]
- Zhang, Y.; Sloan, S.A.; Clarke, L.E.; Caneda, C.; Plaza, C.A.; Blumenthal, P.D.; Vogel, H.; Steinberg, G.K.; Edwards, M.S.; Li, G.; et al. Purification and Characterization of Progenitor and Mature Human Astrocytes Reveals Transcriptional and Functional Differences with Mouse. Neuron 2016, 89, 37–53. [Google Scholar] [CrossRef]
- Chen, S.; Zhou, Y.; Chen, Y.; Gu, J. fastp: An ultra-fast all-in-one FASTQ preprocessor. Bioinformatics 2018, 34, i884–i890. [Google Scholar] [CrossRef]
- Dobin, A.; Davis, C.A.; Schlesinger, F.; Drenkow, J.; Zaleski, C.; Jha, S.; Batut, P.; Chaisson, M.; Gingeras, T.R. STAR: Ultrafast universal RNA-seq aligner. Bioinformatics 2013, 29, 15–21. [Google Scholar] [CrossRef]
- Liao, Y.; Smyth, G.K.; Shi, W. featureCounts: An efficient general purpose program for assigning sequence reads to genomic features. Bioinformatics 2014, 30, 923–930. [Google Scholar] [CrossRef]
- Love, M.I.; Huber, W.; Anders, S. Moderated estimation of fold change and dispersion for RNA-seq data with DESeq2. Genome biology 2014, 15, 550. [Google Scholar] [CrossRef]
- Chen, E.Y.; Tan, C.M.; Kou, Y.; Duan, Q.; Wang, Z.; Meirelles, G.V.; Clark, N.R.; Ma’ayan, A. Enrichr: Interactive and collaborative HTML5 gene list enrichment analysis tool. BMC Bioinform. 2013, 14, 128. [Google Scholar] [CrossRef]
- Picardi, E.; Pesole, G. REDItools: High-throughput RNA editing detection made easy. Bioinformatics 2013, 29, 1813–1814. [Google Scholar] [CrossRef] [PubMed]
- Wang, M.; Kong, L. pblat: A multithread blat algorithm speeding up aligning sequences to genomes. BMC Bioinform. 2019, 20, 28. [Google Scholar] [CrossRef] [PubMed]
Publisher’s Note: MDPI stays neutral with regard to jurisdictional claims in published maps and institutional affiliations. |
© 2022 by the authors. Licensee MDPI, Basel, Switzerland. This article is an open access article distributed under the terms and conditions of the Creative Commons Attribution (CC BY) license (https://creativecommons.org/licenses/by/4.0/).