
Identification of Serum Ferritin-Specific Nanobodies and Development towards a Diagnostic Immunoassay

 ,
,  ,
,
Abstract
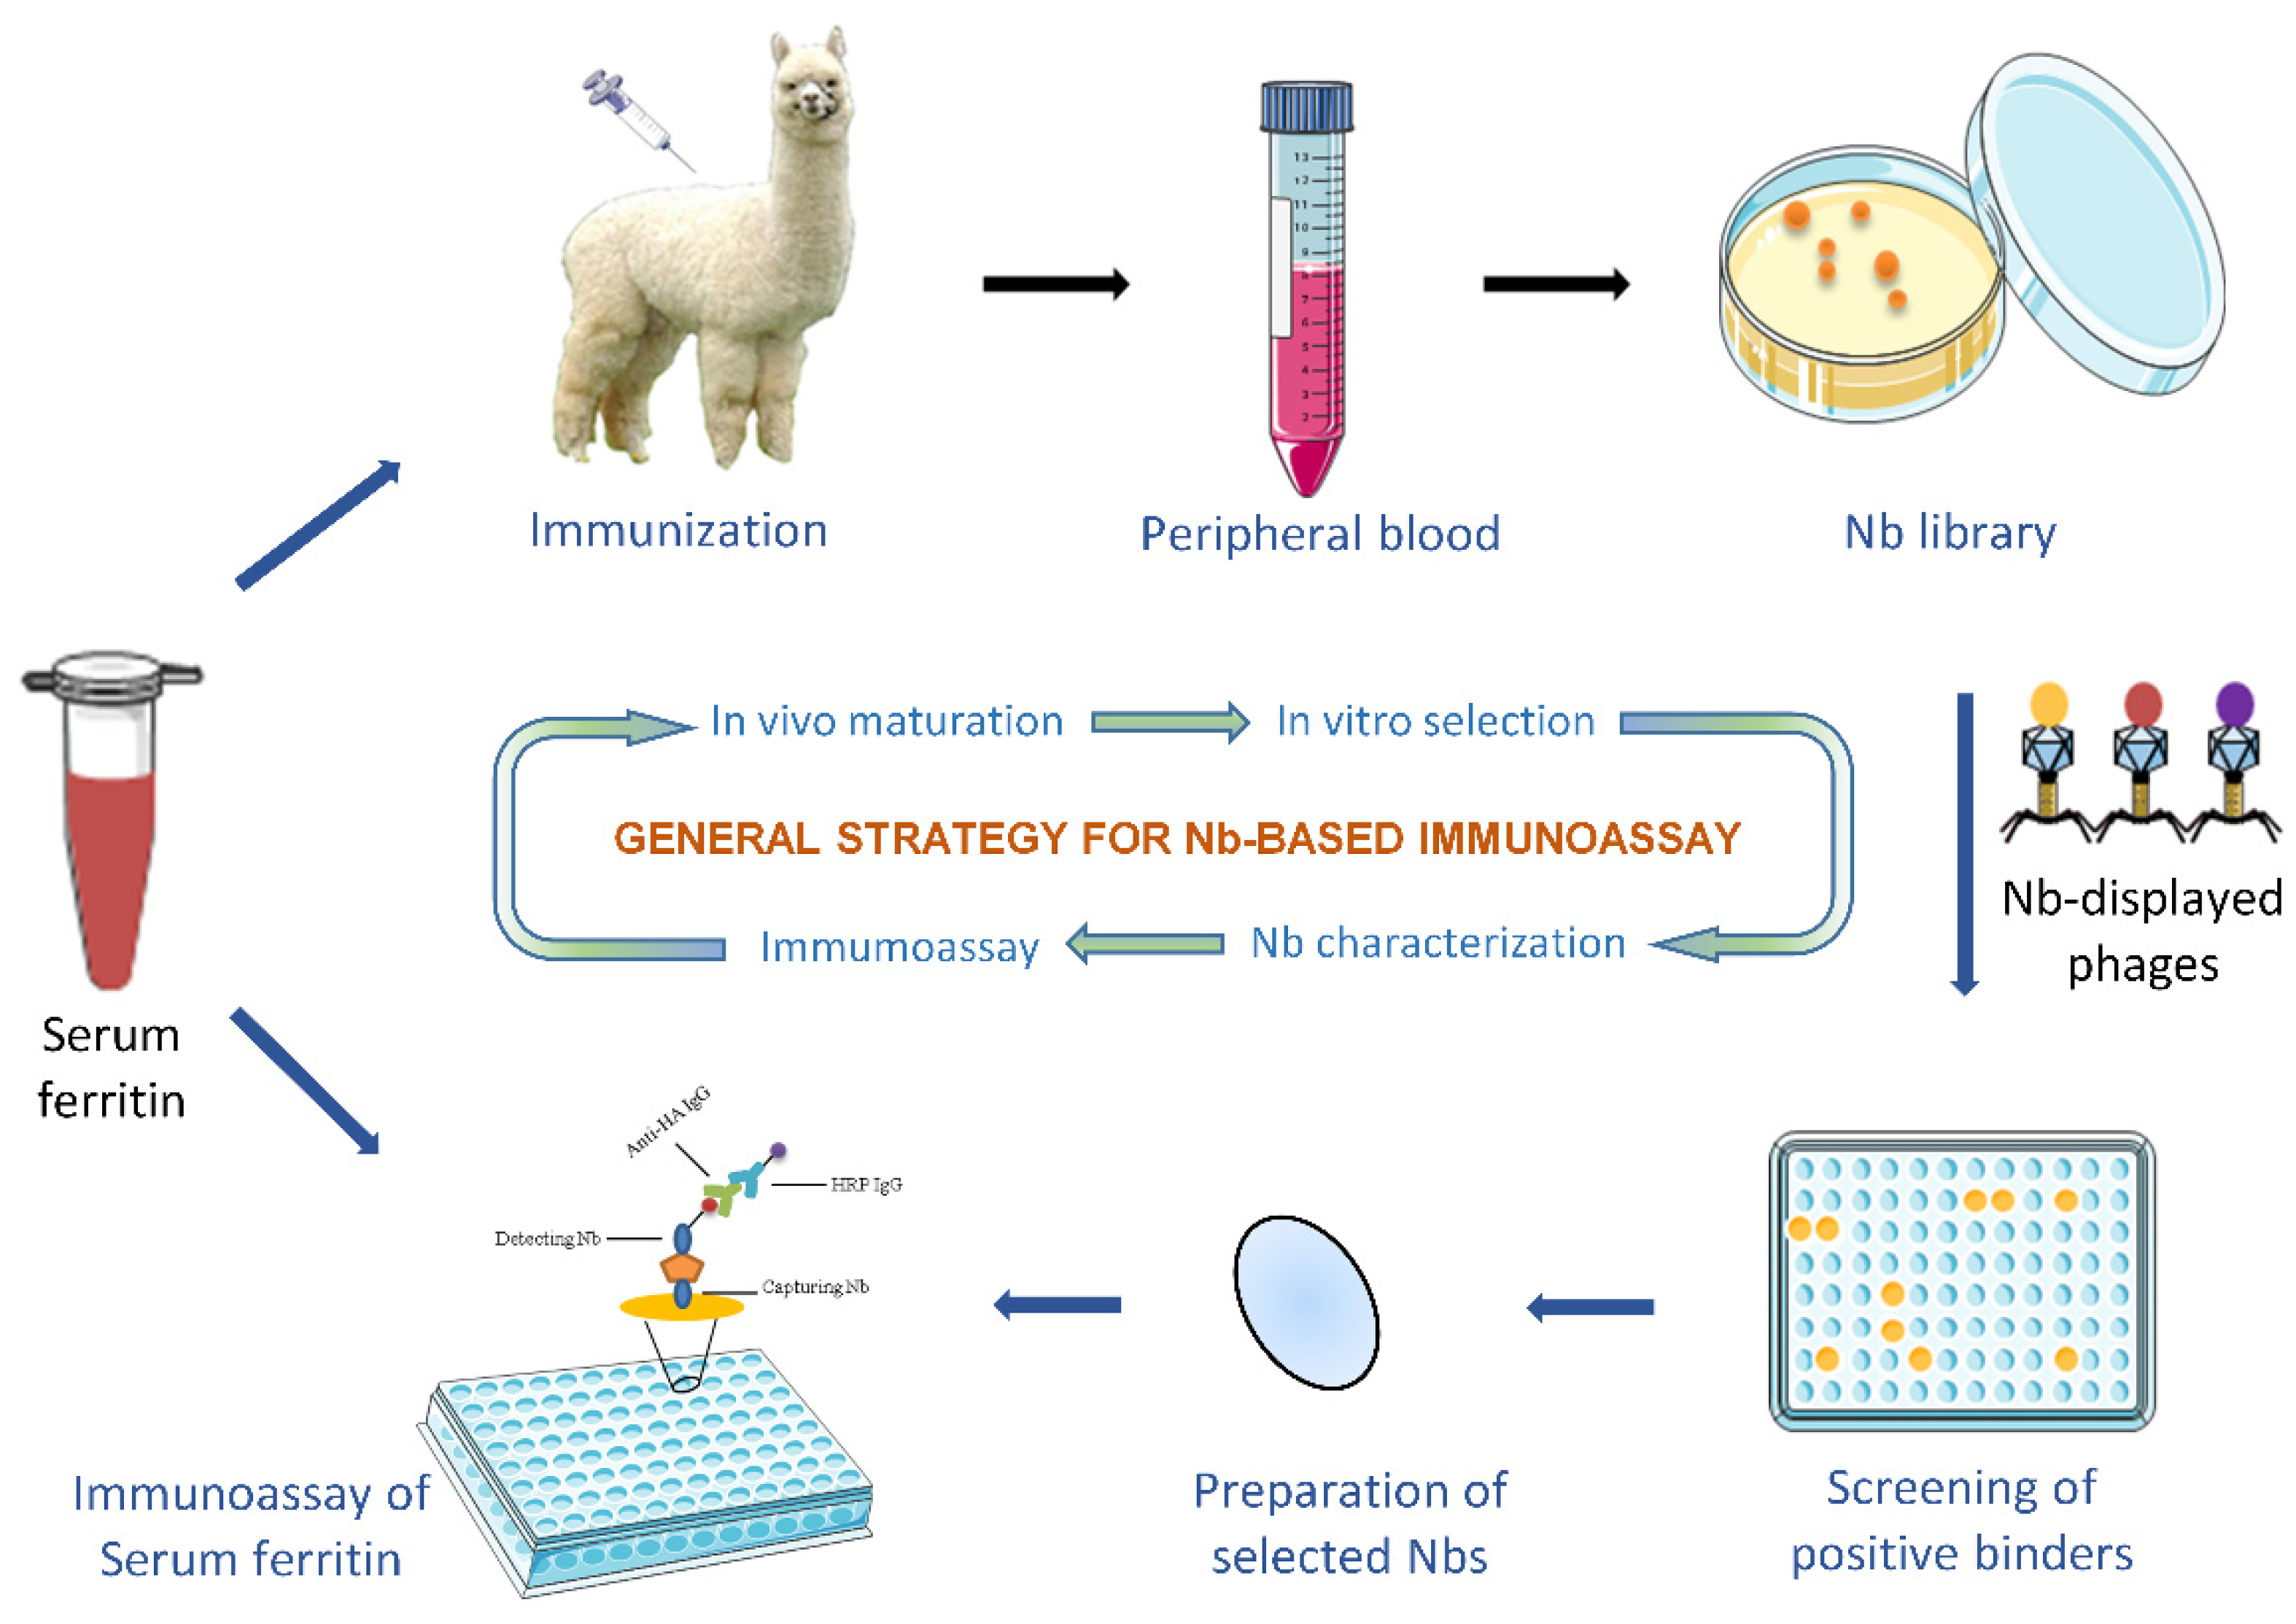
:1. Introduction
2. Materials and Methods
2.1. Protein, Strains, and Plasmids
2.2. Immunization and Immune Nb Library Construction
2.3. Bio-Panning and Screening of Specific Nbs
2.4. Expression and Purification of Specific Nbs
2.5. Binding Confirmation of Selected Nbs to SF
2.6. Specificity and Cross-Reactivity of Nbs
2.7. Characterization of Selected Nbs
2.7.1. Binding Affinity
2.7.2. Thermal Stability
2.8. Development of Nb-Based Immunoassay
2.8.1. Expression and Purification of Nbs with His-Tag Only
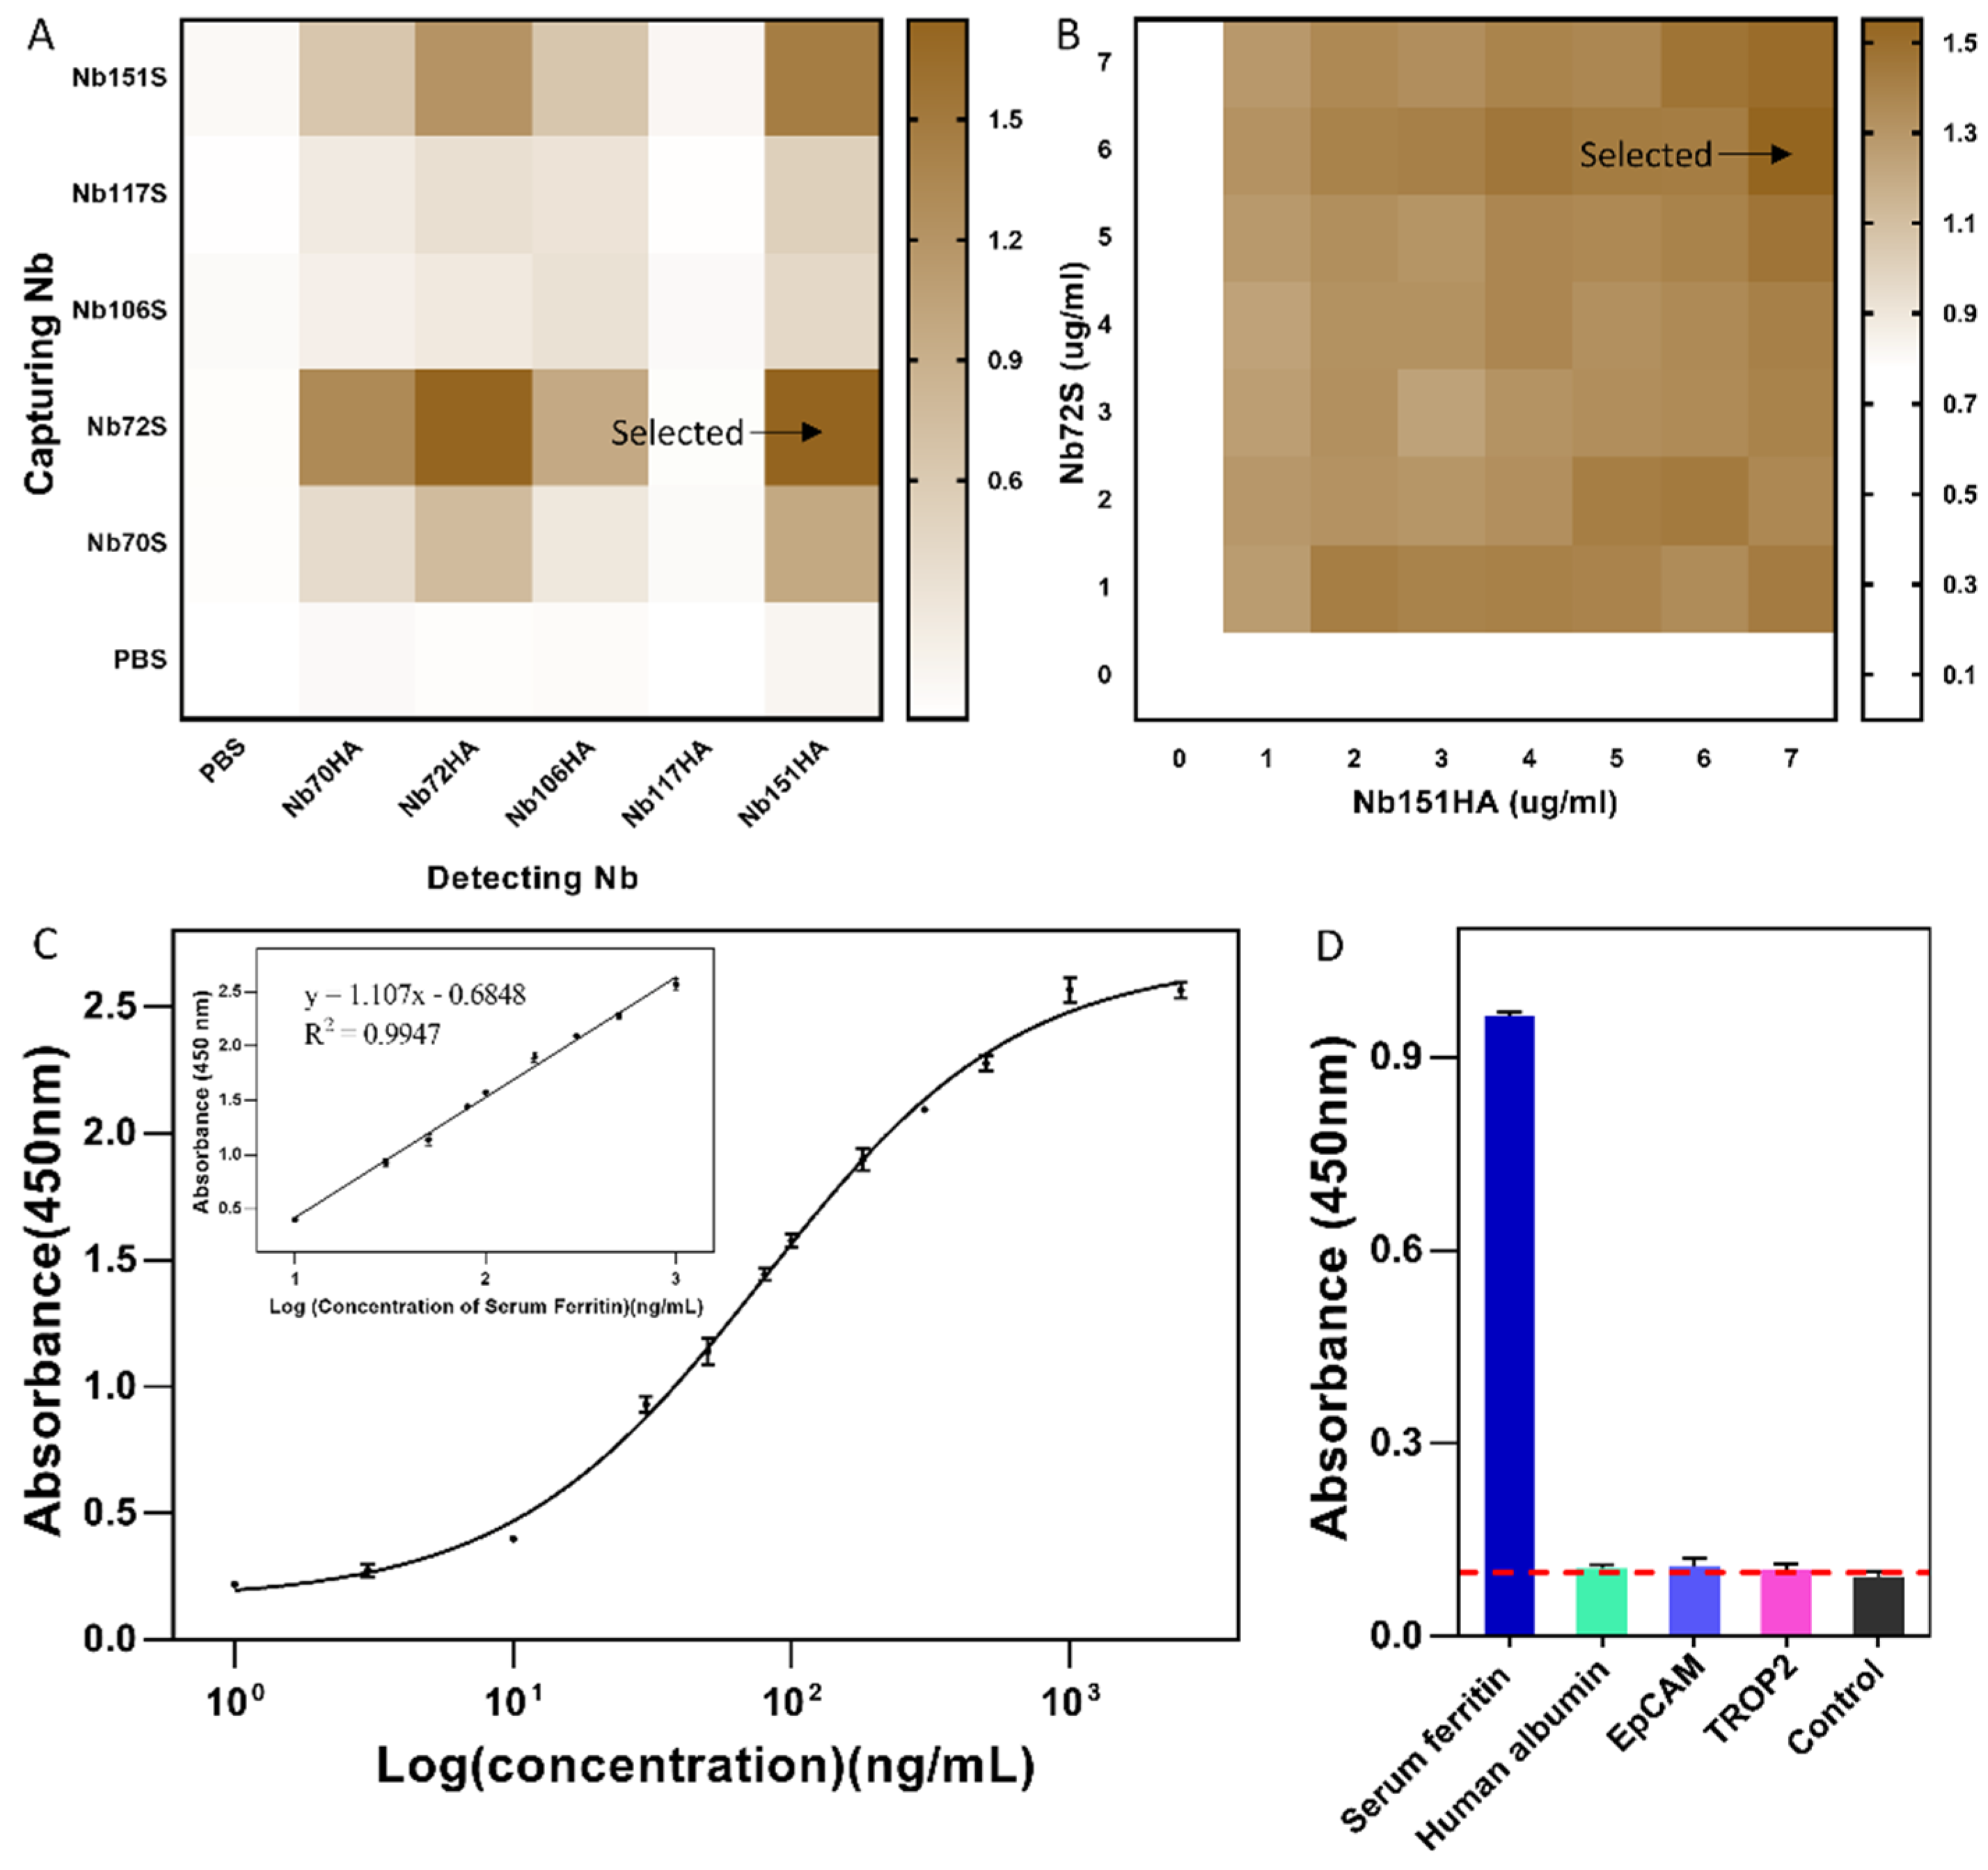
2.8.2. Selection of Best Nb-Pair and Concentration Optimization for SF Detection
2.8.3. Development of Nb-Based Immunoassay
2.8.4. Analysis of Serum Sample
2.9. Statistical Analysis
3. Results
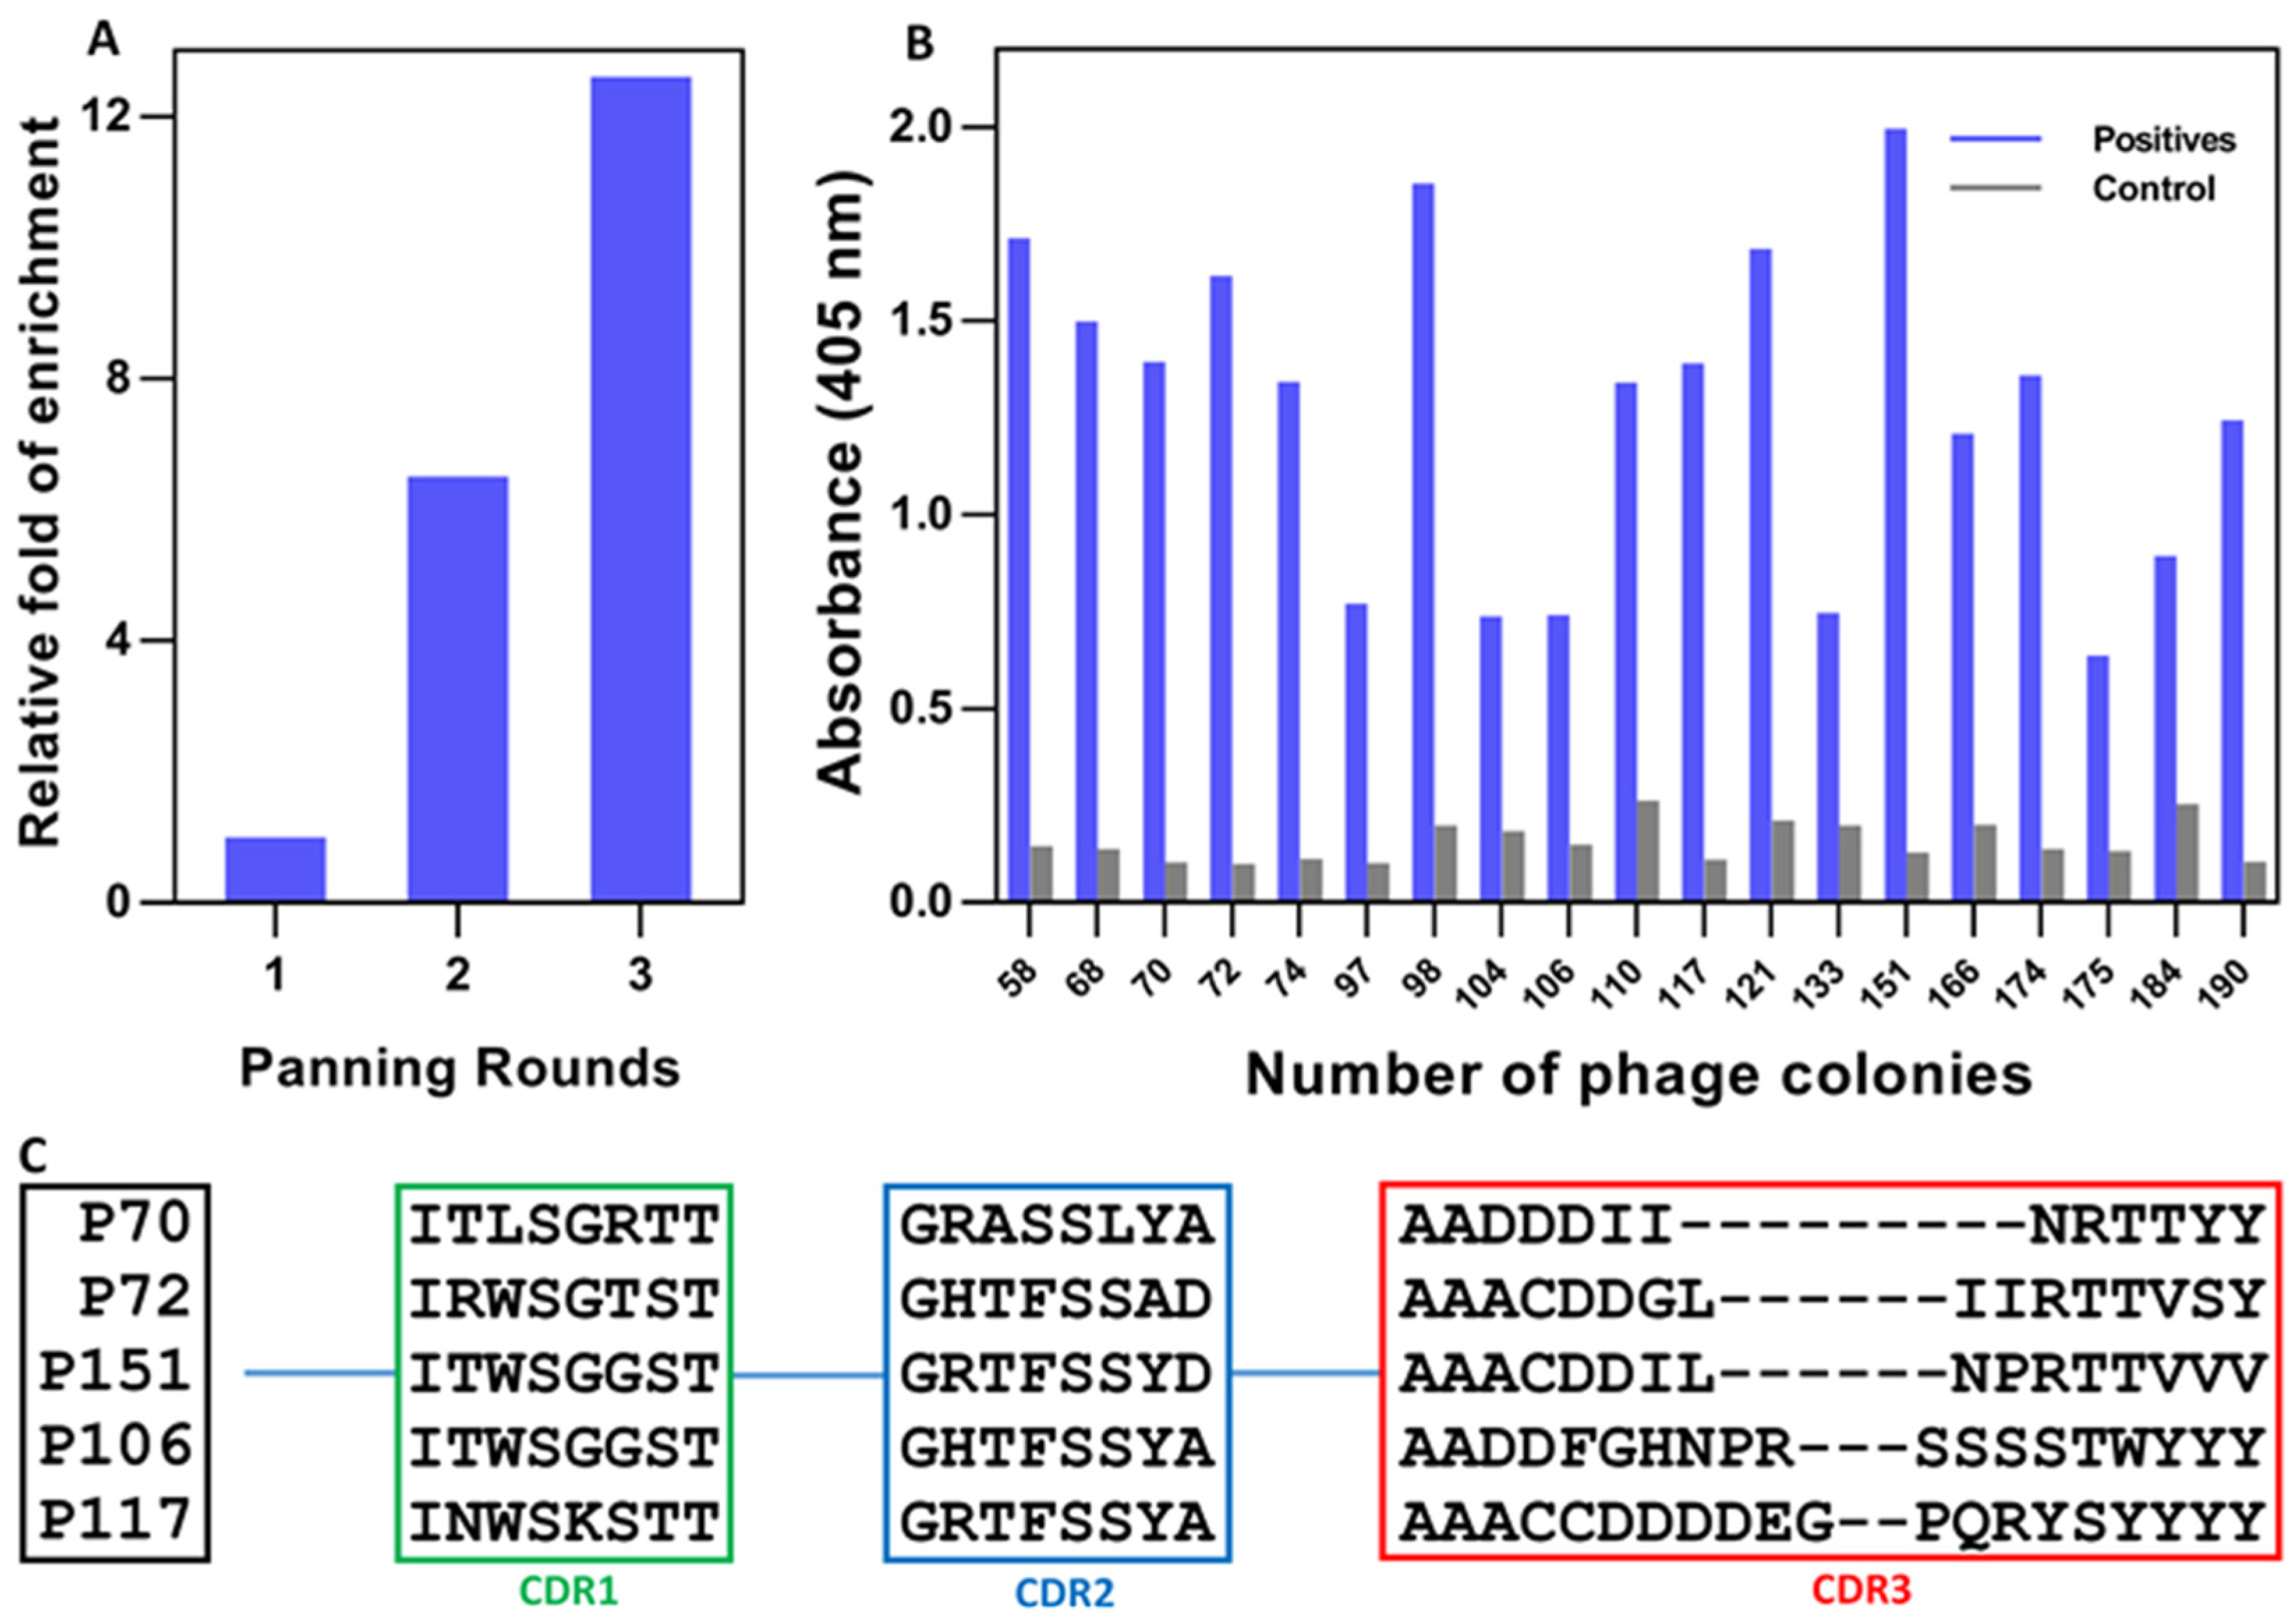
3.1. Construction of an Immune Nb Library
3.2. Retrieval of SF-Specific Nbs
3.3. Purification of Selected Nbs and Binding Analysis
3.4. Target Specificity and Possible Cross-Reactivity
3.5. Characterization of Selected Nbs
3.5.1. Estimation of Affinity
3.5.2. Thermal Stability
3.6. Development of Nb-Based Immunoassay
3.7. Analysis of Serum Samples
4. Discussion
Supplementary Materials
Author Contributions
Funding
Institutional Review Board Statement
Informed Consent Statement
Conflicts of Interest
References
- Wang, W.; Knovich, M.A.; Coffman, L.G.; Torti, F.M.; Torti, S.V. Serum ferritin: Past, present and future. Biochim. Et Biophys. Acta-Gen. Subj. 2010, 1800, 760–769. [Google Scholar] [CrossRef] [PubMed]
- Jacobs, A.; Worwood, M. Ferritin in serum. Clinical and biochemical implications. N. Engl. J. Med. 1975, 292, 951–956. [Google Scholar] [CrossRef] [PubMed]
- Plays, M.; Muller, S.; Rodriguez, R. Chemistry and biology of ferritin. Metallomics 2021, 13, mfab021. [Google Scholar] [CrossRef] [PubMed]
- Sammarco, M.C.; Ditch, S.; Banerjee, A.; Grabczyk, E. Ferritin L and H subunits are differentially regulated on a post-transcriptional level. J. Biol. Chem. 2008, 283, 4578–4587. [Google Scholar] [CrossRef] [PubMed]
- Koperdanova, M.; Cullis, J.O. Interpreting raised serum ferritin levels. BMJ 2015, 351, h3692. [Google Scholar] [CrossRef]
- Knovich, M.A.; Storey, J.A.; Coffman, L.G.; Torti, S.V.; Torti, F.M. Ferritin for the clinician. Blood Rev. 2009, 23, 95–104. [Google Scholar] [CrossRef]
- Lopez, A.; Cacoub, P.; Macdougall, I.C.; Peyrin-Biroulet, L. Iron deficiency anaemia. Lancet 2016, 387, 907–916. [Google Scholar] [CrossRef]
- Daru, J.; Allotey, J.; Pena-Rosas, J.P.; Khan, K.S. Serum ferritin thresholds for the diagnosis of iron deficiency in pregnancy: A systematic review. Transfus. Med. 2017, 27, 167–174. [Google Scholar] [CrossRef]
- Georgieff, M.K. Iron deficiency in pregnancy. Am. J. Obstet. Gynecol. 2020, 223, 516–524. [Google Scholar] [CrossRef]
- Abioye, A.I.; McDonald, E.A.; Park, S.; Ripp, K.; Bennett, B.; Wu, H.W.; Pond-Tor, S.; Sagliba, M.J.; Amoylen, A.J.; Baltazar, P.I.; et al. Maternal anemia type during pregnancy is associated with anemia risk among offspring during infancy. Pediatric Res. 2019, 86, 396–402. [Google Scholar] [CrossRef]
- Cullis, J.O.; Fitzsimons, E.J.; Griffiths, W.J.; Tsochatzis, E.; Thomas, D.W.; British Society for Haematology. Investigation and management of a raised serum ferritin. Br. J. Haematol. 2018, 181, 331–340. [Google Scholar] [CrossRef] [PubMed]
- Fan, K.; Gao, L.; Yan, X. Human ferritin for tumor detection and therapy. Wiley Interdiscip. Rev. Nanomed. Nanobiotechnol. 2013, 5, 287–298. [Google Scholar] [CrossRef] [PubMed]
- Hu, Z.W.; Chen, L.; Ma, R.Q.; Wei, F.Q.; Wen, Y.H.; Zeng, X.L.; Sun, W.; Wen, W.P. Comprehensive analysis of ferritin subunits expression and positive correlations with tumor-associated macrophages and T regulatory cells infiltration in most solid tumors. Aging (Albany N. Y.) 2021, 13, 11491–11506. [Google Scholar] [CrossRef] [PubMed]
- Zandman-Goddard, G.; Shoenfeld, Y. Ferritin in autoimmune diseases. Autoimmun. Rev. 2007, 6, 457–463. [Google Scholar] [CrossRef]
- Batchelor, E.K.; Kapitsinou, P.; Pergola, P.E.; Kovesdy, C.P.; Jalal, D.I. Iron Deficiency in Chronic Kidney Disease: Updates on Pathophysiology, Diagnosis, and Treatment. J. Am. Soc. Nephrol. 2020, 31, 456–468. [Google Scholar] [CrossRef] [PubMed]
- Akpinar, H.; Cetiner, M.; Keshav, S.; Ormeci, N.; Toruner, M. Diagnosis and treatment of iron deficiency anemia in patients with inflammatory bowel disease and gastrointestinal bleeding: Iron deficiency anemia working group consensus report. Turk. J. Gastroenterol. 2017, 28, 81–87. [Google Scholar] [CrossRef]
- Means, R.T. Iron Deficiency and Iron Deficiency Anemia: Implications and Impact in Pregnancy, Fetal Development, and Early Childhood Parameters. Nutrients 2020, 12, 447. [Google Scholar] [CrossRef]
- Byg, K.E.; Milman, N.; Hansen, S.; Agger, A.O. Serum Ferritin is a Reliable, Non-invasive Test for Iron Status in Pregnancy: Comparison of Ferritin with Other Iron Status Markers in a Longitudinal Study on Healthy Pregnant Women; Erythropoiesis. Hematology 2000, 5, 319–325. [Google Scholar] [CrossRef]
- Crispin, P.; Stephens, B.; McArthur, E.; Sethna, F. First trimester ferritin screening for pre-delivery anaemia as a patient blood management strategy. Transfus. Apher. Sci. 2019, 58, 50–57. [Google Scholar] [CrossRef]
- Palmer, W.C.; Zaver, H.B.; Ghoz, H.M. How I Approach Patients with Elevated Serum Ferritin. Am. J. Gastroenterol. 2020, 115, 1353–1355. [Google Scholar] [CrossRef]
- Matysiak-Brynda, E.; Wagner, B.; Bystrzejewski, M.; Grudzinski, I.P.; Nowicka, A.M. The importance of antibody orientation in the electrochemical detection of ferritin. Biosens. Bioelectron. 2018, 109, 83–89. [Google Scholar] [CrossRef] [PubMed]
- Devarakonda, S.; Singh, R.; Bhardwaj, J.; Jang, J. Cost-Effective and Handmade Paper-Based Immunosensing Device for Electrochemical Detection of Influenza Virus. Sensors 2017, 17, 2597. [Google Scholar] [CrossRef]
- Garg, M.; Christensen, M.G.; Iles, A.; Sharma, A.L.; Singh, S.; Pamme, N. Microfluidic-Based Electrochemical Immunosensing of Ferritin. Biosensors 2020, 10, 91. [Google Scholar] [CrossRef] [PubMed]
- Song, T.-T.; Wang, W.; Meng, L.-L.; Liu, Y.; Jia, X.-B.; Mao, X. Electrochemical detection of human ferritin based on gold nanorod reporter probe and cotton thread immunoassay device. Chin. Chem. Lett. 2017, 28, 226–230. [Google Scholar] [CrossRef]
- Tu, Z.; Huang, X.; Fu, J.; Hu, N.; Zheng, W.; Li, Y.; Zhang, Y. Landscape of variable domain of heavy-chain-only antibody repertoire from alpaca. Immunology 2020, 161, 53–65. [Google Scholar] [CrossRef]
- Muyldermans, S. A guide to: Generation and design of nanobodies. FEBS J. 2021, 288, 2084–2102. [Google Scholar] [CrossRef]
- Oliveira, S.; Heukers, R.; Sornkom, J.; Kok, R.J.; van Bergen En Henegouwen, P.M. Targeting tumors with nanobodies for cancer imaging and therapy. J. Control. Release 2013, 172, 607–617. [Google Scholar] [CrossRef]
- Garaicoechea, L.; Aguilar, A.; Parra, G.I.; Bok, M.; Sosnovtsev, S.V.; Canziani, G.; Green, K.Y.; Bok, K.; Parreno, V. Llama nanoantibodies with therapeutic potential against human norovirus diarrhea. PLoS ONE 2015, 10, e0133665. [Google Scholar] [CrossRef]
- Salvador, J.P.; Vilaplana, L.; Marco, M.P. Nanobody: Outstanding features for diagnostic and therapeutic applications. Anal. Bioanal. Chem. 2019, 411, 1703–1713. [Google Scholar] [CrossRef]
- Haffke, M.; Fehlmann, D.; Rummel, G.; Boivineau, J.; Duckely, M.; Gommermann, N.; Cotesta, S.; Sirockin, F.; Freuler, F.; Littlewood-Evans, A.; et al. Structural basis of species-selective antagonist binding to the succinate receptor. Nature 2019, 574, 581–585. [Google Scholar] [CrossRef]
- Jovcevska, I.; Muyldermans, S. The Therapeutic Potential of Nanobodies. Biodrugs 2020, 34, 11–26. [Google Scholar] [CrossRef] [PubMed]
- Krah, S.; Schroter, C.; Zielonka, S.; Empting, M.; Valldorf, B.; Kolmar, H. Single-domain antibodies for biomedical applications. Immunopharmacol. Immunotoxicol. 2016, 38, 21–28. [Google Scholar] [CrossRef] [PubMed]
- Vincke, C.; Gutiérrez, C.; Wernery, U.; Devoogdt, N.; Hassanzadeh-Ghassabeh, G.; Muyldermans, S. Generation of single domain antibody fragments derived from camelids and generation of manifold constructs. Methods Mol. Biol. 2012, 907, 145–176. [Google Scholar] [PubMed]
- Hu, Y.; Romao, E.; Vincke, C.; Brys, L.; Elkrim, Y.; Vandevenne, M.; Liu, C.; Muyldermans, S. Intrabody Targeting HIF-1alpha Mediates Transcriptional Downregulation of Target Genes Related to Solid Tumors. Int. J. Mol. Sci. 2021, 22, 12335. [Google Scholar] [CrossRef] [PubMed]
- Pardon, E.; Laeremans, T.; Triest, S.; Rasmussen, S.G.; Wohlkonig, A.; Ruf, A.; Muyldermans, S.; Hol, W.G.; Kobilka, B.K.; Steyaert, J. A general protocol for the generation of Nanobodies for structural biology. Nat. Protoc. 2014, 9, 674–693. [Google Scholar] [CrossRef] [PubMed]
- Koorts, A.M.; Viljoen, M. Ferritin and ferritin isoforms I: Structure-function relationships, synthesis, degradation and secretion. Arch. Physiol. Biochem. 2007, 113, 30–54. [Google Scholar] [CrossRef]
- Song, X.; Zheng, Y.; Liu, Y.; Meng, H.; Yu, R.; Zhang, C. Production of recombinant human hybrid ferritin with heavy chain and light chain in Escherichia coli and its characterization. Curr. Pharm. Biotechnol. 2022. [Google Scholar] [CrossRef]
- Harrison, P.M.; Arosio, P. The ferritins: Molecular properties, iron storage function and cellular regulation. Biochim. Et Biophys. Acta 1996, 1275, 161–203. [Google Scholar] [CrossRef]
- Cappellini, M.D.; Musallam, K.M.; Taher, A.T. Iron deficiency anaemia revisited. J. Intern. Med. 2020, 287, 153–170. [Google Scholar] [CrossRef]
- Alkhateeb, A.A.; Connor, J.R. The significance of ferritin in cancer: Anti-oxidation, inflammation and tumorigenesis. Biochim. Et Biophys. Acta 2013, 1836, 245–254. [Google Scholar] [CrossRef]
- Zhang, N.; Yu, X.; Xie, J.; Xu, H. New Insights into the Role of Ferritin in Iron Homeostasis and Neurodegenerative Diseases. Mol. Neurobiol. 2021, 58, 2812–2823. [Google Scholar] [CrossRef] [PubMed]
- Ashktorab, H.; Pizuorno, A.; Aduli, F.; Laiyemo, A.O.; Oskrochi, G.; Brim, H. Elevated Liver Enzymes, Ferritin, C-reactive Protein, D-dimer, and Age Are Predictive Markers of Outcomes Among African American and Hispanic Patients with Coronavirus Disease 2019. Gastroenterology 2021, 161, 345–349. [Google Scholar] [CrossRef] [PubMed]
- Ayoya, M.A.; Spiekermann-Brouwer, G.M.; Stoltzfus, R.J.; Nemeth, E.; Habicht, J.P.; Ganz, T.; Rawat, R.; Traore, A.K.; Garza, C. Alpha 1-acid glycoprotein, hepcidin, C-reactive protein, and serum ferritin are correlated in anemic schoolchildren with Schistosoma haematobium. Am. J. Clin. Nutr. 2010, 91, 1784–1790. [Google Scholar] [CrossRef] [PubMed]
- Braga, F.; Infusino, I.; Dolci, A.; Panteghini, M. Soluble transferrin receptor in complicated anemia. Clin. Chim. Acta 2014, 431, 143–147. [Google Scholar] [CrossRef] [PubMed]
- Barnett, M.D.; Gordon, Y.B.; Amess, J.A.; Mollin, D.L. Measurement of ferritin in serum by radioimmunoassay. J. Clin. Pathol. 1978, 31, 742–748. [Google Scholar] [CrossRef]
- Bleicher, A.V.; Unger, H.W.; Rogerson, S.J.; Aitken, E.H. A sandwich enzyme-linked immunosorbent assay for the quantitation of human plasma ferritin. MethodsX 2018, 5, 648–651. [Google Scholar] [CrossRef]
- Priyadarshini, E.; Rawat, K.; Bohidar, H.B.; Rajamani, P. Dual-probe (colorimetric and fluorometric) detection of ferritin using antibody-modified gold@carbon dot nanoconjugates. Microchim. Acta 2019, 186, 687. [Google Scholar] [CrossRef]
- Bastos-Soares, E.A.; Sousa, R.M.O.; Gomez, A.F.; Alfonso, J.; Kayano, A.M.; Zanchi, F.B.; Funes-Huacca, M.E.; Stabeli, R.G.; Soares, A.M.; Pereira, S.S.; et al. Single domain antibodies in the development of immunosensors for diagnostics. Int. J. Biol. Macromol. 2020, 165, 2244–2252. [Google Scholar] [CrossRef]
- Yang, E.Y.; Shah, K. Nanobodies: Next Generation of Cancer Diagnostics and Therapeutics. Front. Oncol. 2020, 10, 1182. [Google Scholar] [CrossRef]


| Sample | Spiked Concentration | Detected Concentration | Recovery b | CV c |
|---|---|---|---|---|
| ng/mL | ng/mL | % | % | |
| FBS a | 0 | ND d | - | - |
| 10 | 11.13 ± 1.03 | 111.25% | 3.64% | |
| 100 | 104.20 ± 2.26 | 104.20% | 2.14% | |
| 500 | 548.75 ± 20.53 | 109.75% | 8.70% |
Publisher’s Note: MDPI stays neutral with regard to jurisdictional claims in published maps and institutional affiliations. |
© 2022 by the authors. Licensee MDPI, Basel, Switzerland. This article is an open access article distributed under the terms and conditions of the Creative Commons Attribution (CC BY) license (https://creativecommons.org/licenses/by/4.0/).
Share and Cite
Hu, Y.; Lin, J.; Wang, Y.; Wu, S.; Wu, J.; Lv, H.; Ji, X.; Muyldermans, S.; Zhang, Y.; Wang, S. Identification of Serum Ferritin-Specific Nanobodies and Development towards a Diagnostic Immunoassay. Biomolecules 2022, 12, 1080. https://doi.org/10.3390/biom12081080
Hu Y, Lin J, Wang Y, Wu S, Wu J, Lv H, Ji X, Muyldermans S, Zhang Y, Wang S. Identification of Serum Ferritin-Specific Nanobodies and Development towards a Diagnostic Immunoassay. Biomolecules. 2022; 12(8):1080. https://doi.org/10.3390/biom12081080
Chicago/Turabian StyleHu, Yaozhong, Jing Lin, Yi Wang, Sihao Wu, Jing Wu, Huan Lv, Xuemeng Ji, Serge Muyldermans, Yan Zhang, and Shuo Wang. 2022. "Identification of Serum Ferritin-Specific Nanobodies and Development towards a Diagnostic Immunoassay" Biomolecules 12, no. 8: 1080. https://doi.org/10.3390/biom12081080
APA StyleHu, Y., Lin, J., Wang, Y., Wu, S., Wu, J., Lv, H., Ji, X., Muyldermans, S., Zhang, Y., & Wang, S. (2022). Identification of Serum Ferritin-Specific Nanobodies and Development towards a Diagnostic Immunoassay. Biomolecules, 12(8), 1080. https://doi.org/10.3390/biom12081080