
Multifunctionality of Nanosized Calcium Apatite Dual-Doped with Li+/Eu3+ Ions Related to Cell Culture Studies and Cytotoxicity Evaluation In Vitro

 , , , ,
  , ,
, ,  , and
, and 
Abstract
:
1. Introduction
2. Materials and Methods
2.1. Preparation of Nanocrystalline Apatites
2.2. Materials Characterization
2.3. Cytotoxicity Assessment in Osteosarcoma Cell Line and Murine Macrophage
2.3.1. Cell Lines and Culture
2.3.2. MTT Assay
2.3.3. Trypan Blue Exclusion Assay
2.4. Evaluation of Hemolytic Activity in Human RBCs
2.4.1. Erythrocyte Preparation
2.4.2. Hemolysis Assays
2.4.3. Erythrocytes Sedimentation Rate under Nanomaterials Treatment
2.4.4. Microscope Studies of Erythrocytes Shape Transformation
2.5. Bovine Serum Albumin and Lysozyme Adsorption Apatite Nanoparticles
2.6. Antibacterial Evaluation
3. Results and Discussion
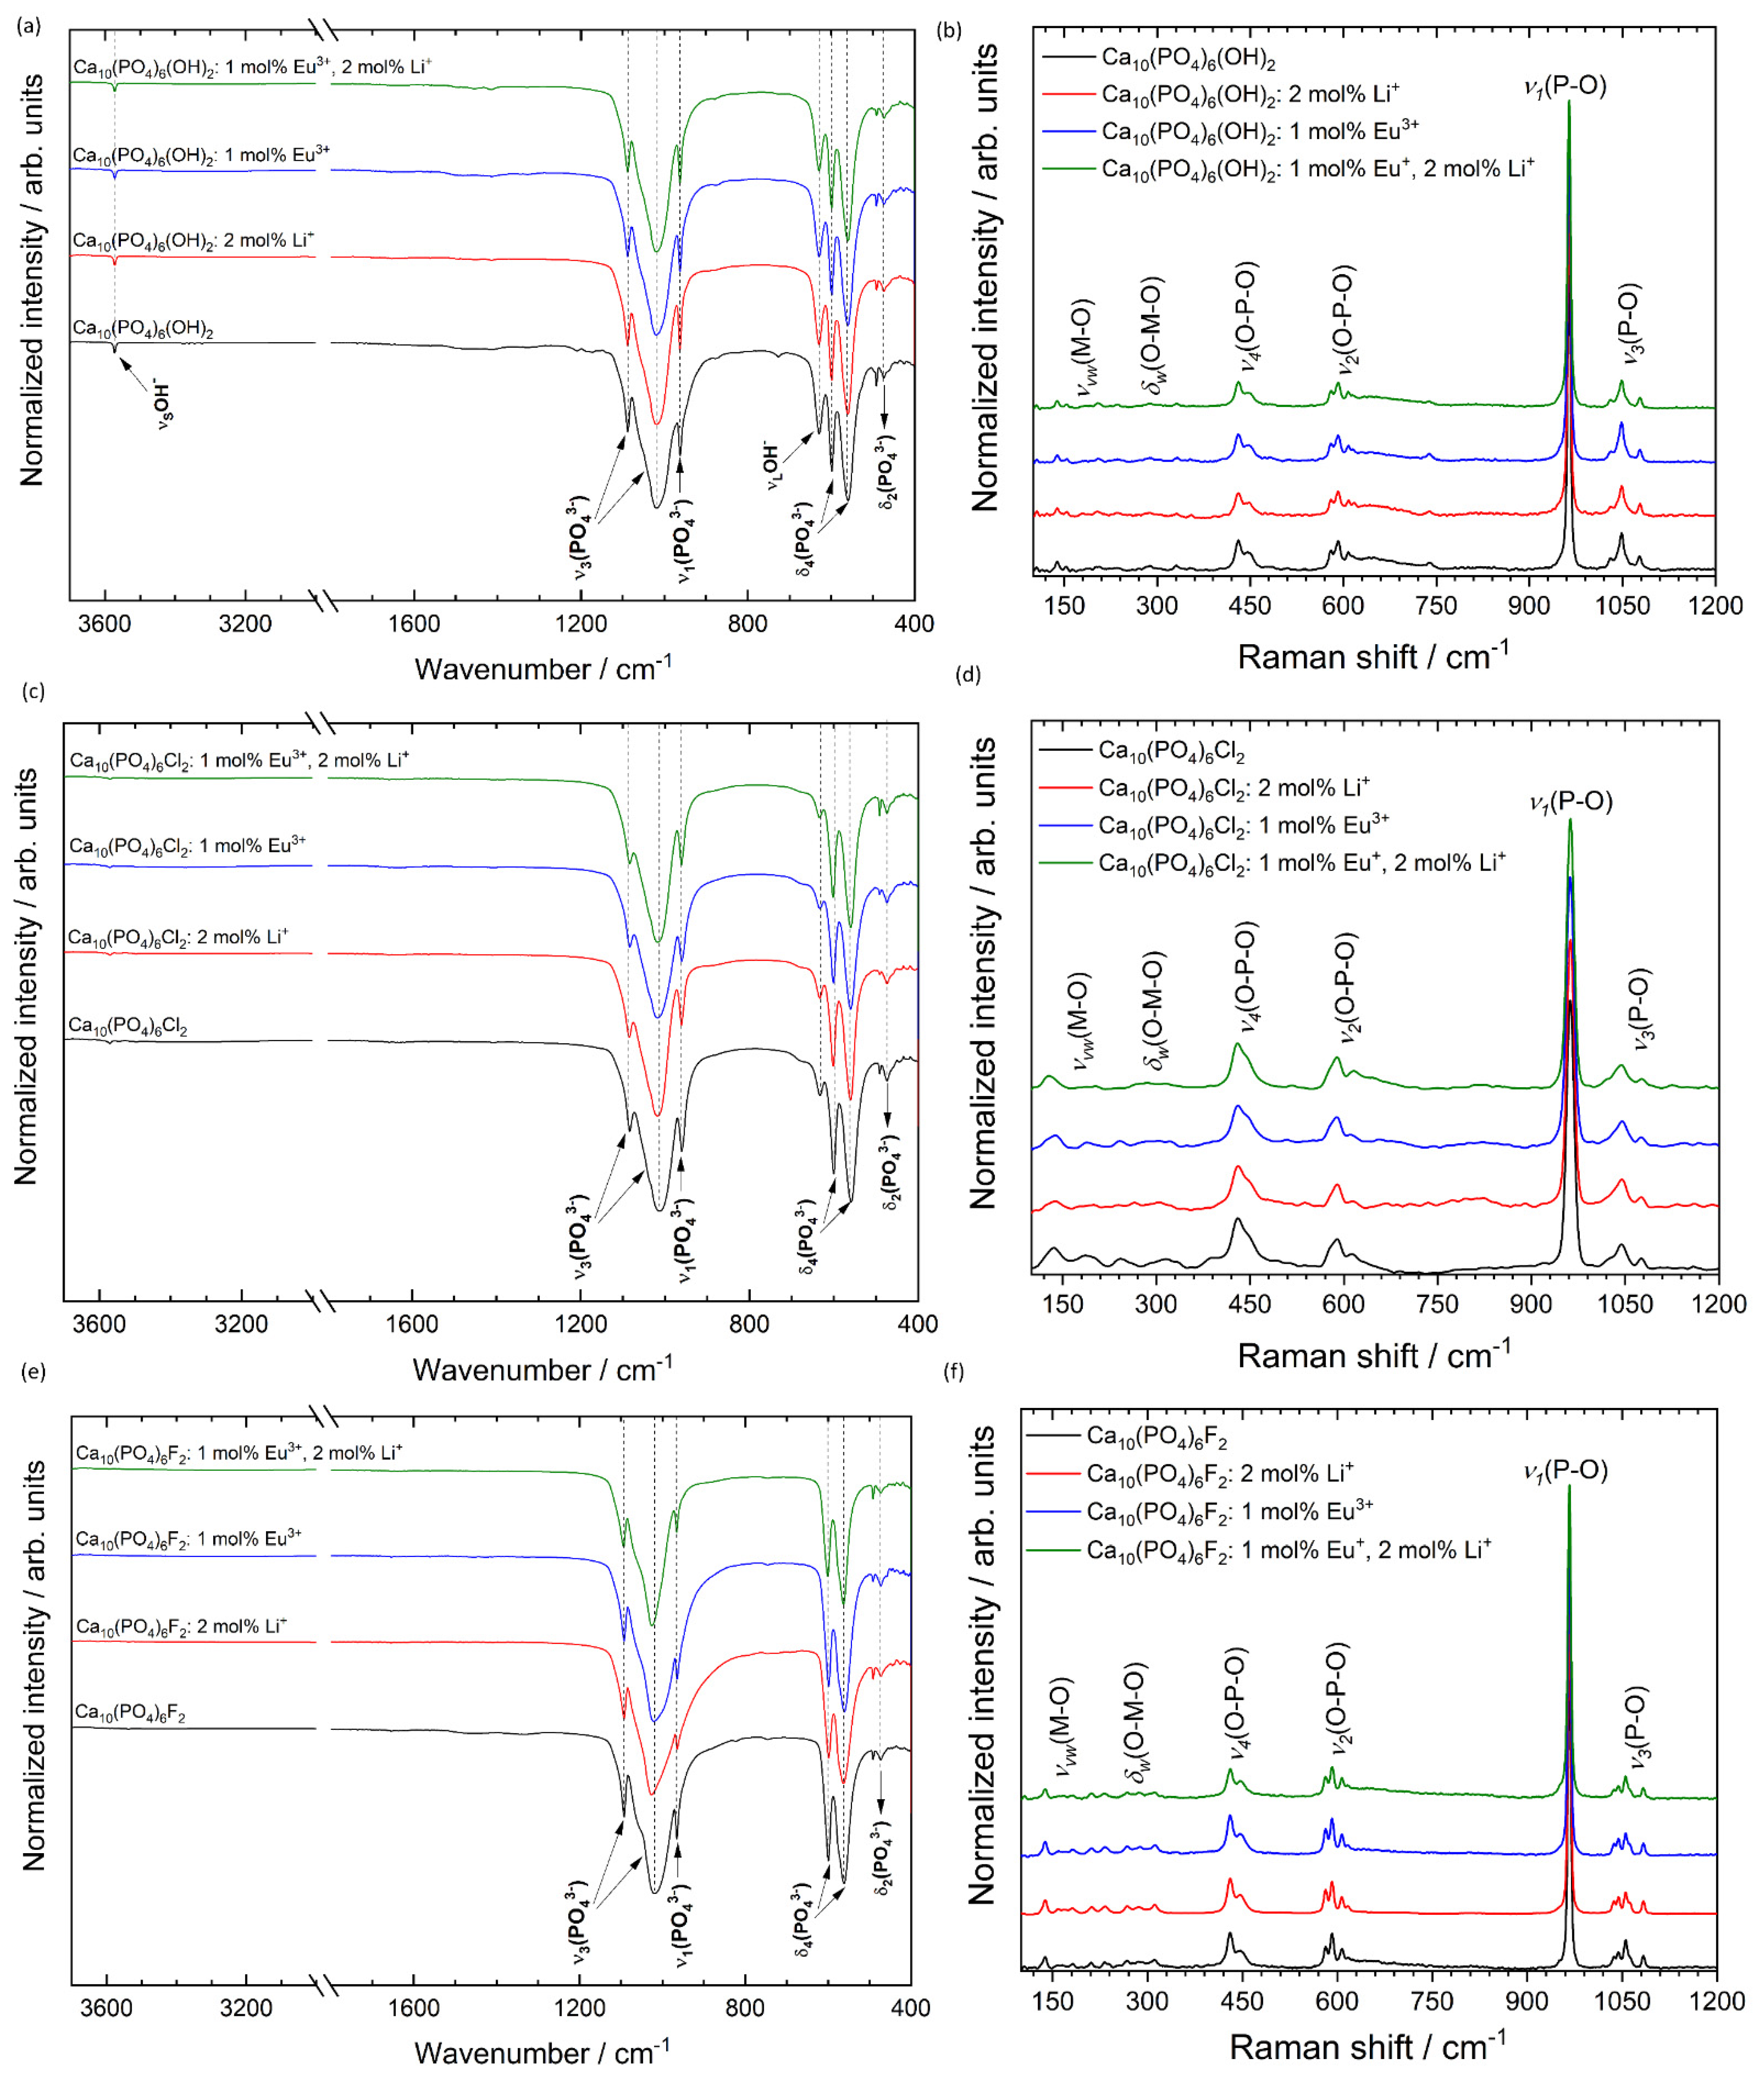
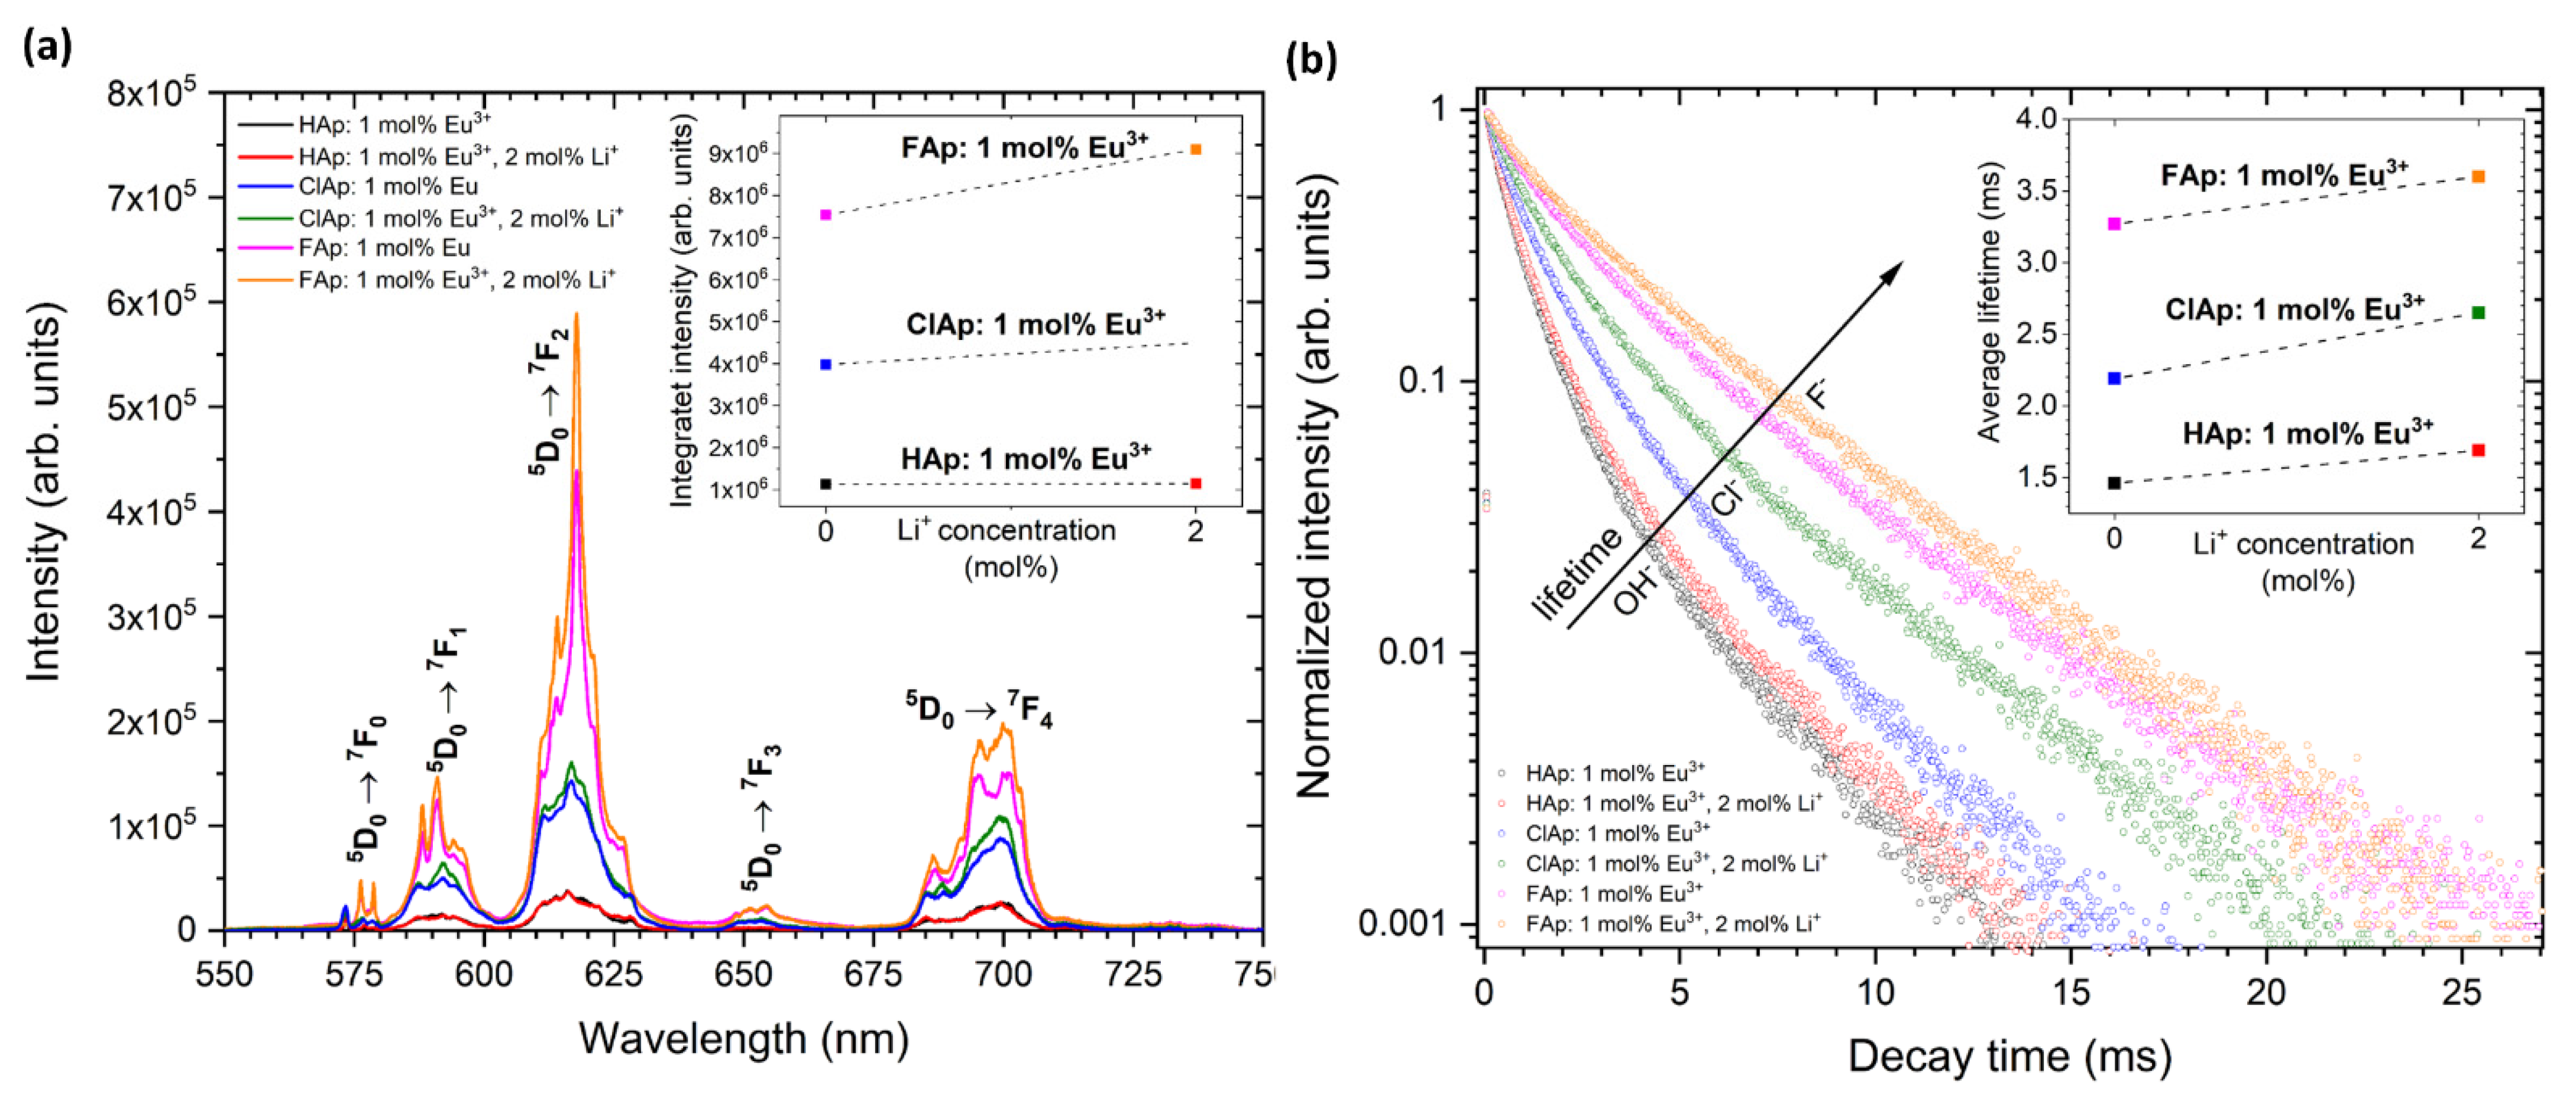
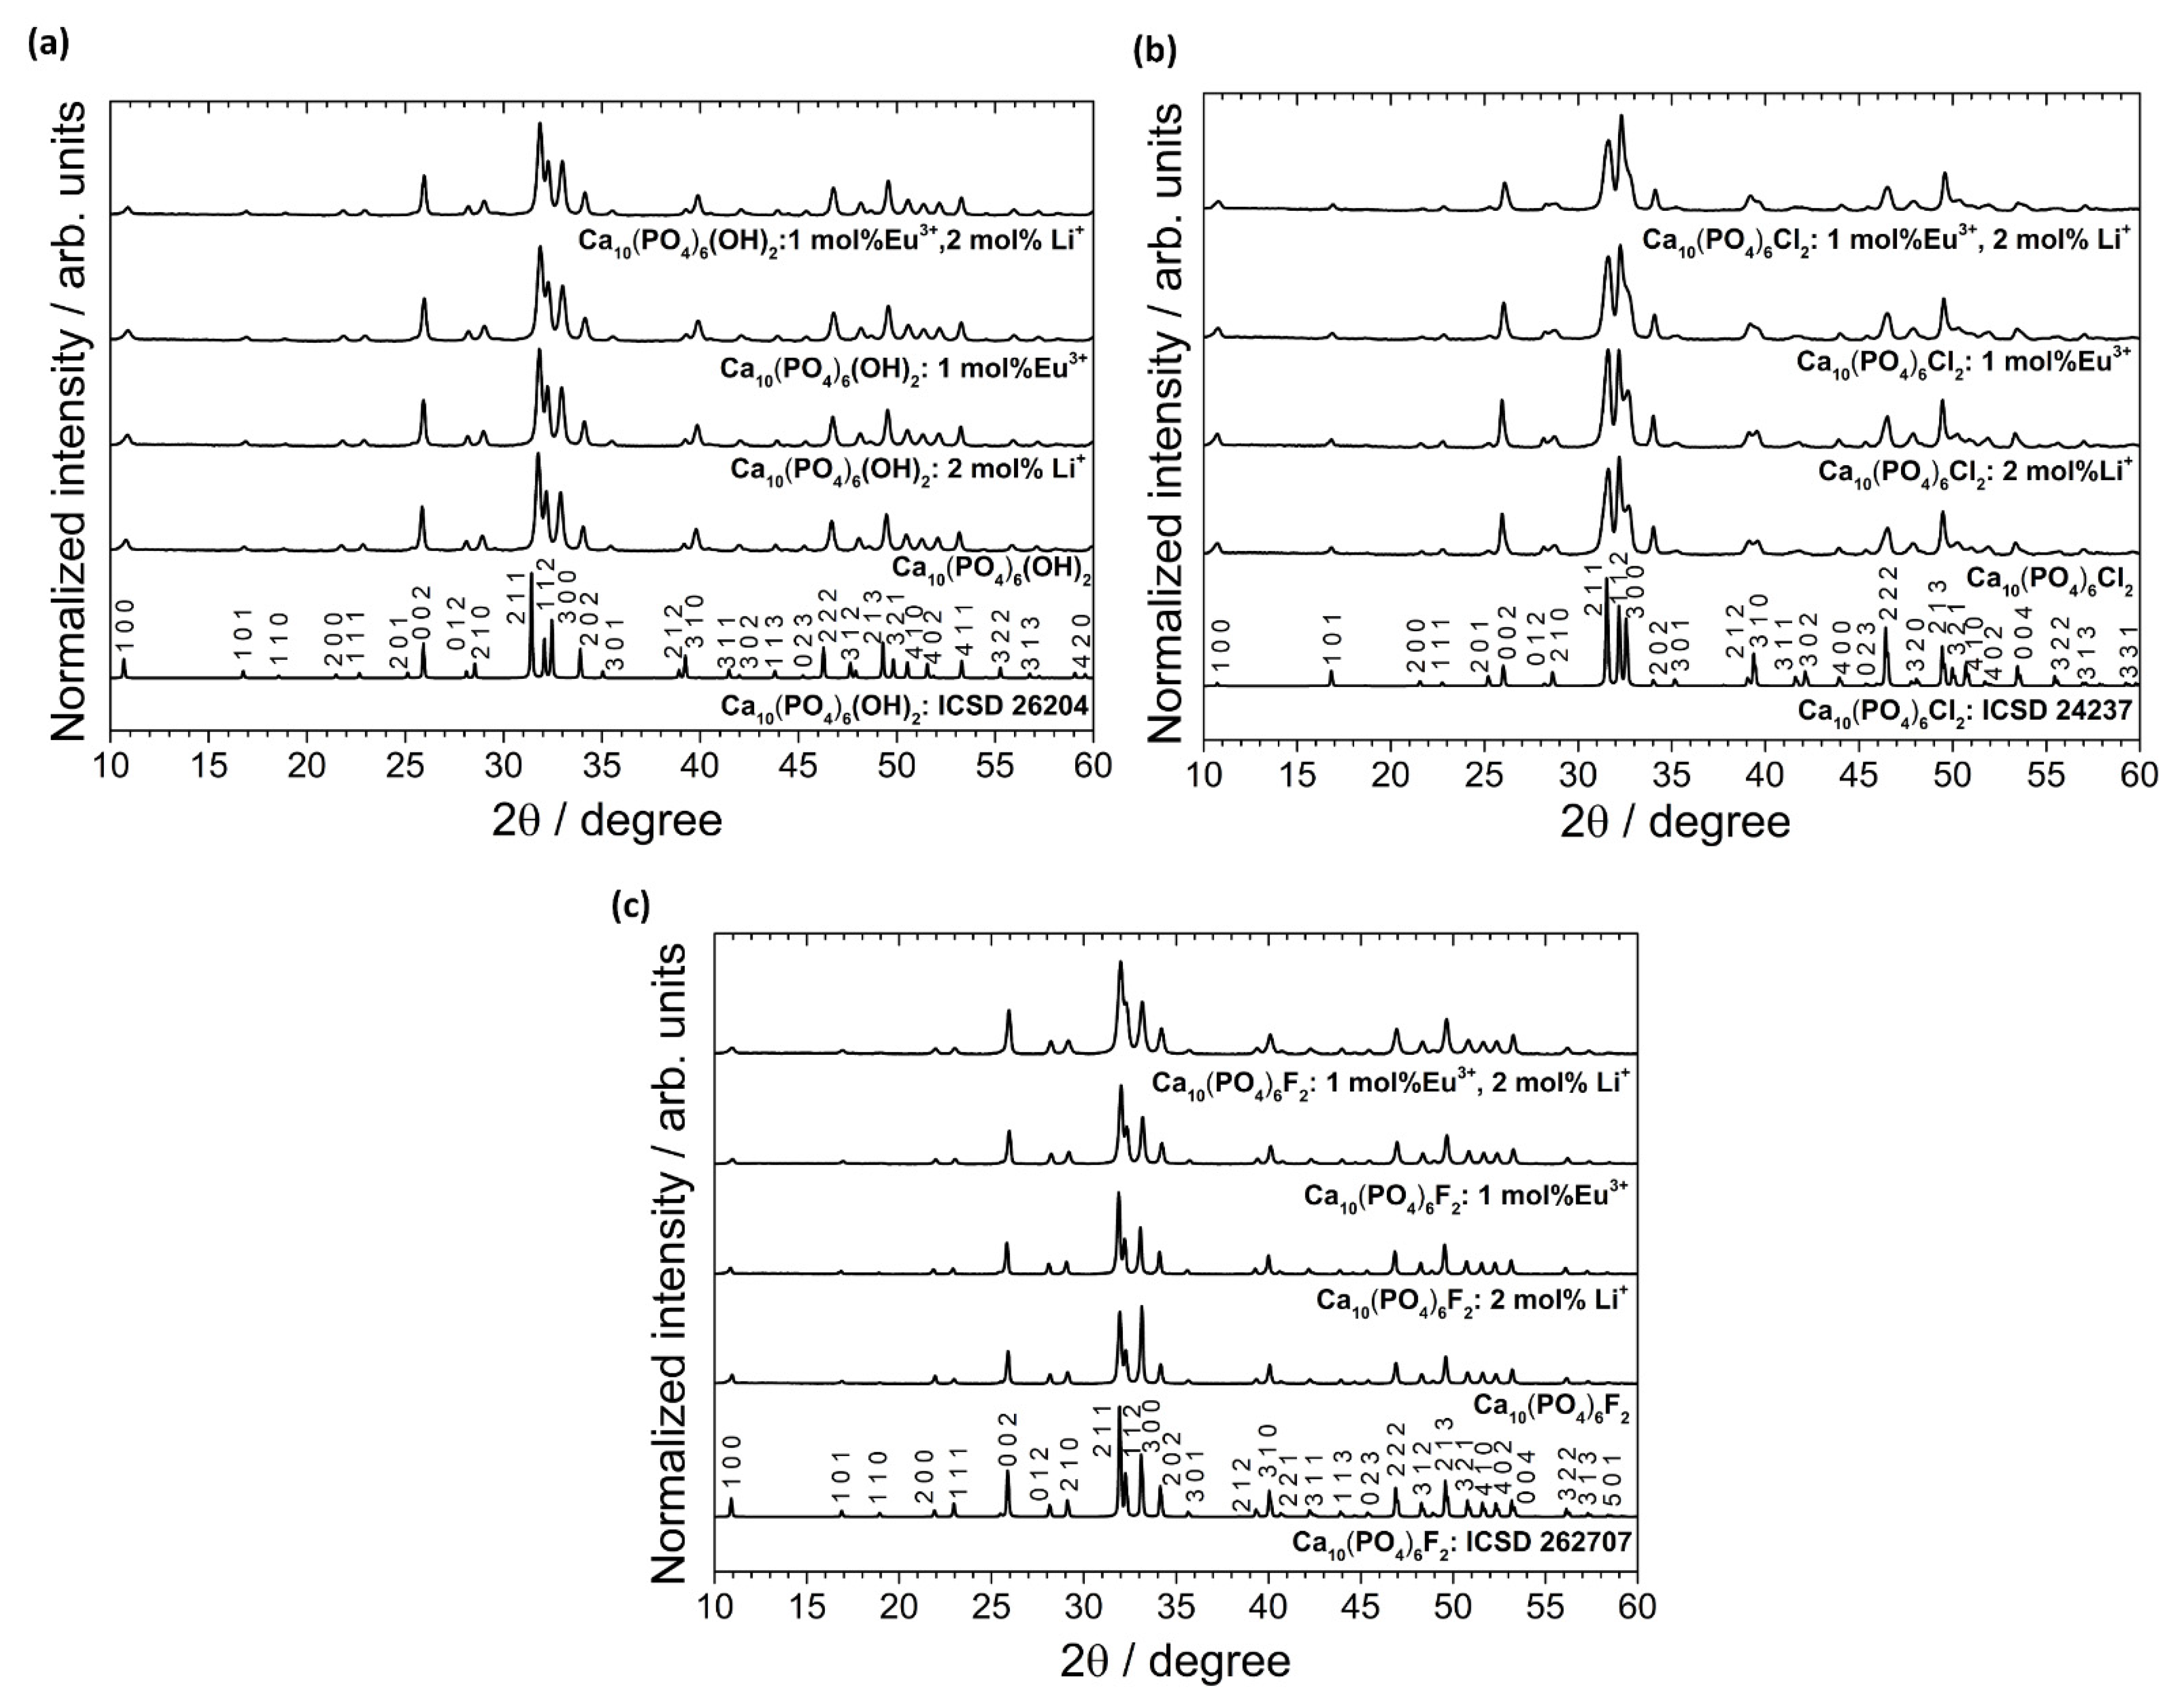
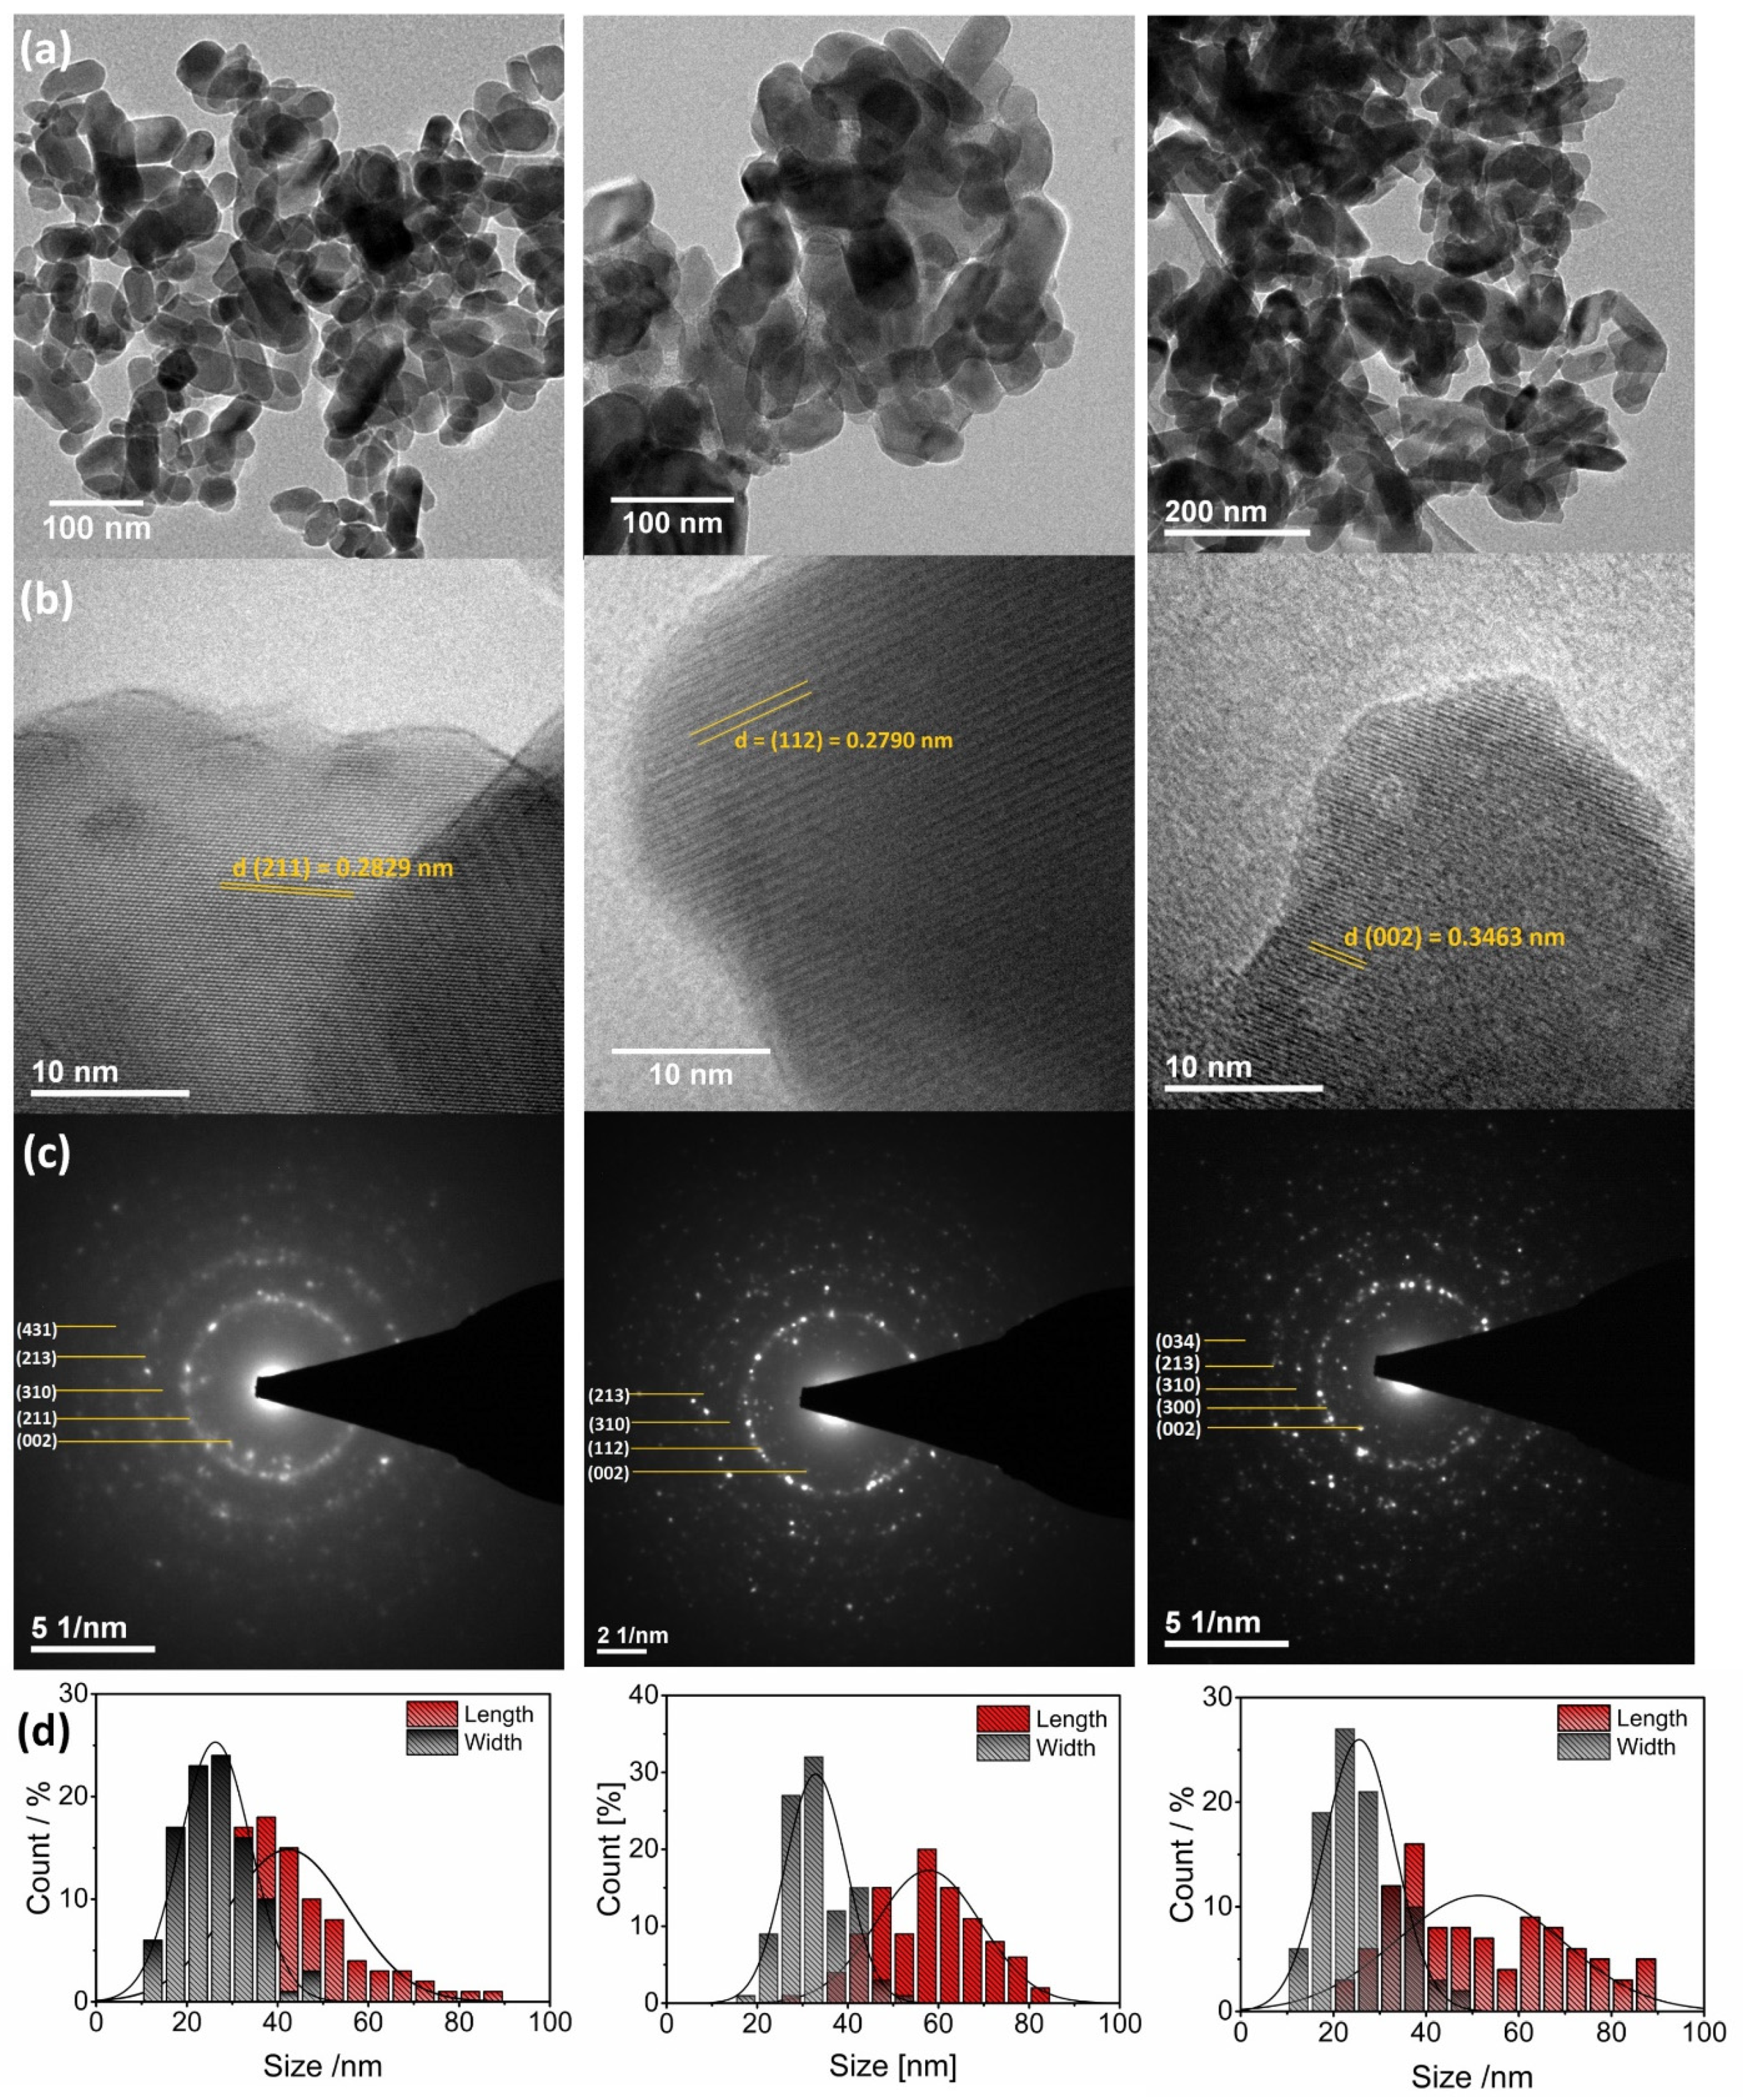
3.1. Physicochemical Characterization of Obtained Nanoapatites
3.2. Biological Properties
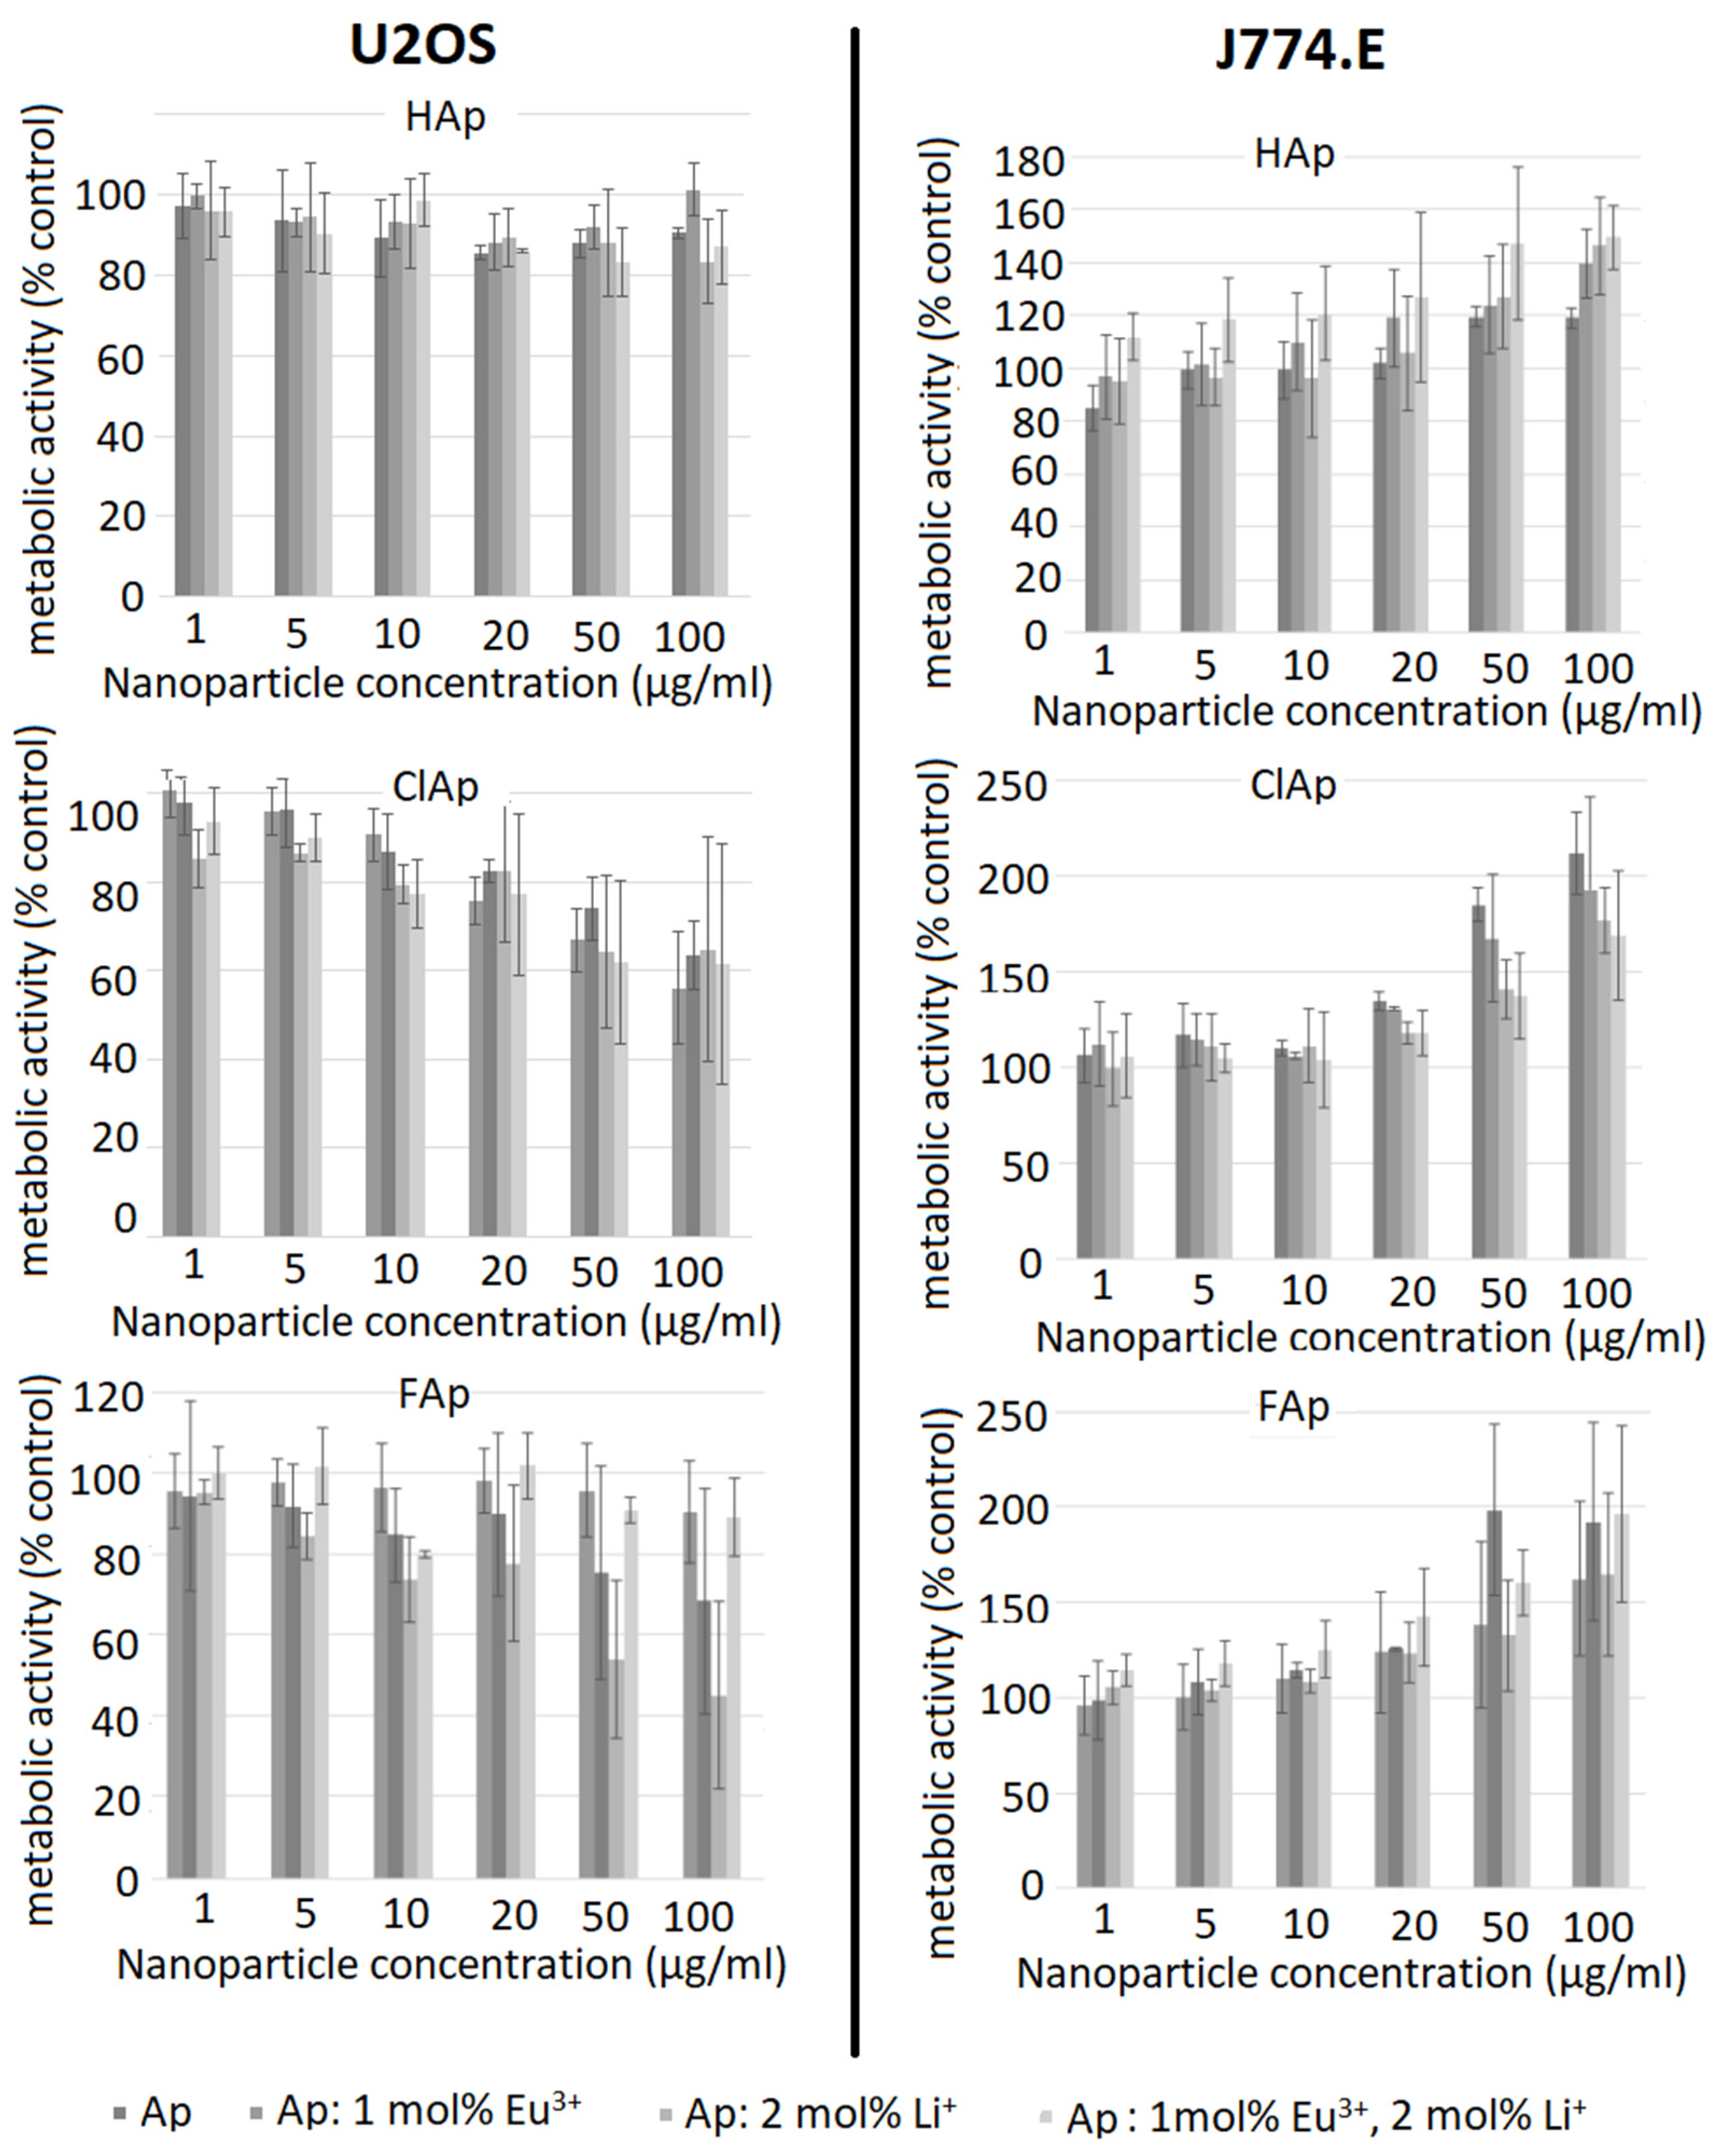
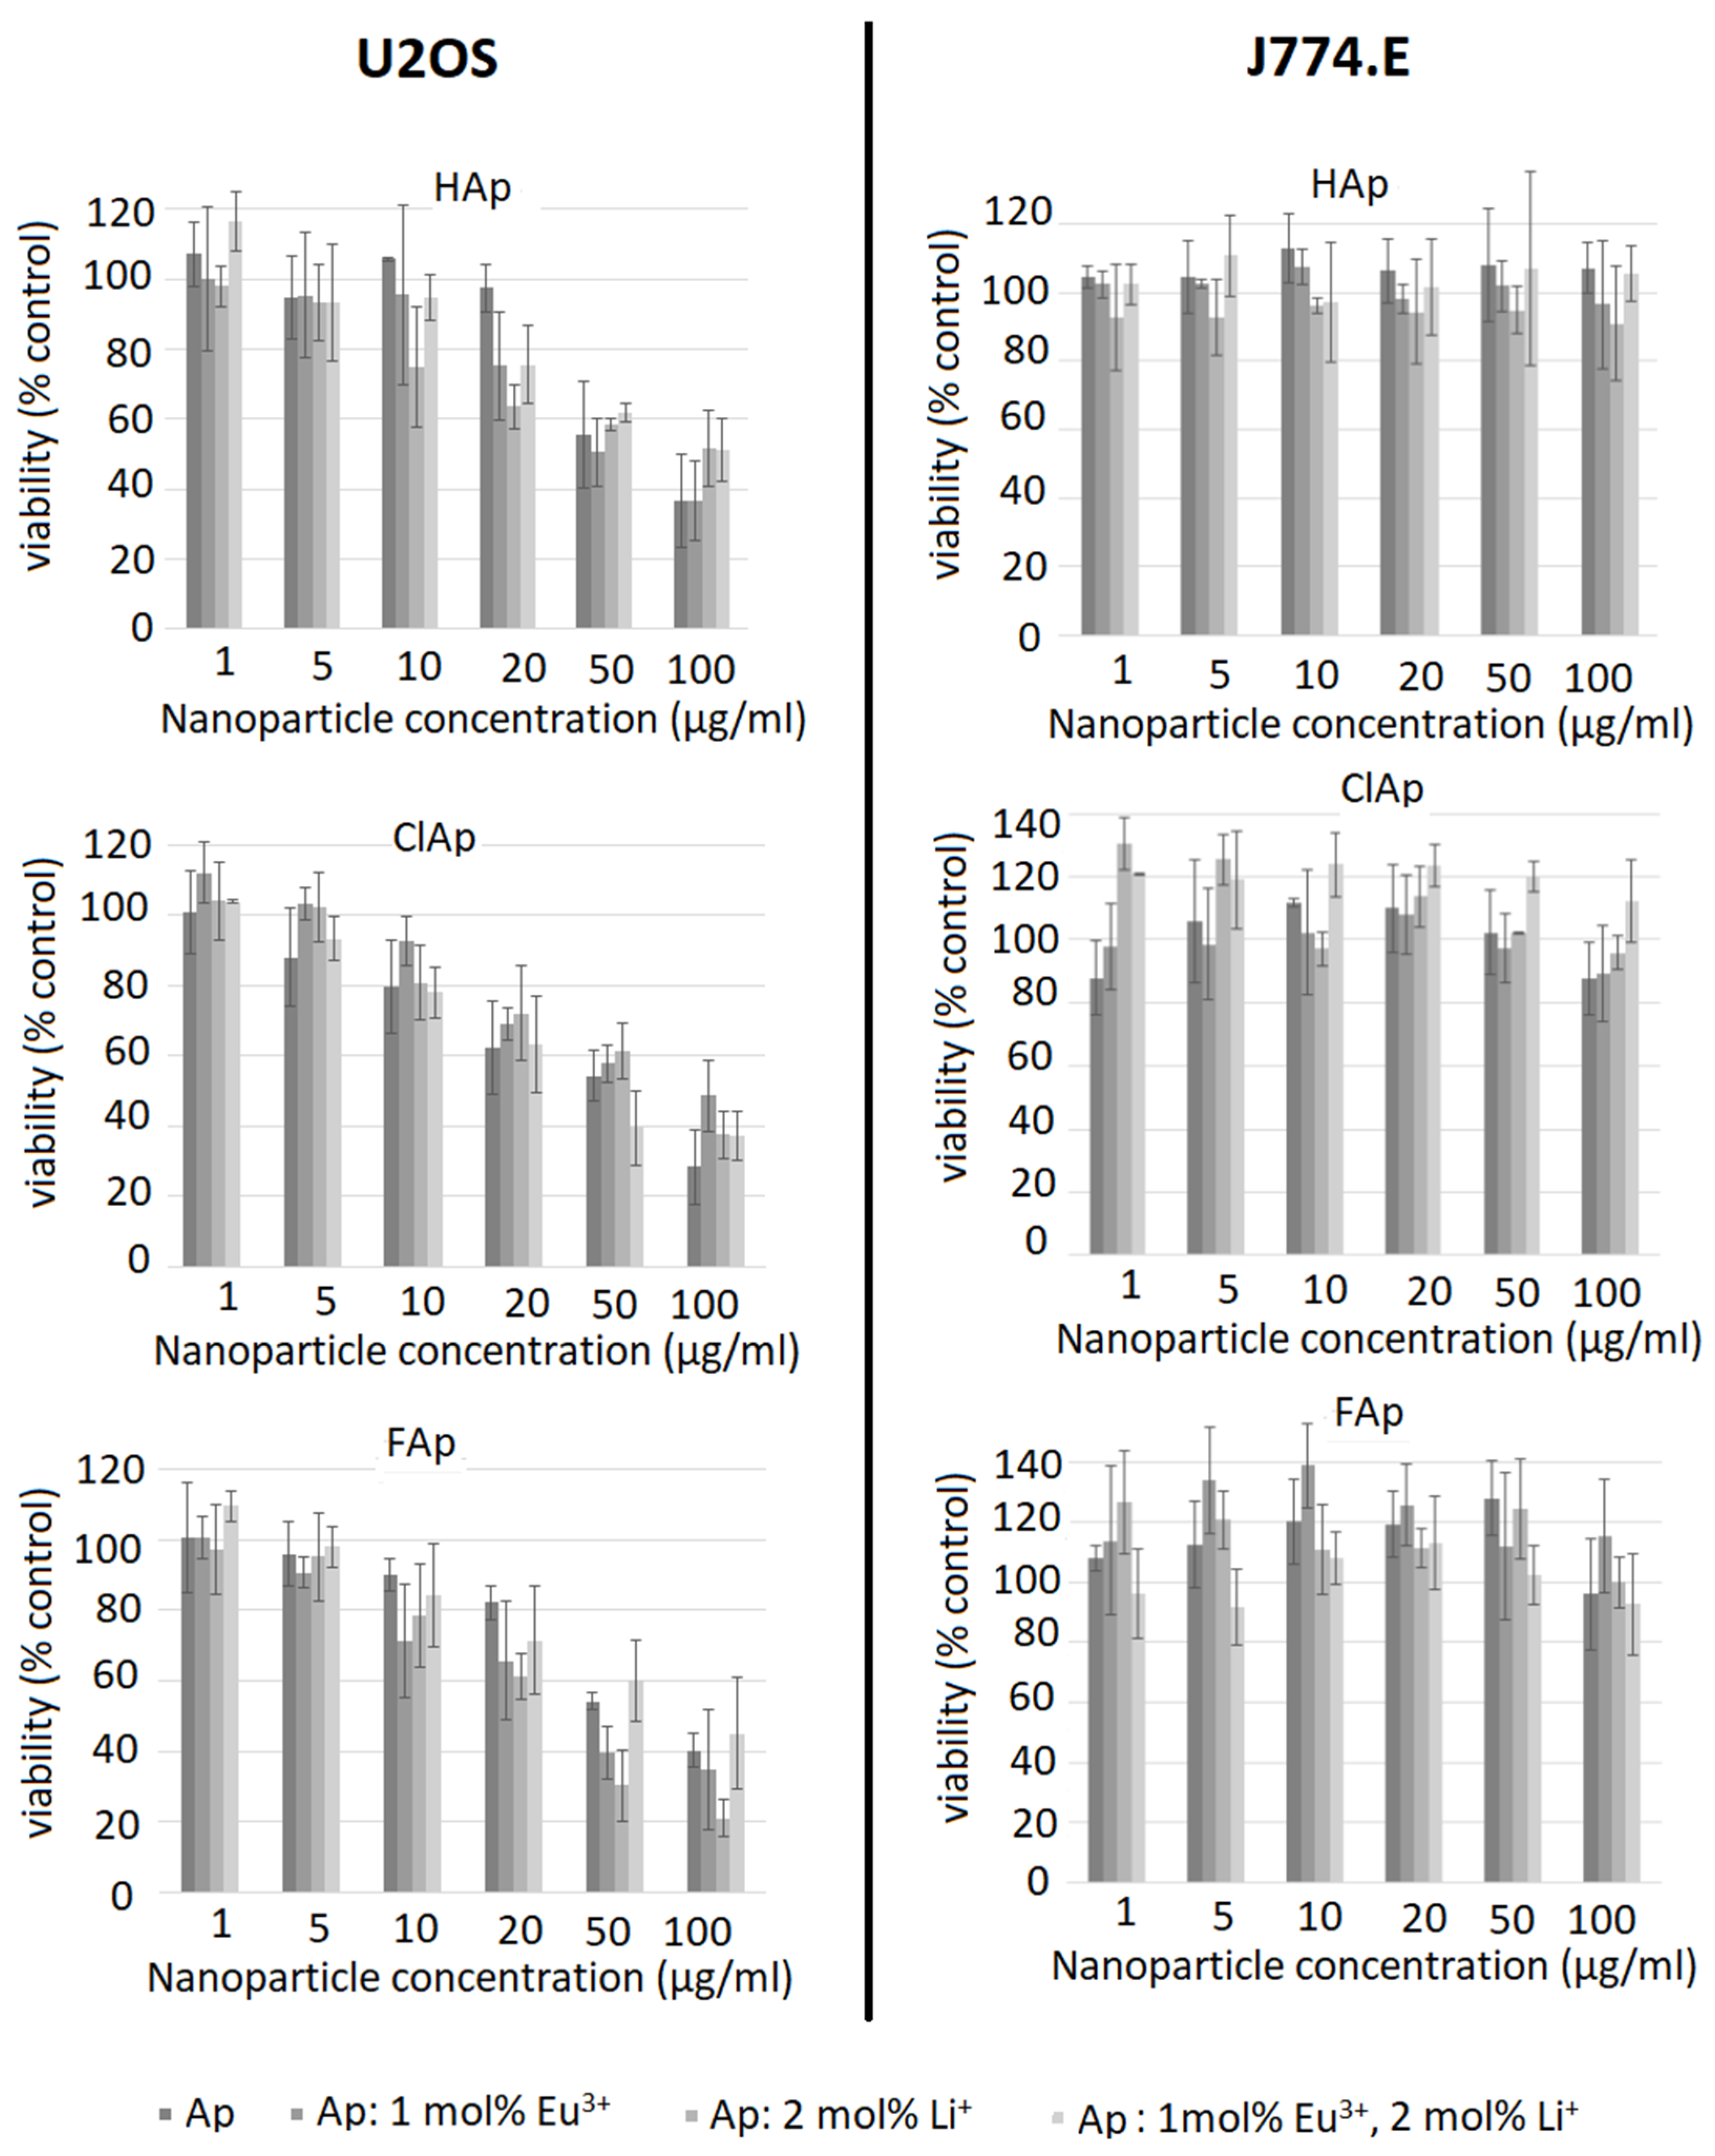
3.2.1. Cytotoxicity Assessment in Osteosarcoma Cell Line
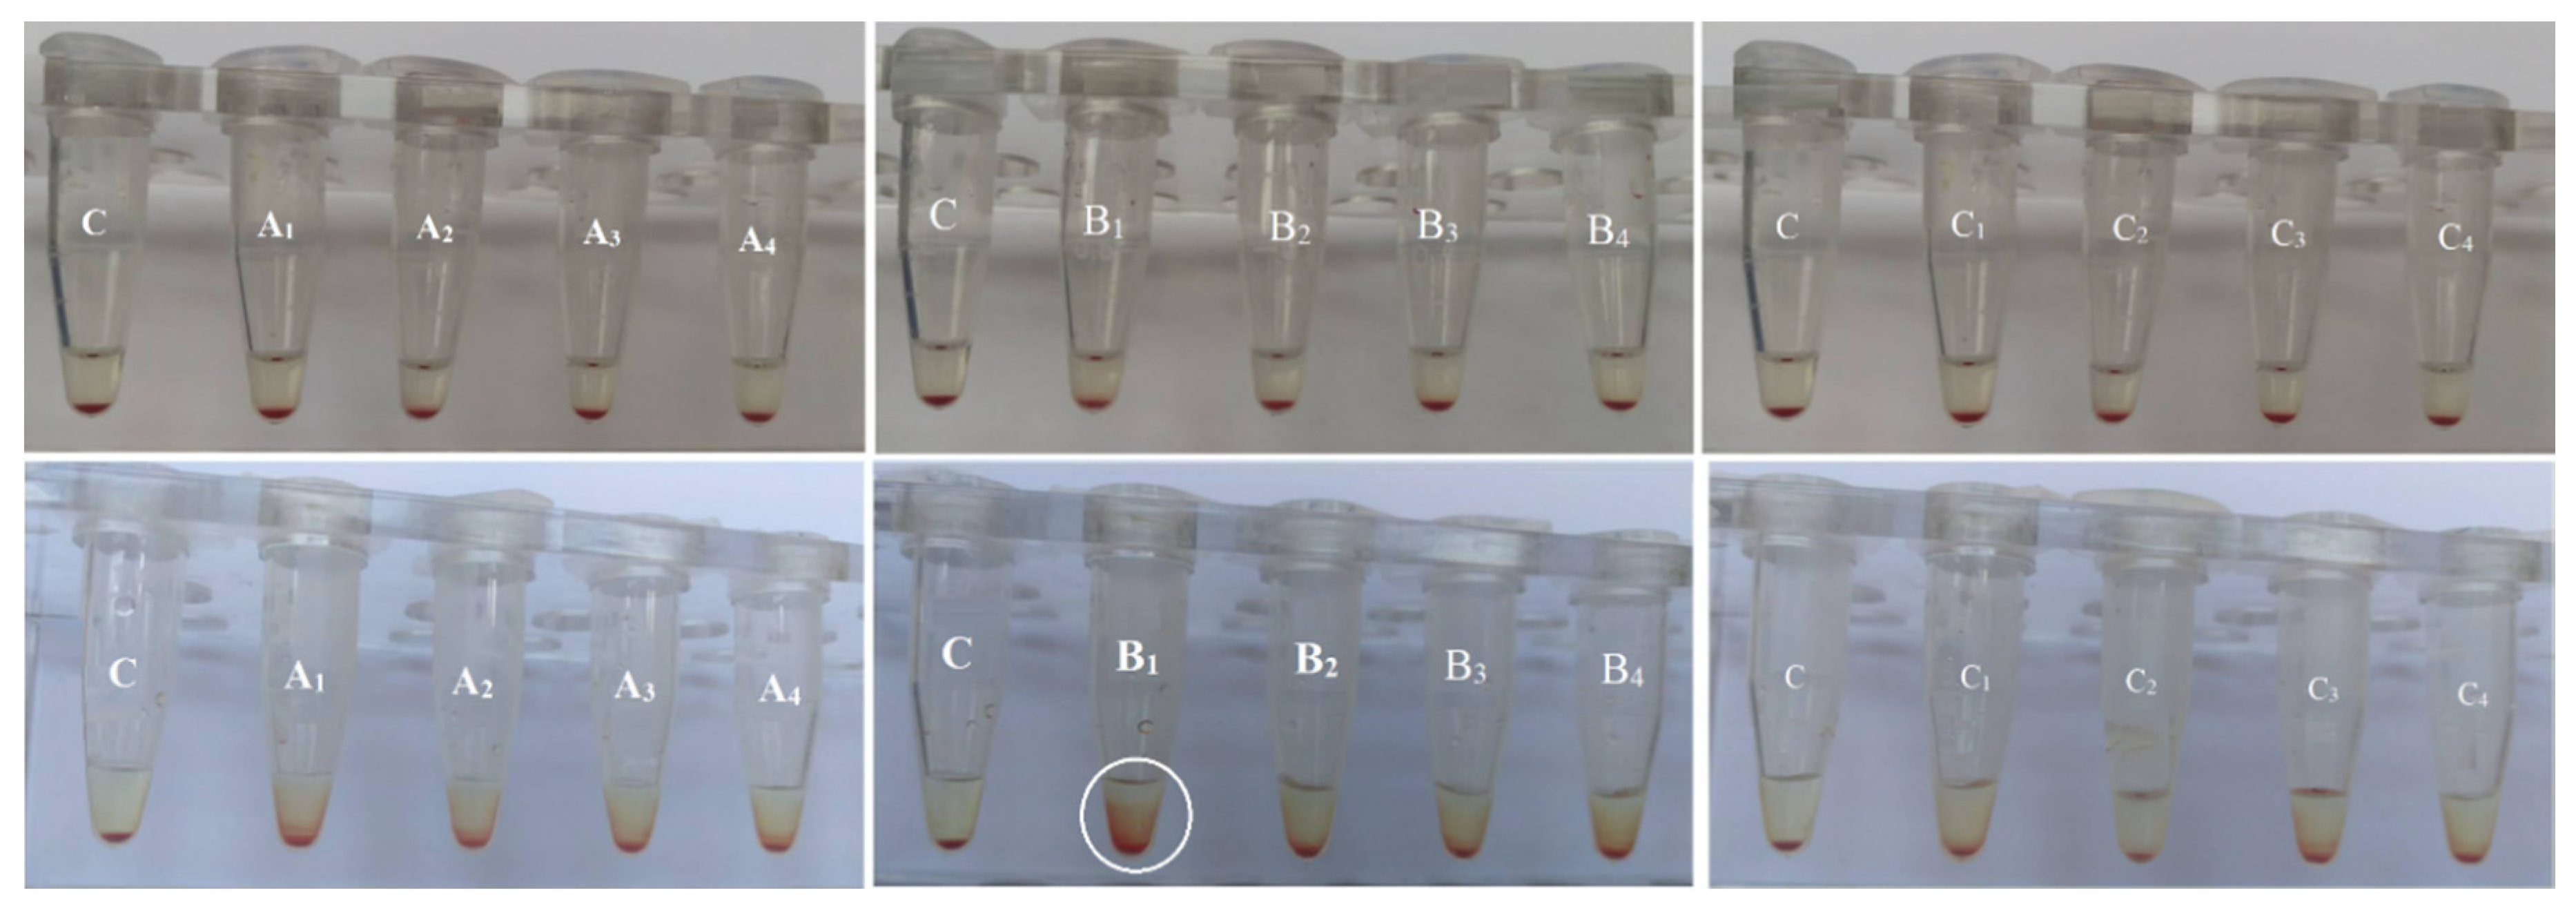
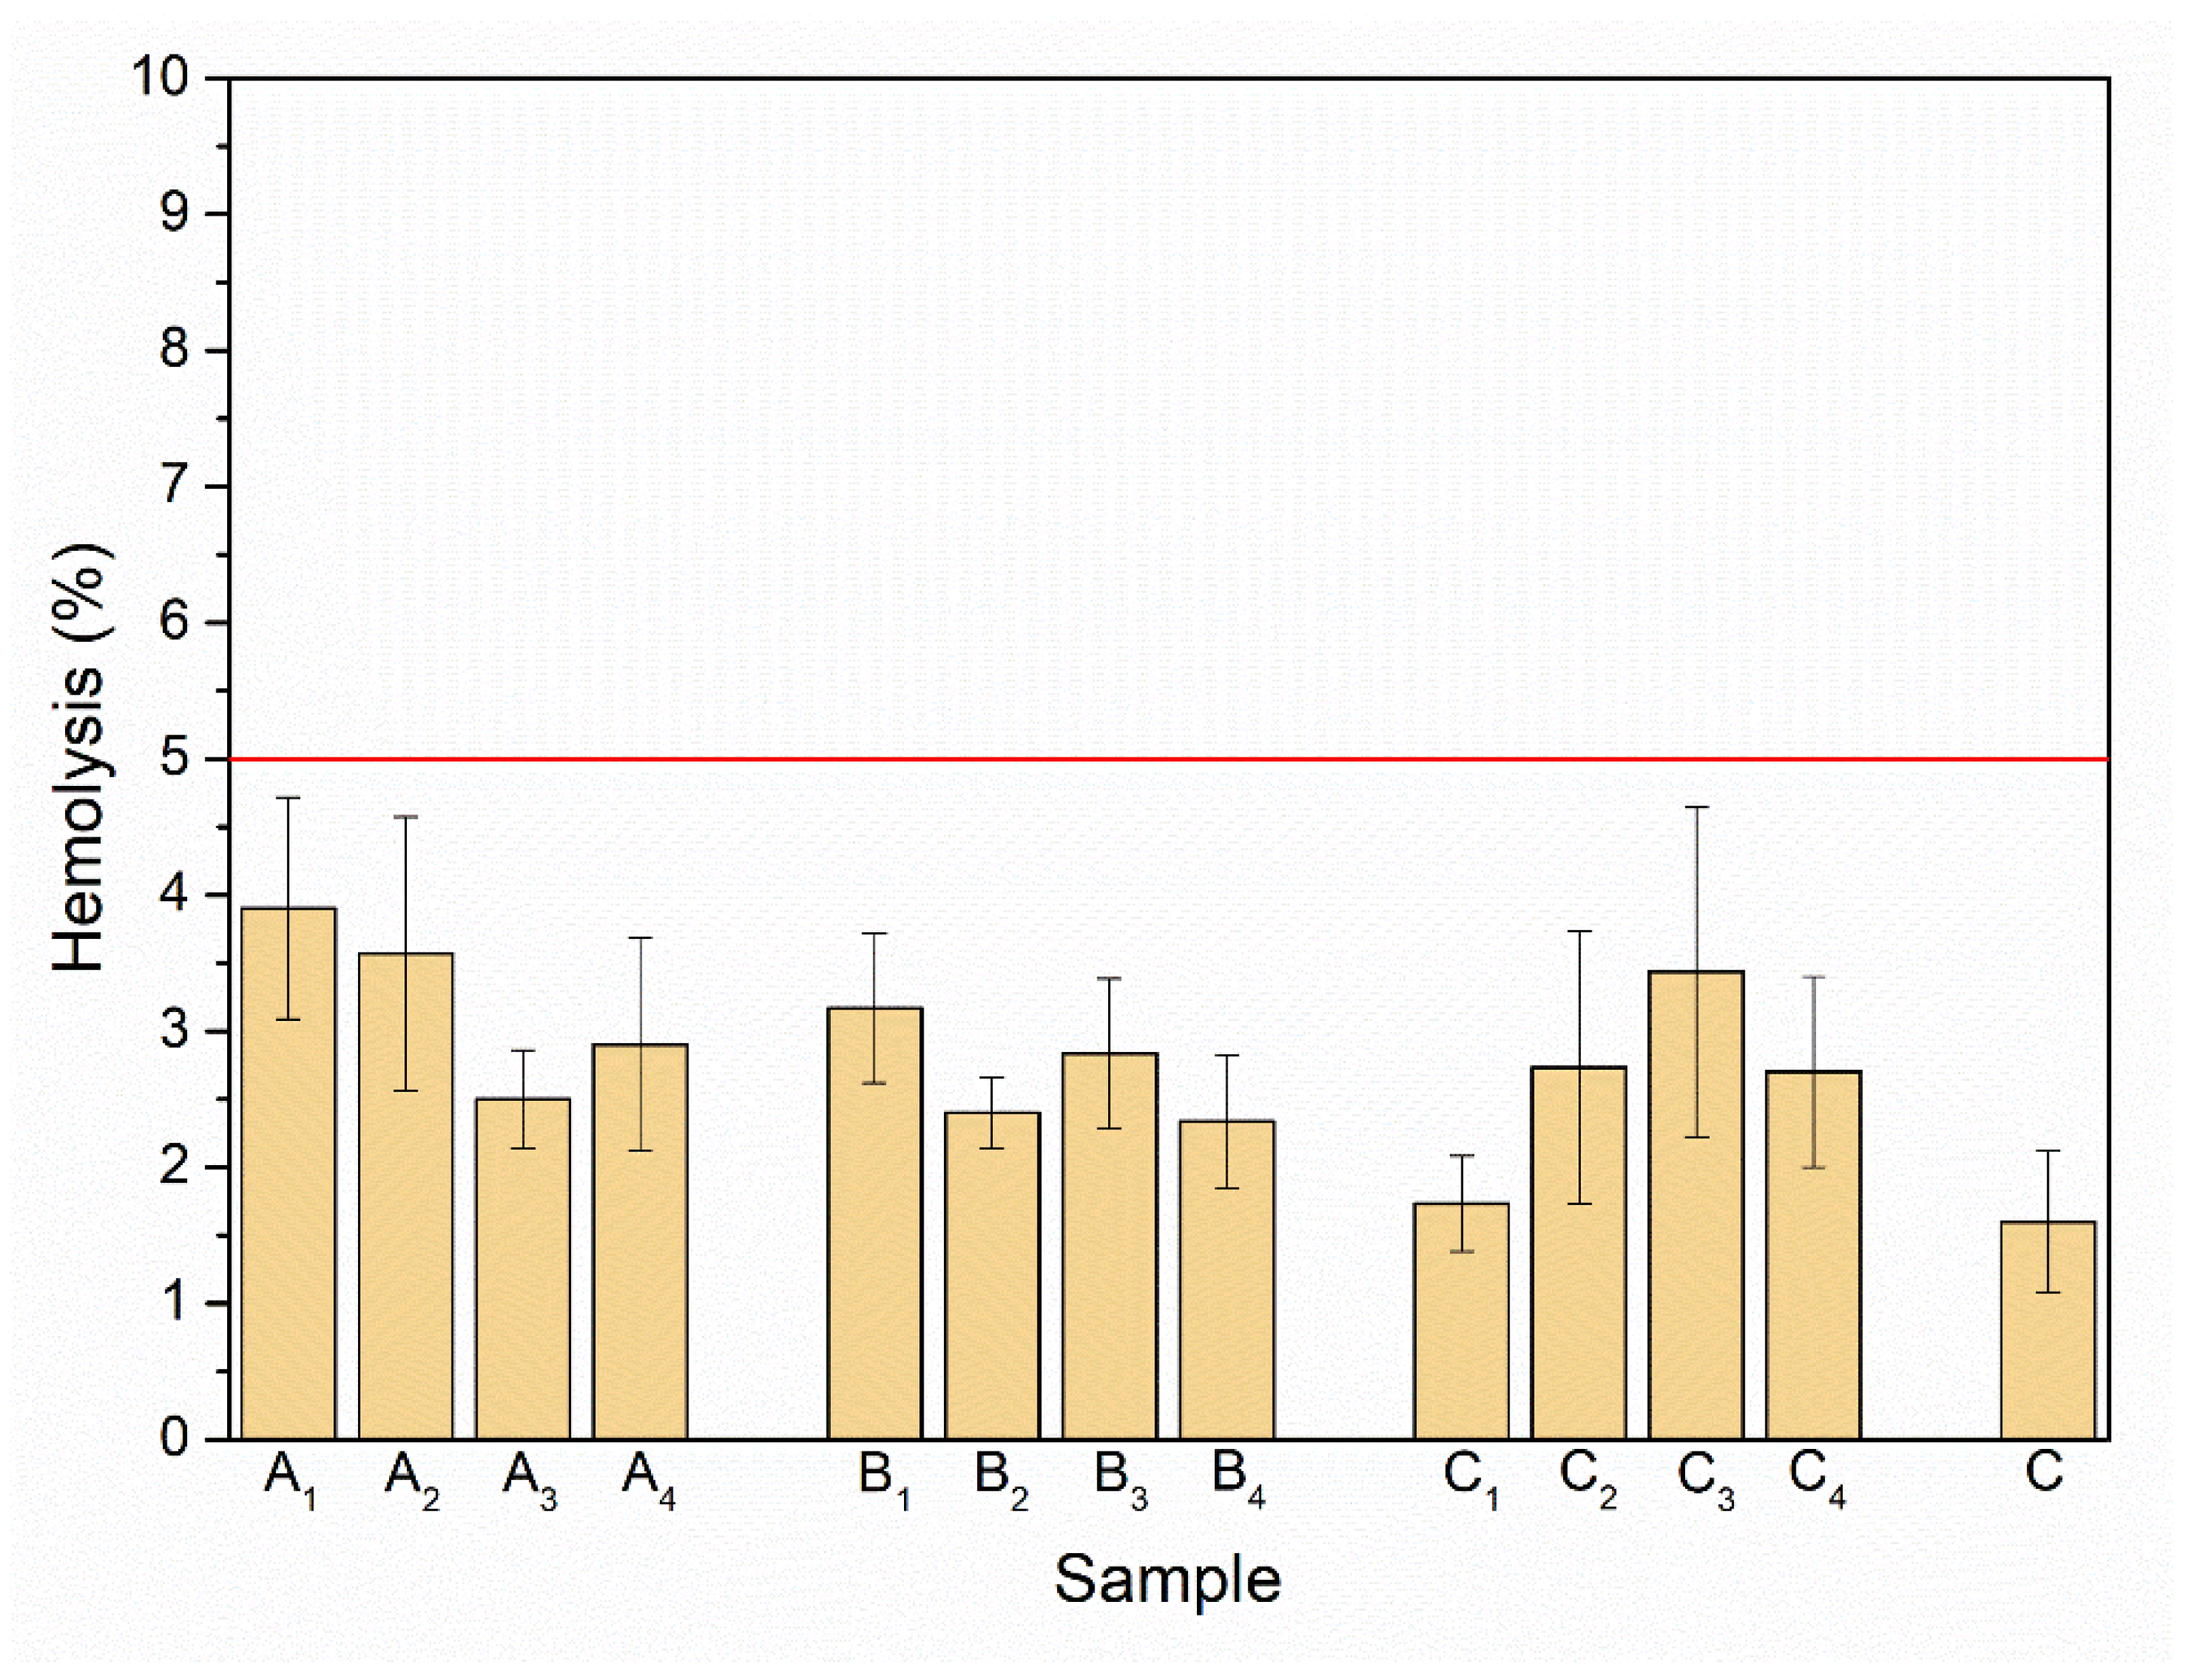
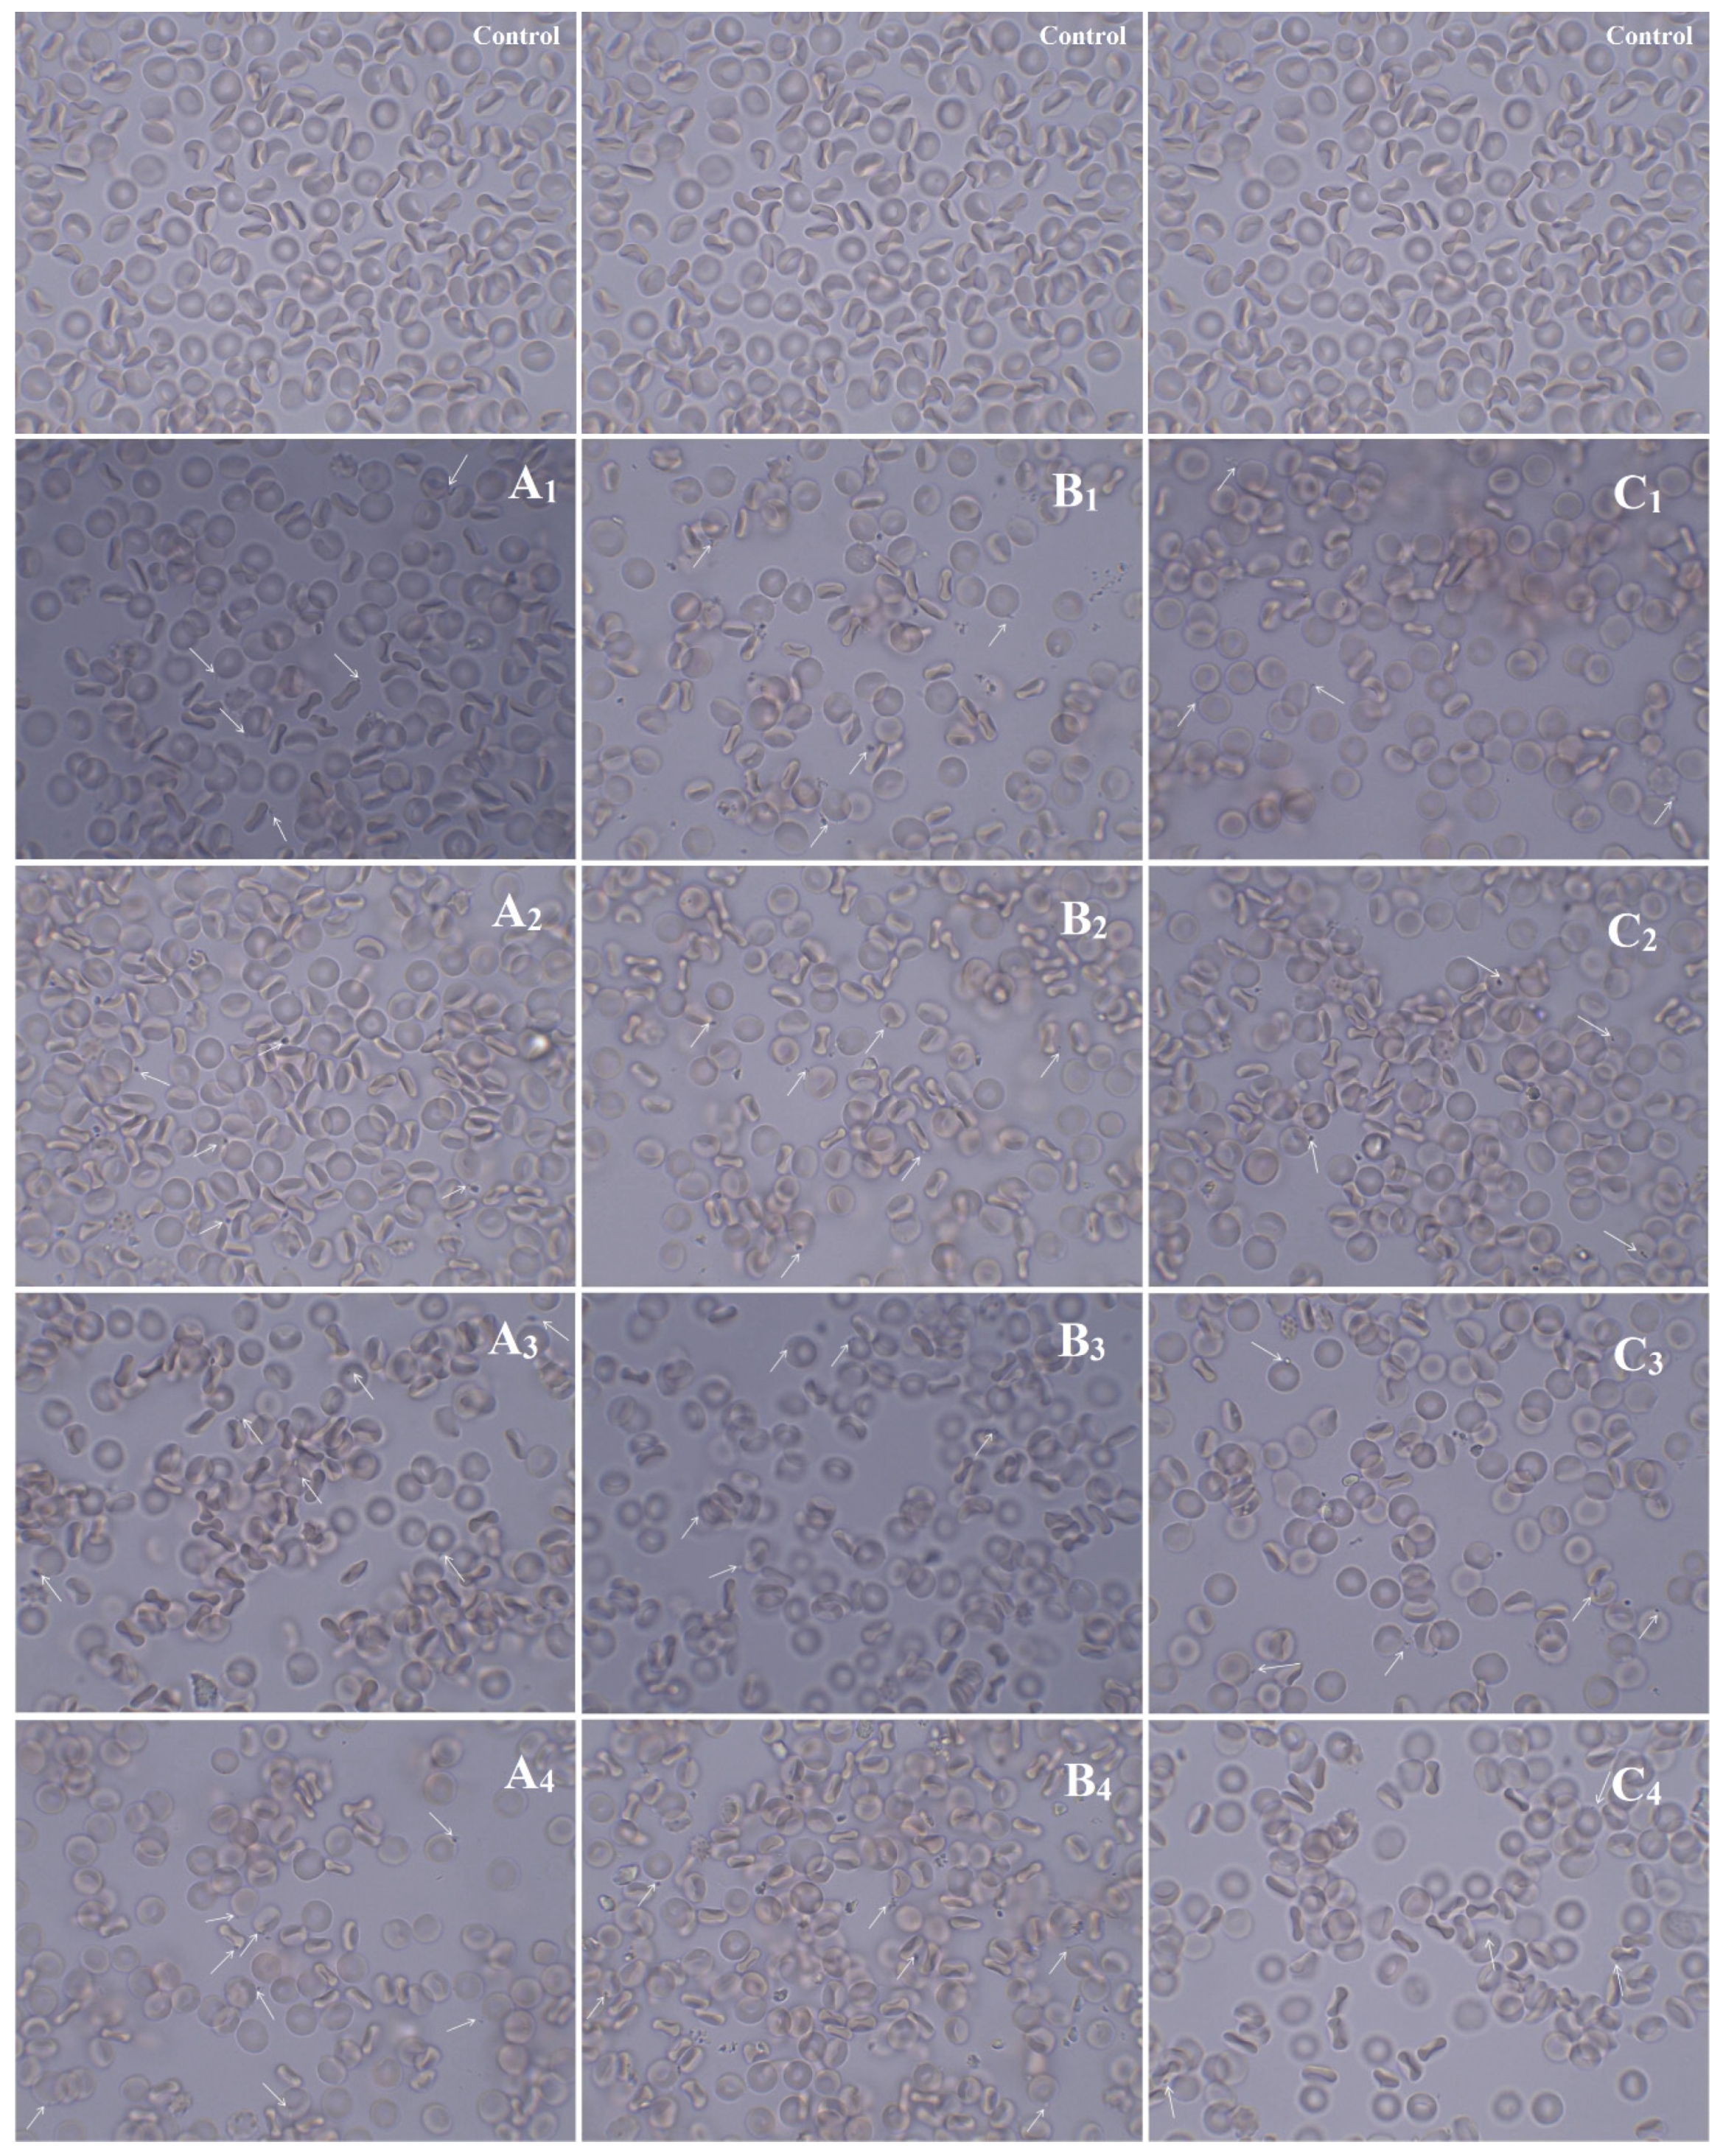
3.2.2. In Vitro Hemolytic Activity in Human RBCs
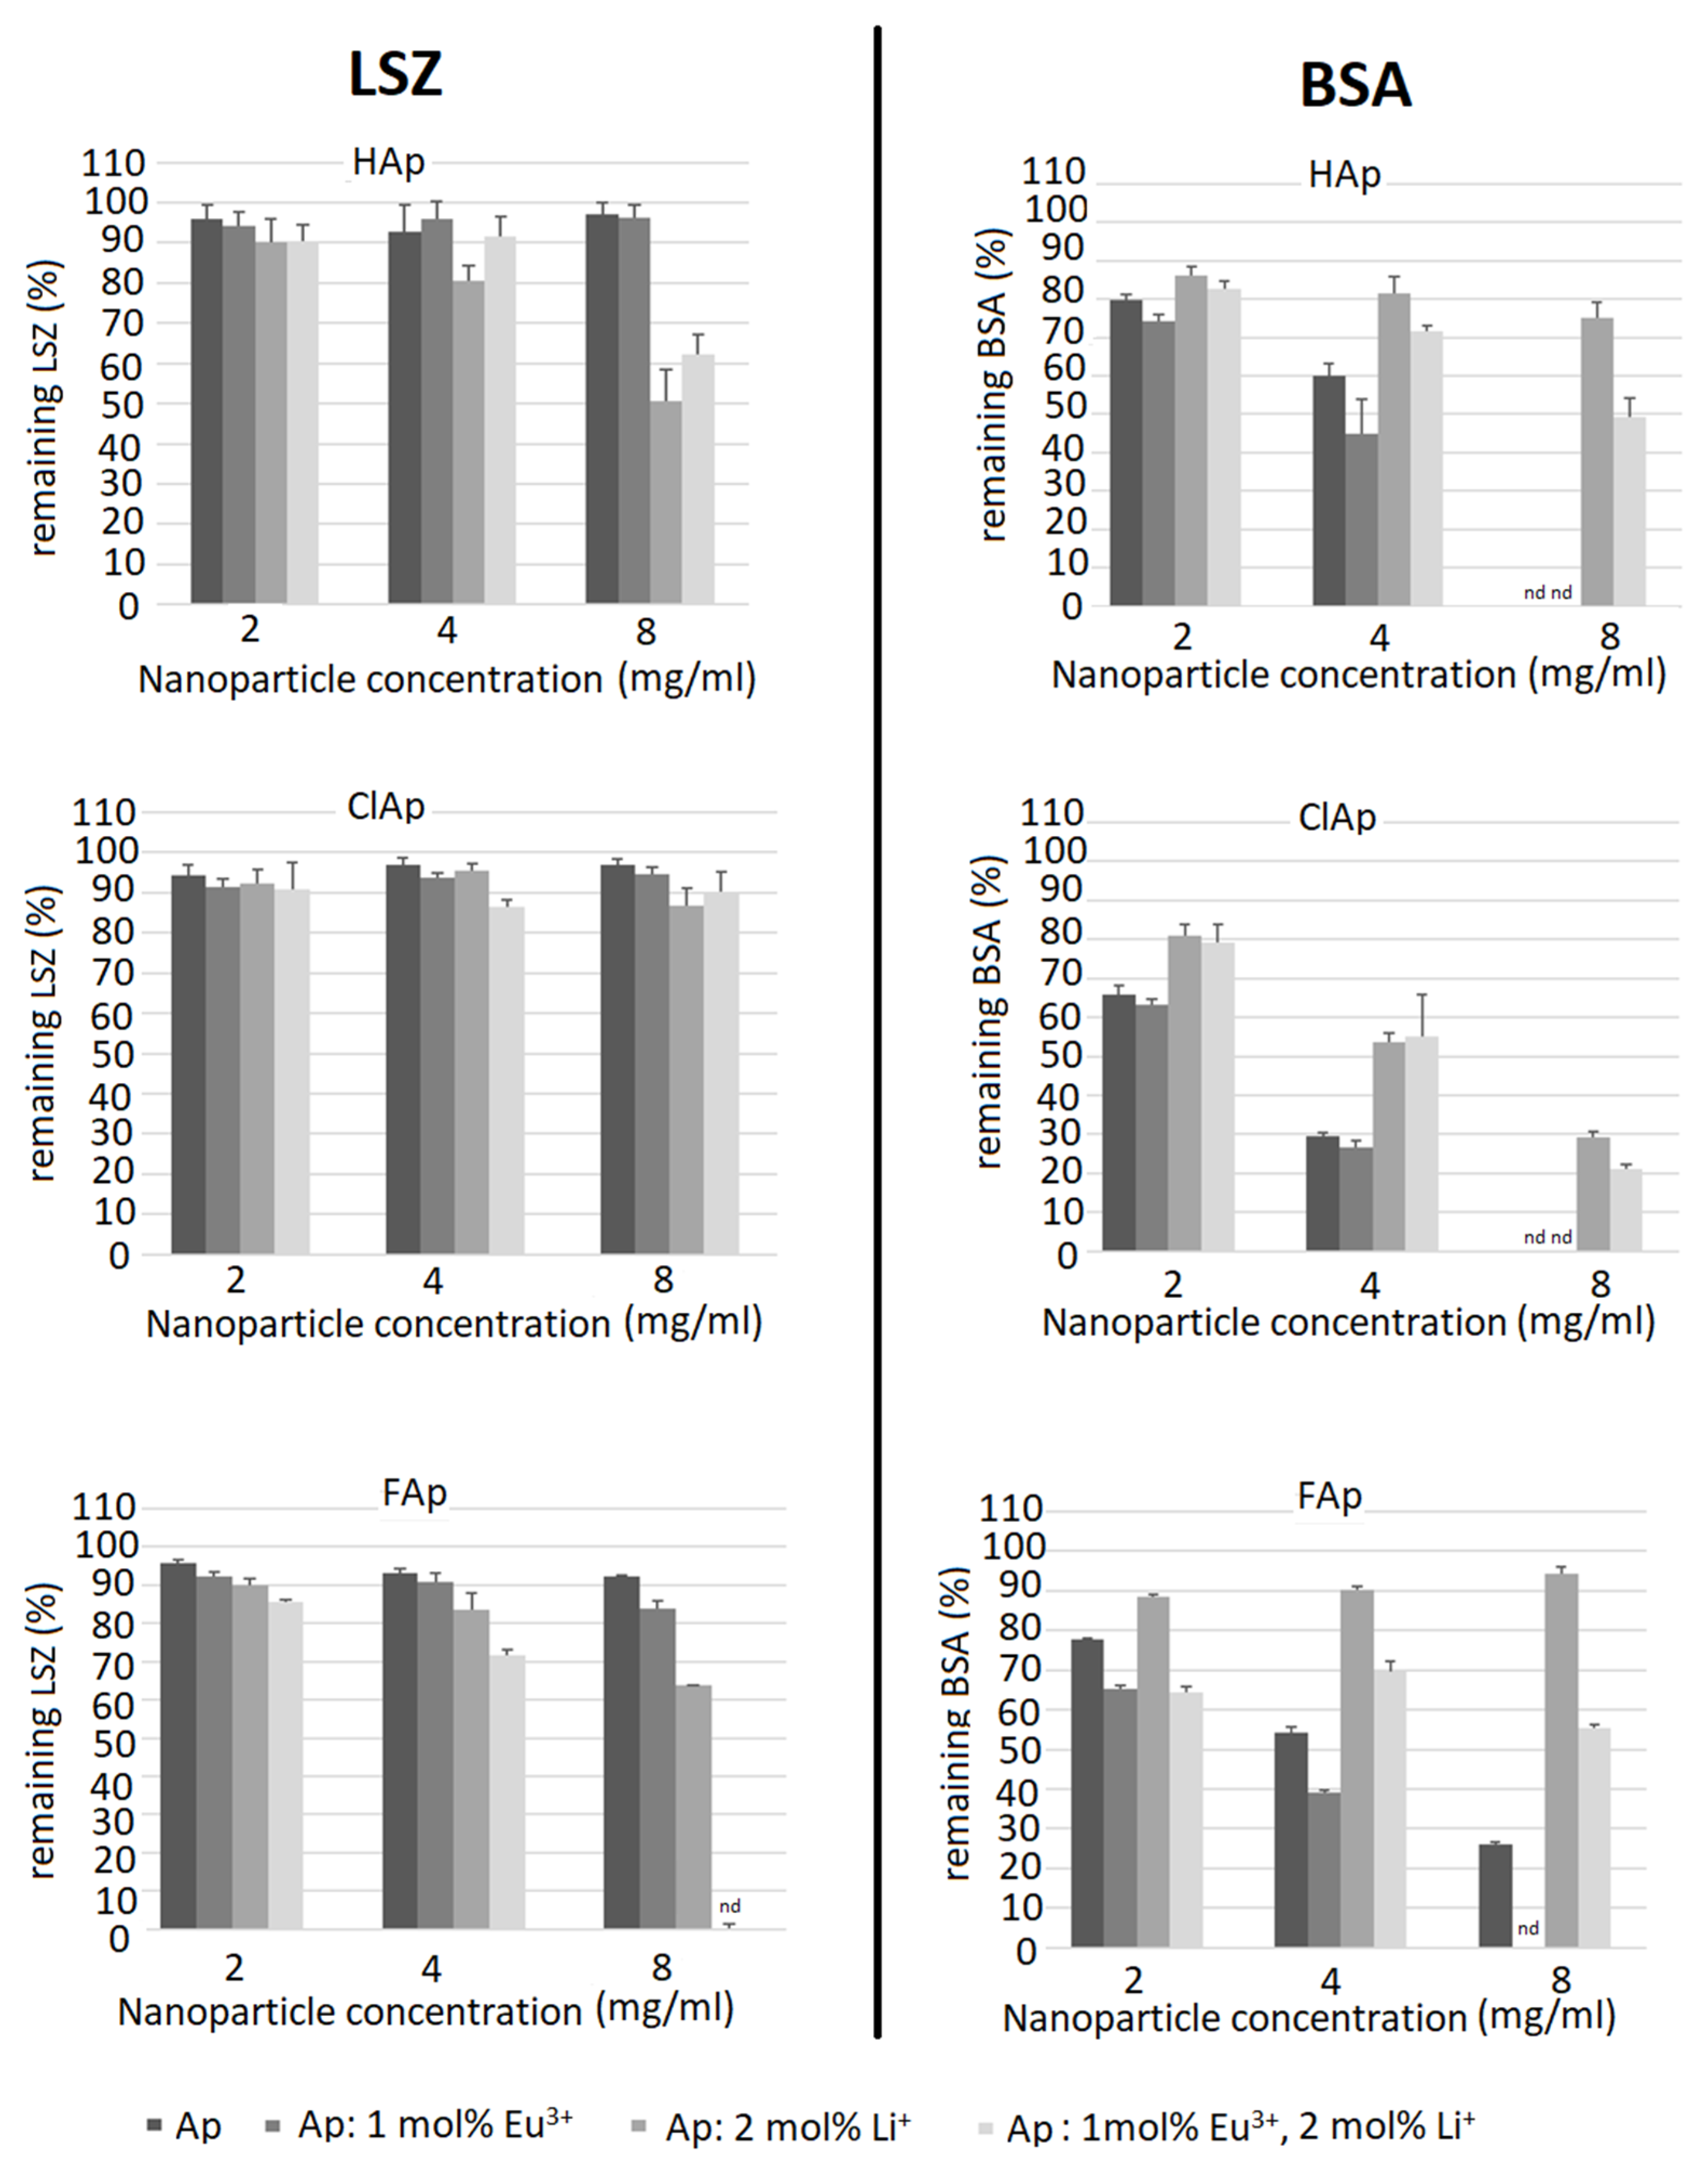
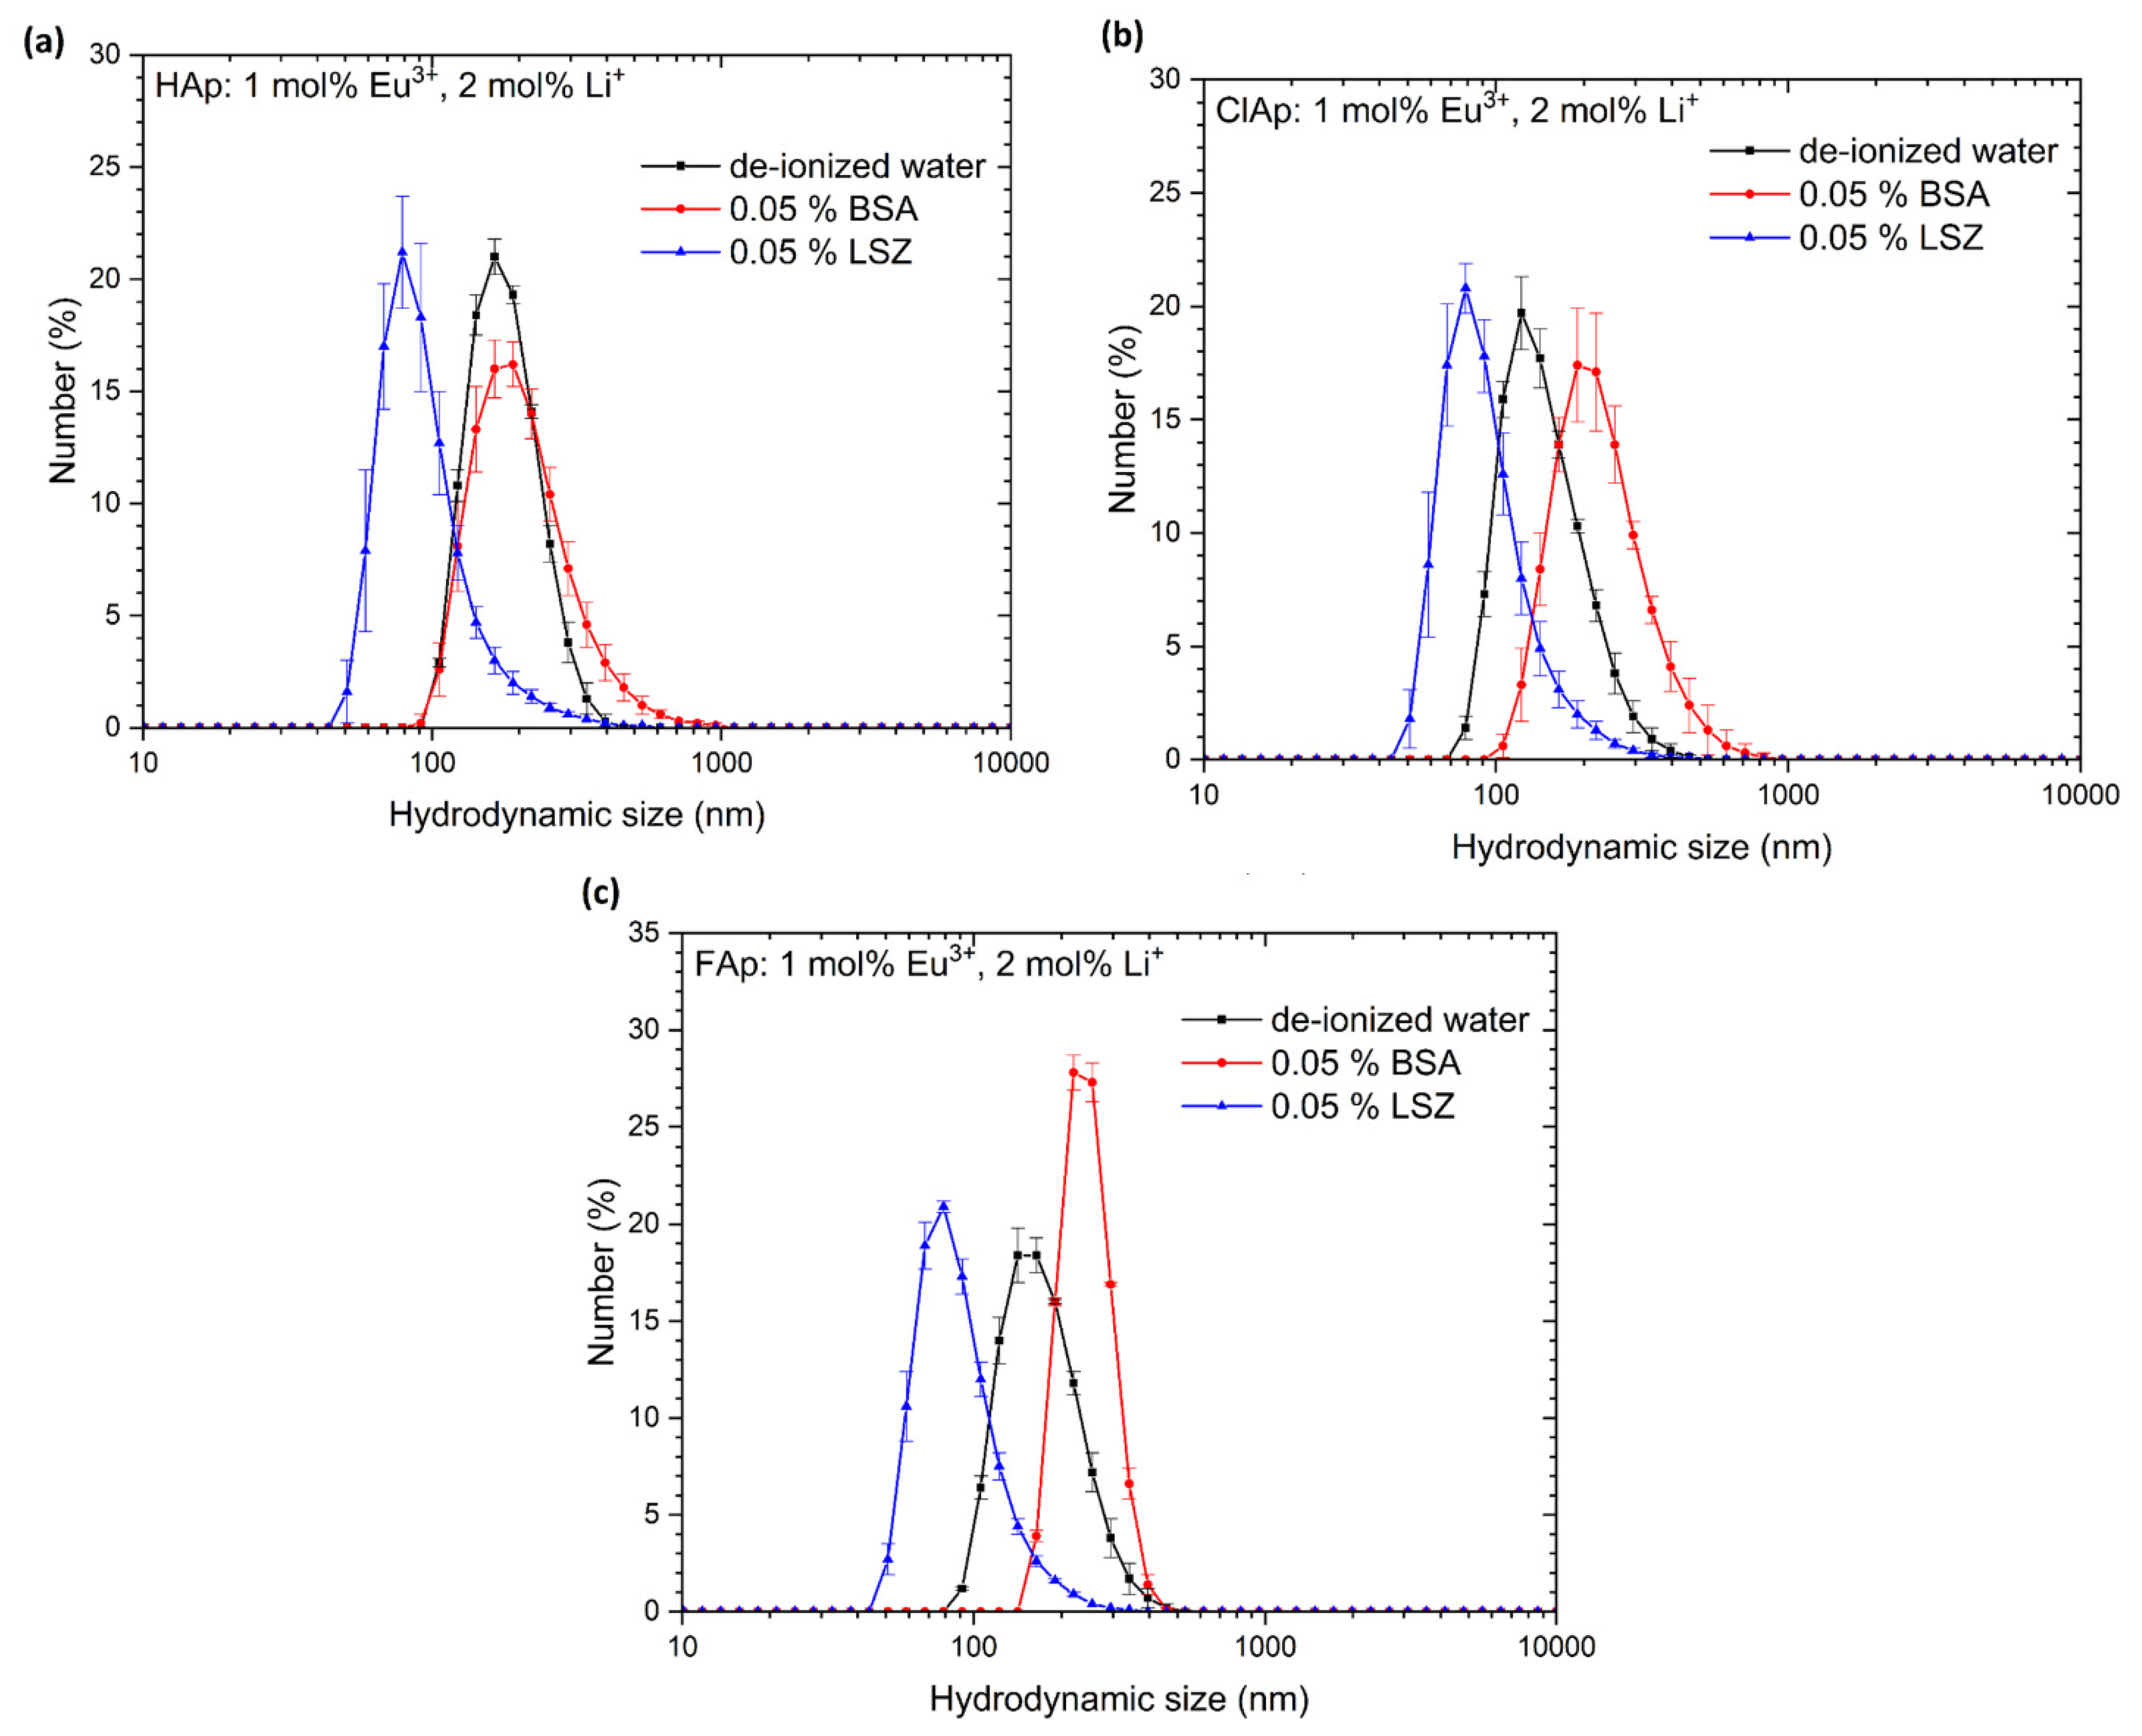
3.2.3. Bovine Serum Albumin and Lysozyme Interaction
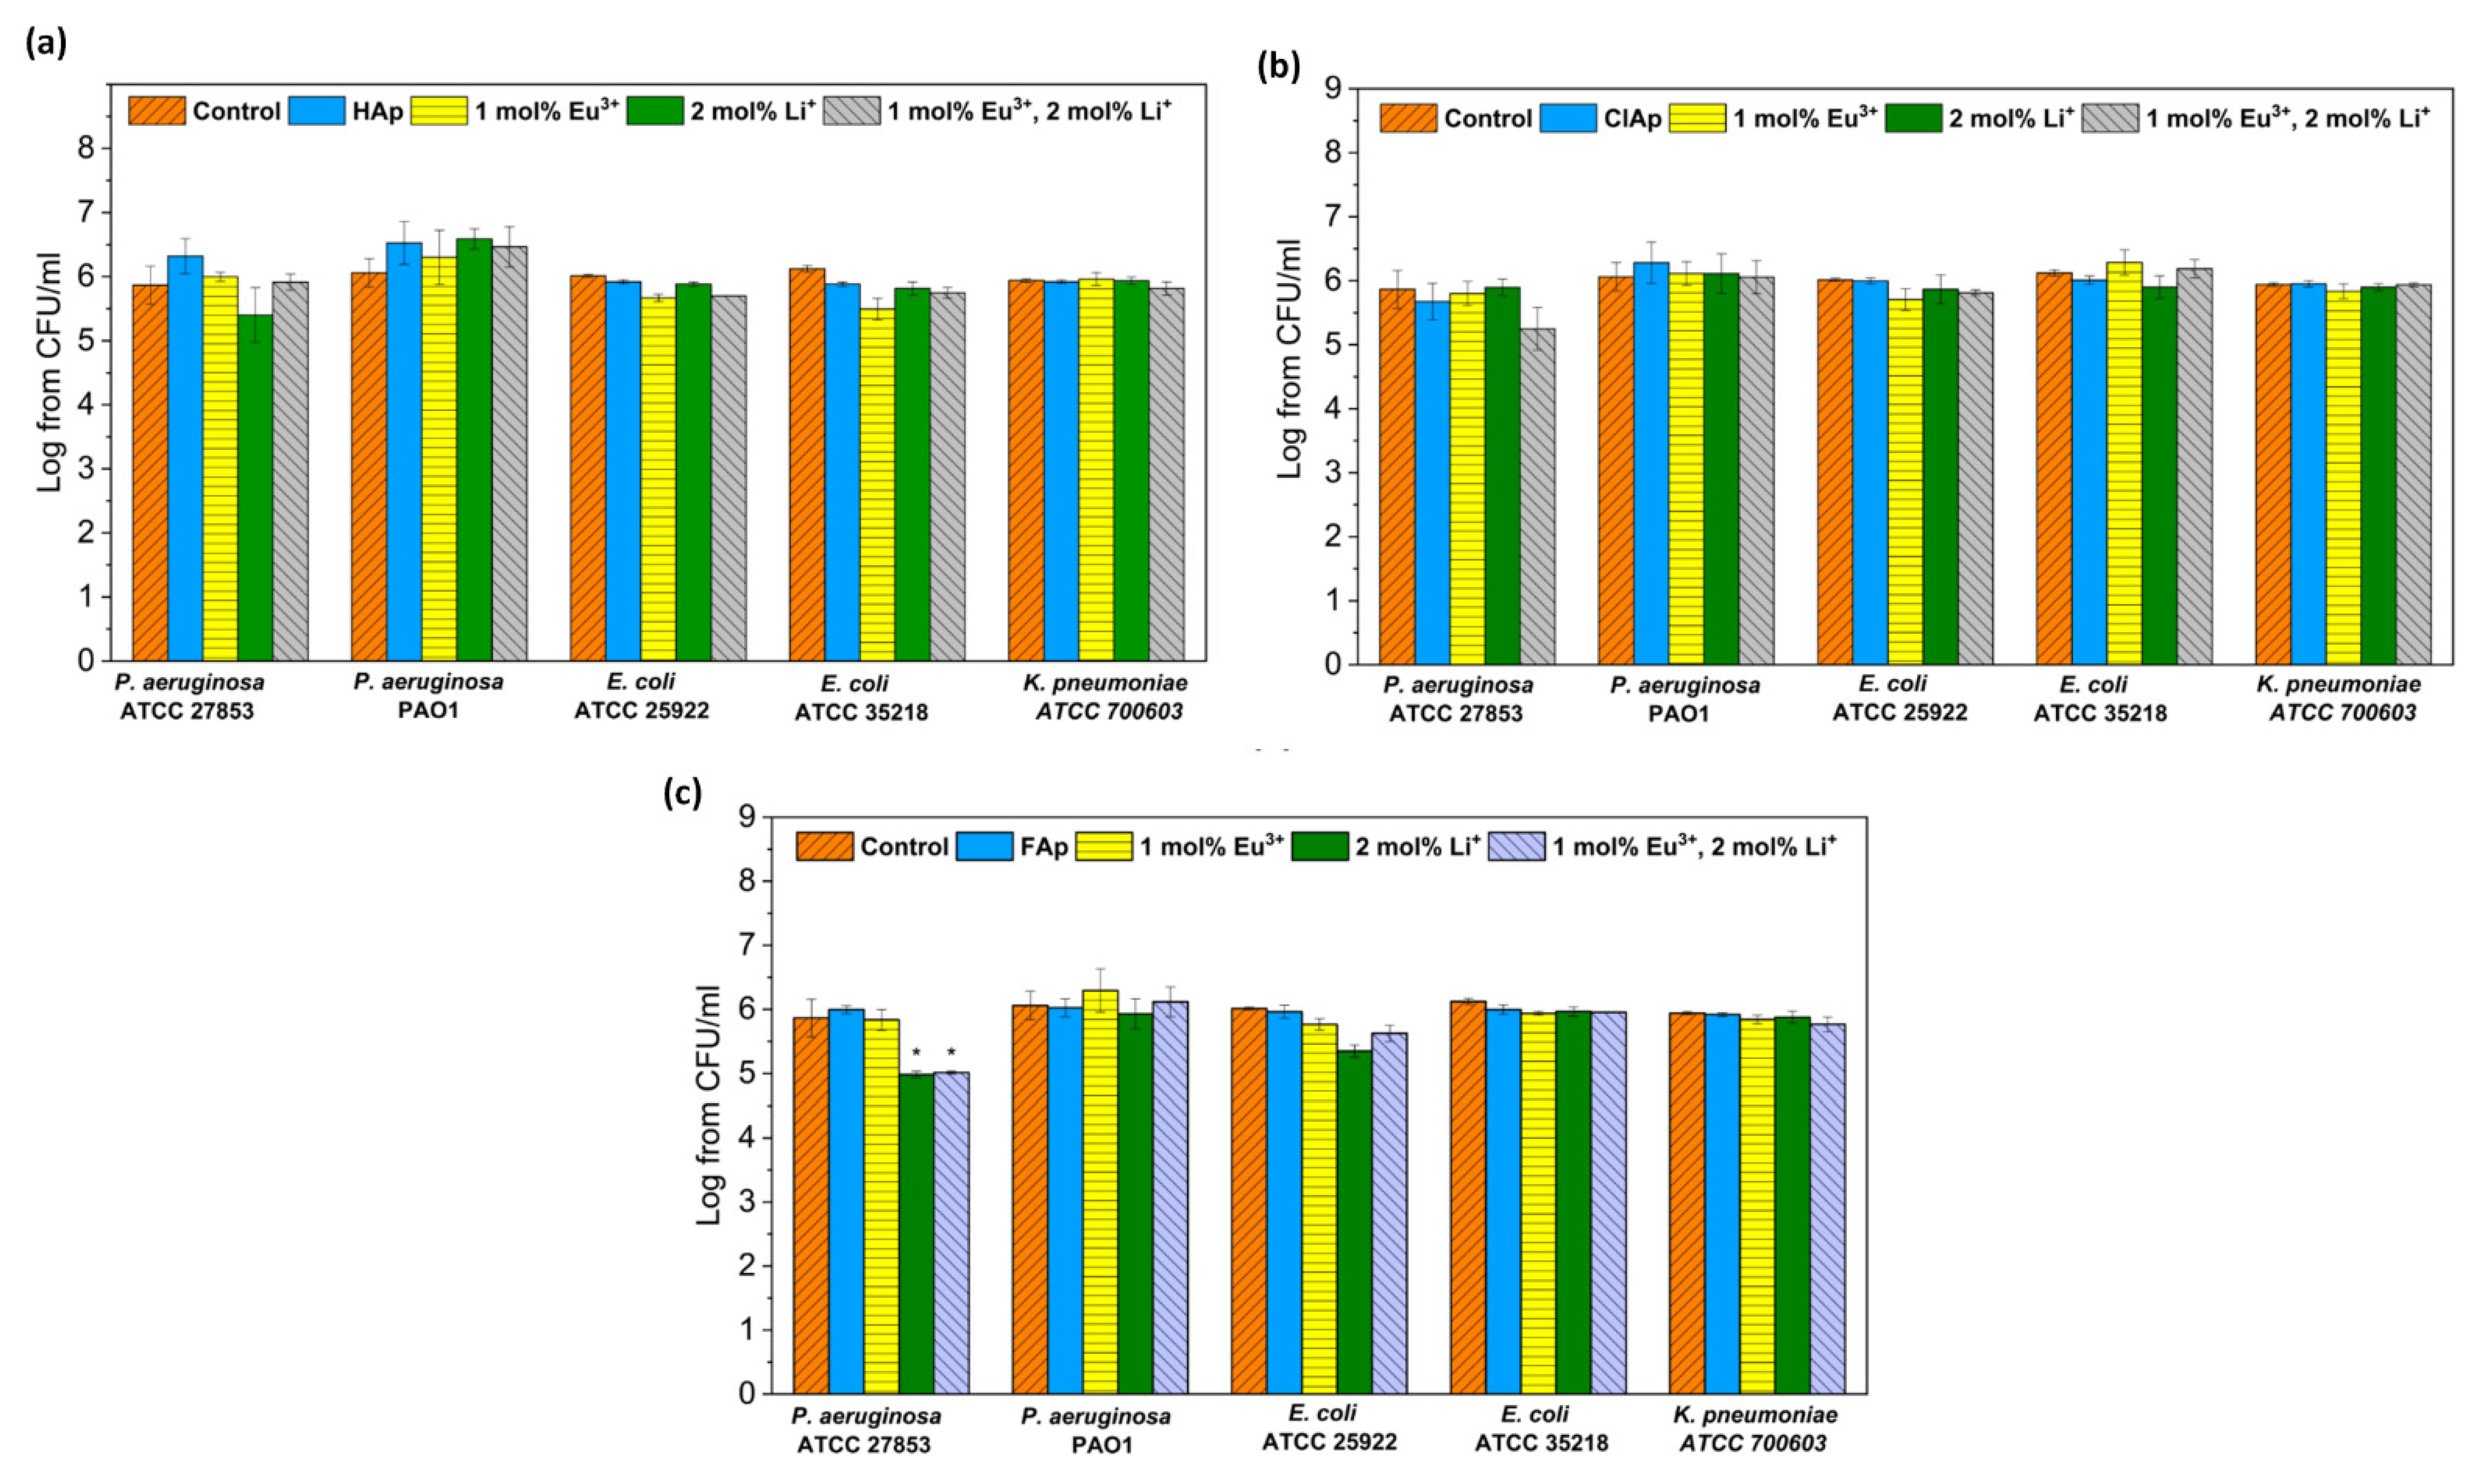
3.2.4. Antibacterial Evaluation
4. Conclusions
Supplementary Materials
Author Contributions
Funding
Institutional Review Board Statement
Informed Consent Statement
Data Availability Statement
Acknowledgments
Conflicts of Interest
References
- Eliaz, N.; Metoki, N. Calcium Phosphate Bioceramics: A Review of Their History, Structure, Properties, Coating Technologies and Biomedical Applications. Materials 2017, 10, 334. [Google Scholar] [CrossRef] [Green Version]
- Beig, B.; Liaqat, U.; Niazi, M.F.K.; Douna, I.; Zahoor, M.; Niazi, M.B.K. Current Challenges and Innovative Developments in Hydroxyapatite-Based Coatings on Metallic Materials for Bone Implantation: A Review. Coatings 2020, 10, 1249. [Google Scholar] [CrossRef]
- Arce, J.E.; Arce, A.E.; Aguilar, Y.; Yate, L.; Moya, S.; Rincón, C.; Gutiérrez, O. Calcium phosphate—Calcium titanate composite coatings for orthopedic applications. Ceram. Int. 2016, 42, 10322–10331. [Google Scholar] [CrossRef]
- Victor, S.P.; Paul, W.; Sharma, C.P. Drug Delivery Nanosystems for Biomedical Applications||Calcium Phosphate Nanoplatforms for Drug Delivery and Theranostic Applications; Elsevier: Amsterdam, The Netherlands, 2018; pp. 163–179. ISBN 9780323509220. [Google Scholar]
- Abdulghani, S.; Mitchell, G.R. Biomaterials for In Situ Tissue Regeneration: A Review. Biomolecules 2019, 9, 750. [Google Scholar] [CrossRef] [PubMed] [Green Version]
- Ma, B.; Zhang, S.; Qiu, J.; Li, J.; Sang, Y.; Xia, H.; Jiang, H.; Claverie, J.; Liu, H. Eu/Tb codoped spindle-shaped fluorinated hydroxyapatite nanoparticles for dual-color cell imaging. Nanoscale 2016, 8, 11580–11587. [Google Scholar] [CrossRef] [PubMed]
- Ginebra, M.P.; Canal, C.; Espanol, M.; Pastorino, D.; Montufar, E.B. Calcium phosphate cements as drug delivery materials. Adv. Drug Deliv. Rev. 2012, 64, 1090–1110. [Google Scholar] [CrossRef] [PubMed]
- Sobierajska, P.; Wiglusz, R.J. Influence of the grain sizes on Stokes and anti-Stokes fluorescence in the Yb3+ and Tb3+ ions co-doped nanocrystalline fluorapatite. J. Alloys Compd. 2019, 785, 808–818. [Google Scholar] [CrossRef]
- Han, Y.; Wang, X.; Dai, H.; Li, S. Synthesis and luminescence of Eu3+ doped hydroxyapatite nanocrystallines: Effects of calcinations and Eu3+ content. J. Lumin. 2013, 135, 281–287. [Google Scholar] [CrossRef]
- Sobierajska, P.; Pazik, R.; Zawisza, K.; Renaudin, G.; Nedelec, J.-M.; Wiglusz, R.J. Effect of lithium substitution on the charge compensation, structural and luminescence properties of nanocrystalline Ca10(PO4)6F2 activated with Eu3+ ions. CrystEngComm 2016, 18, 3447–3455. [Google Scholar] [CrossRef]
- Sahoo, R.; Bhattacharya, S.K.; Debnath, R. A new type of charge compensating mechanism in Ca5(PO4)3F: Eu3+ phosphor. J. Solid State Chem. 2003, 175, 218–225. [Google Scholar] [CrossRef]
- Šupová, M. Substituted Hydroxyapatites for Biomedical Applications: A review. Ceram. Int. 2015, 41, 9203–9231. [Google Scholar] [CrossRef]
- Pazik, R.; Nedelec, J.-M.; Wiglusz, R.J. Preferential site substitution of Eu3+ ions in Ca10(PO4)6Cl 2 nanoparticles obtained using a microwave stimulated wet chemistry technique. CrystEngComm 2014, 16, 5308–5318. [Google Scholar] [CrossRef]
- Bigi, A.; Boanini, E.; Capuccini, C.; Gazzano, M. Strontium-substituted hydroxyapatite nanocrystals. Inorg. Chim. Acta 2007, 360, 1009–1016. [Google Scholar] [CrossRef]
- Silva, F.R.O.; de Lima, N.B.; Bressiani, A.H.A.; Courrol, L.C.; Gomes, L. Synthesis, characterization and luminescence properties of Eu3+-doped hydroxyapatite nanocrystal and the thermal treatment effects. Opt. Mater. 2015, 47, 135–142. [Google Scholar] [CrossRef]
- Vestergaard, P.; Rejnmark, L.; Mosekilde, L. Reduced relative risk of fractures among users of lithium. Calcif. Tissue Int. 2005, 77, 1–8. [Google Scholar] [CrossRef] [PubMed]
- Clement-Lacroix, P.; Ai, M.; Morvan, F.; Roman-Roman, S.; Vayssiere, B.; Belleville, C.; Estrera, K.; Warman, M.L.; Baron, R.; Rawadi, G. Lrp5-independent activation of Wnt signaling by lithium chloride increases bone formation and bone mass in mice. Proc. Natl. Acad. Sci. USA 2005, 102, 17406–17411. [Google Scholar] [CrossRef] [PubMed] [Green Version]
- Marycz, K.; Sobierajska, P.; Smieszek, A.; Maredziak, M.; Wiglusz, K.; Wiglusz, R.J. Li+ activated nanohydroxyapatite doped with Eu3+ ions enhances proliferative activity and viability of human stem progenitor cells of adipose tissue and olfactory ensheathing cells. Further perspective of nHAP:Li+, Eu3+ application in theranostics. Mater. Sci. Eng. C 2017, 78, 151–162. [Google Scholar] [CrossRef] [PubMed]
- Singh, A.K.; Singh, S.K.; Rai, S.B. Role of Li+ ion in the luminescence enhancement of lanthanide ions: Favorable modifications in host matrices. RSC Adv. 2014, 4, 27039–27061. [Google Scholar] [CrossRef]
- Jagannathan, R.; Kottaisamy, M. Short-pulsed stimulated emission in the powders and Nd:Sr5(PO4)3F laser crystals. J. Phys. Condens. Matter 1995, 7, 8453–8466. [Google Scholar] [CrossRef]
- Sobierajska, P.; Wiglusz, R.J. Influence of Li+ ions on the physicochemical properties of nanocrystalline calcium-strontium hydroxyapatite doped with Eu3+ ions. New J. Chem. 2019, 43, 14908–14916. [Google Scholar] [CrossRef]
- Lewinski, N.; Colvin, V.; Drezek, R. Review Cytotoxicity of Nanoparticles. Small 2008, 4, 26–49. [Google Scholar] [CrossRef]
- Miyata, R.; van Eeden, S.F. The innate and adaptive immune response induced by alveolar macrophages exposed to ambient particulate matter. Toxicol. Appl. Pharmacol. 2011, 257, 209–226. [Google Scholar] [CrossRef] [PubMed]
- Fischer, H.C.; Hauck, T.S.; Gómez-Aristizábal, A.; Chan, W.C. Exploring primary liver macrophages for studying quantum dot interactions with biological systems. Adv. Mater. 2010, 22, 2520–2524. [Google Scholar] [CrossRef] [PubMed]
- Nicolete, R.; dos Santos, D.F.; Faccioli, L.H. The uptake of PLGA micro or nanoparticles by macrophages provokes distinct in vitro inflammatory response. Int. Immunopharmacol. 2011, 11, 1557–1563. [Google Scholar] [CrossRef] [PubMed] [Green Version]
- Kartsogiannis, V.; Ng, K.W. Cell lines and primary cell cultures in the study of bone cell biology. Mol. Cell. Endocrinol. 2004, 228, 79–102. [Google Scholar] [CrossRef]
- Czekanska, E.M.; Stoddart, M.J.; Richards, R.G.; Hayes, J.S. In search of an osteoblast cell model for in vitro research. Eur. Cells Mater. 2012, 24, 1–17. [Google Scholar] [CrossRef]
- Farag, M.R.; Alagawany, M. Erythrocytes as a biological model for screening of xenobiotics toxicity. Chem.-Biol. Interact. 2018, 279, 73–83. [Google Scholar] [CrossRef]
- Weber, M.; Steinle, H.; Golombek, S.; Hann, L.; Schlensak, C.; Wendel, H.P.; Avci-Adali, M. Blood-Contacting Biomaterials: In Vitro Evaluation of the Hemocompatibility. Front. Bioeng. Biotechnol. 2018, 6, 99. [Google Scholar] [CrossRef]
- Vellard, M. The enzyme as drug: Application of enzymes as pharmaceuticals. Curr. Opin. Biotechnol. 2003, 14, 444–450. [Google Scholar] [CrossRef]
- Murakami, F.; Sasaki, T.; Sugahara, T. Lysozyme stimulates immunoglobulin production by human-human hybridoma and human peripheral blood lymphocytes. Cytotechnology 1997, 24, 177–182. [Google Scholar] [CrossRef]
- Crémet, L.; Corvec, S.; Bémer, P.; Bret, L.; Lebrun, C.; Lesimple, B.; Miegeville, A.F.; Reynaud, A.; Lepelletier, D.; Caroff, N. Orthopaedic-implant infections by Escherichia coli: Molecular and phenotypic analysis of the causative strains. J. Infect. 2012, 64, 169–175. [Google Scholar] [CrossRef] [PubMed]
- Shah, N.B.; Osmon, D.R.; Steckelberg, J.M.; Sierra, R.J.; Walker, R.C.; Tande, A.J.; Berbari, E.F. Pseudomonas Prosthetic Joint Infections: A Review of 102 Episodes. J. Bone Jt. Infect. 2016, 1, 25–30. [Google Scholar] [CrossRef] [PubMed]
- Moghanian, A.; Firoozi, S.; Tahriri, M.; Sedghi, A. A comparative study on the in vitro formation of hydroxyapatite, cytotoxicity and antibacterial activity of 58S bioactive glass substituted by Li and Sr. Mater. Sci. Eng. C 2018, 91, 349–360. [Google Scholar] [CrossRef]
- Tite, T.; Popa, A.C.; Balescu, L.M.; Bogdan, I.M.; Pasuk, I.; Ferreira, J.M.F.; Stan, G.E. Cationic substitutions in hydroxyapatite: Current status of the derived biofunctional effects and their in vitro interrogation methods. Materials 2018, 11, 2081. [Google Scholar] [CrossRef] [PubMed] [Green Version]
- Rietveld, H.M. A profile refinement method for nuclear and magnetic structures. J. Appl. Crystallogr. 1969, 2, 65–71. [Google Scholar] [CrossRef]
- Lutterotti, L.; Matthies, S.; Wenk, H.-R. MAUD: A friendly Java program for material analysis using diffraction. IUCr Comm. Powder Diffr. Newsl. 1999, 21, 14–15. [Google Scholar]
- Hartmann, N.B.; Jensen, K.A.; Baun, A.; Rasmussen, K.; Rauscher, H.; Tantra, R.; Cupi, D.; Gilliland, D.; Pianella, F.; Riego Sintes, J.M. Techniques and Protocols for Dispersing Nanoparticle Powders in Aqueous Media—Is there a Rationale for Harmonization? J. Toxicol. Environ. Health-Part B Crit. Rev. 2015, 18, 299–326. [Google Scholar] [CrossRef] [Green Version]
- Shannon, R.D. Revised Effective Ionic Radii and Systematic Studies of Interatomie Distances in Halides and Chaleogenides. Acta Crystallogr. 1976, A32, 751–767. [Google Scholar] [CrossRef]
- Sudarsanan, K.; Young, R.A. Significant precision in crystal structural details. Holly Springs hydroxyapatite. Acta Crystallogr. 1969, 25, 1534–1543. [Google Scholar] [CrossRef]
- Hendricks, S.B.; Jefferson, M.E.; Mosley, V.M. The crystal structures of some natural and synthetic apatite-like substances. Z. Krist.-Cryst. Mater. 1932, 81, 352–369. [Google Scholar] [CrossRef]
- Lim, S.C.; Baikiea, T.; Pramana, S.S.; Smith, R.; White, T.J. Apatite metaprism twist angle (φ) as a tool for crystallochemical diagnosis. J. Solid State Chem. 2011, 184, 2978–2986. [Google Scholar] [CrossRef]
- LeGeros, R.Z.; Bonel, G.; Legros, R. Types of “H2O” in human enamel and in precipitated apatites. Calcif. Tissue Res. 1978, 26, 111–118. [Google Scholar] [CrossRef]
- Zhao, J.; Dong, X.; Bian, M.; Zhao, J. Applied Surface Science Solution combustion method for synthesis of nanostructured hydroxyapatite, fluorapatite and chlorapatite. Appl. Surf. Sci. 2014, 314, 1026–1033. [Google Scholar] [CrossRef]
- Sader, M.S.; Lewis, K.; Soares, G.A.; Legeros, R.Z. Simultaneous Incorporation of Magnesium and Carbonate in Apatite: Effect on Physico-chemical Properties 2 Experimental Methods. Mater. Res. 2013, 16, 779–784. [Google Scholar] [CrossRef]
- Hunter, R.J. Zeta Potential in Colloid Science Principles and Applications; Academic Press: Cambridge, MA, USA, 1988; ISBN 9781483214085. [Google Scholar]
- Gustafson, H.H.; Holt-Casper, D.; Grainger, D.W.; Ghandehari, H. Nanoparticle uptake: The phagocyte problem. Nano Today 2015, 10, 487–510. [Google Scholar] [CrossRef] [PubMed] [Green Version]
- Tenzer, S.; Docter, D.; Kuharev, J.; Musyanovych, A.; Fetz, V.; Hecht, R.; Schlenk, F.; Fischer, D.; Kiouptsi, K.; Reinhardt, C.; et al. Rapid formation of plasma protein corona critically affects nanoparticle pathophysiology. Nat. Nanotechnol. 2013, 8, 772–781. [Google Scholar] [CrossRef] [PubMed]
- Lundqvist, M.; Stigler, J.; Elia, G.; Lynch, I.; Cedervall, T.; Dawson, K.A. Nanoparticle size and surface properties determine the protein corona with possible implications for biological impacts. Proc. Natl. Acad. Sci. USA 2008, 105, 14265–14270. [Google Scholar] [CrossRef] [Green Version]
- Win, K.Y.; Feng, S.S. Effects of particle size and surface coating on cellular uptake of polymeric nanoparticles for oral delivery of anticancer drugs. Biomaterials 2005, 26, 2713–2722. [Google Scholar] [CrossRef]
- Honary, S.; Zahir, F. Effect of Zeta Potential on the Properties of Nano-Drug Delivery Systems—A Review (Part I). Trop. J. Pharm. Res. 2013, 12, 255–264. [Google Scholar] [CrossRef]
- Zhu, X.; Fan, H.; Li, D.; Xiao, Y.; Zhang, X. Protein Adsorption and Zeta Potentials of a Biphasic Calcium Phosphate Ceramic Under Various Conditions. J. Biomed. Mater. Res. Part B Appl. Biomater. 2007, 82B, 65–73. [Google Scholar] [CrossRef] [PubMed]
- Patila, S.; Sandberg, A.; Heckert, E.; Self, W.; Seal, S. Protein adsorption and cellular uptake of cerium oxide nanoparticles as a function of zeta potential. Biomaterials 2007, 28, 4600–4607. [Google Scholar] [CrossRef] [Green Version]
- Nikolaev, A.; Kolesnikov, I.; Frank-Kamenetskaya, O.; Kuz’mina, M. Europium concentration effect on characteristics and luminescent properties of hydroxyapatite nanocrystalline powders. J. Mol. Struct. 2017, 1149, 323–331. [Google Scholar] [CrossRef]
- Karbowiak, M.; Hubert, S. Site-selective emission spectra of Eu3+:Ca5(PO4)3F2. J. Alloys Compd. 2000, 302, 87–93. [Google Scholar] [CrossRef]
- Chen, L.; Mccrate, J.M.; Lee, J.C.; Li, H. The role of surface charge on the uptake and biocompatibility of hydroxyapatite nanoparticles with osteoblast cells. Nanotechnology 2011, 22, 105708. [Google Scholar] [CrossRef] [PubMed] [Green Version]
- Holder, A.L.; Goth-Goldstein, R.; Lucas, D.; Koshland, C.P. Particle-induced artifacts in the MTT and LDH viability assays. Chem. Res. Toxicol. 2012, 25, 1885–1892. [Google Scholar] [CrossRef] [PubMed] [Green Version]
- Stepanenko, A.A.; Dmitrenko, V.V. Pitfalls of the MTT assay: Direct and off-target effects of inhibitors can result in over/underestimation of cell viability. Gene 2015, 574, 193–203. [Google Scholar] [CrossRef]
- Yuan, Y.; Liu, C.; Qian, J.; Wang, J.; Zhang, Y. Size-mediated cytotoxicity and apoptosis of hydroxyapatite nanoparticles in human hepatoma HepG2 cells. Biomaterials 2010, 31, 730–740. [Google Scholar] [CrossRef]
- Tang, W.; Yuan, Y.; Liu, C.; Wu, Y.; Lu, X.; Qian, J. Differential cytotoxicity and particle action of hydroxyapatite nanoparticles in human cancer cells. Nanomedicine 2014, 9, 397–412. [Google Scholar] [CrossRef]
- Masouleh, M.P.; Hosseini, V.; Pourhaghgouy, M.; Bakht, M.K. Calcium Phosphate Nanoparticles Cytocompatibility versus Cytotoxicity: A Serendipitous Paradox. Curr. Pharm. Des. 2017, 23, 2930–2951. [Google Scholar] [CrossRef] [PubMed]
- Karthi, S.; Kumar, G.A.; Sardar, D.K.; Santhosh, C.; Girija, E.K. Synthesis and characterization of Nd3+: Yb3+ co-doped near infrared sensitive fluorapatite nanoparticles as a bioimaging probe. Opt. Mater. 2018, 77, 39–47. [Google Scholar] [CrossRef]
- Grzyb, T.; Mrówczyńska, L.; Szczeszak, A.; Śniadecki, Z.; Runowski, M.; Idzikowski, B.; Lis, S. Synthesis, characterization, and cytotoxicity in human erythrocytes of multifunctional, magnetic, and luminescent nanocrystalline rare earth fluorides. J. Nanoparticle Res. 2015, 17, 1–18. [Google Scholar] [CrossRef] [PubMed] [Green Version]
- Avsievich, T.; Popov, A.; Bykov, A.; Meglinski, I. Mutual interaction of red blood cells influenced by nanoparticles. Sci. Rep. 2019, 9, 5147. [Google Scholar] [CrossRef] [PubMed]
- Czarniewska, E.; Mrówczyńska, L.; Jędrzejczak-Silicka, M.; Nowicki, P.; Trukawka, M.; Mijowska, E. Non-cytotoxic hydroxyl-functionalized exfoliated boron nitride nanoflakes impair the immunological function of insect haemocytes in vivo. Sci. Rep. 2019, 9, 14027. [Google Scholar] [CrossRef] [PubMed] [Green Version]
- Szczeszak, A.; Ekner-Grzyb, A.; Runowski, M.; Szutkowski, K.; Mrówczyńska, L.; Kaźmierczak, Z.; Grzyb, T.; Dąbrowska, K.; Giersig, M.; Lis, S. Spectroscopic, structural and in vitro cytotoxicity evaluation of luminescent, lanthanide doped core@shell nanomaterials GdVO4:Eu3+5%@SiO2@NH2. J. Colloid Interface Sci. 2016, 481, 245–255. [Google Scholar] [CrossRef]
- Zhbanov, A.; Yang, S. Effects of Aggregation on Blood Sedimentation and Conductivity. PLoS ONE 2015, 10, e0129337. [Google Scholar] [CrossRef] [Green Version]
- Pan, D.C.; Myerson, J.W.; Brenner, J.S.; Patel, P.N.; Anselmo, A.C.; Mitragotri, S.; Muzykantov, V. Nanoparticle Properties Modulate Their Attachment and Effect on Carrier Red Blood Cells. Sci. Rep. 2018, 8, 1615. [Google Scholar] [CrossRef] [Green Version]
- Lee, W.H.; Loo, C.Y.; Van, K.L.; Zavgorodniy, A.V.; Rohanizadeh, R. Modulating protein adsorption onto hydroxyapatite particles using different amino acid treatments. J. R. Soc. Interface 2012, 9, 918–927. [Google Scholar] [CrossRef] [PubMed]
- Rahman, M.; Laurent, S.; Tawil, N.; Yahia, L.H.; Mahmoudi, M. Protein-Nanoparticle Interactions; Springer: Berlin/Heidelberg, Germany, 2013; pp. 1–94. ISBN 978-3-642-37554-5. [Google Scholar]
- Uygun, M.; Uygun, D.A.; Altunbaş, C.; Akgöl, S.; Denizli, A. Dye Attached Nanoparticles for Lysozyme Adsorption. Sep. Sci. Technol. 2014, 49, 1270–1278. [Google Scholar] [CrossRef]
- Kumar, S.; Aswal, A.V. SANS study of Lysozyme vs. BSA protein adsorption on silica nanoparticles. AIP Conf. Proc. 2012, 1447, 181–182. [Google Scholar] [CrossRef] [Green Version]
- Zachanowicz, E.; Zięcina, A.; Mikołajczyk, P.A.; Rogacki, K.; Małecka, M.; Marycz, K.; Marędziak, M.; Poźniak, B.; Nowakowska, M.; Tikhomirov, M.; et al. Cytotoxic Effects of Co1–xMnxFe2O4 Ferrite Nanoparticles Synthesized under Non-Hydrolytic Conditions (Bradley’s Reaction)—In Vitro. Eur. J. Inorg. Chem. 2016, 2016, 5315–5323. [Google Scholar] [CrossRef]
- Ginebra, M.P.; Espanol, M.; Montufar, E.B.; Perez, R.A.; Mestres, G. New processing approaches in calcium phosphate cements and their applications in regenerative medicine. Acta Biomater. 2010, 6, 2863–2873. [Google Scholar] [CrossRef]
- Iconaru, S.L.; Motelica-Heino, M.; Predoi, D. Study on europium-doped hydroxyapatite nanoparticles by fourier transform infrared spectroscopy and their antimicrobial properties. J. Spectrosc. 2013, 2013, 284285. [Google Scholar] [CrossRef] [Green Version]
- Szyszka, K.; Rewak-Soroczynska, J.; Dorotkiewicz-Jach, A.; Ledwa, K.A.; Piecuch, A.; Giersig, M.; Drulis-Kawa, Z.; Wiglusz, R.J. Structural modification of nanohydroxyapatite Ca10(PO4)6(OH)2 related to Eu3+ and Sr2+ ions doping and its spectroscopic and antimicrobial properties. J. Inorg. Biochem. 2020, 203, 110884. [Google Scholar] [CrossRef] [PubMed]
- Wiglusz, R.J.; Drulis-Kawa, Z.; Pazik, R.; Zawisza, K.; Dorotkiewicz-Jach, A.; Roszkowiak, J.; Nedelec, J.M. Multifunctional lanthanide and silver ion co-doped nano-chlorapatites with combined spectroscopic and antimicrobial properties. Dalton Trans. 2015, 44, 6918–6925. [Google Scholar] [CrossRef] [PubMed] [Green Version]


| Ca(NO3)2·4H2O | CaCl2·2H2O | (NH4)2HPO4 | NH4F | Eu2O3 | Li2CO3 | |
|---|---|---|---|---|---|---|
| HAp | + | − | + | − | + | + |
| ClAp | − | + | + | − | + | + |
| FAp | + | − | + | + | + | + |
| Sample | a (Å) | c (Å) | V (Å3) | Size R (nm) | Size S (nm) | Rw (%) |
|---|---|---|---|---|---|---|
| Ca10(PO4)6(OH)2, single crystal [40] | 9.424 (4) | 6.879 (4) | 529.09 (4) | – | – | – |
| Ca10(PO4)6(OH)2: 1 mol% Eu3+ | 9.400 (3) | 6.870 (7) | 525.79 (2) | 42.02 | 47.80 | 1.1 |
| Ca10(PO4)6(OH)2: 1 mol% Eu3+,2 mol% Li+ | 9.403 (8) | 6.870 (0) | 526.13 (3) | 56.13 | 55.17 | 1.5 |
| Ca10(PO4)6Cl2, single crystal [41] | 9.52 (3) | 6.85 (3) | 537.64 (3) | – | – | – |
| Ca10(PO4)6Cl2: 1 mol% Eu3+ | 9.51 (0) | 6.84 (4) | 536.94 (8) | 34.38 | 34.98 | 1.9 |
| Ca10(PO4)6Cl2: 1 mol% Eu3+, 2 mol% Li+ | 9.51 (8) | 6.83 (0) | 535.84 (9) | 28.58 | 25.57 | 1.8 |
| Ca10(PO4)6F2, single crystal [42] | 9.3672 (1) | 6.8844 (1) | 523.15 (1) | – | – | – |
| Ca10(PO4)6F2: 1 mol% Eu3+ | 9.3481 (8) | 6.8705 (9) | 519.97 (0) | 86.39 | 75.52 | 2.5 |
| Ca10(PO4)6F2: 1 mol% Eu3+, 2 mol% Li+ | 9.3557 (6) | 6.8723 (1) | 520.94 (5) | 50.35 | 57.49 | 2.1 |
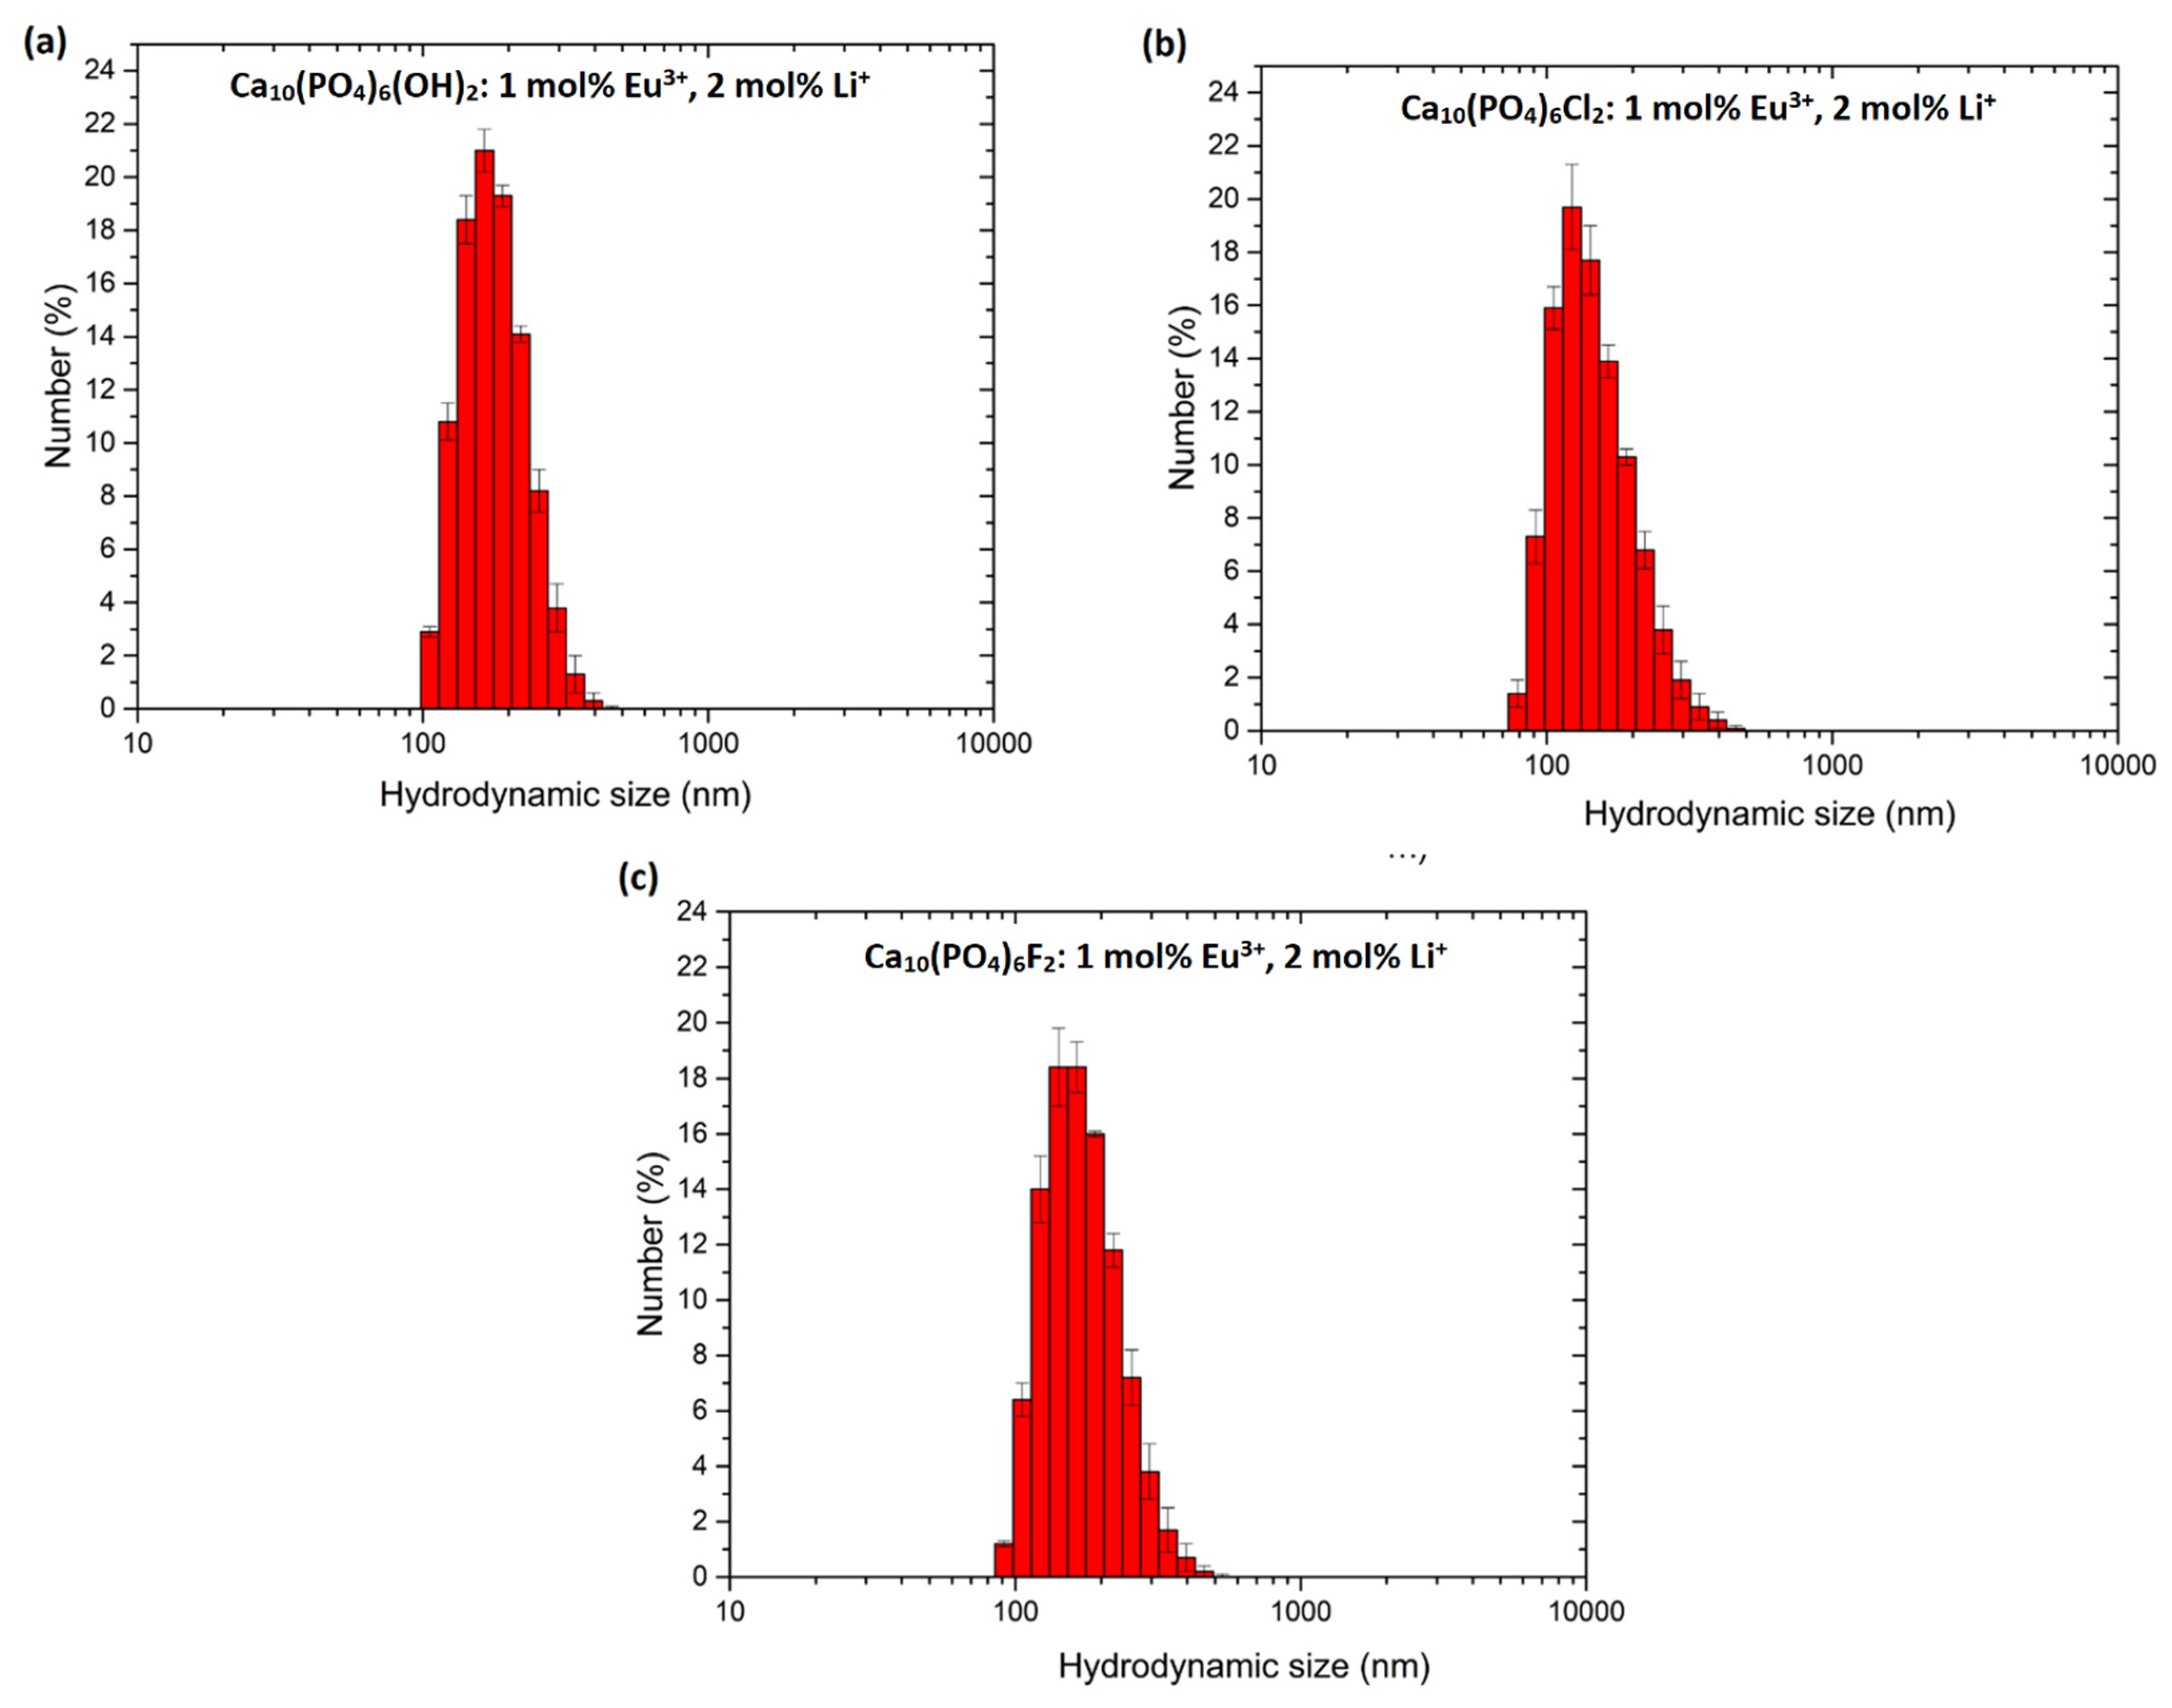
| Sample | Typical Hydrodynamic Size * (nm) | Average Hydrodynamic Size (nm) | PdI ** |
|---|---|---|---|
| de-ionized water | |||
| Ca10(PO4)6(OH)2: 1 mol% Eu3+, 2 mol% Li+ | 164 ± 1 | 251 ± 11 | 0.28 ± 0.02 |
| Ca10(PO4)6Cl2: 1 mol% Eu3+, 2 mol% Li+ | 164 ± 2 | 202 ± 12 | 0.18 ± 0.03 |
| Ca10(PO4)6F2: 1 mol% Eu3+, 2 mol% Li+ | 153 ± 2 | 237 ± 8 | 0.25 ± 0.03 |
| 0.05% BSA | |||
| Ca10(PO4)6(OH)2: 1 mol% Eu3+, 2 mol% Li+ | 177 ± 2 | 451 ± 17 | 0.41 ± 0.01 |
| Ca10(PO4)6Cl2: 1 mol% Eu3+, 2 mol% Li+ | 205 ± 5 | 284 ± 5 | 0.46 ± 0.08 |
| Ca10(PO4)6F2: 1 mol% Eu3+, 2 mol% Li+ | 235 ± 2 | 307 ± 16 | 0.28 ± 0.02 |
| 0.05% LSZ | |||
| Ca10(PO4)6(OH)2: 1 mol% Eu3+, 2 mol% Li+ | 78 ± 2 | 225 ± 4 | 0.45 ± 0.06 |
| Ca10(PO4)6Cl2: 1 mol% Eu3+, 2 mol% Li+ | 80 ± 1 | 192 ± 17 | 0.35 ± 0.02 |
| Ca10(PO4)6F2: 1 mol% Eu3+, 2 mol% Li+ | 79 ± 0.2 | 161 ± 3 | 0.33 ± 0.03 |
| Sample | Zeta Potential (mV) De-Ionized Water | Zeta Potential (mV) PBS | Zeta Potential (mV) BSA | Zeta Potential (mV) LSZ |
|---|---|---|---|---|
| Ca10(PO4)6(OH)2 | −16.5 ± 0.5 | −19.7 ± 0.6 | −18.5 ± 0.4 | 16.7 ± 0.2 |
| Ca10(PO4)6(OH)2: 2 mol% Li+ | −11.0 ± 0.9 | −18.9 ± 0.6 | −22.4 ± 0.6 | 22.9 ± 0.2 |
| Ca10(PO4)6(OH)2: 1 mol% Eu3+ | −9.4 ± 0.2 | −17.1 ± 0.9 | −17.5 ± 0.6 | 16.7 ± 0.3 |
| Ca10(PO4)6(OH)2:1 mol% Eu3+, 2 mol% Li+ | −10.9 ± 0.1 | −18.9 ± 0.3 | −18.9 ± 0.7 | 17.8 ± 0.6 |
| Ca10(PO4)6Cl2 | −8.7 ± 0.3 | −17.6 ± 0.5 | −21.6 ± 0.8 | 25.6 ± 0.9 |
| Ca10(PO4)6Cl2: 2 mol% Li+ | −7.3 ± 0.1 | −20.6 ± 0.2 | −21.1 ± 0.9 | 21.6 ± 0.8 |
| Ca10(PO4)6Cl2: 1 mol% Eu3+ | −5.8 ± 0.1 | −21.3 ± 0.5 | −20.0 ± 0.5 | 21.9 ± 0.9 |
| Ca10(PO4)6Cl2: 1 mol% Eu3+, 2 mol% Li+ | −8.4 ± 0.1 | −20.2 ± 0.3 | −26.9 ± 0.7 | 22.8 ± 0.2 |
| Ca10(PO4)6F2 | −3.6 ± 0.1 | −22.0 ± 0.7 | −16.3 ± 0.8 | 26.1 ± 0.8 |
| Ca10(PO4)6F2: 2 mol% Li+ | −15.4 ± 0.2 | −24.1 ± 0.8 | −19.9 ± 0.7 | 28.8 ± 0.1 |
| Ca10(PO4)6F2: 1 mol% Eu3+ | −10.2 ± 0.3 | −20.0 ± 0.2 | −17.7 ± 0.5 | 29.5 ± 0.5 |
| Ca10(PO4)6F2: 1 mol% Eu3+, 2 mol% Li+ | −10.2 ± 0.3 | −18.7 ± 0.1 | −16.3 ± 0.8 | 28.9 ± 0.3 |
| Scheme | Li (wt.%) | Eu (wt%) | Ca (wt%) | P (wt%) | (mol%) | (mol%) | |
|---|---|---|---|---|---|---|---|
| Ca10(PO4)6(OH)2: 1 mol% Eu3+, 2 mol% Li | 0.138 ± 0.01 | 1.51 ± 0.1 | 39 ± 2 | 18 ± 1 | 2.02 ± 0.04 | 0.94 ± 0.02 | 1.65 ± 0.02 |
| Ca10(PO4)6Cl2: 1 mol% Eu3+, 2 mol% Li | 0.133 ± 0.01 | 1.45 ± 0.1 | 37 ± 2 | 18 ± 1 | 1.83 ± 0.04 | 0.92 ± 0.02 | 1.66 ± 0.02 |
| Ca10(PO4)6F2: 1 mol% Eu3+, 2 mol% Li+ | 0.137 ± 0.01 | 1.50 ± 0.1 | 38 ± 2 | 18 ± 1 | 1.83 ± 0.04 | 0.97 ± 0.02 | 1.66 ± 0.02 |
| The Effect of Nanoapatites on Human Erythrocytes * | ||||
|---|---|---|---|---|
| Sample | Sample Code | Dominated Erythrocytes Shape | Binding to RBCs’ Membrane | Effect on ESR |
| Ca10(PO4)6(OH)2 | A1 | D | ++ | + |
| Ca10(PO4)6(OH)2: 2 mol% Li+ | A2 | D | + | + |
| Ca10(PO4)6(OH)2: 1 mol% Eu3+ | A3 | D | + | + |
| Ca10(PO4)6(OH)2:1 mol% Eu3+, 2 mol% Li+ | A4 | D | + | + |
| Ca10(PO4)6Cl2 | B1 | D | ++ | ++ |
| Ca10(PO4)6Cl2: 2 mol% Li+ | B2 | D | + | − |
| Ca10(PO4)6Cl2: 1 mol% Eu3+ | B3 | D | + | − |
| Ca10(PO4)6Cl2: 1 mol% Eu3+, 2 mol% Li+ | B4 | D | + | − |
| Ca10(PO4)6F2 | C1 | D | + | − |
| Ca10(PO4)6F2: 2 mol% Li+ | C2 | D | + | − |
| Ca10(PO4)6F2: 1 mol% Eu3+ | C3 | D | + | + |
| Ca10(PO4)6F2: 1 mol% Eu3+, 2 mol% Li+ | C4 | D | + | − |
| PBS buffer (Control) | C | D | no | − |
Publisher’s Note: MDPI stays neutral with regard to jurisdictional claims in published maps and institutional affiliations. |
© 2021 by the authors. Licensee MDPI, Basel, Switzerland. This article is an open access article distributed under the terms and conditions of the Creative Commons Attribution (CC BY) license (https://creativecommons.org/licenses/by/4.0/).
Share and Cite
Sobierajska, P.; Pozniak, B.; Tikhomirov, M.; Miller, J.; Mrowczynska, L.; Piecuch, A.; Rewak-Soroczynska, J.; Dorotkiewicz-Jach, A.; Drulis-Kawa, Z.; Wiglusz, R.J. Multifunctionality of Nanosized Calcium Apatite Dual-Doped with Li+/Eu3+ Ions Related to Cell Culture Studies and Cytotoxicity Evaluation In Vitro. Biomolecules 2021, 11, 1388. https://doi.org/10.3390/biom11091388
Sobierajska P, Pozniak B, Tikhomirov M, Miller J, Mrowczynska L, Piecuch A, Rewak-Soroczynska J, Dorotkiewicz-Jach A, Drulis-Kawa Z, Wiglusz RJ. Multifunctionality of Nanosized Calcium Apatite Dual-Doped with Li+/Eu3+ Ions Related to Cell Culture Studies and Cytotoxicity Evaluation In Vitro. Biomolecules. 2021; 11(9):1388. https://doi.org/10.3390/biom11091388
Chicago/Turabian StyleSobierajska, Paulina, Blazej Pozniak, Marta Tikhomirov, Julia Miller, Lucyna Mrowczynska, Agata Piecuch, Justyna Rewak-Soroczynska, Agata Dorotkiewicz-Jach, Zuzanna Drulis-Kawa, and Rafal J. Wiglusz. 2021. "Multifunctionality of Nanosized Calcium Apatite Dual-Doped with Li+/Eu3+ Ions Related to Cell Culture Studies and Cytotoxicity Evaluation In Vitro" Biomolecules 11, no. 9: 1388. https://doi.org/10.3390/biom11091388
APA StyleSobierajska, P., Pozniak, B., Tikhomirov, M., Miller, J., Mrowczynska, L., Piecuch, A., Rewak-Soroczynska, J., Dorotkiewicz-Jach, A., Drulis-Kawa, Z., & Wiglusz, R. J. (2021). Multifunctionality of Nanosized Calcium Apatite Dual-Doped with Li+/Eu3+ Ions Related to Cell Culture Studies and Cytotoxicity Evaluation In Vitro. Biomolecules, 11(9), 1388. https://doi.org/10.3390/biom11091388