
Obesity-Related Changes in Human Plasma Lipidome Determined by the Lipidyzer Platform

 , ,
, , 
Abstract
1. Introduction
2. Materials and Methods
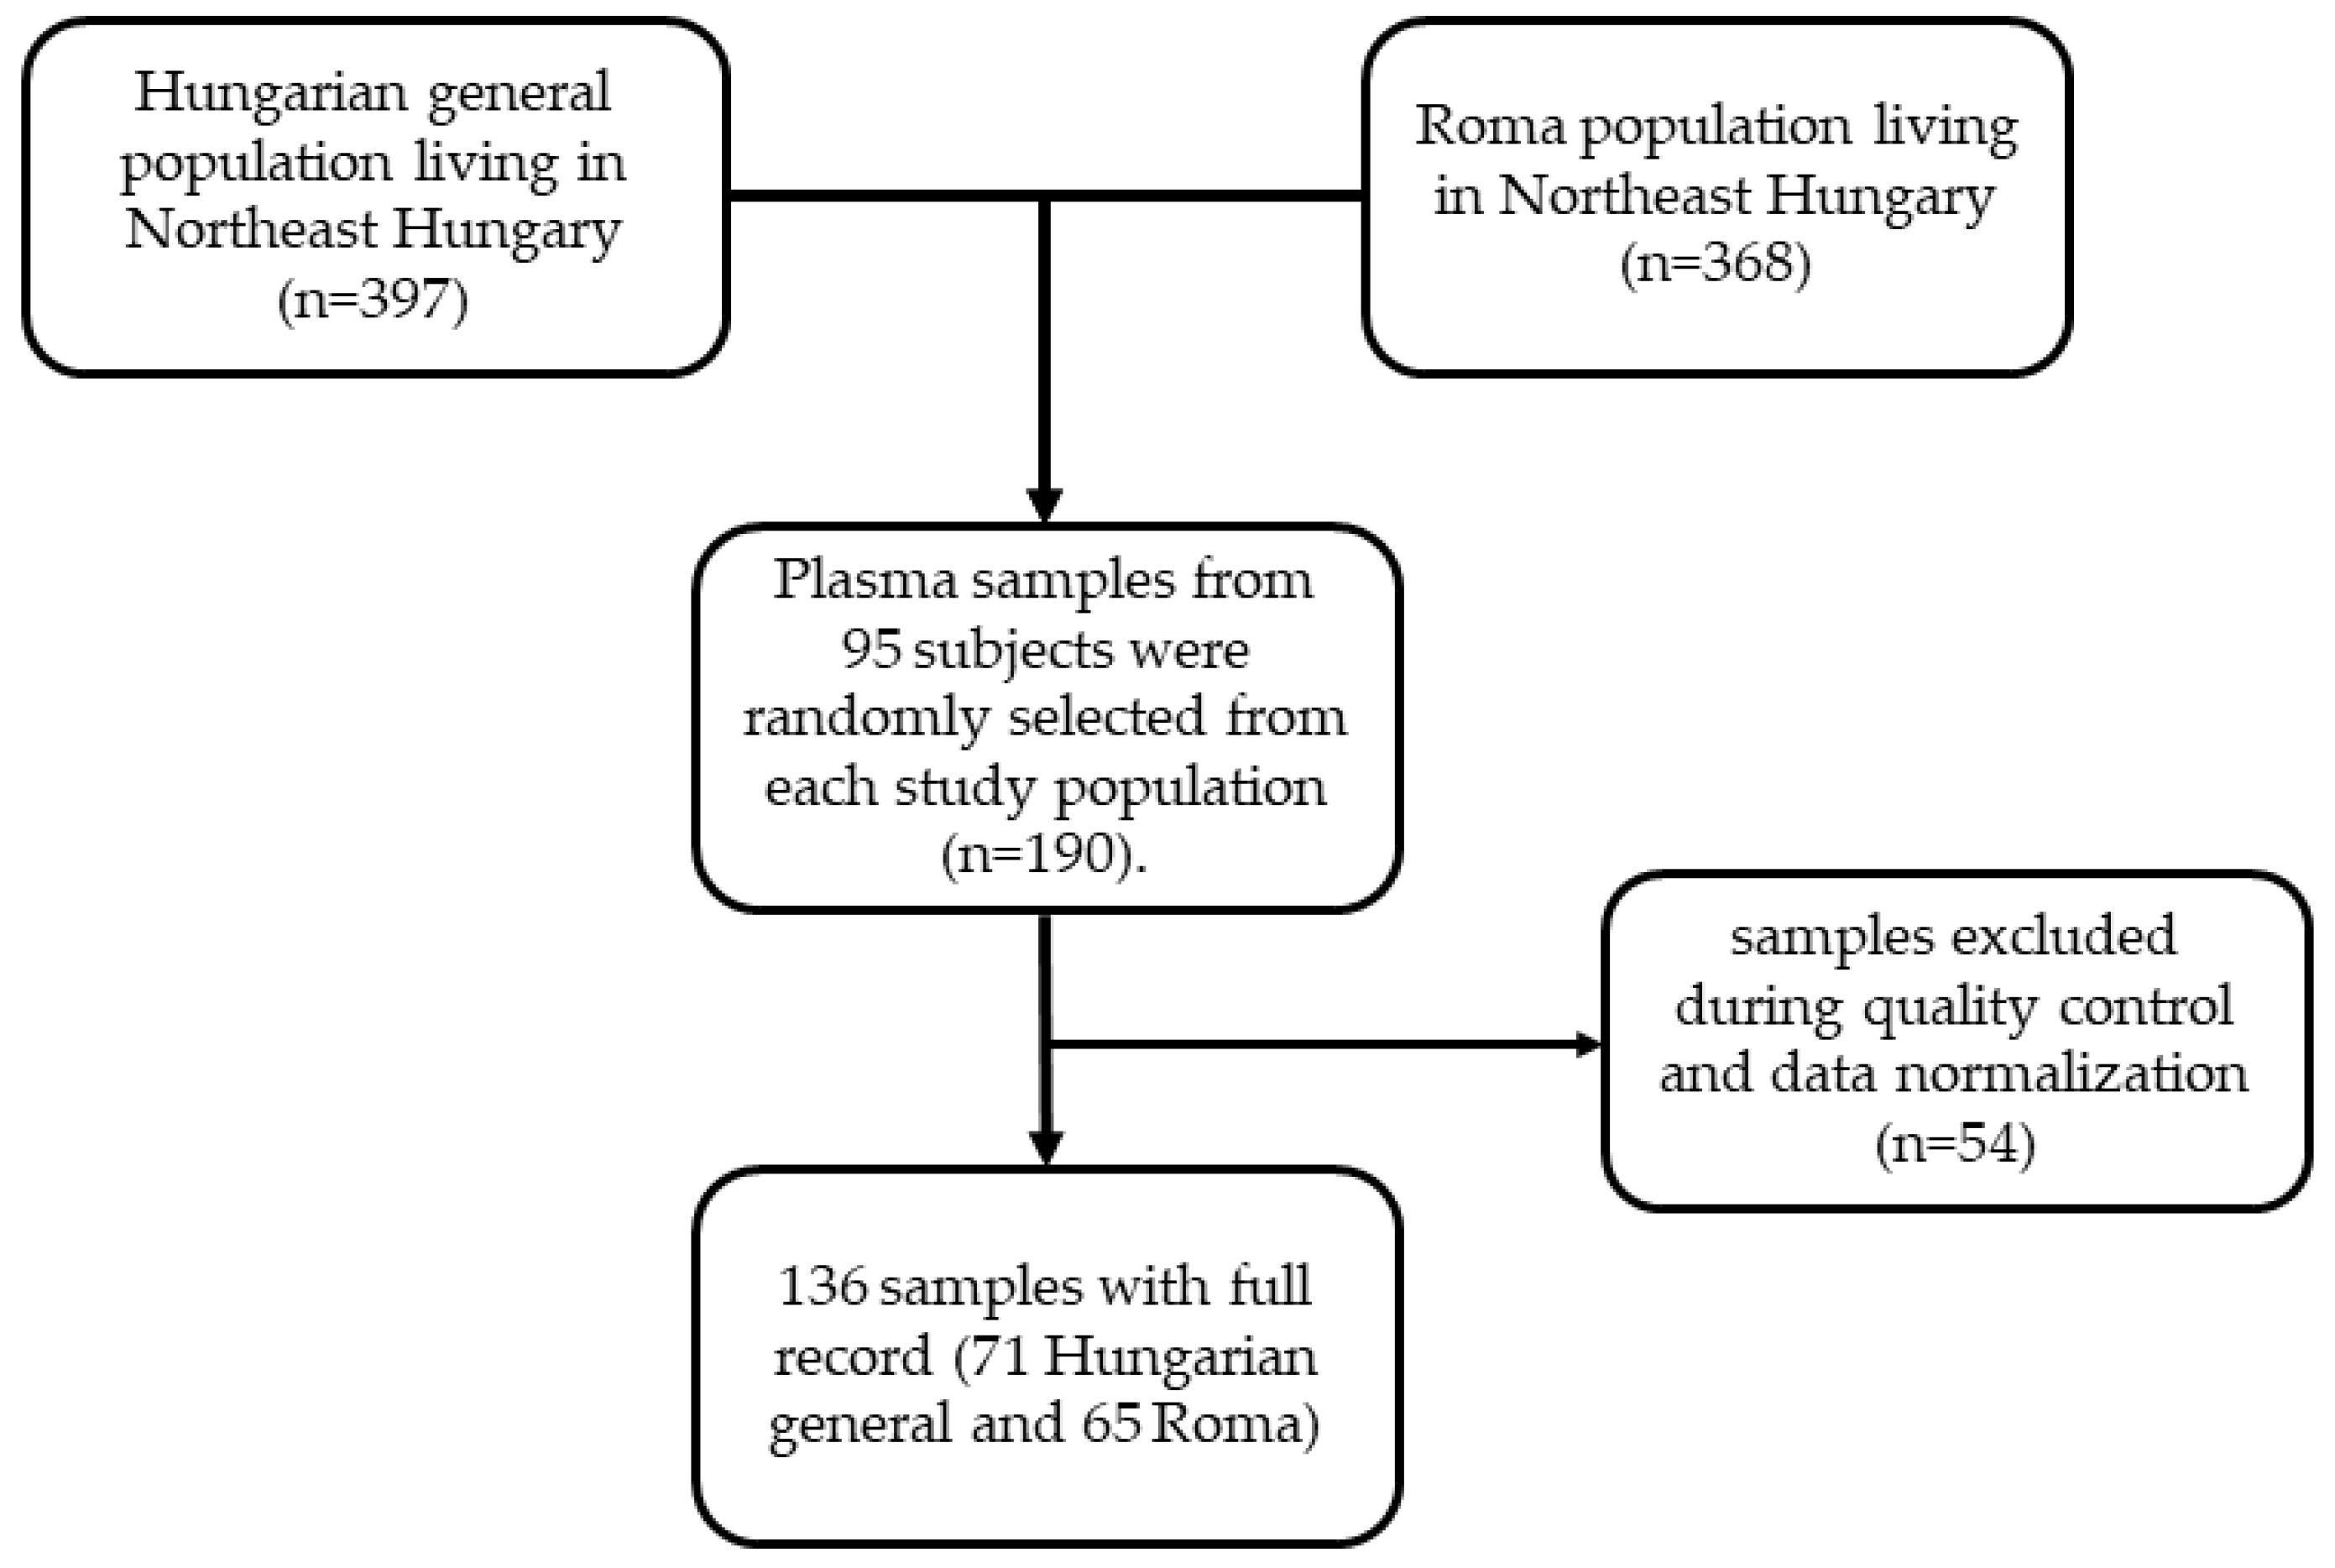
2.1. Study Design and Population
2.2. Materials
2.3. Extraction of Lipids
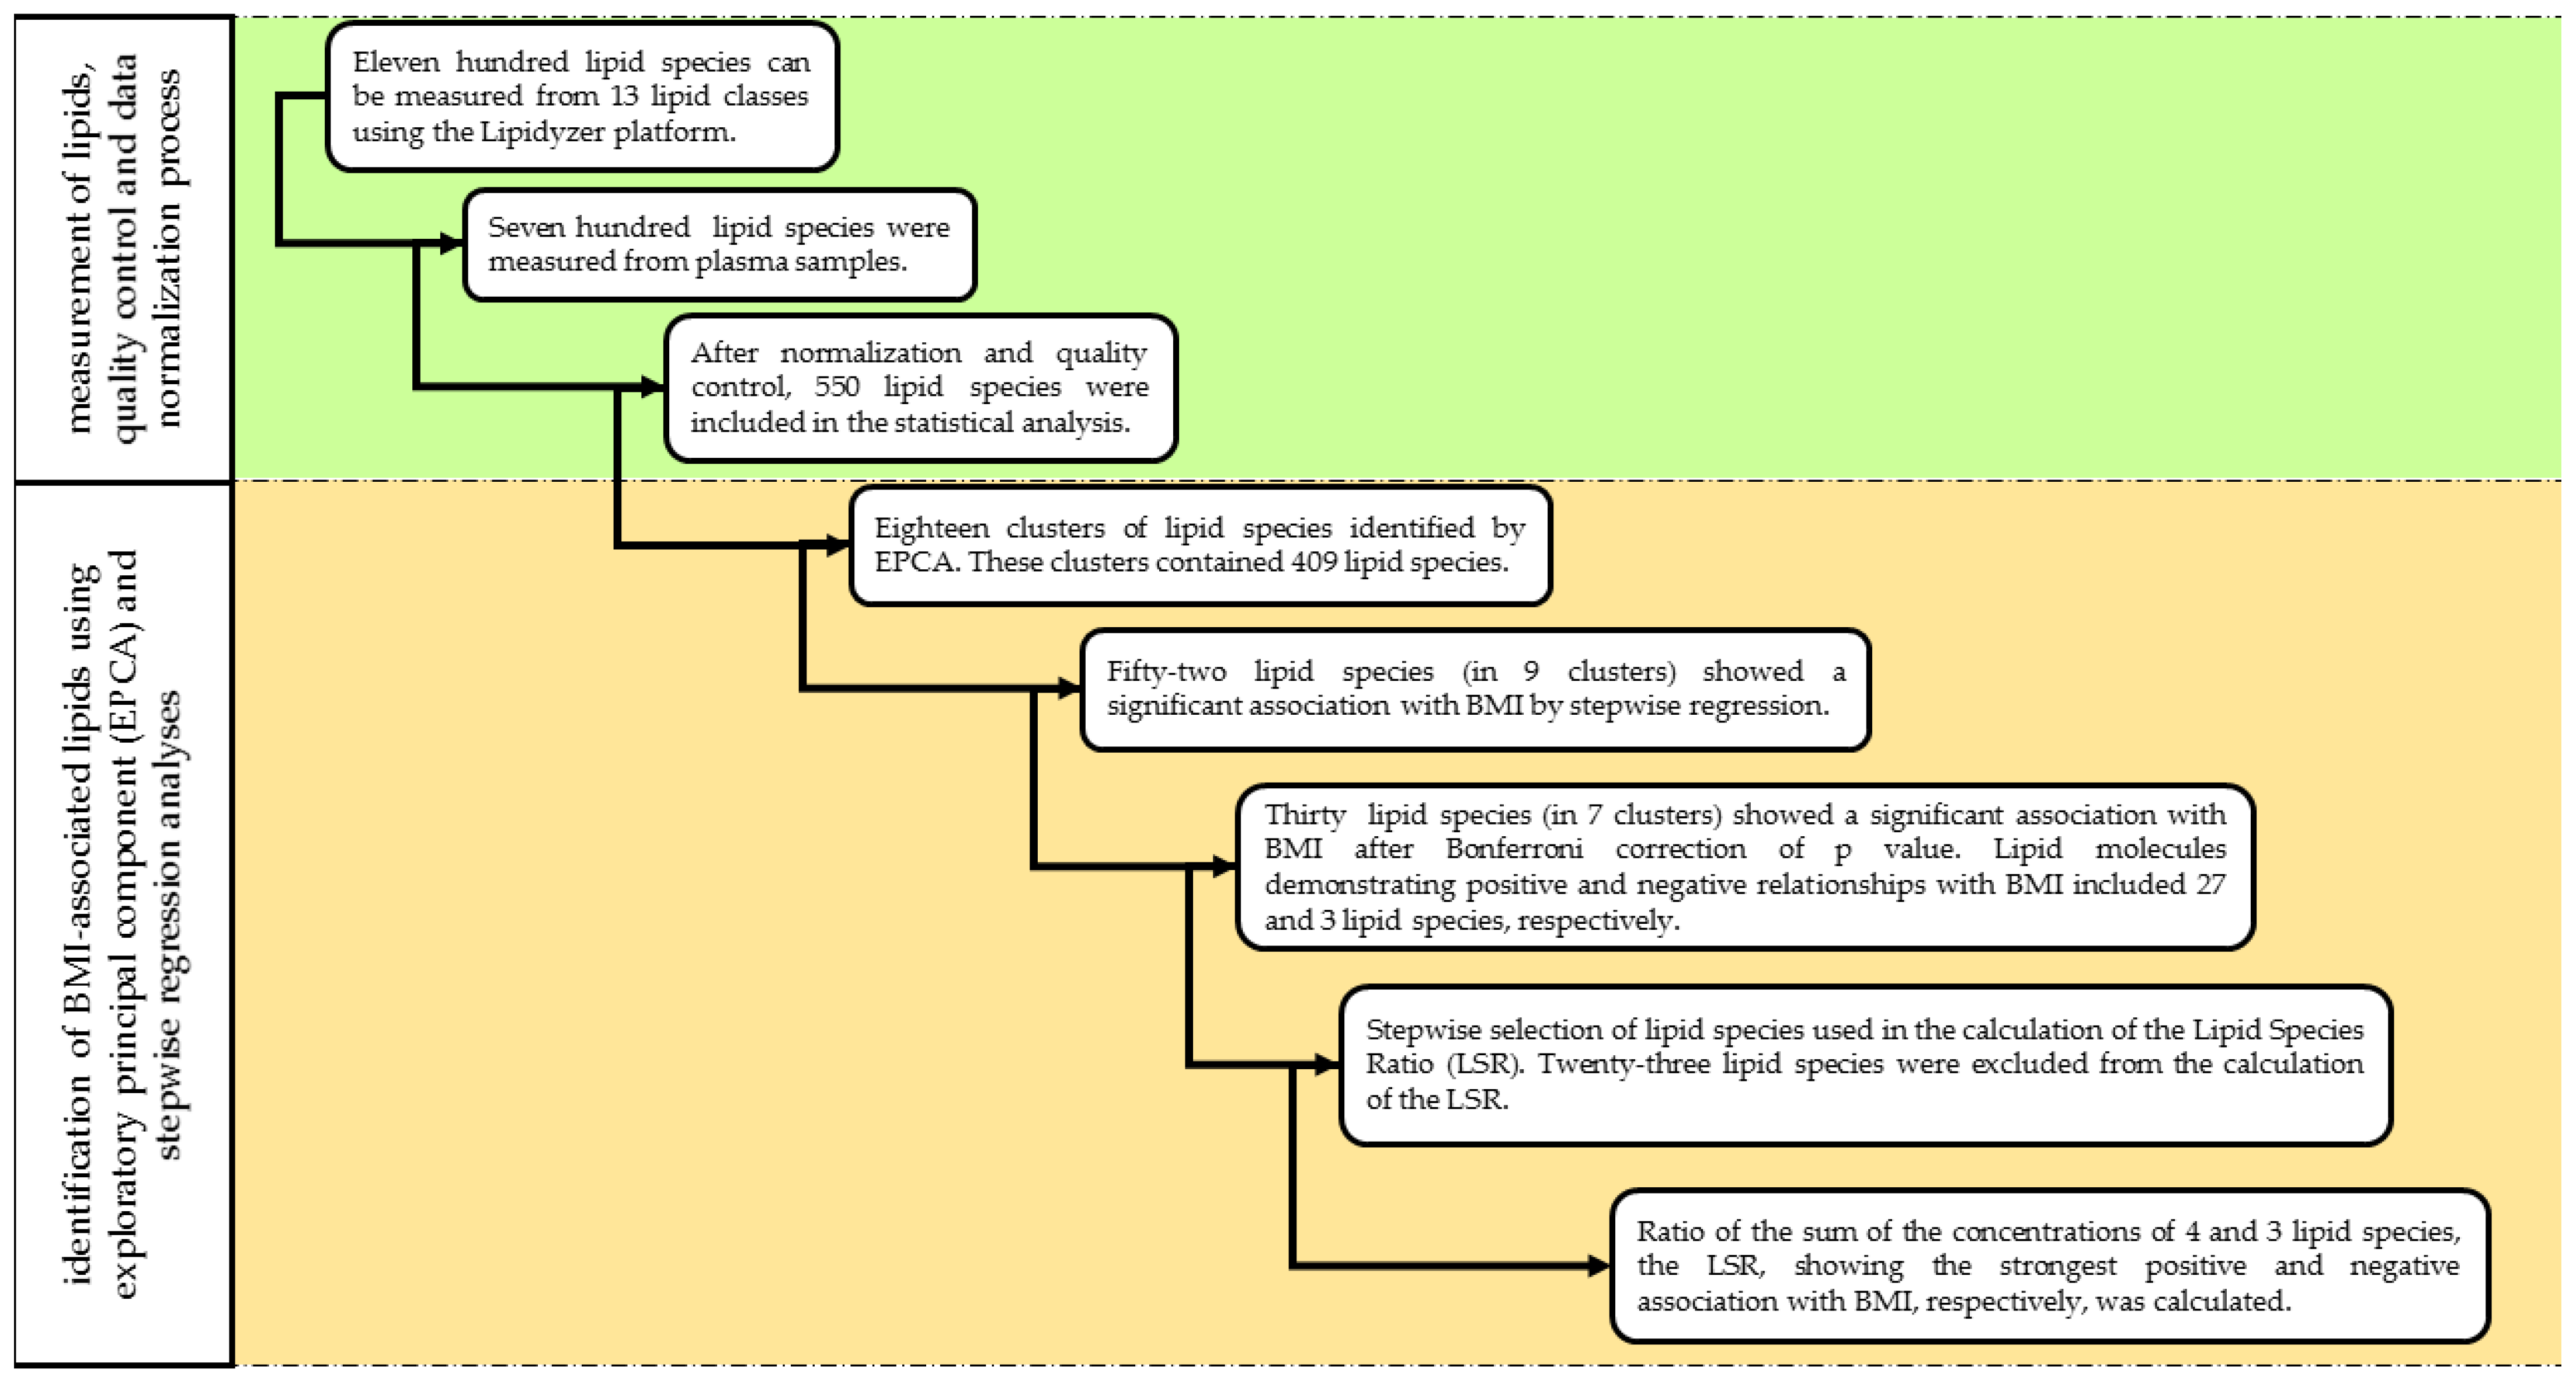
2.4. Lipidomic Analysis
2.5. Nomenclature of Lipids
2.6. Statistical Analysis
2.6.1. Factor Analysis
2.6.2. Stepwise Regression Analysis
2.6.3. Calculation of the Lipid Species Ratio
2.6.4. Estimation of Reference Values for the Sum of the Concentrations of Lipid Species Showing Positive and Negative Association with Body Mass Index and Lipid Species Ratio
3. Results
3.1. Characteristics of Study Population
3.2. Associations between Lipid Classes and Body Mass Index
3.3. Results of Factor Analysis
3.4. Results of Stepwise Regression Analysis
3.5. Results of Selection of Lipid Species Increasing the Strength of Association with Body Mass Index
3.6. Estimated Reference Values to Distinguish Normal Weight and Obese Subjects
4. Discussion
Author Contributions
Funding
Institutional Review Board Statement
Informed Consent Statement
Data Availability Statement
Acknowledgments
Conflicts of Interest
References
- Dai, H.; Alsalhe, T.A.; Chalghaf, N.; Ricco, M.; Bragazzi, N.L.; Wu, J. The global burden of disease attributable to high body mass index in 195 countries and territories, 1990–2017: An analysis of the Global Burden of Disease Study. PLoS Med. 2020, 17, e1003198. [Google Scholar] [CrossRef]
- Obesity and Overweight: Key Facts. Available online: https://www.who.int/news-room/fact-sheets/detail/obesity-and-overweight (accessed on 5 December 2020).
- Global Burden of Disease Compare. Available online: https://vizhub.healthdata.org/gbd-compare/ (accessed on 5 December 2020).
- Bays, H.E.; Toth, P.P.; Kris-Etherton, P.M.; Abate, N.; Aronne, L.J.; Brown, W.V.; Gonzalez-Campoy, J.M.; Jones, S.R.; Kumar, R.; La Forge, R.; et al. Obesity, adiposity, and dyslipidemia: A consensus statement from the National Lipid Association. J. Clin. Lipidol. 2013, 7, 304–383. [Google Scholar] [CrossRef] [PubMed]
- Klop, B.; Elte, J.W.; Cabezas, M.C. Dyslipidemia in obesity: Mechanisms and potential targets. Nutrients 2013, 5, 1218–1240. [Google Scholar] [CrossRef]
- Knight, J.A. Diseases and disorders associated with excess body weight. Ann. Clin. Lab. Sci. 2011, 41, 107–121. [Google Scholar] [PubMed]
- Quehenberger, O.; Dennis, E.A. The human plasma lipidome. N. Engl. J. Med. 2011, 365, 1812–1823. [Google Scholar] [CrossRef]
- Fahy, E.; Subramaniam, S.; Murphy, R.C.; Nishijima, M.; Raetz, C.R.; Shimizu, T.; Spener, F.; van Meer, G.; Wakelam, M.J.; Dennis, E.A. Update of the LIPID MAPS comprehensive classification system for lipids. J. Lipid. Res. 2009, 50, S9–S14. [Google Scholar] [CrossRef] [PubMed]
- Beyene, H.B.; Olshansky, G.; AA, T.S.; Giles, C.; Huynh, K.; Cinel, M.; Mellett, N.A.; Cadby, G.; Hung, J.; Hui, J.; et al. High-coverage plasma lipidomics reveals novel sex-specific lipidomic fingerprints of age and BMI: Evidence from two large population cohort studies. PLoS Biol. 2020, 18, e3000870. [Google Scholar] [CrossRef]
- Pietilainen, K.H.; Sysi-Aho, M.; Rissanen, A.; Seppanen-Laakso, T.; Yki-Jarvinen, H.; Kaprio, J.; Oresic, M. Acquired obesity is associated with changes in the serum lipidomic profile independent of genetic effects—A monozygotic twin study. PLoS ONE 2007, 2, e218. [Google Scholar] [CrossRef] [PubMed]
- Rauschert, S.; Uhl, O.; Koletzko, B.; Kirchberg, F.; Mori, T.A.; Huang, R.C.; Beilin, L.J.; Hellmuth, C.; Oddy, W.H. Lipidomics Reveals Associations of Phospholipids With Obesity and Insulin Resistance in Young Adults. J. Clin. Endocrinol. Metab. 2016, 101, 871–879. [Google Scholar] [CrossRef] [PubMed]
- Wang, Y.; Jiang, C.T.; Song, J.Y.; Song, Q.Y.; Ma, J.; Wang, H.J. Lipidomic Profile Revealed the Association of Plasma Lysophosphatidylcholines with Adolescent Obesity. Biomed. Res. Int. 2019, 2019, 1382418. [Google Scholar] [CrossRef]
- Yin, X.; Willinger, C.M.; Keefe, J.; Liu, J.; Fernandez-Ortiz, A.; Ibanez, B.; Penalvo, J.; Adourian, A.; Chen, G.; Corella, D.; et al. Lipidomic profiling identifies signatures of metabolic risk. EBioMedicine 2020, 51, 102520. [Google Scholar] [CrossRef]
- Mousa, A.; Naderpoor, N.; Mellett, N.; Wilson, K.; Plebanski, M.; Meikle, P.J.; de Courten, B. Lipidomic profiling reveals early-stage metabolic dysfunction in overweight or obese humans. Biochim. Biophys. Acta Mol. Cell Biol. Lipids 2019, 1864, 335–343. [Google Scholar] [CrossRef] [PubMed]
- Rangel-Huerta, O.D.; Pastor-Villaescusa, B.; Gil, A. Are we close to defining a metabolomic signature of human obesity? A systematic review of metabolomics studies. Metabolomics 2019, 15, 93. [Google Scholar] [CrossRef] [PubMed]
- Ubhi, B.K. Direct Infusion-Tandem Mass Spectrometry (DI-MS/MS) Analysis of Complex Lipids in Human Plasma and Serum Using the Lipidyzer Platform. Methods Mol. Biol. 2018, 1730, 227–236. [Google Scholar] [CrossRef] [PubMed]
- Adany, R.; Piko, P.; Fiatal, S.; Kosa, Z.; Sandor, J.; Biro, E.; Kosa, K.; Paragh, G.; Bacsne Baba, E.; Veres-Balajti, I.; et al. Prevalence of Insulin Resistance in the Hungarian General and Roma Populations as Defined by Using Data Generated in a Complex Health (Interview and Examination) Survey. Int. J. Environ. Res. Public Health 2020, 17, 4833. [Google Scholar] [CrossRef] [PubMed]
- Franko, A.; Merkel, D.; Kovarova, M.; Hoene, M.; Jaghutriz, B.A.; Heni, M.; Konigsrainer, A.; Papan, C.; Lehr, S.; Haring, H.U.; et al. Dissociation of Fatty Liver and Insulin Resistance in I148M PNPLA3 Carriers: Differences in Diacylglycerol (DAG) FA18:1 Lipid Species as a Possible Explanation. Nutrients 2018, 10, 1314. [Google Scholar] [CrossRef]
- Khan, M.J.; Codreanu, S.G.; Goyal, S.; Wages, P.A.; Gorti, S.K.K.; Pearson, M.J.; Uribe, I.; Sherrod, S.D.; McLean, J.A.; Porter, N.A.; et al. Evaluating a targeted multiple reaction monitoring approach to global untargeted lipidomic analyses of human plasma. Rapid. Commun. Mass Spectrom. 2020, 34, e8911. [Google Scholar] [CrossRef]
- Alarcon-Barrera, J.C.; von Hegedus, J.H.; Brouwers, H.; Steenvoorden, E.; Ioan-Facsinay, A.; Mayboroda, O.A.; Ondo-Mendez, A.; Giera, M. Lipid metabolism of leukocytes in the unstimulated and activated states. Anal. Bioanal. Chem. 2020, 412, 2353–2363. [Google Scholar] [CrossRef]
- Liebisch, G.; Fahy, E.; Aoki, J.; Dennis, E.A.; Durand, T.; Ejsing, C.S.; Fedorova, M.; Feussner, I.; Griffiths, W.J.; Kofeler, H.; et al. Update on LIPID MAPS classification, nomenclature, and shorthand notation for MS-derived lipid structures. J. Lipid Res. 2020, 61, 1539–1555. [Google Scholar] [CrossRef]
- Morigny, P.; Zuber, J.; Haid, M.; Kaltenecker, D.; Riols, F.; Lima, J.D.C.; Simoes, E.; Otoch, J.P.; Schmidt, S.F.; Herzig, S.; et al. High levels of modified ceramides are a defining feature of murine and human cancer cachexia. J. Cachexia Sarcopenia Muscle 2020, 11, 1459–1475. [Google Scholar] [CrossRef]
- Shah, V.P.; Midha, K.K.; Dighe, S.; McGilveray, I.J.; Skelly, J.P.; Yacobi, A.; Layloff, T.; Viswanathan, C.T.; Cook, C.E.; McDowall, R.D.; et al. Analytical methods validation: Bioavailability, bioequivalence and pharmacokinetic studies. Conference report. Eur. J. Drug Metab. Pharmacokinet. 1991, 16, 249–255. [Google Scholar] [CrossRef]
- Templeton, G.F. A Two-Step Approach for Transforming Continuous Variables to Normal: Implications and Recommendations for IS Research. Commun. Assoc. Inf. Syst. 2011, 28, 4. [Google Scholar] [CrossRef]
- Jonckheere, A.R. A Distribution-Free k-Sample Test Against Ordered Alternatives. Biometrika 1954, 41, 133–145. [Google Scholar] [CrossRef]
- Ruopp, M.D.; Perkins, N.J.; Whitcomb, B.W.; Schisterman, E.F. Youden Index and optimal cut-point estimated from observations affected by a lower limit of detection. Biom. J. 2008, 50, 419–430. [Google Scholar] [CrossRef] [PubMed]
- Castelli, W.P.; Anderson, K.; Wilson, P.W.; Levy, D. Lipids and risk of coronary heart disease. The Framingham Study. Ann. Epidemiol. 1992, 2, 23–28. [Google Scholar] [CrossRef]
- The IDF Consensus Worldwide Definition of the Metabolic Syndrome; International Diabetes Federation: Brussels, Belgium, 2006.
- Ain, Q.U.; Asif, N.; Gilani, M.; Sheikh, N.W.; Akram, A. To Determine Cutoff Value of Triglycerides to HDL Ratio in Cardio Vascular Risk Factors. Biochem. Anal. Biochem. 2018, 7, 1–4. [Google Scholar] [CrossRef]
- Mach, F.; Baigent, C.; Catapano, A.L.; Koskinas, K.C.; Casula, M.; Badimon, L.; Chapman, M.J.; De Backer, G.G.; Delgado, V.; Ference, B.A.; et al. 2019 ESC/EAS Guidelines for the management of dyslipidaemias: Lipid modification to reduce cardiovascular risk. Eur. Heart J. 2020, 41, 111–188. [Google Scholar] [CrossRef] [PubMed]
- Avela, H.F.; Siren, H. Advances in lipidomics. Clin. Chim. Acta 2020, 510, 123–141. [Google Scholar] [CrossRef]
- Ding, M.; Rexrode, K.M. A Review of Lipidomics of Cardiovascular Disease Highlights the Importance of Isolating Lipoproteins. Metabolites 2020, 10, 163. [Google Scholar] [CrossRef] [PubMed]
- Bowden, J.A.; Heckert, A.; Ulmer, C.Z.; Jones, C.M.; Koelmel, J.P.; Abdullah, L.; Ahonen, L.; Alnouti, Y.; Armando, A.M.; Asara, J.M.; et al. Harmonizing lipidomics: NIST interlaboratory comparison exercise for lipidomics using SRM 1950-Metabolites in Frozen Human Plasma. J. Lipid Res. 2017, 58, 2275–2288. [Google Scholar] [CrossRef] [PubMed]
- Sales, S.; Graessler, J.; Ciucci, S.; Al-Atrib, R.; Vihervaara, T.; Schuhmann, K.; Kauhanen, D.; Sysi-Aho, M.; Bornstein, S.R.; Bickle, M.; et al. Gender, Contraceptives and Individual Metabolic Predisposition Shape a Healthy Plasma Lipidome. Sci. Rep. 2016, 6, 27710. [Google Scholar] [CrossRef]
- Quehenberger, O.; Armando, A.M.; Brown, A.H.; Milne, S.B.; Myers, D.S.; Merrill, A.H.; Bandyopadhyay, S.; Jones, K.N.; Kelly, S.; Shaner, R.L.; et al. Lipidomics reveals a remarkable diversity of lipids in human plasma. J. Lipid Res. 2010, 51, 3299–3305. [Google Scholar] [CrossRef]
- Montgomery, M.K.; Osborne, B.; Brown, S.H.; Small, L.; Mitchell, T.W.; Cooney, G.J.; Turner, N. Contrasting metabolic effects of medium- versus long-chain fatty acids in skeletal muscle. J. Lipid Res. 2013, 54, 3322–3333. [Google Scholar] [CrossRef]
- Frayn, K.N. Adipose tissue as a buffer for daily lipid flux. Diabetologia 2002, 45, 1201–1210. [Google Scholar] [CrossRef]
- van Hall, G. The Physiological Regulation of Skeletal Muscle Fatty Acid Supply and Oxidation During Moderate-Intensity Exercise. Sports Med. 2015, 45, 23–32. [Google Scholar] [CrossRef]
- Silva Figueiredo, P.; Carla Inada, A.; Marcelino, G.; Maiara Lopes Cardozo, C.; de Cassia Freitas, K.; de Cassia Avellaneda Guimaraes, R.; de Castro, A.P.; do Nascimento, V.A.; Hiane, P.A. Fatty Acids Consumption: The Role Metabolic Aspects Involved in Obesity and Its Associated Disorders. Nutrients 2017, 9, 1158. [Google Scholar] [CrossRef] [PubMed]
- Kojta, I.; Chacinska, M.; Blachnio-Zabielska, A. Obesity, Bioactive Lipids, and Adipose Tissue Inflammation in Insulin Resistance. Nutrients 2020, 12, 1305. [Google Scholar] [CrossRef] [PubMed]
- Goodpaster, B.H.; Theriault, R.; Watkins, S.C.; Kelley, D.E. Intramuscular lipid content is increased in obesity and decreased by weight loss. Metabolism 2000, 49, 467–472. [Google Scholar] [CrossRef]
- Kelley, D.E.; Goodpaster, B.; Wing, R.R.; Simoneau, J.A. Skeletal muscle fatty acid metabolism in association with insulin resistance, obesity, and weight loss. Am. J. Physiol. 1999, 277, E1130–E1141. [Google Scholar] [CrossRef]
- St-Onge, M.P.; Jones, P.J. Greater rise in fat oxidation with medium-chain triglyceride consumption relative to long-chain triglyceride is associated with lower initial body weight and greater loss of subcutaneous adipose tissue. Int. J. Obes. Relat. Metab. Disord. 2003, 27, 1565–1571. [Google Scholar] [CrossRef] [PubMed]
- Mittendorfer, B. Origins of metabolic complications in obesity: Adipose tissue and free fatty acid trafficking. Curr. Opin. Clin. Nutr. Metab. Care 2011, 14, 535–541. [Google Scholar] [CrossRef]
- Candi, E.; Tesauro, M.; Cardillo, C.; Lena, A.M.; Schinzari, F.; Rodia, G.; Sica, G.; Gentileschi, P.; Rovella, V.; Annicchiarico-Petruzzelli, M.; et al. Metabolic profiling of visceral adipose tissue from obese subjects with or without metabolic syndrome. Biochem. J. 2018, 475, 1019–1035. [Google Scholar] [CrossRef]
- Wallner, S.; Schmitz, G. Plasmalogens the neglected regulatory and scavenging lipid species. Chem. Phys. Lipids 2011, 164, 573–589. [Google Scholar] [CrossRef]
- Heilbronn, L.K.; Coster, A.C.; Campbell, L.V.; Greenfield, J.R.; Lange, K.; Christopher, M.J.; Meikle, P.J.; Samocha-Bonet, D. The effect of short-term overfeeding on serum lipids in healthy humans. Obesity 2013, 21, E649–E659. [Google Scholar] [CrossRef] [PubMed]
- Donovan, E.L.; Pettine, S.M.; Hickey, M.S.; Hamilton, K.L.; Miller, B.F. Lipidomic analysis of human plasma reveals ether-linked lipids that are elevated in morbidly obese humans compared to lean. Diabetol. Metab. Syndr. 2013, 5, 24. [Google Scholar] [CrossRef] [PubMed]
- Braverman, N.E.; Moser, A.B. Functions of plasmalogen lipids in health and disease. Biochim. Biophys. Acta 2012, 1822, 1442–1452. [Google Scholar] [CrossRef]
- Ralston, J.C.; Badoud, F.; Cattrysse, B.; McNicholas, P.D.; Mutch, D.M. Inhibition of stearoyl-CoA desaturase-1 in differentiating 3T3-L1 preadipocytes upregulates elongase 6 and downregulates genes affecting triacylglycerol synthesis. Int. J. Obes. 2014, 38, 1449–1456. [Google Scholar] [CrossRef]
- Piers, L.S.; Walker, K.Z.; Stoney, R.M.; Soares, M.J.; O’Dea, K. The influence of the type of dietary fat on postprandial fat oxidation rates: Monounsaturated (olive oil) vs saturated fat (cream). Int. J. Obes. Relat. Metab. Disord. 2002, 26, 814–821. [Google Scholar] [CrossRef]
- Krishnan, S.; Cooper, J.A. Effect of dietary fatty acid composition on substrate utilization and body weight maintenance in humans. Eur. J. Nutr. 2014, 53, 691–710. [Google Scholar] [CrossRef]
- Chew, W.S.; Torta, F.; Ji, S.; Choi, H.; Begum, H.; Sim, X.; Khoo, C.M.; Khoo, E.Y.H.; Ong, W.Y.; Van Dam, R.M.; et al. Large-scale lipidomics identifies associations between plasma sphingolipids and T2DM incidence. JCI Insight. 2019, 5, e126925. [Google Scholar] [CrossRef] [PubMed]
- Sokolowska, E.; Blachnio-Zabielska, A. The Role of Ceramides in Insulin Resistance. Front. Endocrinol. 2019, 10, 577. [Google Scholar] [CrossRef] [PubMed]
- Hu, C.; Luo, W.; Xu, J.; Han, X. Recognition and Avoidance of Ion Source-Generated Artifacts in Lipidomics Analysis. Mass Spectrom. Rev. 2020. [Google Scholar] [CrossRef] [PubMed]
- Gathungu, R.M.; Larrea, P.; Sniatynski, M.J.; Marur, V.R.; Bowden, J.A.; Koelmel, J.P.; Starke-Reed, P.; Hubbard, V.S.; Kristal, B.S. Optimization of Electrospray Ionization Source Parameters for Lipidomics To Reduce Misannotation of In-Source Fragments as Precursor Ions. Anal. Chem. 2018, 90, 13523–13532. [Google Scholar] [CrossRef] [PubMed]


| BMI < 25 kg/m2 | BMI 25–29.9 kg/m2 | BMI ≥ 30 kg/m2 | ||||||||
|---|---|---|---|---|---|---|---|---|---|---|
| n | Rep (%) | Mean Age ± SD (years) | n | Rep (%) | Mean Age ± SD (years) | n | Rep (%) | Mean Age ± SD (years) | Total n | |
| total | 57 | 41.91 | 41.61 ± 11.23 | 31 | 22.79 | 45.03 ± 10.75 | 48 | 35.29 | 49.06 ± 9.74 | 136 |
| male | 16 | 28.07 | 45.94 ± 12.57 | 12 | 38.71 | 43.00 ± 12.02 | 14 | 29.17 | 49.36 ± 8.18 | 42 |
| female | 41 | 71.93 | 39.93 ± 10.34 | 19 | 61.29 | 46.32 ± 9.99 | 34 | 70.83 | 48.94 ± 10.43 | 94 |
| Hungarian general | 31 | 54.39 | 42.26 ± 11.45 | 16 | 51.61 | 46.00 ± 10.61 | 24 | 50.00 | 51.67 ±8.38 | 71 |
| Hungarian Roma | 26 | 45.61 | 40.85 ± 11.13 | 15 | 48.39 | 44.00 ± 11.17 | 24 | 50.00 | 46.46 ± 10.47 | 65 |
| Reference Value * | BMI < 25 kg/m2 | BMI 25–29.9 kg/m2 | BMI ≥ 30 kg/m2 | p for Trend | |
|---|---|---|---|---|---|
| Mean ± SD | Mean ± SD | Mean ± SD | |||
| TC (mmol/L) | <5.2 mmol/L in both sexes [27] | 4.70 ± 0.95 | 5.06 ± 0.87 | 5.39 ± 0.92 | <0.001 |
| TG (mmol/L) | <1.7 mmol/L in both sexes [28] | 1.02 ± 0.50 | 1.37 ± 0.69 | 1.76 ± 0.88 | <0.001 |
| HDL-C (mmol/L) | <1.03 mmol/L in male and <1.29 mmol/L in female [28] | 1.47 ± 0.32 | 1.27 ± 0.33 | 1.30 ± 0.36 | <0.010 |
| TG/HDL ratio | <1 for both sexes [29] | 0.77 ± 0.50 | 1.22 ± 0.84 | 1.54 ± 1.06 | <0.001 |
| LDL-C (mmol/L) | <3.3 mmol/L in both sexes [30] | 2.95 ± 0.86 | 3.34 ± 0.88 | 3.47 ± 0.96 | <0.010 |
| ApoAI (g/L) | <1.2 g/L in male and < 1.4 g/L in female [30] | 1.54 ± 0.23 | 1.44 ± 0.26 | 1.55 ± 0.29 | >0.050 |
| ApoB (g/L) | <1.3 g/L in both sexes [30] | 0.96 ± 0.25 | 1.10 ± 0.24 | 1.18 ± 0.23 | <0.001 |
| Direction of Association with BMI | No. of Step | Lipid Species | Negative log10-Transformed p Values | Increase in the Strength of Association with BMI |
|---|---|---|---|---|
| positive | 1 | TG 20:4_33:1 | 7.876 | r.l.m. |
| 2 | TG 16:0_38:6 | 7.428 | no | |
| 3 | TG 22:6_36:4 | 9.056 | yes | |
| 4 | TG 18:3_33:0 | 9.175 | yes | |
| 5 | TG 16:0_32:3 | 6.580 | no | |
| 6 | TG 16:1_30:0 | 6.000 | no | |
| 7 | TG 20:3_34:2 | 5.398 | no | |
| 8 | TG 14:0_34:2 | 4.921 | no | |
| 9 | TG 14:1_34:1 | 6.034 | no | |
| 10 | TG 18:0_32:1 | 4.921 | no | |
| 11 | TG 15:0_36:4 | 6.854 | no | |
| 12 | TG 18:1_36:0 | 4.678 | no | |
| 13 | CE 20:3 | 4.260 | no | |
| 14 | PC 18:0_22:6 | 4.337 | no | |
| 15 | TG 18:1_34:5 | 8.276 | no | |
| 16 | PE P-16:0/20:3 | 9.387 | yes | |
| 17 | TG 18:2_37:1 | 8.824 | no | |
| 18 | PE 18:0_18:0 | 9.337 | no | |
| 19 | SM 18:1;O2/20:0 | 4.469 | no | |
| 20 | TG 18:0_38:7 | 9.214 | no | |
| 21 | TG 18:0_32:2 | 5.699 | no | |
| 22 | TG 22:5_30:0 | 8.377 | no | |
| 23 | TG 20:2_30:0 | 9.125 | no | |
| 24 | PC 15:0_20:4 | 8.509 | no | |
| 25 | TG 18:3_38:2 | 3.292 | no | |
| 26 | TG 20:4_36:5 | 8.602 | no | |
| 27 | TG 18:2_36:6 | 8.409 | no | |
| negative | 1 | LPC 18:2 | 6.509 | r.l.m. |
| 2 | PC 18:1_18:1 | 7.060 | yes | |
| 3 | Hex-Cer 18:1;O2/22:0 | 7.079 | yes |
| Reference Value | BMI < 25 kg/m2 | BMI ≥ 30 kg/m2 | p Value | |
|---|---|---|---|---|
| Mean ± SD | Mean ± SD | |||
| Sum of the concentration of lipid molecules showing positive association with BMI | <2.15 µmol/L | 1.54 + 0.76 | 2.73 + 0.73 | <0.001 |
| Sum of the concentration of lipid molecules showing negative association with BMI | ≥71.43 µmol/L | 83.92 + 22.33 | 63.38 + 21.55 | <0.001 |
| Lipid species ratio | <0.03 | 0.02 + 0.01 | 0.05 + 0.03 | <0.001 |
| Lipid Species | This Study Mean ± SD * (µmol/L) | Bowden et al. ** Mean ± SD (µmol/L) | Sales et al. ** Mean ± SD *** (µmol/L) |
|---|---|---|---|
| CE 20:3 | 34.46 ± 10.27 | 35 ± 12 | 17.51 ± 5.97 |
| Hex-Cer 18:1;O2/22:0 | 20.81 ± 4.86 | 2.4 ± 0.68 | 3.20 ± 0.73 |
| LPC 18:2 | 60.52 ± 20.12 | 22 ± 2.9 | 54.26 ± 13.17 |
| SM 18:1;O2_20:0 | 0.87 ± 0.26 | 11 ± 3.1 | 11.66 ± 2.09 |
| Lipid Class | This Study | Bowden et al. * | Sales et al. * | |||
|---|---|---|---|---|---|---|
| Concentration Mean ± SD (µmol/L) | Number of Lipid Species Measured within the Lipid Class | Concentration Mean ± SD (µmol/L) | Number of Lipid Species Measured within the Lipid Class | Concentration Mean ± SD ** (µmol/L) | Number of Lipid Species Measured within the Lipid Class | |
| CEs | 2070.25 ± 508.82 | 14 | 2981 ± 450 | 16 | 3473.58 ± 484.08 | 15 |
| Cers | 7.31 ± 1.95 | 5 | - *** | - | 5.33 ± 1.28 | 8 |
| DGs | 21.63 ± 11.26 | 12 | 53 ± 7 | 23 | 40.80 ± 13.59 | 12 |
| HexCers | 1.72 ± 0.58 | 2 | - *** | - | 17.30 ± 3.38 | 9 |
| LPCs | 291.2 ± 82.82 | 9 | 153 ± 12 | 12 | 276.92 ± 37.11 | 13 |
| LPEs | 4.54 ± 1.48 | 4 | 7 ± 1 | 7 | 13.99 ± 3.15 | 7 |
| PCs | 1503.76 ± 339.08 | 40 | 1074 ± 68 | 31 | 1278.37 ± 202.95 | 29 |
| PEs | 61.95 ± 17.69 | 28 | 70 ± 4 | 31 | 23.43 ± 10.43 | 10 |
| SMs | 77.12 ± 15.14 | 4 | 334 ± 22 | 35 | 318.72 ± 45.62 | 26 |
| TGs | 2756.56 ± 1439.95 | 424 | 491 ± 46 | 18 | 628.79 ± 225.66 | 48 |
Publisher’s Note: MDPI stays neutral with regard to jurisdictional claims in published maps and institutional affiliations. |
© 2021 by the authors. Licensee MDPI, Basel, Switzerland. This article is an open access article distributed under the terms and conditions of the Creative Commons Attribution (CC BY) license (http://creativecommons.org/licenses/by/4.0/).
Share and Cite
Pikó, P.; Pál, L.; Szűcs, S.; Kósa, Z.; Sándor, J.; Ádány, R. Obesity-Related Changes in Human Plasma Lipidome Determined by the Lipidyzer Platform. Biomolecules 2021, 11, 326. https://doi.org/10.3390/biom11020326
Pikó P, Pál L, Szűcs S, Kósa Z, Sándor J, Ádány R. Obesity-Related Changes in Human Plasma Lipidome Determined by the Lipidyzer Platform. Biomolecules. 2021; 11(2):326. https://doi.org/10.3390/biom11020326
Chicago/Turabian StylePikó, Péter, László Pál, Sándor Szűcs, Zsigmond Kósa, János Sándor, and Róza Ádány. 2021. "Obesity-Related Changes in Human Plasma Lipidome Determined by the Lipidyzer Platform" Biomolecules 11, no. 2: 326. https://doi.org/10.3390/biom11020326
APA StylePikó, P., Pál, L., Szűcs, S., Kósa, Z., Sándor, J., & Ádány, R. (2021). Obesity-Related Changes in Human Plasma Lipidome Determined by the Lipidyzer Platform. Biomolecules, 11(2), 326. https://doi.org/10.3390/biom11020326