Article

Transcription Factors Active in the Anterior Blastema of Schmidtea mediterranea

1
Planarian Stem Cell Laboratory, Max Planck Institute for Molecular Biomedicine, Von Esmarch-Str. 54, 48149 Münster, Germany
2
Max Planck Institute for Molecular Biomedicine, Röntgenstr. 20, 48149 Münster, Germany
3
Pluripotency & Regeneration Laboratory, Department Animal Physiology, University of Osnabrück, Barbarastr. 11, 49076 Osnabrück, Germany
*
Author to whom correspondence should be addressed.
Current Address: Department of Dermatology, Institute of Regenerative Medicine, University of Pennsylvania School of Medicine, Philadelphia, PA 19104, USA.
Current Address: Aflofarm Deutschland GmbH, Hopfenstrasse 28, 85283 Wolnzach, Germany.
§
Current Address: Pharmaceutical Chemistry and Technology Centre in Navile, FaBiT Department, Alma Mater Studiorum University of Bologna, Beverara 123/1, 40131 Bologna, Italy.
Current Address: Malaghan Institute of Medical Research, P.O. Box 7060, Newtown, Wellington 6242, New Zealand.
Current Address: Dean’s Office for Student Affairs, Dean’s Office for Science, Medical Faculty of the University of Cologne, Joseph-Stelzmann-Straße 20, 50931 Köln, Germany.
Biomolecules 2021, 11(12), 1782; https://doi.org/10.3390/biom11121782
Submission received: 16 September 2021 / Revised: 22 November 2021 / Accepted: 23 November 2021 / Published: 28 November 2021
(This article belongs to the Special Issue New Insights into Stem Cell Regulation)

Abstract

:
Regeneration, the restoration of body parts after injury, is quite widespread in the animal kingdom. Species from virtually all Phyla possess regenerative abilities. Human beings, however, are poor regenerators. Yet, the progress of knowledge and technology in the fields of bioengineering, stem cells, and regenerative biology have fostered major advancements in regenerative medical treatments, which aim to regenerate tissues and organs and restore function. Human induced pluripotent stem cells can differentiate into any cell type of the body; however, the structural and cellular complexity of the human tissues, together with the inability of our adult body to control pluripotency, require a better mechanistic understanding. Planarians, with their capacity to regenerate lost body parts thanks to the presence of adult pluripotent stem cells could help providing such an understanding. In this paper, we used a top-down approach to shortlist blastema transcription factors (TFs) active during anterior regeneration. We found 44 TFs—31 of which are novel in planarian—that are expressed in the regenerating blastema. We analyzed the function of half of them and found that they play a role in the regeneration of anterior structures, like the anterior organizer, the positional instruction muscle cells, the brain, the photoreceptor, the intestine. Our findings revealed a glimpse of the complexity of the transcriptional network governing anterior regeneration in planarians, confirming that this animal model is the perfect playground to study in vivo how pluripotency copes with adulthood.

1. Introduction

Planarians can regenerate all the missing tissues and organs after amputation, like the central nervous system (CNS) [1,2,3,4,5,6,7,8,9,10], the photoreceptors [11,12,13,14,15,16,17,18,19,20,21], the protonephridia [22,23,24], the intestine [25,26,27,28], and the body wall [29,30,31]. Planarian regeneration is a complex process where the missing tissues are both rebuilt and properly integrated with the existing tissues. It hinges on the presence of neoblasts, which are a heterogeneous population of adult stem cells among which both uncommitted pluripotent and committed multipotent cells linger [32,33,34,35,36,37,38]. Many genes, especially transcriptional regulators, were identified that are involved in planarian regeneration, either regulating its temporal and spatial organization, like MyoD [29], Prep [39], Isl-1 [40], or contributing directly to the cell and tissue functional differentiation, from the exit from pluripotency (e.g., Tcf15) to the terminal differentiation of specific tissues, like the brain, the intestine, the photoreceptors, the protonephridia and the germline [8,14,22,25,41,42,43,44,45]. Also, a number of papers has been published based on the generation of planarian transcriptomes since 2010, detailed in Table 1 [3,14,28,34,36,46,47,48,49,50,51,52,53,54,55,56,57,58,59,60,61,62,63,64,65,66,67,68]. These works coupled RNA-Seq, bioinformatic and functional RNAi analyses in order to depict and dissect the complexity of the transcriptional landscape of planarian regeneration [3,14,28,52,55,56,57,66,67,68,69,70,71,72]. However, what is not yet fully understood is how the blastema is temporally and spatially regulated as a whole, and how the regeneration of several structures of the body is concerted.
A previous effort aimed to discover key regulators of regenerations differentially expressed between head and tail was made [57] which was based on the collection and sequencing of the entire regenerating fragments. Therefore, we focused on a top-down approach where, alongside with regenerating anterior blastema samples, we also included stem-cell-enriched (e.g., X1 cell population), progeny-enriched (e.g., X2 cell population) stem-cell-depleted (Xin cell population, SmB(RNAi) planarians) and stem cell- and progeny-depleted (e.g., irradiated planarians) samples. By applying an ad-hoc bioinformatic pipeline to our RNA-Seq dataset, we shortlisted several transcription factors (TFs) that take part in the bona fide regulatory network of genes controlling adult pluripotent stem cells (aPSCs) commitment and differentiation during anterior regeneration, and functionally validated them by means of RNAi in regenerating planarians.
To our knowledge, this is the first attempt to describe the anterior regeneration in planarian from the transcriptional regulatory point, comparing the dissected blastema with other non-regenerating tissues. Further works are needed to depict the whole complexity of this network and to understand how it mechanistically concerts the differentiation of the SCs into terminally differentiated cells, to achieve complete regeneration. Thanks to the opportunity of studying pluripotency in vivo in the adult, planarian is a reference model system where pluripotency-based regeneration hypotheses could be tested, applicable for the future treatment of human diseases.

2. Materials and Methods

2.1. Planarian Husbandry

The asexual strain of S. mediterranea (clonal line BCN10) were kept in 1× planarian artificial medium (PAM) at 20 °C with 12 h shift of the light/dark cycle, and fed twice a week with organic bovine liver. The animals used for the experiments were starved for at least one week prior to the experiments. To obtain head, trunk, or tail fragments, intact animals were amputated by a scalpel blade pre- and post-pharyngeally, respectively.

2.2. Preparation of Blastema Samples

Regenerating head fragments were dissected at 3 or 6 days post amputation (dpa). For dissection, animals were placed on a glass slide and excess water was removed. The glass slides were placed on crushed ice under the microscope. Blastema were dissected with a new scalpel blade and collected in Trizol®. After the blastema was removed, a stripe of tissue approx. 0.5–1 mm wide (postblastema) was also removed and stored in Trizol®. Eventually, the non-regenerating part of the fragment (rest of body, RoB) was also collected in Trizol.

2.3. Flow Cytometry Analysis and FACS

To collect X1, X2, Xin cells, homeostatic animals were treated with 2% L- Cysteine in CMFH (pH 7.0) for 2 min in 100 mm petri dish placed on ice, rinsed in CMFH, transferred to a cover-slip and cut into several pieces using a scalpel blade no. 29. The fragments were transferred into a 1.5 mL protein low-binding tube (Protein LoBind, Eppendorf, Hamburg, Germany) using 250 μL of CMFH. For the cell dissociation, 250 μL 2× papain-solution was added and the fragments were incubated for 60 min at 25 °C. The reaction was stopped with 500 μL of 2× stop solution and the digested tissue was passed about 20 times in a large borehole P1000 pipette (STARLAB 1000 μL XL). The suspension was passed through a 30 µm filter (CellTrics, Parted, Görlitz, Germany) and spun down for 5 min at 500× g at 4 °C. After resuspension in 1 mL CMFH the cells were counted and the concentration was adjusted to 5 × 10⁵ cells/mL. After adding Hoechst and Calcein to a final concentration of 10 μg/mL and 0.05 μg/mL, respectively, the cell suspension was incubated for 2 h at RT on a horizontal shaker in the dark. The suspension was again filtered, centrifuged for 5 min at 500× g at 4 °C and resuspended in 500 μL CMFH. After addition of 1 μg/mL propidium iodide the samples were analyzed on a FACSAria II (upgraded to III; BD, Heidelberg, Germany), as previously described [73]. Cells in X1, X2, and Xin gates were sorted in CMFH. After sorting, cells were lysed in Trizol.

2.4. Irradiation and RNAi

Planarians were γ-irradiated with 60 Gy in a Gammacell 40 irradiator (Best Theratronics, Ottawa, ON, Canada). After irradiation, animals were amputated into head, trunk, and tail fragments. Three or 6 days after amputation, tail fragments were collected for RNA extraction. For SmB(RNAi), 5 mm long starved planarians were injected with double stranded RNA (dsRNA) in the gastro-vascular system using a Nanoject II (Drummond scientific, Broomall, PA, USA), with 3 pulses of 32 nl per day over 3 consecutive days. Animals were amputated 24 h after the last injection into head, trunk and tail fragments and the tail fragments were collected in Trizol at 6 dpa.

2.5. RNA Extraction and cDNA Synthesis

The RNA extraction was carried out with Trizol, following manufacturer’s instructions. Briefly, samples collected in 500 μL Trizol were vortexed for 5 s. The animals were incubated 5–15 min at RT (depending on the type and size of the samples), vortexed every 5 min. If fragments were not completely dissolved after 15 min incubation, an additional 500 μL of Trizol was added and the incubation repeated. Two-hundred μL of chloroform was added into the tube per 1 mL Trizol and shaken vigorously by hand for 10–15 s. Then, samples were incubated for 3 min at RT and centrifuged at 12,000× g for 15 min at 4 °C. The tube was carefully taken from the centrifuge and the upper aqueous phase was transferred into a new 1.5 mL reaction tube. Then, 500 μL isopropyl alcohol was added per 1 mL Trizol and the tube was shaken vigorously by hand for 10–15 s. The samples were incubated for 10 min at RT and then centrifuged at 12,000× g for 10 min at 4 °C. The supernatant was discarded, the pellet was washed with 1 mL 75% ice-cold EtOH and centrifuged at 7500× g for 5 min at 4 °C. The supernatant was discarded and the pellet was air-dried for a few minutes. The samples were resuspended in 10–20 μL RNase free water, depending on the pellet size. Total RNA concentration was measured with a Nanodrop and/or a Bioanalyzer. Total RNA was stored at −80 °C until use. Reverse transcription (RT) was carried out using the high-capacity cDNA reverse transcription kit (ThermoFisher Scientific, Dreieich, Germany) in 20 μL reaction volume, according to manufacturer’s instructions. Briefly, 250 ng of total RNA was used for RT, using Random Hexamers; MilliQ water instead of RNA was used as RT-control. After RH annealing (10 min at 25 °C), RT was carried out for 2 h at 37 °C.

2.6. RT-PCR and RT-qPCR

Gene expression was mostly assessed via quantitative PCR, with the exception of 20 candidate blastema transcription factors, whose expression was checked via conventional, semi-quantitative RT-PCR. Briefly, The TaqMan Fast Universal PCR master mix (ThermoFisher Scientific, Dreieich, Germany) was used, with custom designed Taqman probes. The reaction was carried out on ABIPrism 9600 HT with fast block, in 20 μL total volume. An initial denaturation step of 20 s was followed by 40 cycles with 95 °C for 1 s denaturation and annealing/elongation at 60 °C for 20 s. Transcript levels were normalized to the housekeeping gene Gapdh using the ∆∆Ct method. Each oligonucleotides set was tested for specificity and for the dynamic linear range prior to experiments.
Conventional RT-PCR was performed as follows. Briefly, 1× PCR buffer, 2 mM dNTPs, 1.5 mM MgCl2, 0.4 mM forward primer, 0.4 mM reverse primer, 250 ng cDNA template, 1.25 U AmpliTaq360 were mixed in a reaction volume of 25 μL. Each reaction was centrifuged briefly and then amplified with the following protocol: 5 min at 95 °C followed by 35 cycles of 30 s denaturation at 95 °C, 30 s annealing at 56–62 °C (depending on the annealing temperature of the primers), 1 min elongation at 72 °C and a final step of 7 min at 72 °C. Oligonucleotides for the amplification of the genes tested are listed in Table S1.

2.7. RNA-Seq

2.7.1. cDNA Library Preparation

Before Preparing the cDNA library, rRNA depletion was performed. To deplete rRNA, RiboMinus™ Eukaryote Kit (ThermoFisher Scientific, Dreieich, Germany) for RNA-Seq was used according to manufacturer’s instructions; one or two rounds of depletions were performed. Then, RNA fragmentation was performed. To perform fragmentation of the whole transcriptome RNA, RNase III was used from the SOLiD™ Total RNA-Seq Kit (ThermoFisher Scientific, Dreieich, Germany), according to manufacturer’s instructions. To clean up fragmented RNA, the RiboMinus Concentration Module (ThermoFisher Scientific, Dreieich, Germany) was used. To quantify the yield of the fragmented RNA, either the Quant-iT™ RNA Assay Kit with the Qubit Fluorometer (Invitrogen, Waltham, MA, USA) or the RNA 6000 Pico Chip Kit with the Agilent 2100 Bioanalyzer (Agilent, Santa Clara, CA, USA) were used, according to manufacturer’s instructions. To construct the amplified whole transcriptome library, hybridization and ligation of RNA were performed with the components from the SOLiD™ Total RNA-Seq Kit. To perform reverse transcription with hybridized and ligated RNA, 10xRT buffer, dNTP mix, SOLiD™ RT Primers and ArrayScript™ Reverse Transcriptase were used. To purify the reverse transcribed cDNA, the MinElute PCR purification Kit (Qiagen, Hilden, Germany) was used according to manufacturer’s instructions. For size-based selection of the cDNA, Novex pre-cast gel products (ThermoFisher Scientific, Dreieich, Germany), 50 bp DNA Ladder and SYBR Gold nucleic acid gel stain was used according to manufacturer’s instructions. Using a clean razor blade, the gel plug corresponding to 150–250 nt cDNA was excised. To amplify the size selected cDNA, 10xPCR buffer, dNTP Mix, SOLiD™ 5′ PCR Primer, AmpliTaq DNA polymerase and SOLiD™ 3′ PCR Primer were used. The PCR was performed as follows: 95 °C for 5 min and 15 cycles of 95 °C for 30 s, 62 °C for 30 s and 72 °C for 30 s. To purify the amplified DNA, the PureLink™ PCR Micro Kit (ThermoFisher Scientific, Dreieich, Germany) was used according to the manufacturer’s instructions.

2.7.2. PCR, Emulsion PCR and RNA-Seq Run

The RNA-seq run was performed on a SOLiD 4HT sequencer. Each library template was clonally amplified on SOLiD™ P1 DNA Beads via emulsion PCR, according to the Applied Biosystems SOLiD™ 4 System Templated Bead Preparation Guide (PN 4448378).

2.7.3. RNA-Seq Data Primary Analysis

Sequencing post-processing was performed so to convert the reads into FASTA files. Reads were converted into CSFASTA format (i.e., a color space representation of FASTA format) by the SOLiD4 sequencing software at the end of the run. Data were then transferred manually to the analysis server using the ‘export’ function of the SOLiD web interface, according to manufacturer’s instructions. The individual library directories did not have a predictable prefix, so a custom shell script was run to produce a file containing a list of the experimental directories and to exclude reads with missing and unassigned barcodes.

2.8. RNA-Seq Analytical Pipeline

For mapping, we used a previously-assembled and Blast2GO-annotated Schmidtea mediterranea transcriptome assembly, trinity5, generated from Illumina reads using Trinity (see https://doi.org/10.1016/j.celrep.2014.12.018, accessed on 10 November 2021). Using this assembly, SOLiD reads were mapped to this transcriptome using the color-space function available in Bowtie, in combination with Tophat. Reads were subsequently normalised for read count and variance using the R package DESeq. Pairwise differential expression results were generated (comparing every sample with all others) including log2 fold changes and adjusted p-values (padj), applying a filter of padj < 0.3.

2.9. Whole Mount In Situ Hybridization, Fluorescent In Situ Hybridization and Immunohistochemistry

The protocol for whole mount in situ hybridization (WISH) was performed as previously described [74]. All steps have been performed under gentle shaking, if not otherwise specified. Briefly, planarians were killed in 2% HCl in 5/8 Holtfreter for 2 min on ice, fixed in 4% Formaldehyde for 20 min at 4 °C, post-fixed in MetOH (100%) for 2 h at 4 °C and bleached in 6% H2O2 in MetOH overnight using a bleaching lamp at RT. Animals were then rehydrated through a descending series of 75%, 50%, and 25% MetOH in 5/8 Holtfreter and finally incubated in PBTx for 30 min at 4 °C for each step. Permeabilization was performed by incubating the animals for 8–10 min in 20 μg/mL Proteinase K in PBTx at 37 °C. The reaction was stopped in 2% Glycine/PBTx for 10 min at RT and washing in PBTx for 1 min at RT. After a post-fixation using 4% PFA/PBTx for 1 h at 4 °C the animals were again rinsed in PBTx for 20 min at 4 °C and then incubated in 0.1 M TEA/PBTx for 15 min at RT. The following acetylation was performed by adding 0.25% acetic anhydrite, incubating for 15 min at RT, adding again 0.25% acetic anhydrite, incubating for a further 15 min at RT and rinsing the animals in PBTx for 5 min at RT. Prior to hybridization, samples were conditioned in 1:1 prehybridization solution/PBTx at RT for 10 min, and in prehybridization for 1 h at 56 °C. The riboprobes were diluted in hybridization solution to a final concentration of 0.01 ng/mL and denaturated at 70 °C for 10 min. Subsequently the samples were incubated with one gene-specific riboprobe for 60 h at 56 °C. Afterwards, fresh hybridization solution (without riboprobe) was replaced, followed by an stepwise dilution of the hybridization solution with 20× SSC, at 56 °C, each step lasting 40 min. Samples were then incubated in Maleic acid buffer (MAB, 100 mM maleic acid, 150 mM NaCl, 0.1% Triton-X 100, pH 7.5) for 20 min at RT and blocked in 10% horse serum MABT (Buffer II) for 1 h at RT. Antibody incubation (1:2000 anti-DIG-Fab fragments in Buffer II) was performed for 3 h at RT and the unbound antibodies were washed away by rinsing in MABT at 4 °C over-night. Each specimen was then conditioned in modified NTMT buffer (AP buffer, 0.1 M Tris-HCl pH 9.5, 0.1 M NaCl, 0.1% Tween) 3 times at RT for 10 min and then developed with 10% PVA AP buffer at RT in the dark. The clearing was done by rinsing in PBTx for 5 min at RT, fixation in 4% PFA/PBTx for 30 min at RT, rinsing in PBTx at RT and washing in 100% EtOH for 20 min at RT. After washing in 50% EtOH/PBTx and PBTx for 5 min at each RT, the animals were mounted on coverslips with VectaShield and imaged under either a fluorescent stereomicroscope (Nikon SMZ18, Düsseldorf, Germany) or a confocal inverted microscope (Zeiss LSM780, Jena, Germany).
For Fluorescent in situ hybridization (FISH), animals were processed as previously described [75] using tyramide signal amplification (Perkin Elmer, Solingen, Germany) according to the manufacturer’s instructions. Probes used for double-FISH were labeled with either digoxigenin (DIG) or dinitrophenyl (DNP) (Mirus DNP Labeling Kit, Mobitech GmbH, Göttingen, Germany). After incubation in anti-DIG-POD (poly, 1:100, Roche) or anti-DNP-HRP (1:100, Perkin Elmer) samples were washed in PBS/0.1% Tween 20 for 2 h and were developed with FITC-tyramide or Cy3-tyramide (Perkin Elmer, Solingen, Germany). The first color reaction was quenched with 1% H2O2 in PBS/0.1% Tween 20 for 45 min, followed by 10 min at 56 °C in 50% formamide/2×SSC/1% Tween-20. Oligonucleotides used for the synthesis of the riboprobes are listed in Table S2.
In case immunohistochemistry was performed, after an additional wash step in PBTx, blocking occurred in 1% BSA/PBTx for 2 h at RT and the primary antibody was incubated in 1% BSA/PBTx overnight at 4 °C. Rabbit-anti-PIWI1 antibody was used at a 1:5000 dilution. The next day 7 PBTx wash steps were performed for 1 h each at 4 °C. Subsequently, 0.5 μg/mL secondary antibody was incubated in 1% BSA/PBTx at 4 °C overnight. After washing 6 times with PBTx for 1 h each the animals were counterstained with 5 μg/mL Hoechst in PBTx for 2 h, mounted with VectaShield on a glass slide and imaged with a confocal microscope.

2.10. Gene Specific Knock-Down by dsRNA Injection

For dsRNA-mediated RNAi of blastema TFs, 5 mm long starved planarians were injected with gene-specific dsRNA (oligonucleotides used are listed in Table S2) in the gastro-vascular system using a Nanoject II (Drummond scientific, Broomall, PA, USA), with 3 pulses of 32 nl over 3 consecutive days. Control animals were injected with either dsRNA against GFP or water. Animals were either left intact or amputated 24 h after the last injection into head, trunk, and tail fragments, and imaged at 7 and 14 dpa.

2.11. Statistical Analysis

One-way ANOVA with Tukey post-hoc test, Kruskal–Wallis test with Dunn’s multiple comparison post-hoc test, two-tailed Students’ t-test and Fisher’s exact test were performed using GraphPad Prism 8.0 and 9.0 (GraphPad software, La Jolla, CA, USA). When variance was found between different sets of data, Welch’s correction was applied. Adjusted p-value in RNA sequencing data (padj) was calculated in DESeq2 package using Wald-test. Linear dimensionality reduction was achieved via Principal Component Analysis, using the function prcomp in R.

3. Results

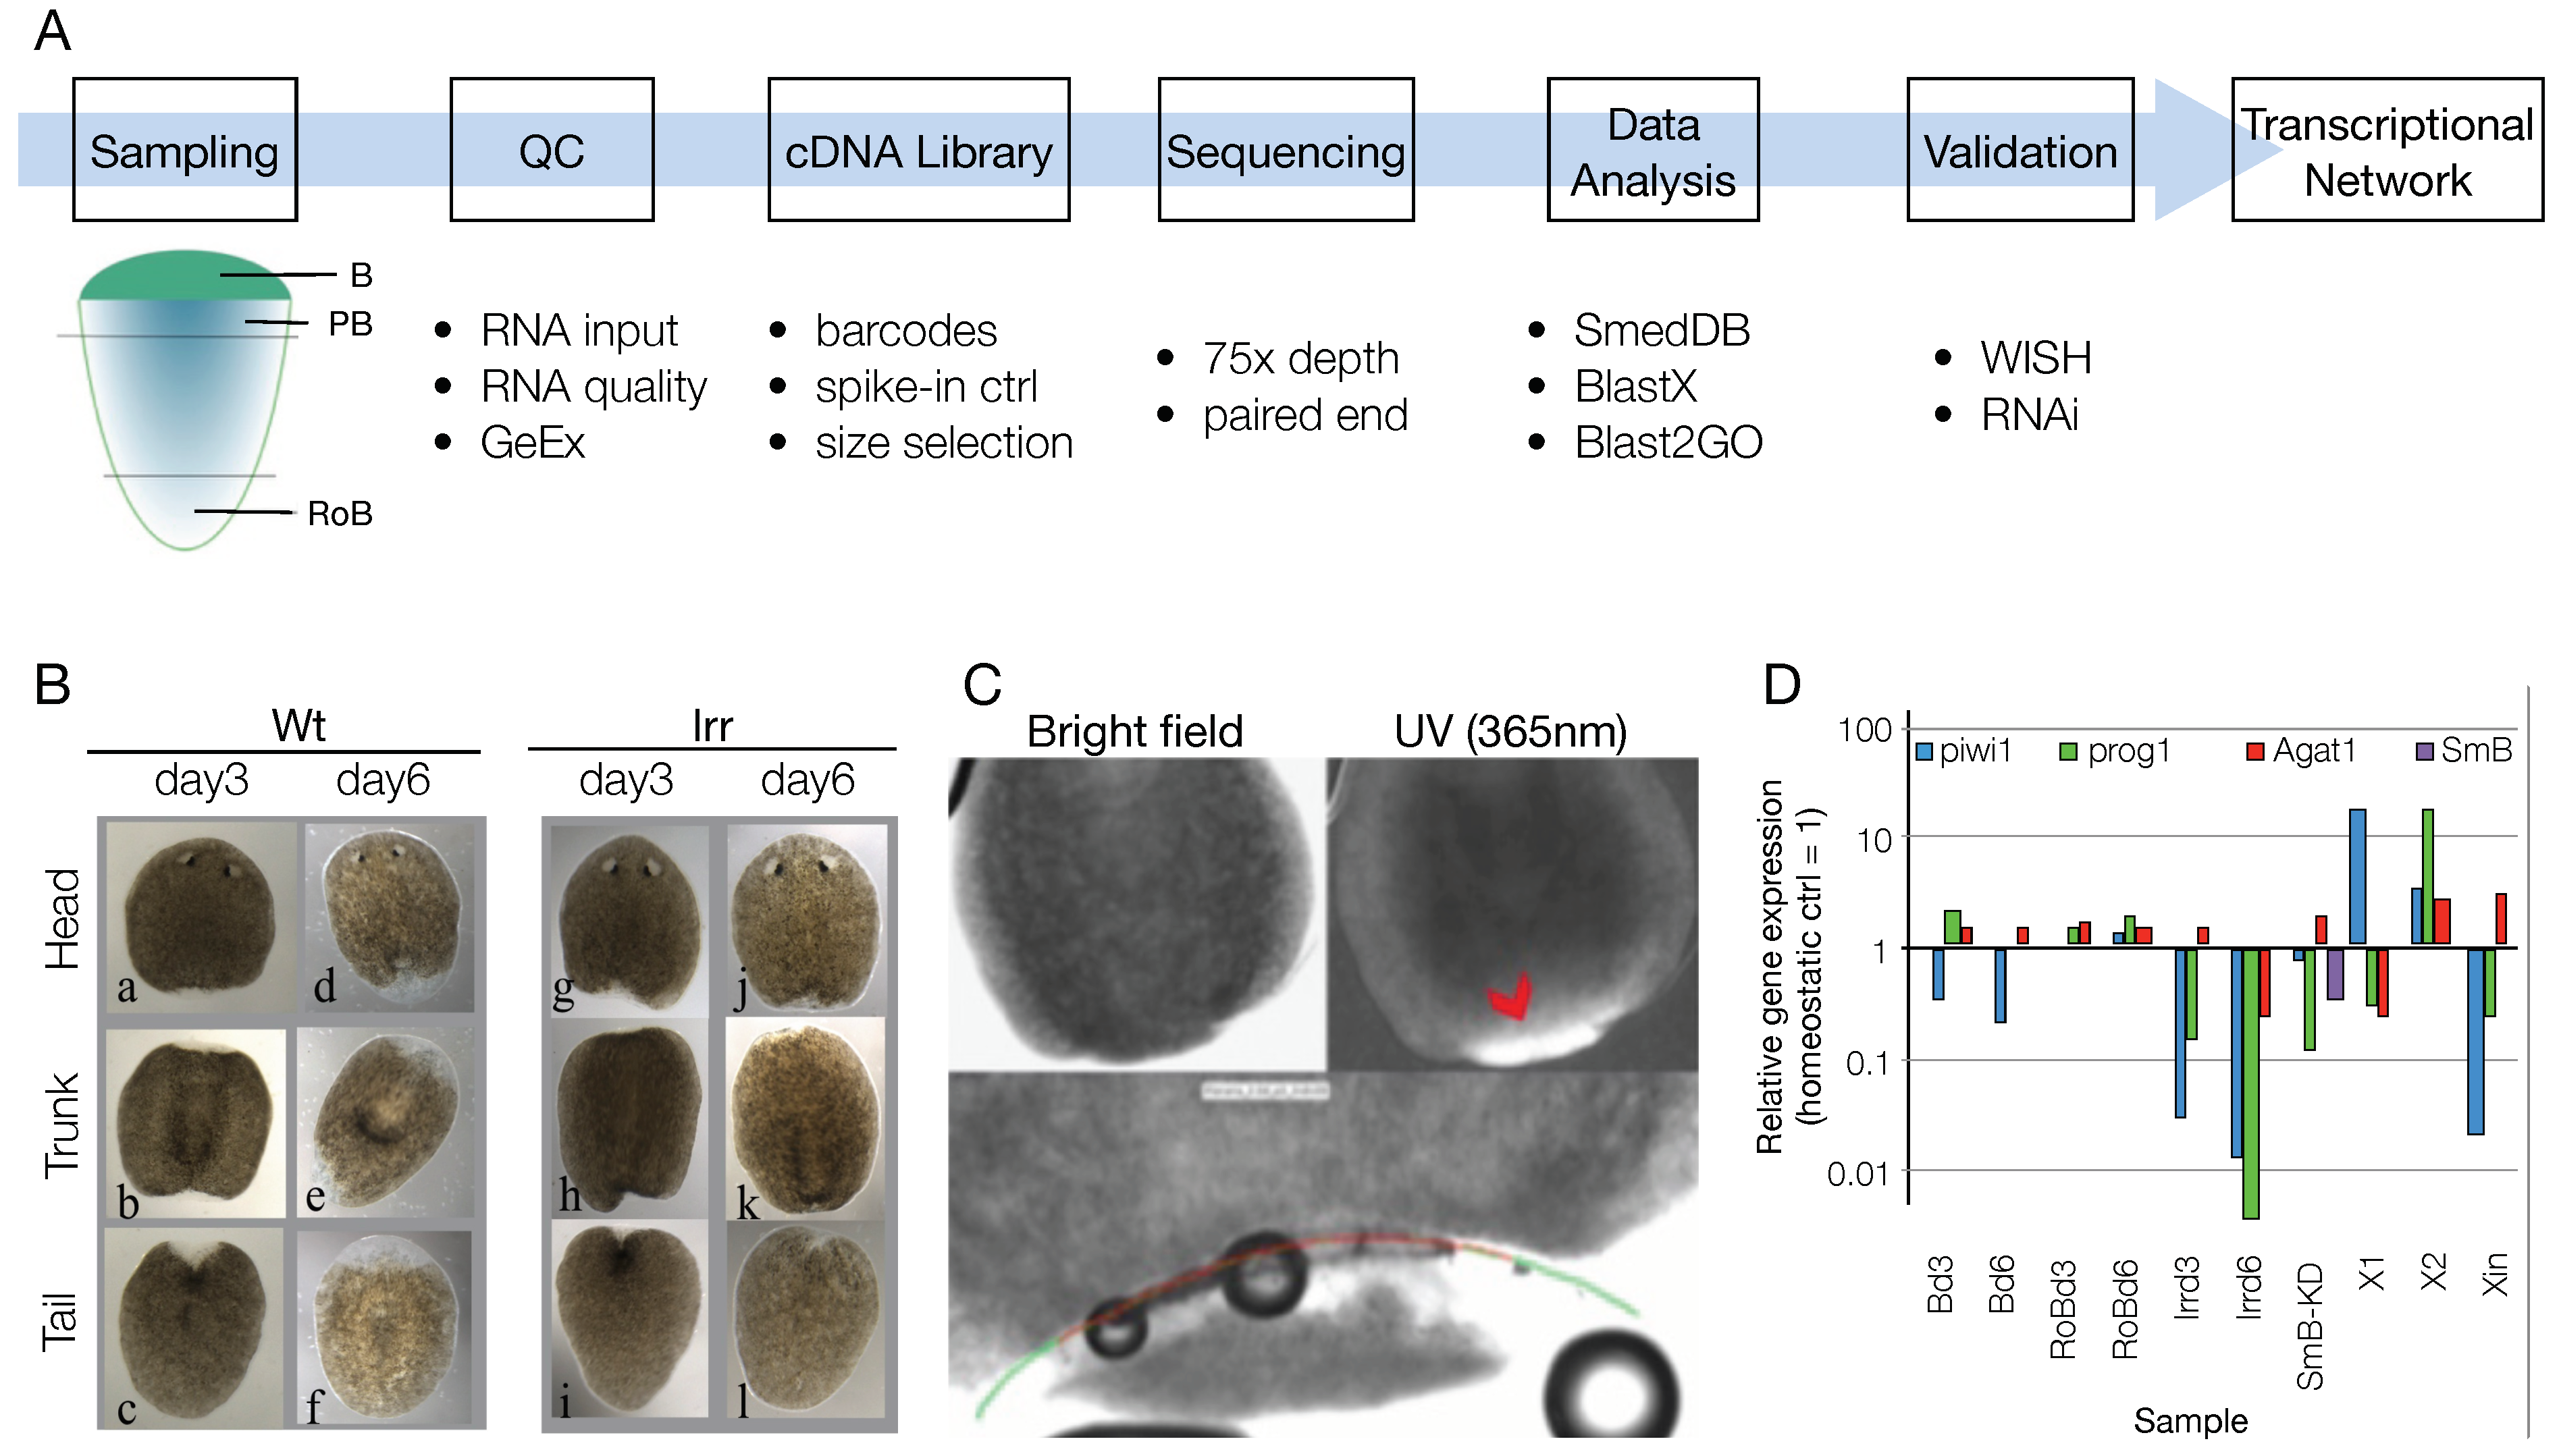
3.1. Sample List Definition and Pre-Run Quality Check

In order to study the transcriptional networks controlling the commitment and differentiation of the planarian SCs during regeneration, we generated RNA-Seq data from the anterior blastema at different time points of regeneration, and compared it with non-regenerating tissues (Figure 1A–C, Table S3). There are several sets of independently assembled S. mediterranea transcriptome data obtained via RNA-Seq (Table 1). In this study, we have strategically designed the RNA-Seq experiments to identify the transcriptional regulatory genes using multiple controls and an in silico data sorting strategy, to efficiently narrow down the number of candidate genes from the large RNA-Seq dataset (Figure 1A). Planarian regeneration lasts approximately two weeks but most of the missing tissues regenerate within one week from amputation. After amputation occurs, the SCs recruited at the wound site begin to proliferate and differentiate. Within approximately 2 days following amputation, a blastema forms, where progenitor and differentiating cells accumulate to regenerate the missing body parts [76,77]. Regenerating samples rich in progeny and differentiating cells were therefore collected at 3 and 6 days after amputation (dpa) (Figure 1B), separating the unpigmented blastema from the pigmented body part, either with a scalpel, or via laser microdissection (Figure 1C). Alongside the blastema samples, samples enriched in stem cells (i.e., X1 and X2 cell populations) and samples depleted of them, through different procedures, like irradiation (i.e., homeostatic animals at 3 and 6 days after irradiation), sorting (Xin cell population) and RNAi (i.e., SmB KD) were also collected. The bona fide non regenerating tissues at the posterior end of the fragment from which the blastema were separated (“rest of the body”, RoB) were also collected. Different amounts of total RNA from wild-type S. mediterranea homeostatic individuals (i.e., 50, 125, 250, and 1000 ng) were also processed, according to previous findings that showed no differences in gene detection for total RNA input exceeding 500 pg [78].
At the time this project was initiated, no methods were published on the use of small amount of planarian RNA for RNA-Seq, as was the case for the isolated blastema samples. Therefore, assessing the quality of the RNA was fundamental in order to deliver consistent RNA-Seq data. To collect enough total RNA, 30–40 blastema samples were pooled together, and the sample quality was checked by means of both spectrophotometry (Nanodrop, Bioanalyzer) and qPCR. The latter was important to confirm the identity of the samples (i.e., by checking the expression of known blastema markers) and rule out possible contamination from postblastema tissue. Marker genes were previously identified that helped to distinguish between blastema (devoid in stem cells) and postblastema [79]. Compared to homeostatic control, piwi1 was downregulated in blastema at both 3 and 6 days of regeneration, while prog1 and Agat1 were upregulated (Figure 1D and Figure S1). These results confirmed that the blastema samples did not contain stem but differentiating cells. Laser-dissected blastema at 3 dpa had a relatively high expression of piwi1, and therefore were kept separated from the mechanically dissected blastema in the downstream analyses (Figure S1). As expected, piwi1 was upregulated in both X1 and X2 samples; in X2 samples both prog1 and Agat1 were also upregulated, since this fraction contains both stem and progeny cells (Figure 1D and Figure S1). In Xin cells, piwi1 and prog1 were downregulated while Agat1 was slightly upregulated (Figure 1D and Figure S1). Irradiated samples showed low or no expression of piwi1 and prog1 at both 3 and 6 days after irradiation; 6 days after irradiation Agat1 was also downregulated (Figure 1D and Figure S1). In SmB RNAi samples, SmB downregulation was confirmed, together with piwi1 and prog1 (Figure 1D and Figure S1).

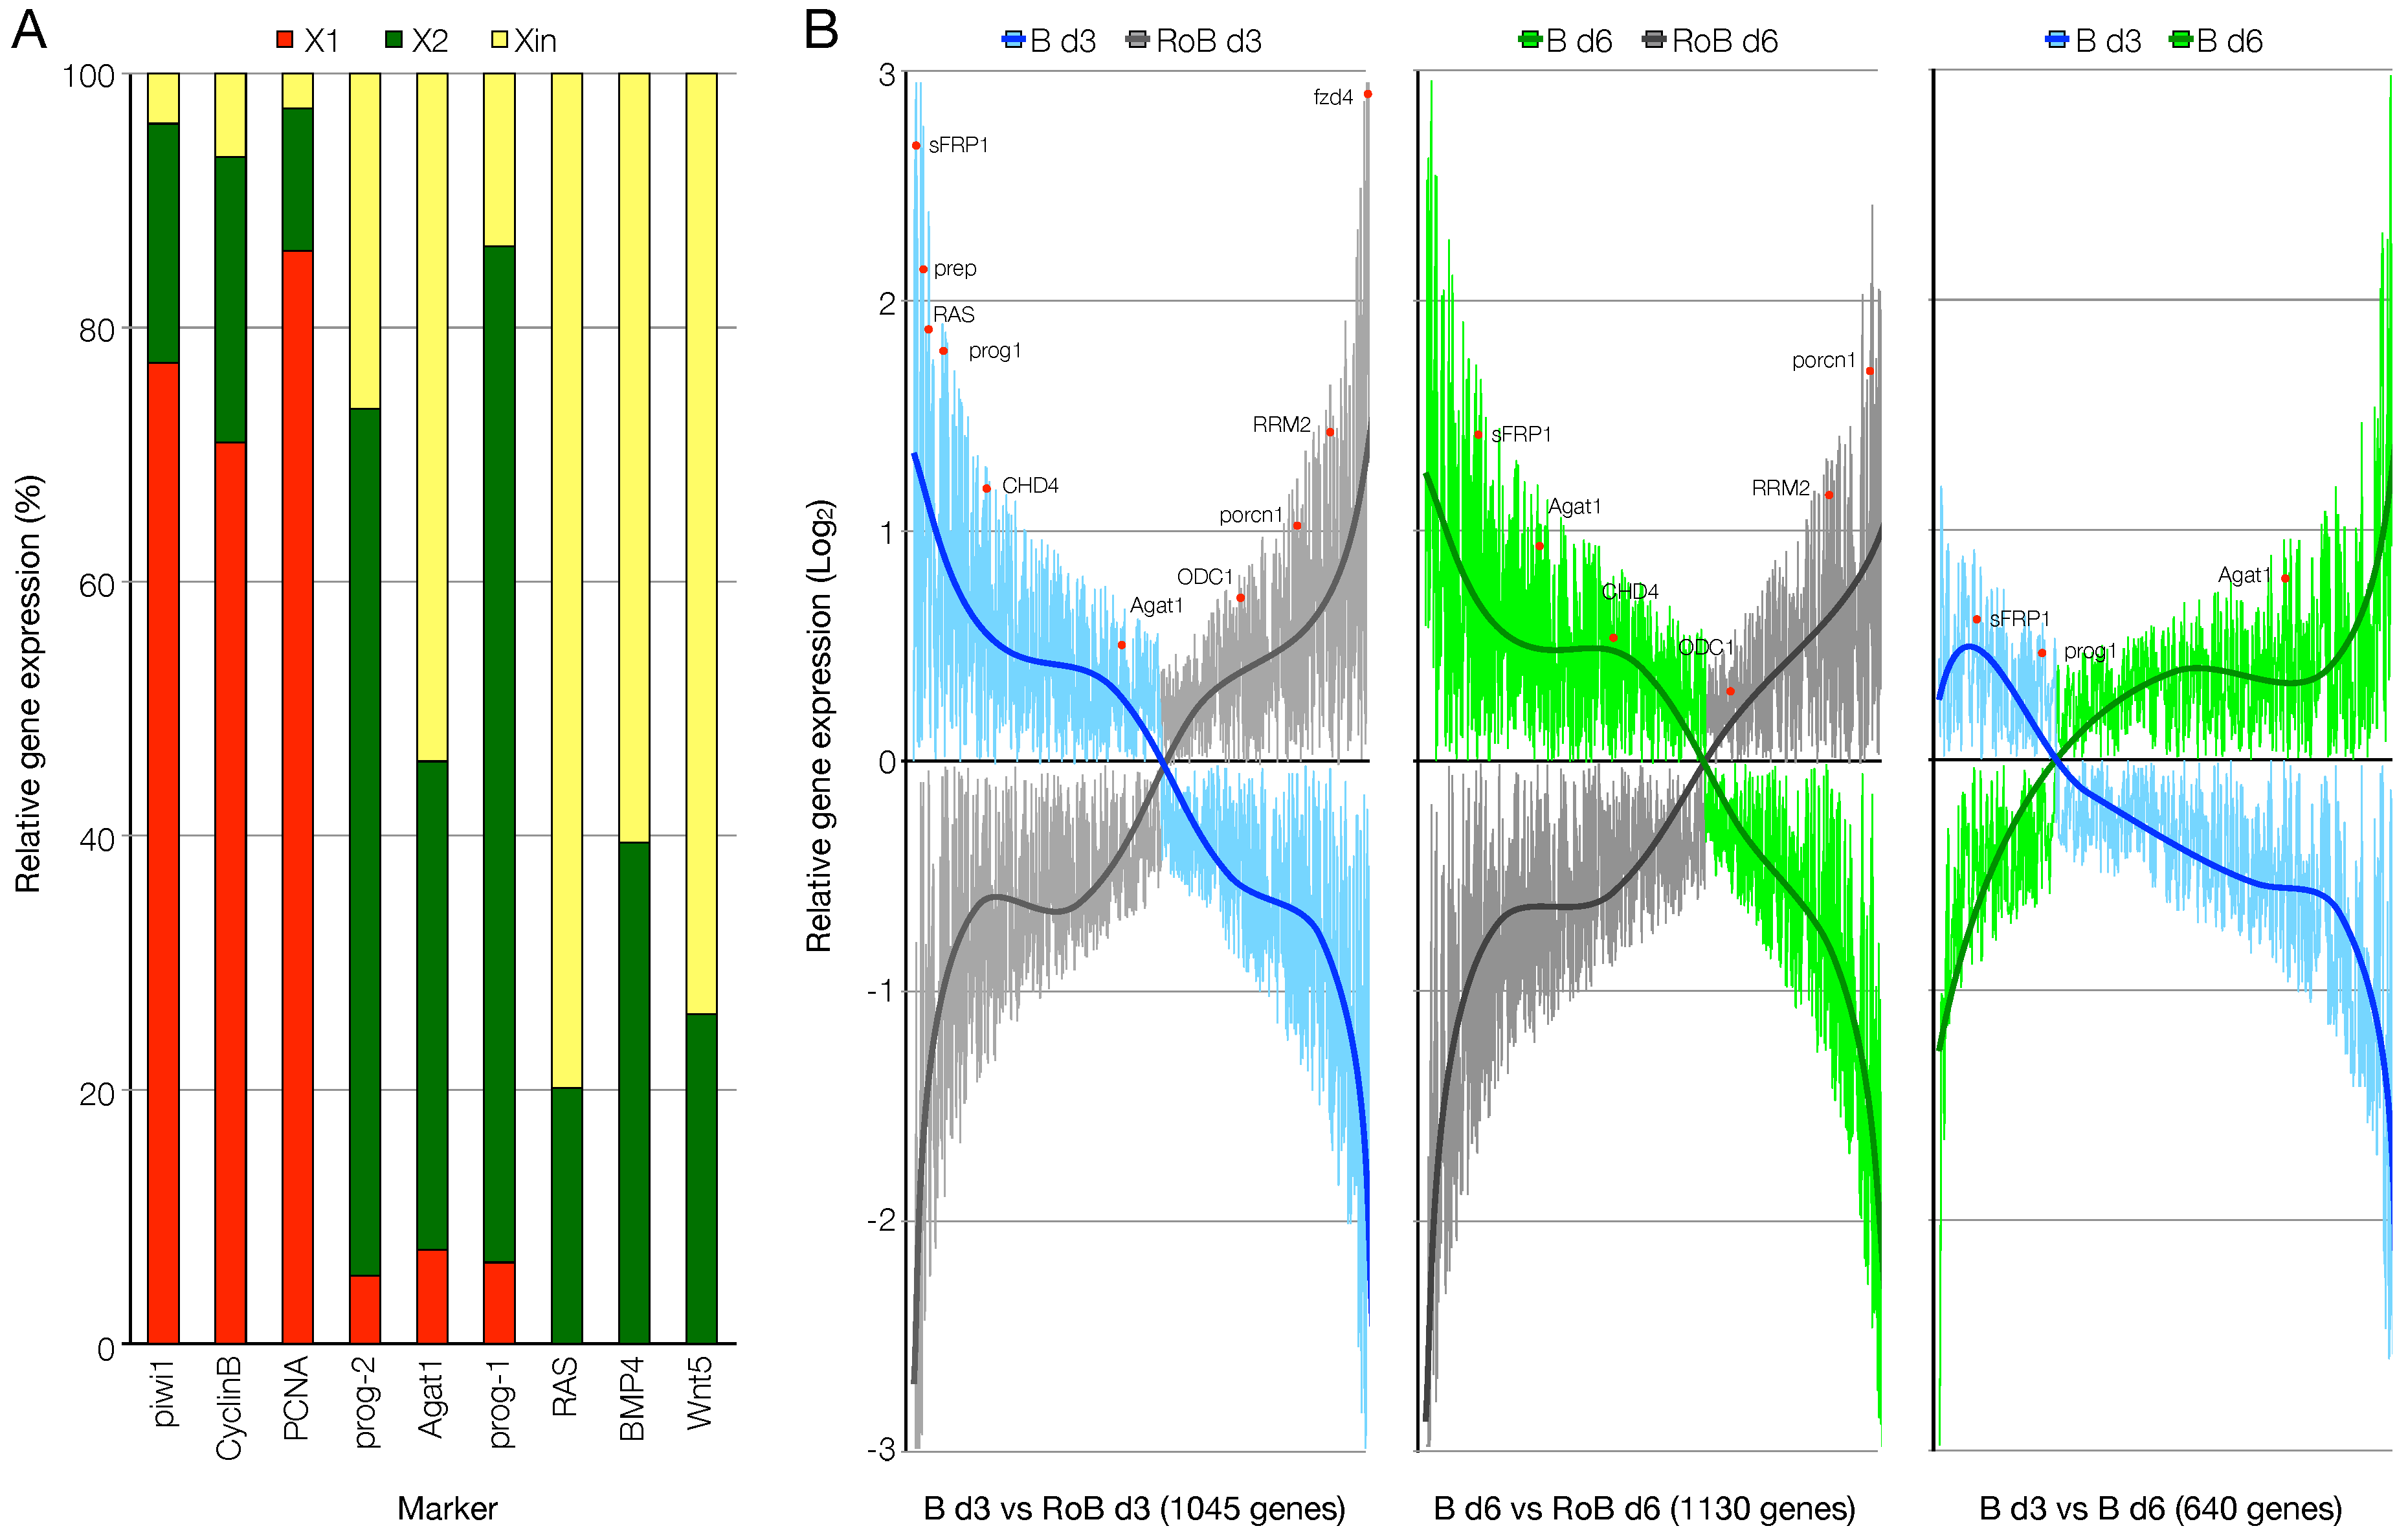
3.2. RNA-Seq Data Quality Check Showed High Quality Scores and Confirmed the Upregulation of Known Markers of Cell Commitment and Differentiation in the Blastema Samples

After quality check, the samples were prepared for sequencing. Since polyA mRNA selection may introduce biases, especially for long transcripts [80], ribosomal RNA depletion was instead performed. In several samples, however, a single round of rRNA depletion was not enough (Figure S2A,B), therefore, a second round of rRNA depletion was performed that depleted rRNA below the level of detection of the Bioanalyzer (Figure S2C). The second round of rRNA depletion effectively reduced the number of reads that mapped onto rRNA sequences (Figure S2D).
After the cDNA library preparation, the barcoded samples were loaded onto 2 independent flow cells on the SOLiD4HT sequencer, where the quality of the RNA-Seq run is assessed in realtime. The distribution of the beads on the flow cells was homogeneous (Figure S3A) and the spectral purity (the separation of the signal in the 4 channels), a function of the intensity of single sequenced templates, was very high (Figure S3B), indicating that most of the beads contained a single cDNA species (monoclonal beads). We also assessed the quality per position along the sequencing reads, using FastQC to generate a box plot (a representative sample is shown in Figure S3C). This confirmed a very good quality, with an above average quality score up to position 39.
As samples with different amount of RNA were multiplexed, we compared the number of reads generated in each individual sample. Interestingly, in each of the two flow cells run, one sample was over-represented (intact_125 sample on FC1, RoB_M_d6_B in FC2 (Figure S4A). However, even in the least represented sample (intact_50) they generated more than 2 million reads, which guaranteed a coverage ≥ 75x. After combining the data from FC1 and FC2, a total of 1,009,885,098 reads were generated, of which only 3.2% were unassigned (Figure S4B). Except for the laser-dissected ones, blastema samples were represented by a minimum of 3,136,913 (Bla_d6_M_B) to a maximum of 45,626,513 (Bla_d3_M_B) reads (Figure S4C). These numbers guaranteed that virtually all transcripts were represented, also those with low level of expression, as transcription factors. We also included spike-in controls in some samples, in order to assess the linear range, for a reliable quantification. All the samples tested showed a broad linear range, spanning between 212 and 216 (Figure S5).
After assessing the good quality of the generated data, we looked for the expression of known marker genes. In total, the expression of 44 selected planarian markers was evaluated, including housekeeping genes, stem cell markers, progenitor markers, and tissue specific markers (Figure S6A,B). Ubiquitous genes were found expressed in all samples, with Gapdh showing a very homogeneous level of expression (Figure S6A). Stem cell-specific markers as piwi1, PCNA, and CyclinB showed high expression in X1 samples (Figure 2A and Figure S6A,B). Progeny markers like prog1 were found highly expressed in X2 samples, while Agat1 was found expressed at similar levels in X2 and Xin cells (Figure 2A). Genes expressed by both stem and progeny cells, like Rb, p53, and CHD4 were found enriched in X1, X2, and B samples (Figure S6B). Genes expressed by differentiated cells, like RAS, BMP4, and Wnt were found enriched in Xin samples (Figure 2A). As expected, the anterior pole marker sFrp1 was found highly expressed in B day3 samples but not in RoB samples tissue (Figure S6A).
We then looked at the expression of known markers among the genes differentially regulated between B and RoB samples (1045 and 1130 genes at day 3 and day 6, respectively), or between B day 3 and B day 6 samples (640 genes). At both 3 and 6 dpa, the expression of post-mitotic progeny markers (prog1, Agat1) was higher in blastema samples, as it was the expression of the anterior identity markers (Prep, sFrp1). On the contrary, the expression of stem cell (RRM2), late progeny (ODC1) or terminally differentiated cell (porcn1) markers was higher in RoB samples (Figure 2B, left and central panels). The comparison between B samples at 3 and 6 dpa confirmed that while the early post-mitotic progeny marker prog1 was enriched at 3 dpa, the late post-mitotic progeny marker Agat1 was enriched at 6 dpa (Figure 2B, right panel).

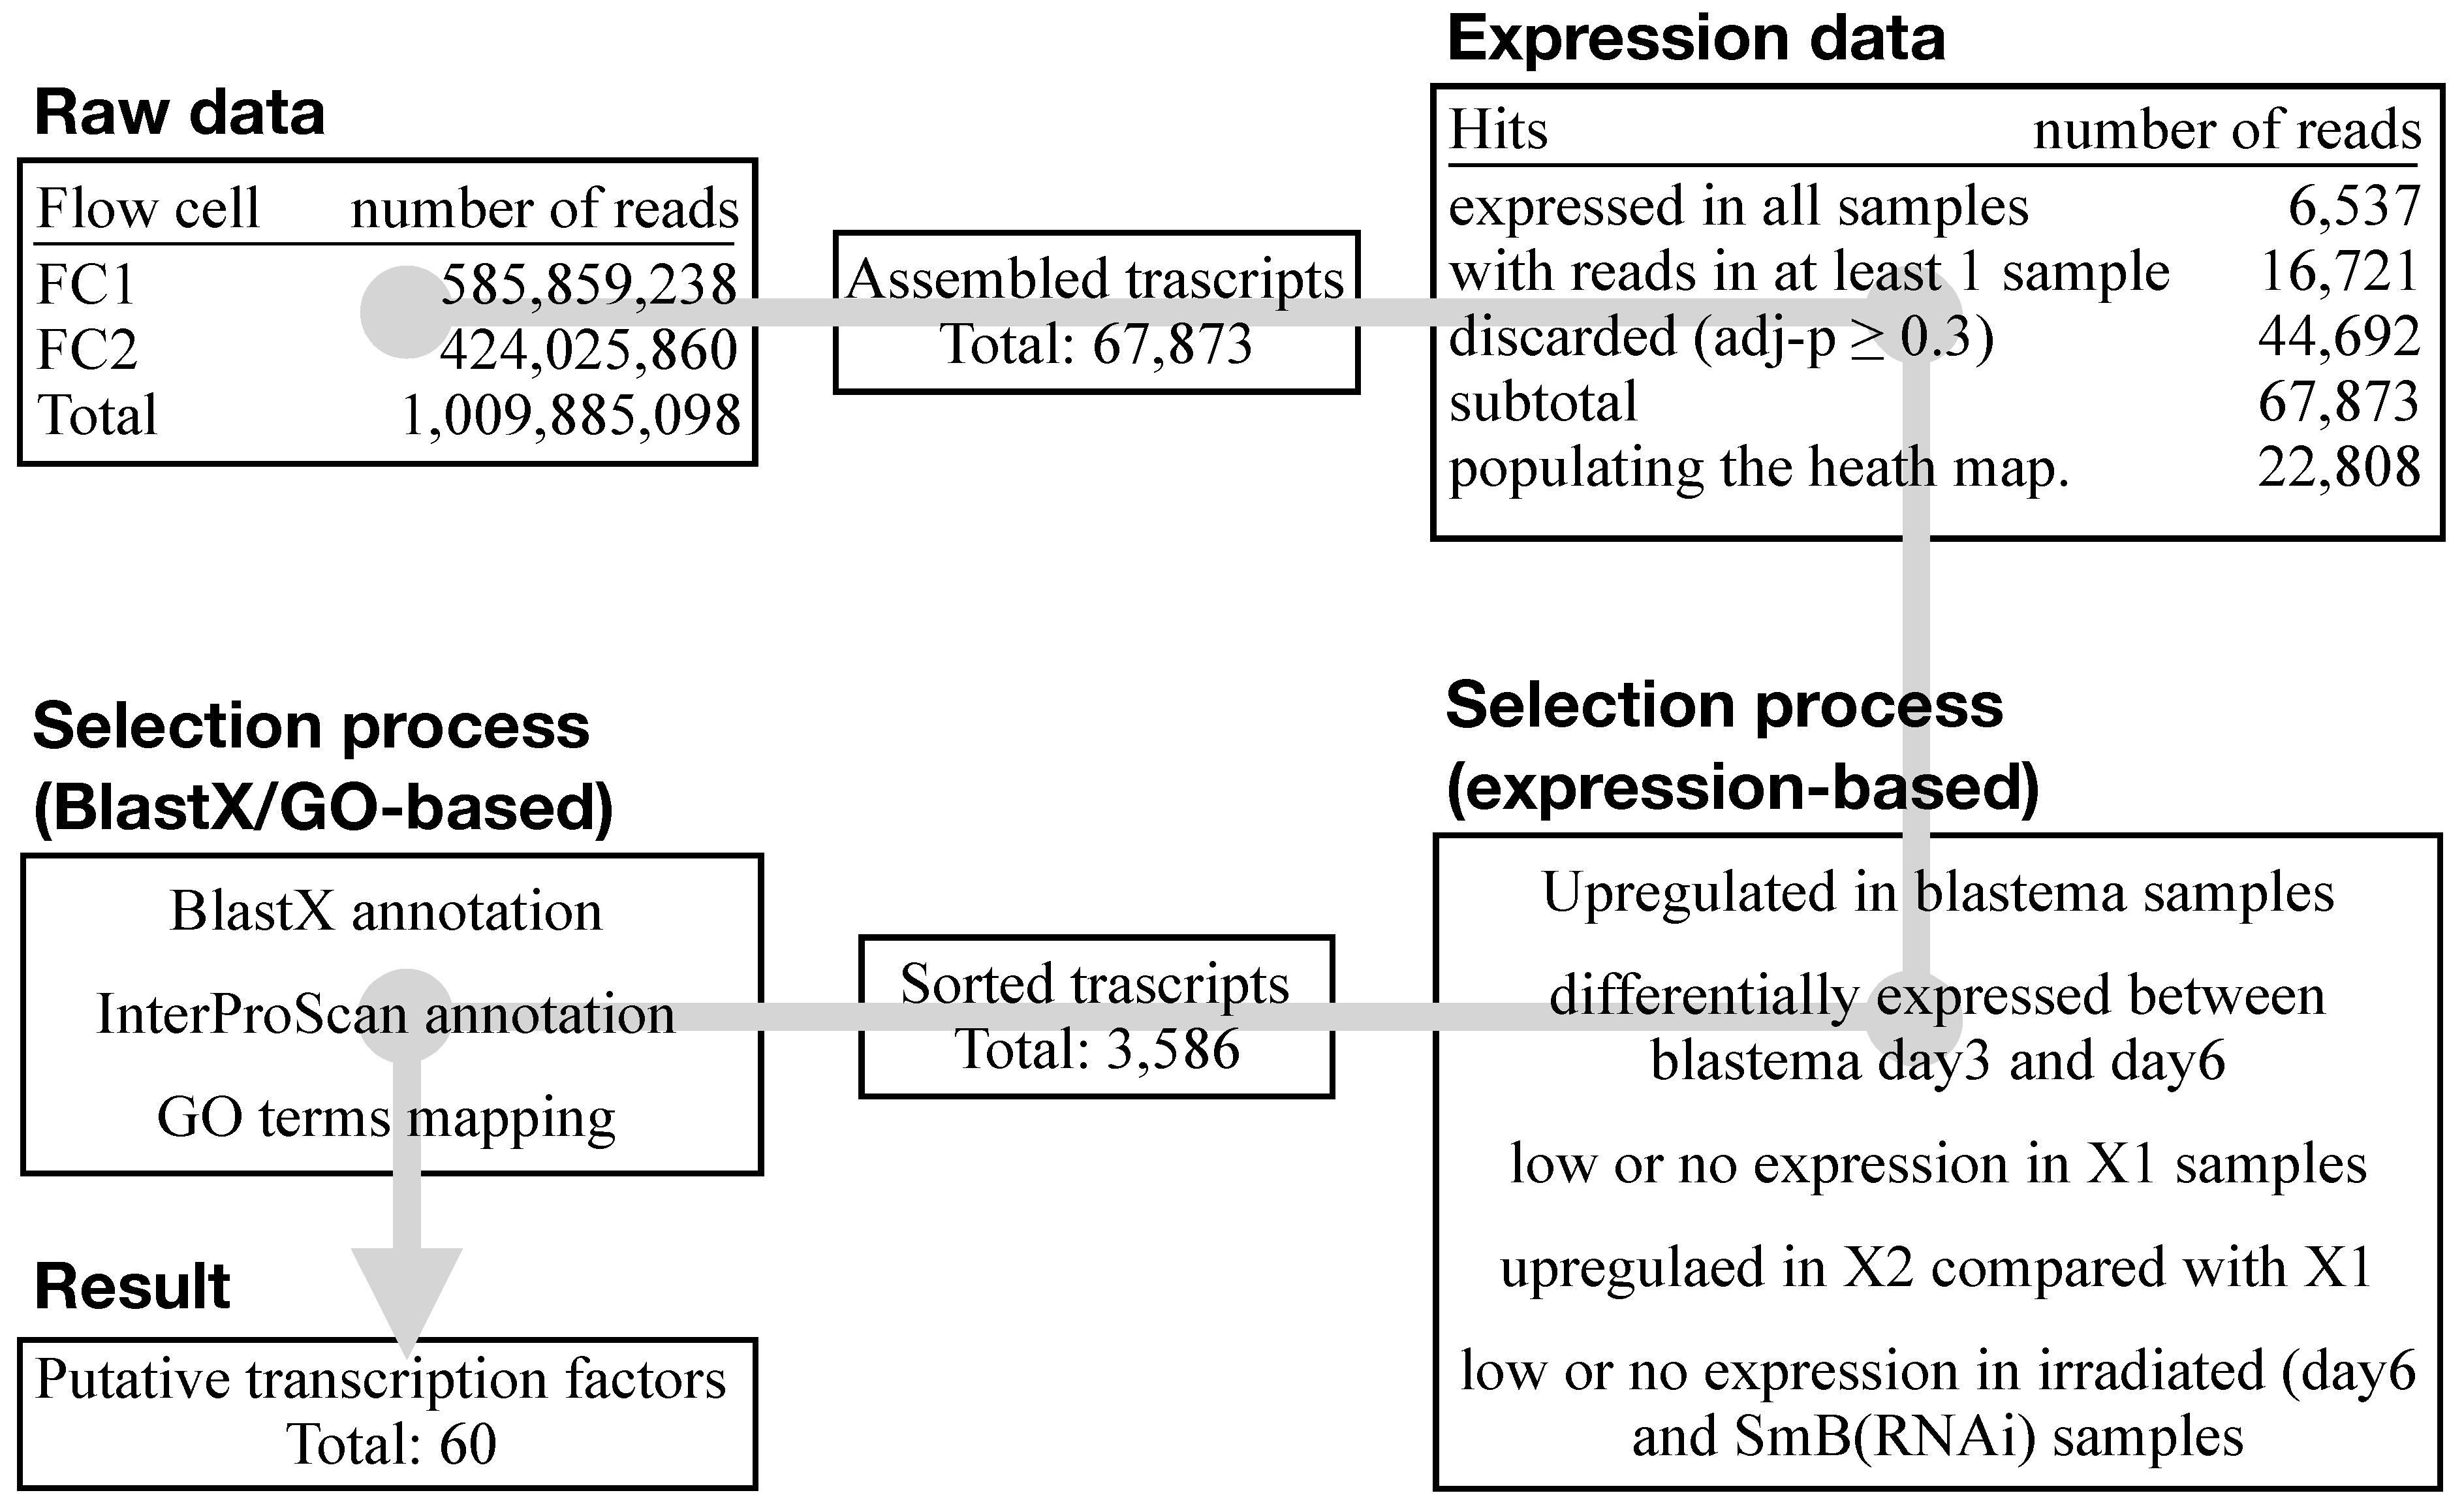
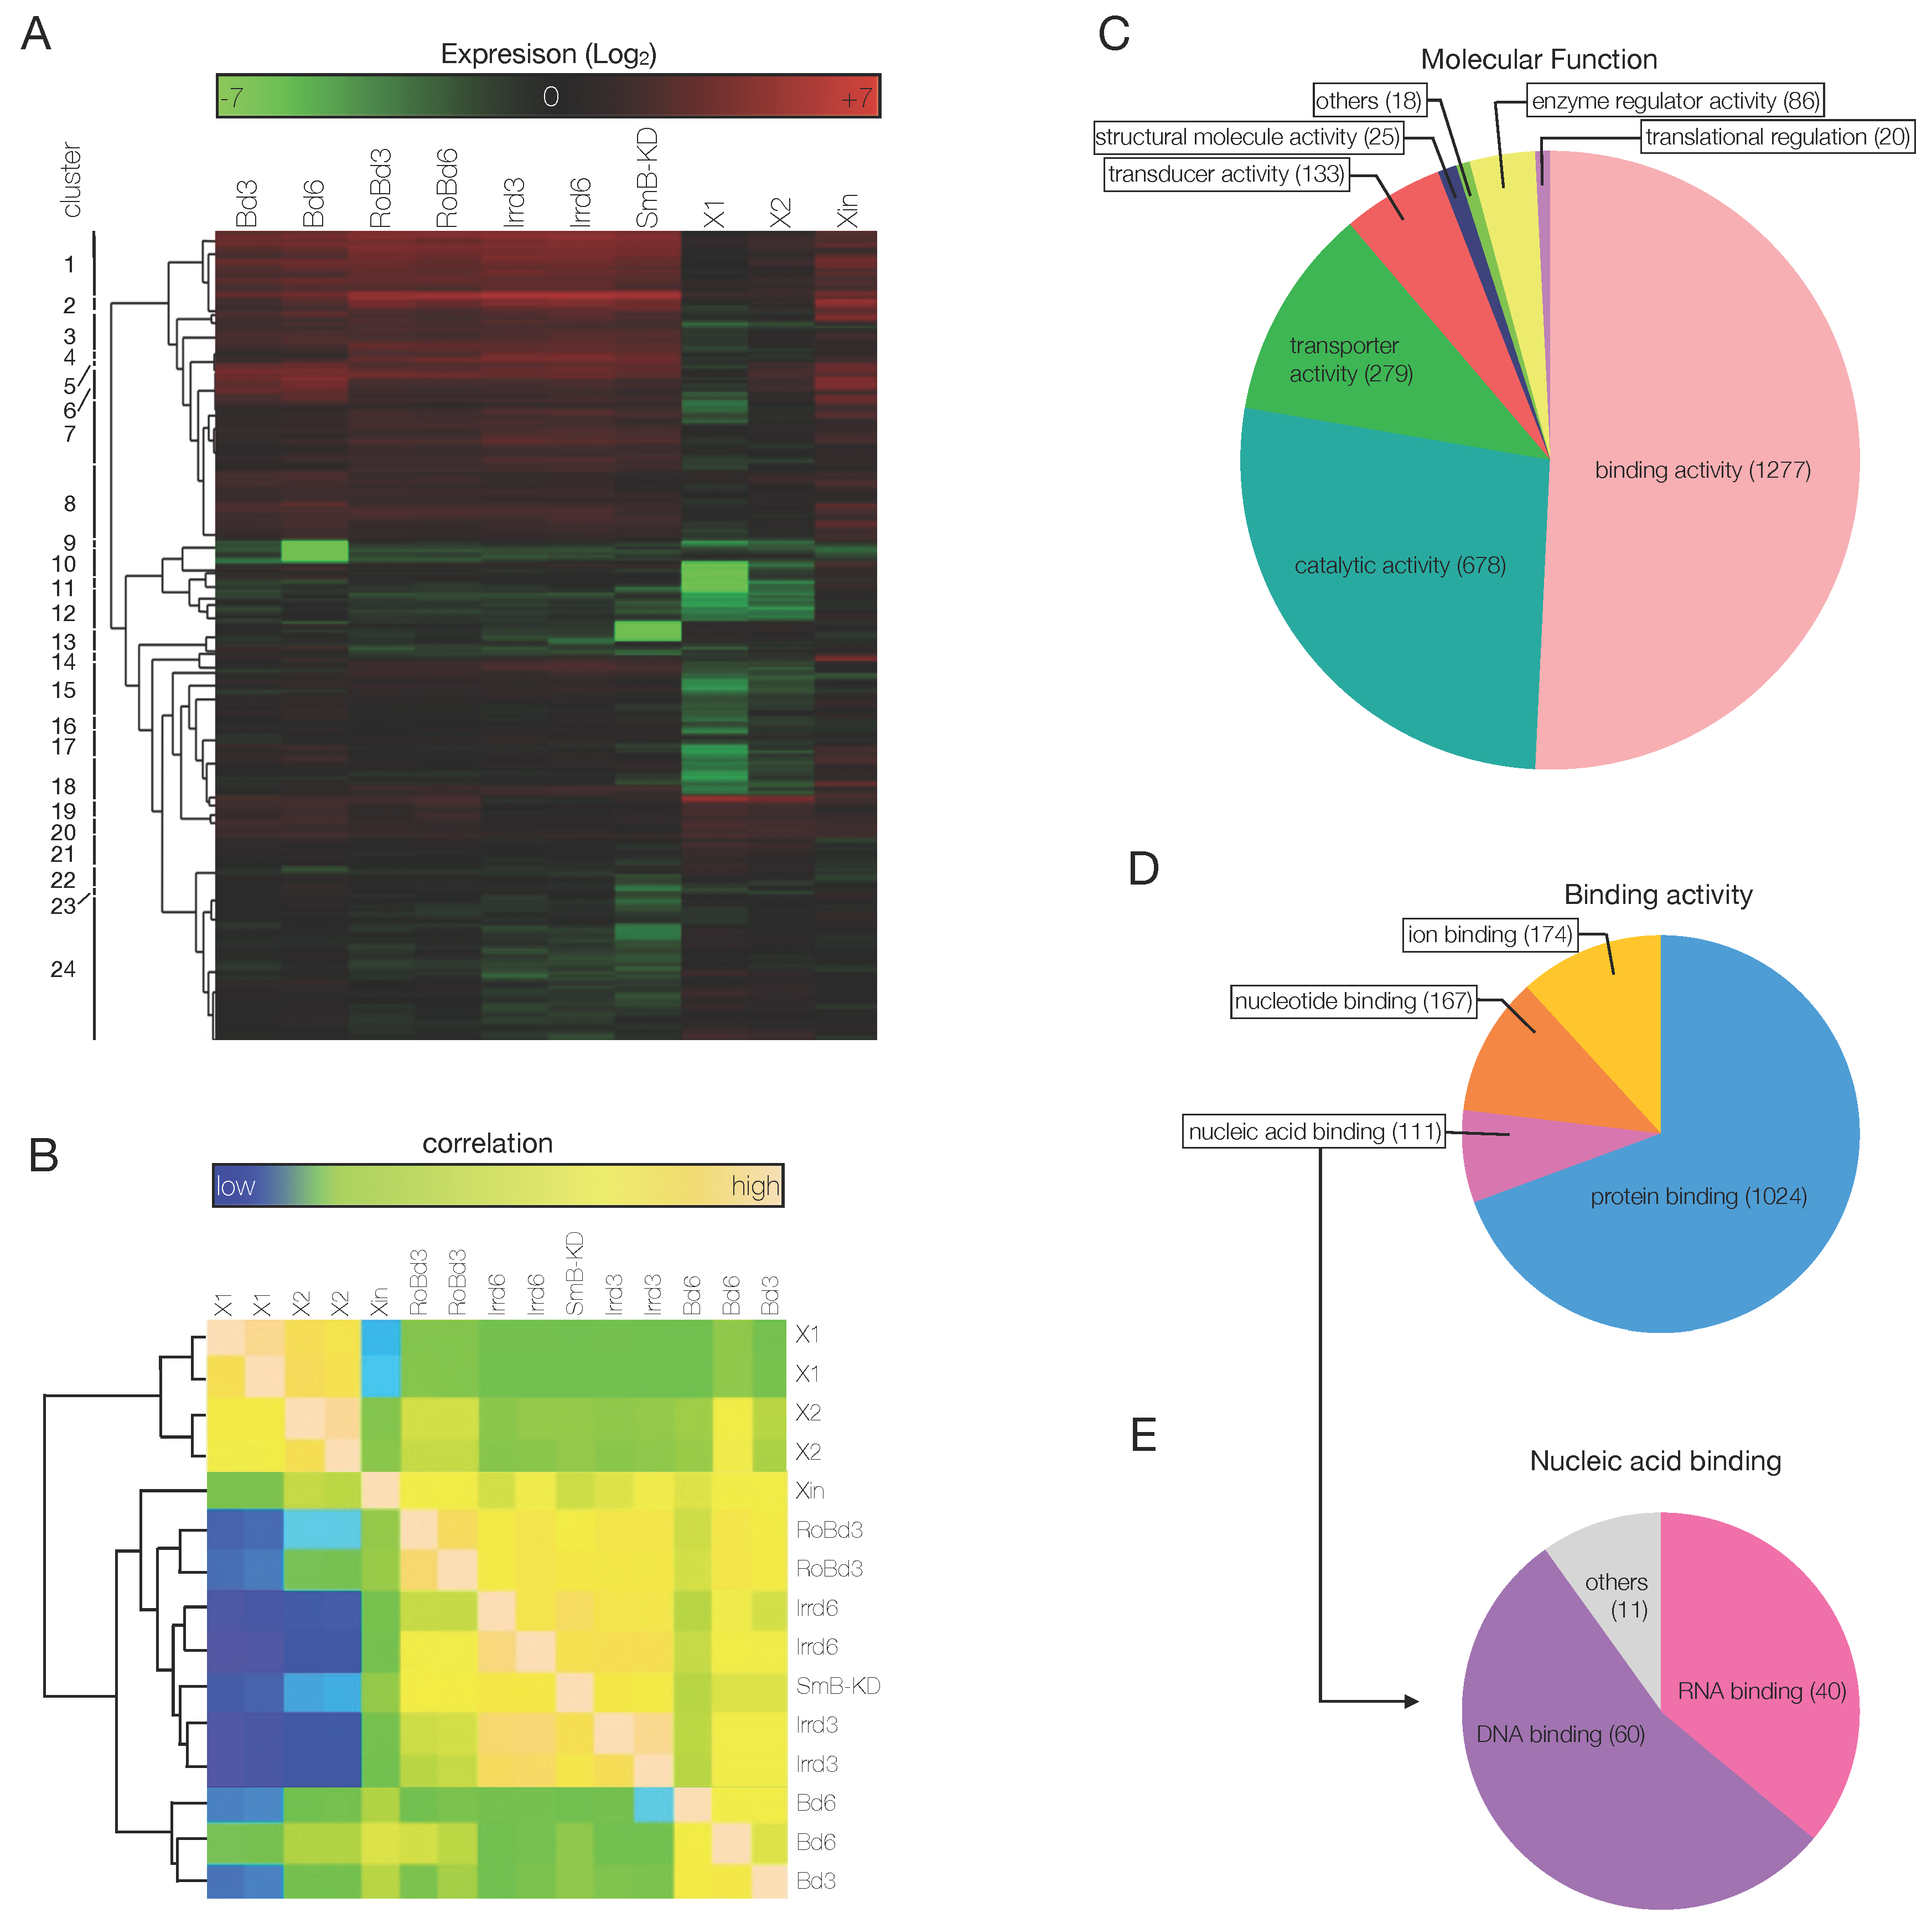
3.3. An Ad Hoc Analysis Pipeline Sorted 65 Putative Transcription Factors Active in the Blastema

At the time the experiments were done, the S. mediterranea genome draft was fragmented and poorly annotated [50]. Therefore, using an in-house generated pipeline of scripts and open-source applications (e.g., Tophat, Bowtie), the SOLiD4HT RNA-Seq data were mapped on a transcriptome generated on 41bp single-end Illumina sequencing data [48]. In total, 1,009,885,098 reads were mapped to the newly generated transcriptome assembly, resulting in 67,873 assembled transcripts (Figure 3). For the comparison of RNA-Seq data among samples, the R/Bioconductor package DESeq was used to normalize read count and variance. Pairwise comparisons were performed with log2 fold changes and adjusted p-value. The data were then sorted based on the number of the read counts and the adjusted p-value in all samples, resulting in a final list of 22,808 transcripts (Figure 3).
Being interested in genes involved in cell differentiation, to shortlist interesting genes efficiently, the 22,808 transcripts were sorted again, by the comparison among the samples. The sorting process consisted in 4 sequential steps. First, transcripts upregulated in blastema samples compared to all other samples were selected. Second, since blastema is devoid of stem cells, only hits with no expression in X1 (or with an expression lower than in X2 and/or Xin) were selected. Third, hits not expressed in SmB(RNAi) fragments (since after amputation of SmB KD animals blastema formation is abolished) and irradiated (day 6) samples were selected. Fourth, genes differentially regulated between B day 3 and day 6 were also sub-clustered. After this expression-based sorting step, a total of 3586 putative transcripts were used to generate a heat map with 24 clusters (Figure 4A). In most of the clusters, genes were upregulated in the blastema samples compared to all other samples; however, in some of them they were downregulated (clusters 10, 12). Clusters 15–18 and 24 contained genes that were both heavily downregulated in X1 and X2 samples and differentially expressed between blastema at 3 and at 6 dpa. Genes in cluster 13 were undetectable in SmB(RNAi) samples, while downregulated but still detectable in irradiated samples (Figure 4A).
The shortlist of genes differentially expressed in the blastema was used to define the correlation among the samples used in the study. According to Pearson’s correlation, two main clusters of samples were individuated, one stem cell-enriched, which included X1 and X2 samples, and one differentiated cell-enriched, which included all other samples (Figure 4B). Within the second block, 2 distinct sub-clusters of samples were further defined: one that included Irradiated, SmB(RNAi), Xin, and RoB samples, and one that included the blastema samples only (Figure 4B). Consistent with the expected cellular composition, the highest correlation was observed between the SC-enriched fractions X1 and X2, consisting of stem, post-mitotic progeny, and small differentiated cells. Xin fraction, irradiated, and SmB(RNAi) samples are communed by the fact that they are all devoid of stem cells. Interestingly, in this correlation based on a restricted number of genes, RoB samples clustered together with the SC-depleted samples. Likely, this owes to the fact that RoB samples are bona fide non regenerating portions of tissue, thus they lack the array of post mitotic progeny cells that are on the contrary abundant in blastema tissues. Following the expression-based sorting of genes that we carried out, the absence of the progeny cells, rather than the relative presence of stem cells, is more determinant to cluster RoB samples together with SC-depleted samples. In a nutshell, the Pearson’s correlation proved that the queries applied to the RNA-Seq data to narrow down the number of differentially expressed genes considered for downstream analysis was successful and the shortlisted genes were strongly related to the molecular events that take place within the blastema.
In order to sort out the transcription factors from the list of 3586 putative genes, another sorting was performed, based on cross-species sequence alignment and on the recognition of conserved gene domains. A cross-species BLASTx analysis was first carried out, in which the nucleotide sequences of the putative transcripts were aligned to a cross-species protein database. After that, InterProScan and Blast2GO were used to classify the genes according to the presence of conserved domains and to predict the protein function, respectively. Eventually, the Blast2GO results were matched against the NCBI database of non-redundant invertebrate protein sequences, to assign the biological process, the molecular function and the cellular component to each one of the shortlisted genes, from the GO database [81]. Following this analysis, 1277 genes (the large majority of the genes for which a match in the aforementioned databases was found) had binding activity, 678 had catalytic activity, 279 had transporter activity, 133 had molecular transducer activity and 86 had enzyme regulator activity (Figure 4C). A second hierarchical classification based on molecular function was carried out for the 1277 genes with binding activity, which returned 1024 genes with protein binding activity, 174 with ion binding activity, 167 with nucleotide binding activity and 111 with nucleic acid binding activity (Figure 4D). Of the latter ones, following a third hierarchical classification based on molecular function, 60 were classified as DNA binding proteins and 40 as RNA binding proteins (Figure 4D). The 60 DNA binding genes were also analyzed for the biological processes they were involved Figure S7A) and for the cellular compartment to which they belong (Figure S7B).
During planarian regeneration, missing tissues are rebuilt by the cells that differentiate within the blastema. Differentiating cells are characterized by a deep cellular remodeling, increased metabolism, and the activation of the so-called developmental genes, which are necessary to leave the pluripotent state for the cell commitment. The most representative biological processes were cellular (44), metabolic (40), biological regulation (33), developmental (23), multicellular organismal (23), biogenesis (18), response to stimulus (18), and signaling (10) (Figure S7A). Unsurprisingly, since a large majority of the genes upregulated in the stem cell fractions were sorted out, the processes related to cell proliferation were under-represented (8) (Figure S7A). It is worth mentioning that one gene could be involved in more than one biological process, which explains why the total number of hits shown in the pie chart in Figure S7A (253) is higher than the number of the putative TFs (60). According to the cellular component annotation, 47 putative TFs localized to the cell, more specifically to organelles (39), macromolecular complexes (15) and membrane enclosed lumen (15) (Figure S7B).
In summary, the two sorting steps —one based on the differential gene expression among the samples used in the study and one based on the molecular functional annotations—produced a shortlist of 60 DNA binding genes. To these 60 candidate transcription factors, 5 additional ones were manually added, which the GO analysis failed to recognize, namely: Ap2, Egr1, and 3 genes of the Traf (TNF receptor-associated factors) family, which possess a zinc finger DNA binding domain as they act as signal transducers and transcriptional regulators.

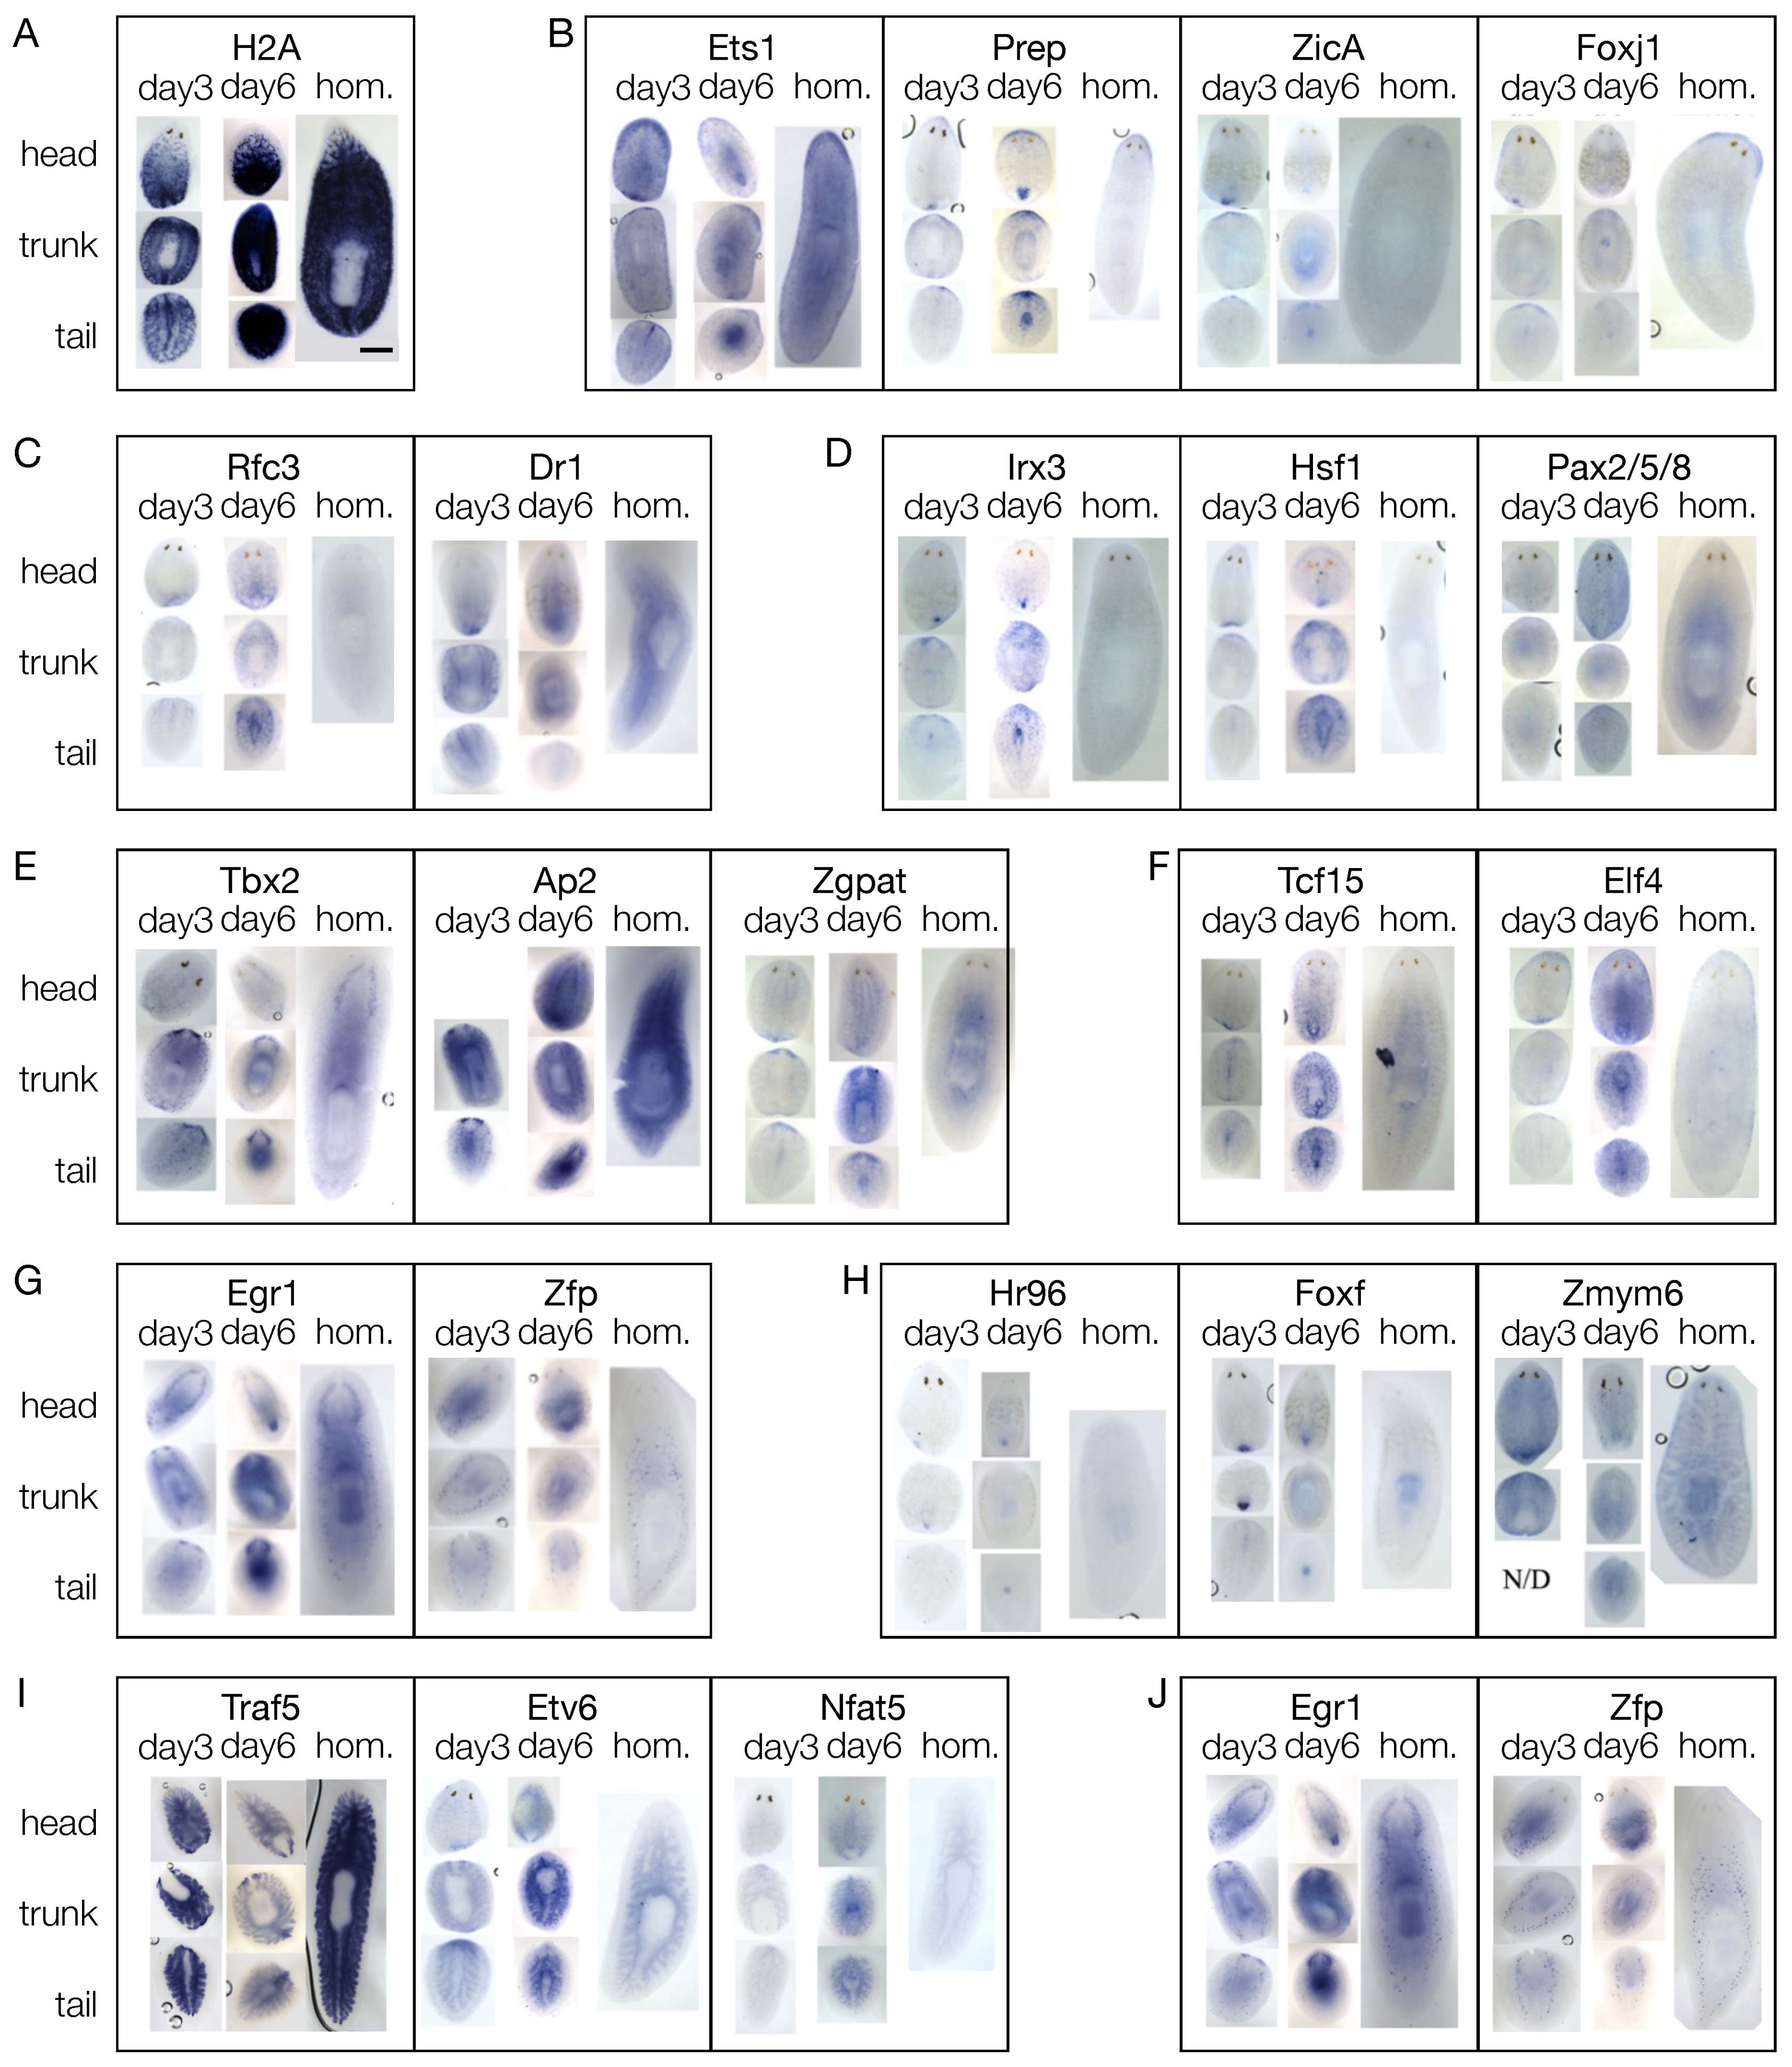
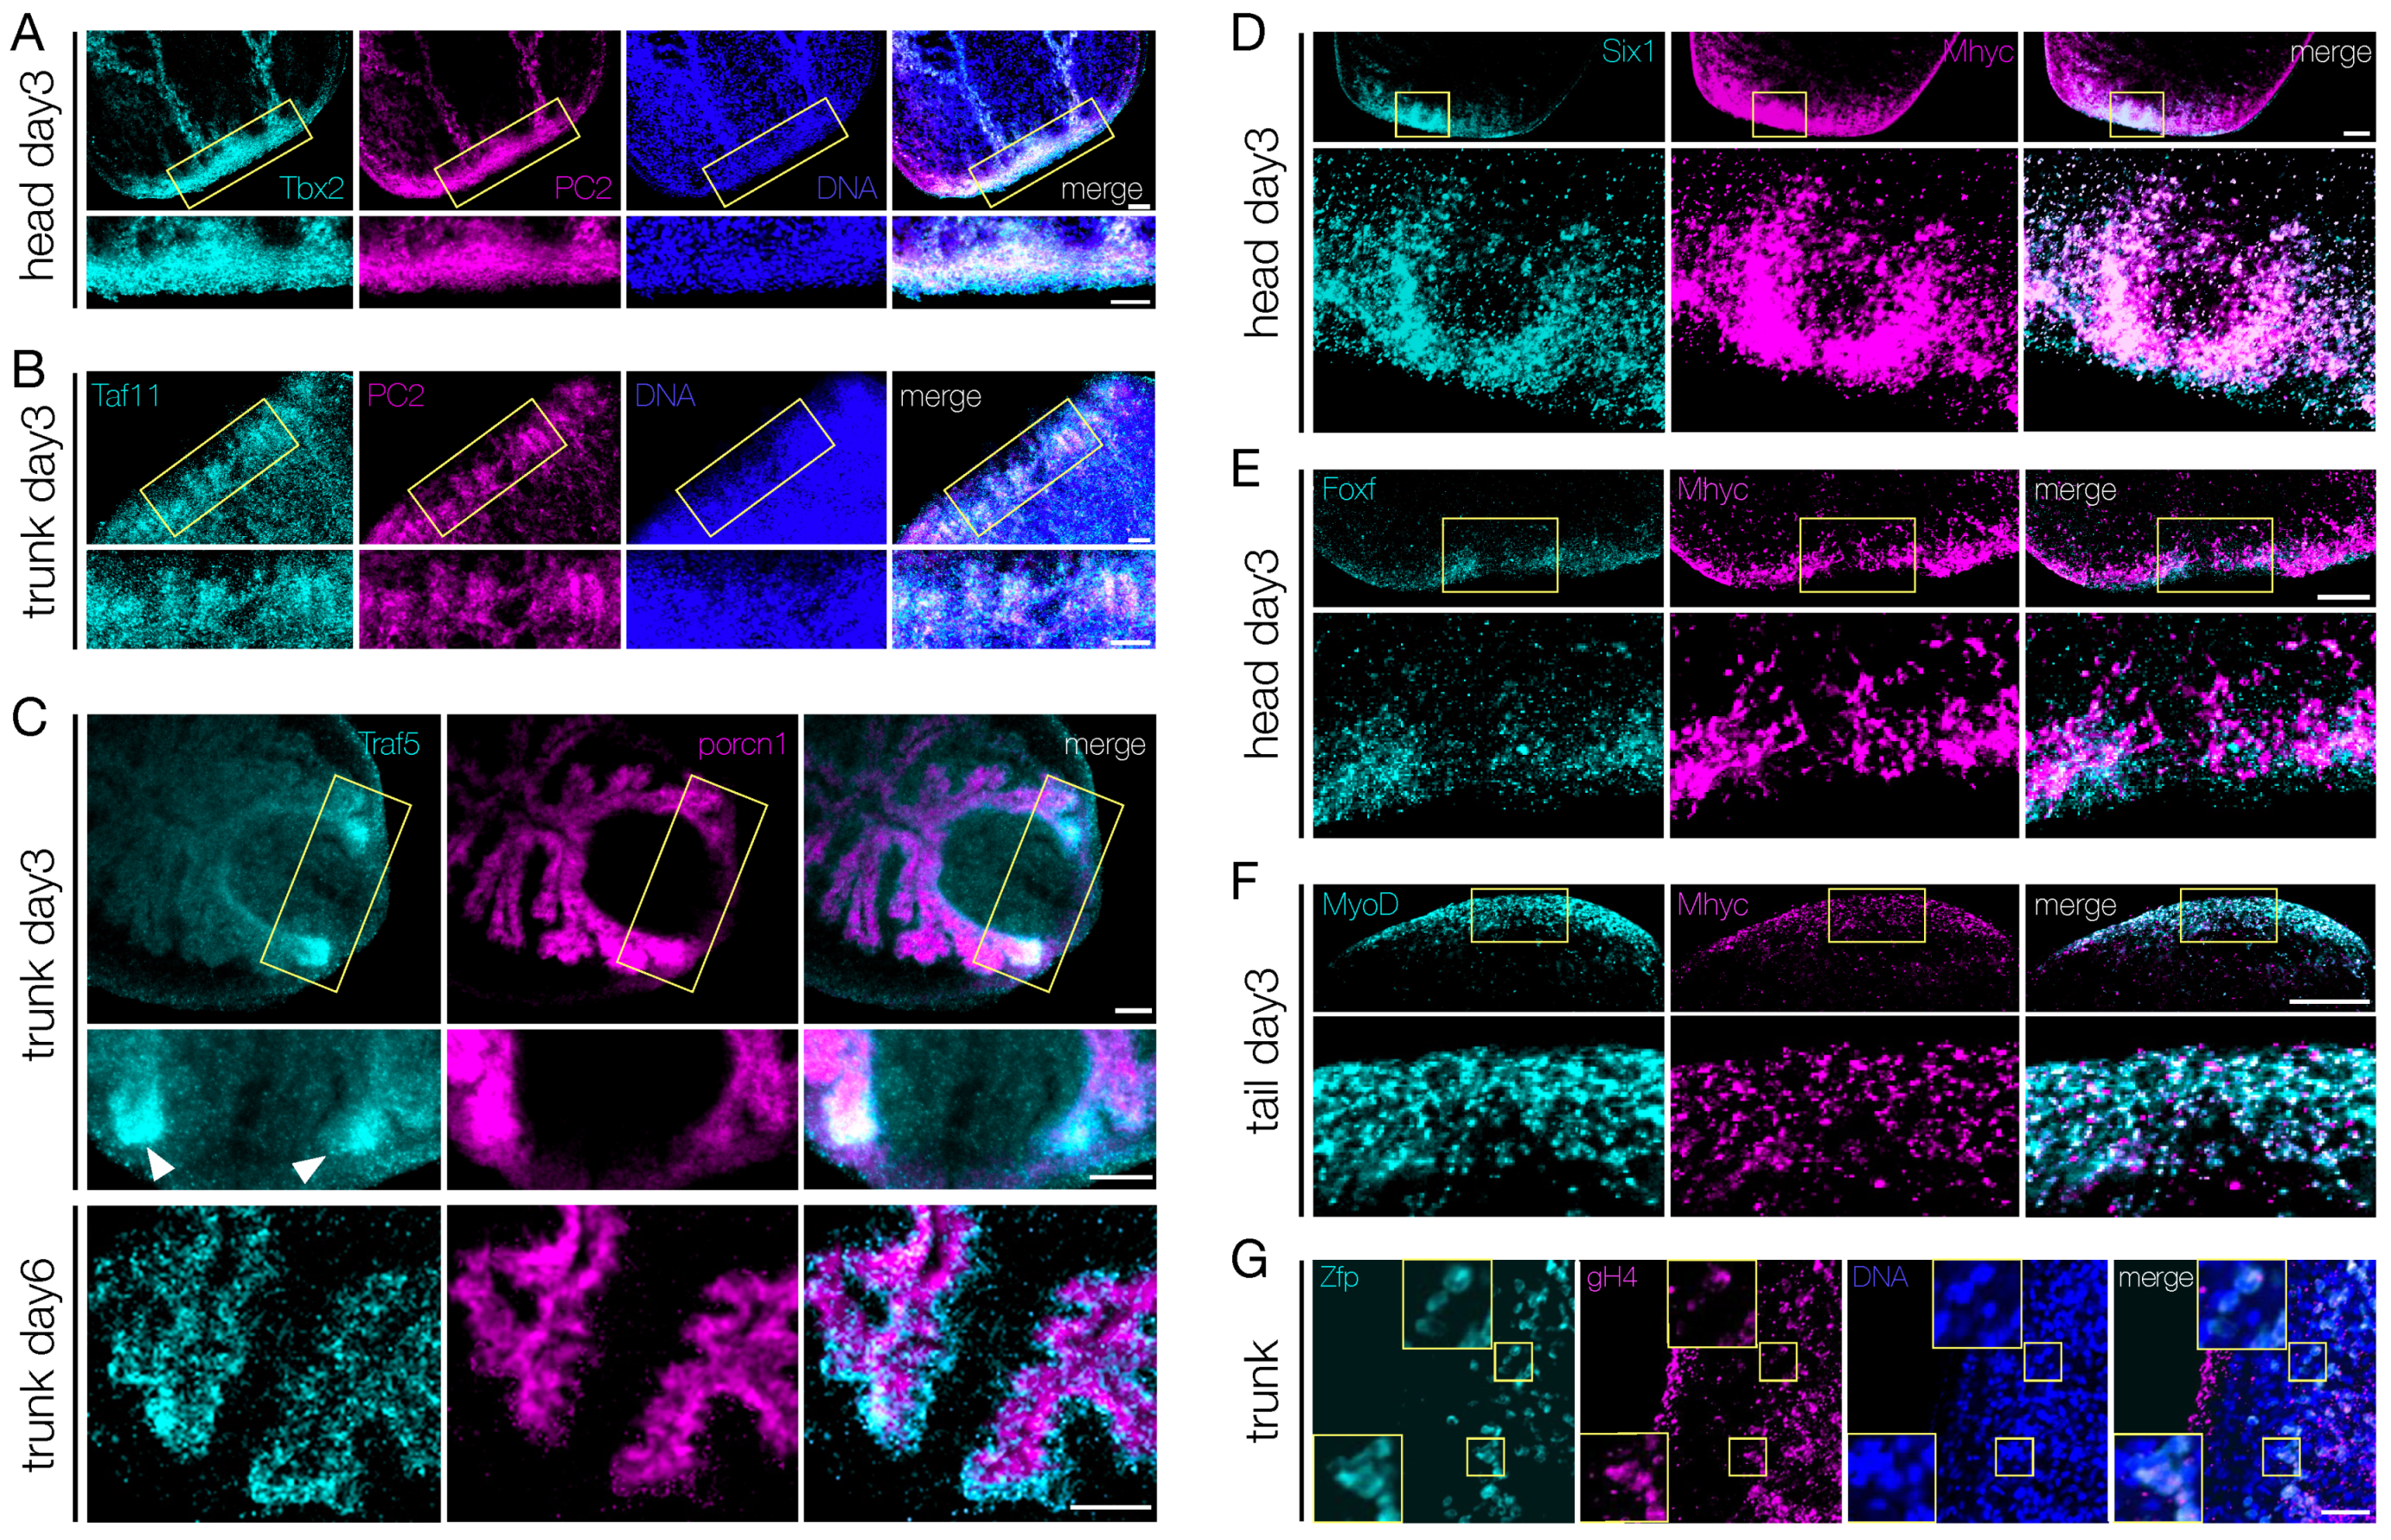
3.4. The mRNAs of 44 Shortlisted Transcription Factors were Found Enriched in the Regenerating Blastema

Based on our RNA-Seq dataset, we identified 65 transcripts predicted to encode for DNA-binding proteins that were enriched in the anterior blastema of regenerating (day 3 and/or day 6) S. mediterranea. These putative transcription factors (Table S4) were named according to their best BLASTX homology hit, as described in the Materials and Methods. Thirteen genes were previously described in S. mediterranea, namely Ap2, MyoD, Ets-1, Isl-1, Traf6, Fli1, Tcf15, Mitfl1, NF-YB, Prep, Fer3l-2 and two FoxJ1. Additionally, ZicA, identified in our RNA-Seq dataset, was previously published [61]. Five candidate genes were described in S. polychroa, 3 in D. japonica (Musashi and Traf3) and 7 in the Schistosoma genus (Figure S8). Musashi (mislabeled as a transcription factor) is expressed in the central nervous system (CNS) of D. japonica and regulates its regeneration [41]. Ap2 and Ets-1 are associated with regeneration initiation upon wound response in S. mediterranea [82]. MyoD is a master switch of myogenesis and is temporally and spatially segregated during S. mediterranea regeneration [29,30]. The LIM-homeobox gene Isl-1 is required for the differentiation of Wnt-expressing cells at the posterior end of S. mediterranea [40]. Tcf15 and the nuclear factor NF-YB are both involved in the regulation of pluripotency in S. mediterranea. [42,43]. Prep defines the anterior compartment during head regeneration [39].
Among the not yet described 44 candidate genes, 3 of them had no actual DNA binding activity, namely: Pcbp3 (RNA-binding proteins), Tufm, and Rnf11 (cytosolic proteins). Of the 41 remaining candidates, 15 were not transcription factors; they are either chromatin-associated proteins (e.g., Histone 2A, Smc2), chromatin remodeling factors (e.g., Dsp1, EP300, Jmjd2), topoisomerase (Top2) or signal transducers (e.g., Traf3, Traf5, Traf6). However, all are involved in the activation or repression of transcription, therefore we considered them as part of the transcriptional regulatory network that controls regeneration in the planarian blastema. Also, 4 genes were redundantly annotated. The details of the GO analysis of all the putative TFs considered in the study are summarized in Table S5. The resulting list of 40 candidate genes were independently validated by means of RT-PCR and WISH.
Since most of the candidate genes were selected based on their higher expression in blastema (either at 3 or 6 dpa) compared to the respective RoB, we expected to find a ratio between the expression of the genes in B and RoB samples >1. Thirty-three out of 40 tested genes and 11 out of 26 tested genes were found upregulated in B samples compared to RoB, at 3 (Figure S9A,B) and 6 (Figure S9C) dpa, respectively. Based on the gene expression, 3 groups of transcription factors were identified among the genes upregulated in the blastema: one with genes upregulated at both 3 and 6 dpa, one with genes upregulated at 3 dpa and neither up- nor downregulated at 6 dpa and one with genes upregulated at 3 dpa and downregulated at 6 dpa. In the first group we found Otp, ZicA, Dr1, Ap2, Prep, Lhx2, Isl-1, Six-1, Irx3, Egr1, and Traf6; in the second group we found Tbx2/3, Hsf1, Nr4a2, and Tbx20; in the third group we found Traf3, Lmx1h, Gata123b, Ets-1, Zfp, MyoD, Traf5, Mitfl1, Rlm1, NF-YB, and Prdm1.
In order to couple gene expression with morphology, we performed WISH against the candidate blastema transcription factors on regenerating fragments at 3 and 6 dpa, and on homeostatic animals (Figure 5 and Figure S10). Except for Prdm1 and Fer3l2, all the genes studied were detected in the blastema, either at 3, 6, or 3 and 6 dpa. Many of them were also found expressed in other tissues, sometimes more than one (e.g., both in the pharynx and in the region anterior to the photoreceptors or both in the CNS and in the testes). As reported for H2b, also H2a showed a stem cell-like pattern (Figure 5A), like that of piwi1 (Figure S10A). Twelve genes were expressed in the region anterior to the photoreceptors, like ZicA, Prep, FoxJ1, and Ets-1 (Figure 5B and Figure S10B). Fifteen genes were expressed along the midline, either dorsally or ventrally, like Dr1 and Rfc3 (Figure 5C and Figure S10C). Ten genes did not show a clear pattern of expression in intact animals, (i.e., they were expressed by dispersed sparse cells) but were upregulated in the blastema of regenerating animals, like Irx3, Hsf1, and Pax2/5/8 (Figure 5D and Figure S10D). Nineteen genes were expressed in the CNS, like Tbx2/3, Ap2, and Zgpat (Figure 5E and Figure S10E). Altogether, 30 genes were expressed either in the mouth, like Tcf15 and Elf4, or in the pharynx, like Egr1 and Zfp or in both mouth and pharynx, like Hr96, FoxF, and Zmym6 (Figure 5F,G and Figure S10F–H). Four genes were expressed in the intestine, like Traf5, Etv6, and Nfat5 (Figure 5H and Figure S10I) and two were expressed in the testes, namely Zfp, and Egr1 (Figure 5I and Figure S10J).
Altogether, WISH data showed that some of the transcription factors are transiently expressed only in the blastema (TF-G1), while others are expressed by both cells in the blastema and cells in non-regenerating tissues (TF-G2). This could suggest that the TF-G1 are expressed by a subset of transient progenitor cells (e.g., Irx3, Rfc3, Pax2/5/8), while the TF-G2 are expressed by both progenitor and differentiated cells of a certain lineage (e.g., Tbx2/3, FoxJ1, ZicA, Traf5, MyoD). However, the TF-G2, which are more numerous, showed a blastema signal that associated to a specific tissue, as in the case of the genes expressed in the CNS (e.g., Tbx2/3, Ap2, Fli1), in the pharynx (e.g., Irx3, EP300, Six-1) or in the intestine (e.g., Traf5, Etv6), while the TF-G1 showed a generic signal in the blastema that was not associated to a specific structure (Figure 6). Therefore, we hypothesized that the TF-G1 regulate genes involved in polarity and patterning, while the TF-G2 regulate tissue differentiation. This hypothesis is further supported by the fact that the TF-G1 were usually found expressed in regions that provide positional instructions, like the midline (e.g., Dr1) and the region anterior to the photoreceptors (e.g., ZicA). As we classified the blastema transcription factors according to their expression pattern, we also speculated about their derivation from a specific germ layer (Figure S11A). To experimentally confirm this, we performed double FISH experiments against markers specific for the three germ layers and the germ line. The tissue-specific markers used were porcupine (porcn1, for endodermal derivation [83]), prohormone convertase 2 (PC2, for neurectodermal derivation [84]), myosin heavy chain (myhc, for mesodermal derivation [85]), and the germinal histone 4 (gH4, for the germ line [86,87,88]).
Of the 44 transcription factors upregulated in the blastema, 19 were expressed in discrete neural populations throughout the CNS, in both homeostatic and regenerating planarians (Figure 5E, Figure S10E). We observed that virtually all the cells positive for Tbx2/3 (Figure 7A), Taf11 (Figure 7B), Tbx20, Ap2, Traf6, and Fli1 (Figure S11B) were also PC2+. Tigd1, Rnf11, and Zfp were also found co-expressed with PC2 (data not shown). Porcn1, expressed by the phagocytic cells in both homeostatic and regenerating intestine [89] is a marker for intestinal cells. Both Traf5 and Etv6 were found expressed mostly in the regenerating intestinal branches (white arrowheads in Figure 7C and Figure S11C). However, Traf5 was not co-expressed with Porcn1, rather Traf5+ cells surrounded porcn1+ cells (Figure 7C, lower panel). In order to analyze the transcription factors expressed in muscle cells, we used myhc as a muscle cell-specific marker. Two different myosin heavy chain (myhc) genes have been identified in freshwater planarians. One is expressed in the muscle fibers of the pharynx, the muscles surrounding the gastro dermis, in a few scattered cells throughout the body-wall, and in some muscle fibers in the mesenchyme at the base of the pharynx, while the other myhc gene is expressed in the sub-epidermal body-wall musculature and in the dorsoventral fibers [30,90,91]. We found that Pcbp3, Irx3, Six-1, Hr96, and FoxF were expressed in the mouth and/or in the pharynx, while MyoD was expressed in sparse cells of the muscle body-wall, in the pharynx and at the edge of the blastema. Regardless of the gene-specific pattern of expression, all the novel transcription factors were found at least partially co-expressed with myhc. Most of the Six-1+ and FoxF+ cells found in the regenerating pharynx of head fragments at 3 dpa also expressed myhc (Figure 7D,E); a similar picture was observed for Pcbp3 and Hr96 in head and trunk posterior blastema at 3 dpa, respectively (Figure S11D, top and middle panels). Virtually all MyoD+ cells within the blastema of a tail fragment at 3 dpa were also positive for myhc; however, some myhc+ cells were MyoD- (Figure 7F). Interestingly, Irx3+ cells at the very edge of the blastema of tail fragments at 3 dpa were not myhc+, although in the rest of the blastema Irx3+ cells were also myhc+ (Figure S11D, bottom panel). Since among the transcription factors enriched in the blastema we found two that were also expressed in the testes (Egr1 and Zfp; Figure 5J), we used gH4 as germ cell marker to corroborate our observation. Zfp was found co-expressed with gH4 in cells located in the dorsal-lateral area, in two stripes running from the neck backwards (Figure 7G). Remarkably, all other gH4+ cells found within the parenchyma (i.e., the stem cells) were Zfp-. A similar result was observed for Egr1 (Figure S11E).
In order to better define the spatial/temporal expression of the genes under investigation and to prove their derivation from the SCs, we looked at the expression of the PIWI1 protein. Owing to the longer turnover of the protein, PIWI1 is found in both stem and progeny cells [82]. Shortly following amputation (18 hpa), the PIWI1+ cells that are found at the wound site are also piwi1+; however, from 48 hpa onwards, PIWI1+ cells found in the blastema are virtually all piwi1-. Immunohistochemistry targeting PIWI1 was performed after double FISH, so that the expression of the blastema TFs could be correlated with both that of tissue-specific markers and that of the PIWI1 protein. We found PIWI+ cells among the Tbx2/3+/PC2+ (Figure S12A, upper panel), MyoD+/myhc+ (Figure S12A, middle panel), Six-1+/myhc+ (Figure S12A, lower panel) and Zfp+/gH4+ (Figure S12B) cells. A similar picture was also found for other blastema TFs (Gata123b, Ap2, Traf6, Fli1, Tigd1, Taf11 and Rnf11, Pcbp3, Irx3, Hr96 and FoxF; data not shown). The co-expression of the blastema TFs with PIWI1 suggests that the blastema TFs are active in SC progeny that is enriched in the blastema and that will contribute to the regeneration of the missing tissues.

3.5. Shortlisted Blastema Transcription Factors Play a Role in Regeneration

Whole mount in situ hybridization and immunohistochemistry data showed that virtually all the blastema TFs shortlisted from our RNA-Seq data are indeed enriched in the blastema (either at 3, 6, or both at 3 and 6 dpa). Also, the data showed that many are co-expressed with markers of differentiated tissues that derive from all the germ layers—including the germline—like PC2, myhc, and gH4. We also found that virtually all the blastema TFs co-express also the PIWI1 protein, suggesting that they are expressed by progeny cells. Next, we aimed to identify the function of 20 TFs in planarian, using dsRNA-mediated RNA interference (RNAi). Animals were injected three times on three consecutive days and then amputated into head, trunk, and tail fragments. The gene knockdown efficiency was assessed via qPCR after 4 or 7 days from the first dsRNA injection (Figure S13A). In most of the cases a reduction of the gene expression greater than 75% was observed. The regeneration process was assessed for macroscopic abnormalities after 7 and 14 dpa. Despite their effective knockdown, 7 out of 20 blastema TFs did not show any evident phenotype, namely Tbx20, Smarcb1, Gata123b, Ets-1, Nr4a2, Traf3, and Traf6 (Figure S13B). The knockdown of the other 13 blastema TFs produced visible phenotypes, like tail regeneration defects (Smad4, Lmx1a, Egr1), reduced blastema (Zfp, Fli1, Tigd1, Six-1), eye regeneration defects (Zfp, MyoD, Isl-1, Tbx2/3), gut regeneration defects (Traf5, Etv6) or a combination thereof (Figure 8A). For some genes, these were previously described (smad4 [92,93]; Fli1 [8], Six-1 [94] (in D. japonica; no phenotype after one round of RNAi), MyoD [95,96]). All these defects could be observed already at 7 dpa. The observed defects were rarely lethal, exceptions being Etv6 and MyoD (the latter only in head fragments) (Figure 8B). More than 70% of Lmx1h(RNAi) and Egr1(RNAi) fragments showed tail regeneration defects (n = 7/9 and n = 17/24, respectively); in most of the cases, this was the asymmetric regeneration of the tail (Figure 8A). The RNAi of Zfp, Fli1, Tigd1 and Six-1 resulted in the formation of a smaller blastema, and a general delay in the regeneration of the missing tissues. However, apart from Tigd1, the KD of thesis genes did not result in permanent regeneration defects, suggesting that the specification/differentiation of the progenitor cells took place in a spatially, but not in a temporally correct fashion. On the contrary, Tidg1(RNAi) animals failed to regenerate the eyes, but showed no other visible morphological defects (Figure 8C). The RNAi of Zfp, expressed in the testes and in sparse cells in the early blastema, resulted in eye defects in more than 90% of the dsRNA-injected animals (n = 21/23). In virtually all Zfp(RNAi) animals, VC-1 immunostaining clearly showed aberrant axonal guidance and multiple times crossed optic chiasma (Figure 8C), as it was also the case after Tbx2/3 KD. This TF is expressed in the whole CNS, and in other animal models its ortholog is known to be involved in the axonal guidance [97]. Interestingly, some TFs with an eye phenotype, like MyoD and Zfp were neither expressed in the eyes, nor in the CNS (at least, not at a detectable level). Certain muscle cells of the body wall, however, are involved in providing positional instruction; therefore, a cell non-autonomous effect like the observed eye phenotype could be the result of defects in the differentiation of the patterning muscle cells. Both Traf5 and Etv6 were expressed in the intestine, especially in the forming branches during regeneration (Figure 5I, Figure 7C and Figure S11C). Their KD resulted in a smaller blastema size, reduced intestinal branching and dorsal lesions (Figure 8A,B), as formerly observed as a consequence of other TFs expressed in the gastrovascular system, like Nkx2.2 [98]. The lack of Traf5+ cells within the gut, suggests that this TF is expressed by pre-migratory intestinal progenitors, rather than terminally differentiated phagocytes, which derive from the stem cells surrounding the gut.
Taken together, these observations indicate that the many of the blastema TFs have a function during regeneration, and their lack of expression results in both cell autonomous (i.e., the stereotypical pattern of visual cells and/or the axonal growth defects) and cell non-autonomous (i.e., the axonal guidance and the general patterning defects) effects, likely depending on the progenitor cells that express them.

4. Discussion

This study aimed to uncover the transcriptional regulatory genes underlying anterior regeneration in the planarian S. mediterranea. To do so, we defined an experimental and analytical setup based on RNA-Seq whose goal was to shortlist transcription factors (TFs) mainly active in the regenerating blastema, either at 3, 6 or both 3 and 6 dpa.
After amputation, planarian stem cells (SCs) start proliferating in the region next to the wound; post-mitotic early SC progeny accumulate between the proliferating SCs and the wound, and a blastema becomes macroscopically visible at the wound site after 48 hpa. Here, the SC progenies differentiate into the missing tissues (Figure 1B). According to single cell RNA-Seq data, we know that planarian SCs is a heterogeneous population where pluripotent SCs (σ-neoblasts) are undistinguishable from multipotent, lineage-committed SCs (γ-, ν-, ζ-, Nb4-, Nb7-neoblasts, possibly more sub-types), unless destructive analysis is performed [33,34,35,36,37,38]. Whether regeneration starts from σ-neoblasts (naïve model), from lineage-committed SCs (specialized-SC model) or a combination of these two, we know that, within the anterior blastema, virtually all the cells, tissues and organs that make the planarian body are specified and differentiated, as all the missing structures regenerate there. Therefore, the anterior blastema should express, in a precise temporally- and spatially-defined way, all the transcriptional regulators that are necessary to generate all the planarian cell types anew.
We decided to analyze blastema at 3 dpa, since at this stage the blastema is largely devoid of proliferating SCs, and at 6 dpa, to add a second time point to the analysis in order to differentiate between early, transiently expressed TFs, (i.e., those regulating early differentiation of the SC progenies) and tissue-specific TFs.

4.1. The Sampling Strategy and the Ad Hoc Defined Analytical Pipeline Effectively Shortlisted Blastema TFs

A previous effort aimed to identify key regulators of head and tail regeneration in planarians was made [57], where the whole anterior and posterior regenerating fragments were used. In this work, we wanted to shortlist transcriptional regulators that are enriched in the anterior blastema. Therefore, alongside with blastema samples, we collected and sequenced several non-regenerating samples, including stem cell enriched (e.g., X1 cell population), progeny-enriched (e.g., X2 cell population) stem cell -depleted (Xin cell population, SmB(RNAi) planarians), and stem cell- and progeny-depleted (e.g., irradiated planarians) samples. Also, thanks to the pre-RNA-Seq validation, we could confirm that the individually dissected blastema were not contaminated with postblastema tissue (i.e., with proliferating SCs), by means of qPCR. In order to include earlier regeneration time-points, we also tried laser micro-dissection. Although the preliminary expression profile of the fixed, laser-dissected blastema were similar to the manually dissected ones, the primary analysis of sequencing data returned a much smaller number of reads, possibly biased owing to the nonlinear amplification. For this reason, we presented the data from the laser-dissected blastema, but did not include them in the analysis.

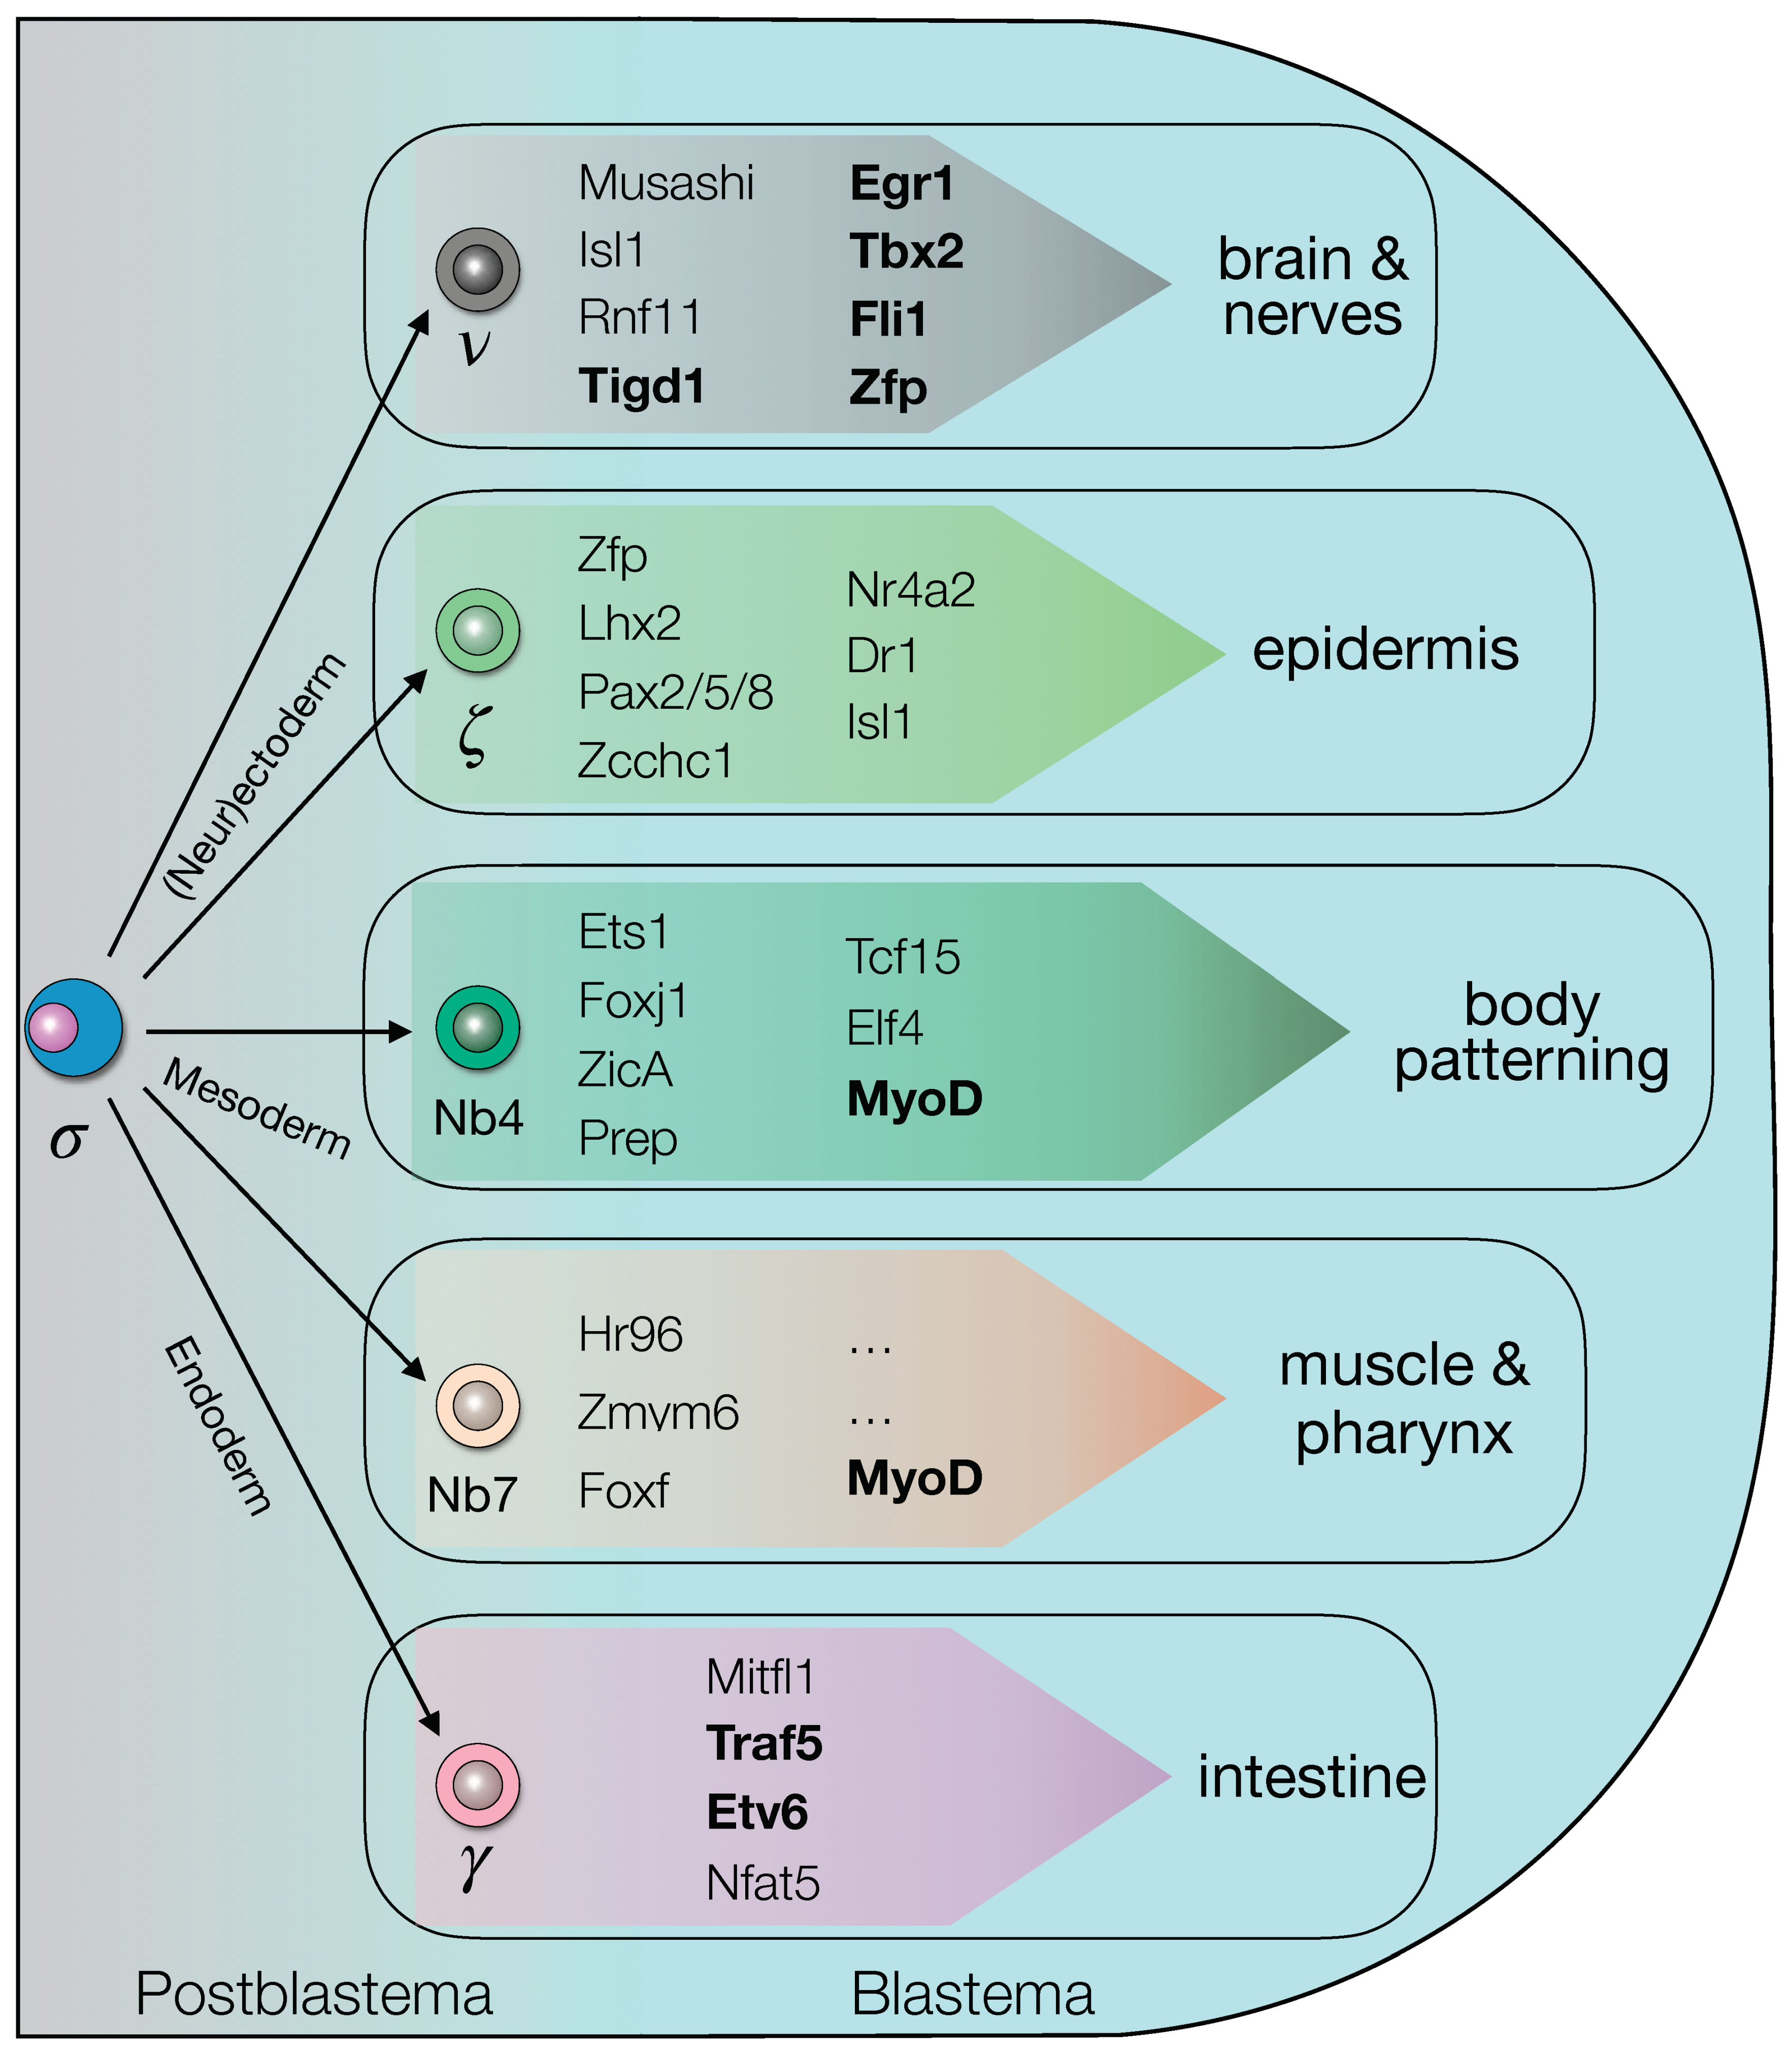
4.2. The Blastema TFs Are Active in the Specification and Differentiation of the Regenerating Structures, including the Cells Responsible for Body Patterning and Positional Instruction

Among the shortlisted blastema TFs we found 13 that were previously described as TFs involved in the differentiation of cells with specialized functions. Some of these, like, FoxJ1, Fli1, Mitfl1, NF-YB, and Ap2 are involved in the maintenance or differentiation of tissue-specific cells [8,45,99,100,101]. Others, like Isl-1, ZicA, Prep, and MyoD are expressed by subsets of cells and are responsible of providing positional information for the correct body patterning [39,40,61,100]. In the same way, many of the blastema TFs are expressed in a tissue-specific fashion.
For example, both Etv6 and Traf5 are expressed in the intestine (Figure 5I, Figure 7C and Figure S11C), and their KD produced defects associated with the failure to regenerate the intestine. Interestingly, Traf5 is not expressed by phagocytes, but in the external lining of the intestine, where SC differentiate in gut progenitor cells before entering the gastrovascular layer [25]. Therefore, it is possible that Traf5 is expressed by the gut progenitor cells, which failed to terminally differentiate, and accumulate outside the intestine, instead of migrating inside it.
Tbx2/3 is expressed in the CNS, both in the brain and in the ventral nerve cords, and where the pharynx connects with the intestine, but not in the eyes or the eye primordia (Figure 5E). During regeneration, intense Tbx2/3 signal is visible in the anterior blastema (Figure 5E and Figure 7A). Tbx2/3(RNAi) animals showed eye regeneration defects. Tbx2b is known as regulating axonal extension posteriorly to the optic chiasm and towards the visual center of the brain in Zebrafish [97]. Schmidtea mediterranea Tbx2/3 could also be involved in the axonal guidance of the visual neurons, and this could explain the different degrees of eye regeneration defects that we observed after its KD.
As we saw for previously described blastema TFs, a subset of the newly characterized blastema TFs are not expressed solely in one tissue (Figure 5, Figure 6 and Figure S10). Rather, they are more broadly expressed, suggesting that these TFs are involved either in the differentiation of multiple cell types or in the differentiation of non-tissue-specific cells, like those of the anterior organizer [61,102] or the muscle cells that provide positional instructions [29]. Therefore, it was not surprisingly that some of the blastema TFs, once knocked-down, were found to produce a cell non-autonomous phenotype.
A tissue-specific TF known to give cell non-autonomous phenotype is MyoD. Being involved in the differentiation of muscle cells that provides positional instruction to other cells, MyoD(RNAi) animals showed a smaller blastema, delays in regeneration patterning problems, as eye defects (Figure 8C), and death (Figure 8B). Another blastema TF that we selected for loss of function study was Zfp. Zfp is expressed in the testes (Figure 5G) but also in the blastema, by some sparse cells at 3 dpa (Figure 6). Zfp(RNAi) animals showed eye defects like aberrant axonal guidance and multiple times crossed optic chiasma (Figure 8C). We could not exclude its expression in eye precursors cells, as reported for ovo [14] and nanos, which shares with Zfp the expression in the testes [103]. In that case, the eye phenotype observed after Zfp(RNAi) could be a direct consequence of its reduced expression. However, differently to both nanos and sine oculis, Zfp is not expressed in any of the cells of the photoreceptors, and it is therefore possible that the eye phenotype was an indirect consequence of the disruption of patterning signaling.
However, it is also possible that the eye phenotypes observed after the KD of blastema TFs that are not expressed in the eyes could also owe to the fact that the downregulation of one cell specific transcription factor disrupts, in part or completely, the whole blastema transcriptional network, and this could prevent the transcriptional regulation of one or more TFs in the downstream cascade. This could eventually result in defects in the regeneration of tissues and organs where the KD TF is not actually expressed.
The finding that a number of the blastema TFs described are expressed in more than one tissue suggests a certain plasticity of the progenitor cells, that may retain the expression of a TF needed for a certain cell type even when their pathway leads towards another one, as shown in the case of the hematopoietic cells in human [104] and also postulated for planarians [105].
Taken together our data indicate that the process of differentiation within the blastema, an essential step for the completion of regeneration, is regulated by a complex network of TFs, seemingly interdependent (Figure 9). The blastema TFs found in this study are involved in this process and could be useful tools to study early stage of planarian regeneration. To understand the microenvironment called niche surrounding stem cell differentiation and regeneration, collecting blastema tissue could give the advantage to uncover how tissue regeneration occurs in blastema tissue by intrinsic and extrinsic mechanisms. Understanding the mechanism of planarian regeneration, especially how stem cells differentiate into progenitors during regeneration, could improve pluripotency-based approaches for regenerative medicine.

Supplementary Materials

The following are available online at https://www.mdpi.com/article/10.3390/biom11121782/s1, Figure S1: RNA-seq samples quality check via qPCR of all replicates used in the study. Figure S2: Effectivity of two rounds of rRNA depletion and distribution of reads mapping on rRNA sequences after RNA-seq. Figure S3: RNA-seq data quality check. Figure S4: Sample-wise RNA-seq reads distribution in the two flow cells used in this study. Figure S5: Analysis of the spike-in control added to the samples run in FC1. Figure S6: RNA-seq data relative to planarian genes for which a pattern of expression is known. Figure S7: Additional gene ontology (GO) annotations. Figure S8: Species distribution of 65 candidates. Figure S9: The expression of 40 transcription factor/transcriptional regulator genes found enriched in blastema samples. Figure S10: Expression of the shortlisted putative transcription factors in fragments at either day 3 or 6 of regeneration and in homeostatic animals, as for WISH. Figure S11: The blastema transcription factors are co-expressed with markers of cells from either neurectoderm, mesoderm, endoderm or the germ line. Figure S12: The blastema transcription factors are co-expressed with the PIWI1 protein. Figure S13: dsRNA-mediated RNA interference of the blastema TFs. Table S1: Oligonucleotides used for RT-PCR and RT-qPCR. Table S2: Oligonucleotides used for the synthesis of the riboprobes. Table S3: List of samples used for RNA-seq. Table S4: Top Blastx hits of the shortlisted candidates. Table S5: GO analysis of the shortlisted, putative TFs.

Author Contributions

Conceptualization, L.G., Y.S.-H., S.M.; methodology, L.G., Y.S.-H., S.M., H.S.; software, D.E.; validation, Y.S.-H., H.S., C.B., C.O., M.S.; formal analysis, Y.S.-H., D.E., L.G.; data curation, Y.S.-H., L.G.; writing—original draft Preparation, Y.S.-H., L.G.; writing—review and editing, Y.S.-H., L.G.; project administration, L.G.; funding acquisition, L.G. All authors have read and agreed to the published version of the manuscript.

Funding

This research was funded by internal and external funding. Y.S-H., H.S., C.O., and L.G. were internally supported by the Max Planck Institute for Molecular Biomedicine; L.G. was funded by DAAD (grant n. 50753940); Y.S-H. was supported by the CEDAD/IMPRS PhD program.

Institutional Review Board Statement

Not applicable.

Informed Consent Statement

Not applicable.

Data Availability Statement

All data presented in this study are available upon request.

Acknowledgments

The authors would like to thank Kerstin Bartscherer for the critical feedback and Hans Schöler for the financial support and for the critical feedback. The authors also thank Stefanie Pavelka for technical support and Suthira Owlarn and Yuvia A Perez-Rico for bioinformatics assistance.

Conflicts of Interest

The authors declare no conflict of interest. The funders had no role in the design of the study; in the collection, analyses, or interpretation of data; in the writing of the manuscript, or in the decision to publish the results.

References

  1. Cebria, F. Regenerating the central nervous system: How easy for planarians! Dev. Genes Evol. 2007, 217, 733–748. [Google Scholar] [CrossRef] [PubMed]
  2. Agata, K.; Umesono, Y. Brain regeneration from pluripotent stem cells in planarian. Philos. Trans. R Soc. Lond. B Biol. Sci. 2008, 363, 2071–2078. [Google Scholar] [CrossRef] [PubMed] [Green Version]
  3. Shibata, N.; Hayashi, T.; Fukumura, R.; Fujii, J.; Kudome-Takamatsu, T.; Nishimura, O.; Sano, S.; Son, F.; Suzuki, N.; Araki, R.; et al. Comprehensive gene expression analyses in pluripotent stem cells of a planarian, Dugesia japonica. Int. J. Dev. Biol. 2012, 56, 93–102. [Google Scholar] [CrossRef] [Green Version]
  4. Currie, K.W.; Pearson, B.J. Transcription factors lhx1/5-1 and pitx are required for the maintenance and regeneration of serotonergic neurons in planarians. Development 2013, 140, 3577–3588. [Google Scholar] [CrossRef] [Green Version]
  5. Marz, M.; Seebeck, F.; Bartscherer, K. A Pitx transcription factor controls the establishment and maintenance of the serotonergic lineage in planarians. Development 2013, 140, 4499–4509. [Google Scholar] [CrossRef] [PubMed] [Green Version]
  6. Cowles, M.W.; Omuro, K.C.; Stanley, B.N.; Quintanilla, C.G.; Zayas, R.M. COE loss-of-function analysis reveals a genetic program underlying maintenance and regeneration of the nervous system in planarians. PLoS Genet. 2014, 10, e1004746. [Google Scholar] [CrossRef] [Green Version]
  7. Currie, K.W.; Molinaro, A.M.; Pearson, B.J. Neuronal sources of hedgehog modulate neurogenesis in the adult planarian brain. eLife 2016, 5, e19735. [Google Scholar] [CrossRef] [Green Version]
  8. Roberts-Galbraith, R.H.; Brubacher, J.L.; Newmark, P.A. A functional genomics screen in planarians reveals regulators of whole-brain regeneration. eLife 2016, 5, e17002. [Google Scholar] [CrossRef]
  9. Wang, I.E.; Lapan, S.W.; Scimone, M.L.; Clandinin, T.R.; Reddien, P.W. Hedgehog signaling regulates gene expression in planarian glia. eLife 2016, 5, e16996. [Google Scholar] [CrossRef] [PubMed]
  10. Karge, A.; Bonar, N.A.; Wood, S.; Petersen, C.P. tec-1 kinase negatively regulates regenerative neurogenesis in planarians. eLife 2020, 9, e47293. [Google Scholar] [CrossRef] [PubMed]
  11. Lapan, S.W.; Reddien, P.W. dlx and sp6-9 Control optic cup regeneration in a prototypic eye. PLoS Genet. 2011, 7, e1002226. [Google Scholar] [CrossRef] [PubMed] [Green Version]
  12. Yamamoto, H.; Agata, K. Optic chiasm formation in planarian I: Cooperative netrin- and robo-mediated signals are required for the early stage of optic chiasm formation. Dev. Growth Differ. 2011, 53, 300–311. [Google Scholar] [CrossRef]
  13. Gonzalez-Sastre, A.; Molina, M.D.; Salo, E. Inhibitory Smads and bone morphogenetic protein (BMP) modulate anterior photoreceptor cell number during planarian eye regeneration. Int. J. Dev. Biol. 2012, 56, 155–163. [Google Scholar] [CrossRef] [PubMed] [Green Version]
  14. Lapan, S.W.; Reddien, P.W. Transcriptome analysis of the planarian eye identifies ovo as a specific regulator of eye regeneration. Cell Rep. 2012, 2, 294–307. [Google Scholar] [CrossRef] [PubMed] [Green Version]
  15. Chen, C.C.; Wang, I.E.; Reddien, P.W. pbx is required for pole and eye regeneration in planarians. Development 2013, 140, 719–729. [Google Scholar] [CrossRef] [Green Version]
  16. LoCascio, S.A.; Lapan, S.W.; Reddien, P.W. Eye Absence Does Not Regulate Planarian Stem Cells during Eye Regeneration. Dev. Cell 2017, 40, 381–391.e383. [Google Scholar] [CrossRef] [Green Version]
  17. Atabay, K.D.; LoCascio, S.A.; de Hoog, T.; Reddien, P.W. Self-organization and progenitor targeting generate stable patterns in planarian regeneration. Science 2018, 360, 404–409. [Google Scholar] [CrossRef] [PubMed] [Green Version]
  18. Emili, E.; Esteve Pallares, M.; Romero, R.; Cebria, F. Smed-egfr-4 is required for planarian eye regeneration. Int. J. Dev. Biol. 2019, 63, 9–15. [Google Scholar] [CrossRef] [PubMed] [Green Version]
  19. Sarkar, A.; Mukundan, N.; Sowndarya, S.; Dubey, V.K.; Babu, R.; Lakshmanan, V.; Rangiah, K.; Panicker, M.M.; Palakodeti, D.; Subramanian, S.P.; et al. Serotonin is essential for eye regeneration in planaria Schmidtea mediterranea. FEBS Lett. 2019, 593, 3198–3209. [Google Scholar] [CrossRef]
  20. Scimone, M.L.; Atabay, K.D.; Fincher, C.T.; Bonneau, A.R.; Li, D.J.; Reddien, P.W. Muscle and neuronal guidepost-like cells facilitate planarian visual system regeneration. Science 2020, 368, 3203. [Google Scholar] [CrossRef]
  21. Reddien, P.W. Principles of regeneration revealed by the planarian eye. Curr. Opin. Cell Biol. 2021, 73, 19–25. [Google Scholar] [CrossRef] [PubMed]
  22. Rink, J.C.; Vu, H.T.; Sanchez Alvarado, A. The maintenance and regeneration of the planarian excretory system are regulated by EGFR signaling. Development 2011, 138, 3769–3780. [Google Scholar] [CrossRef] [PubMed] [Green Version]
  23. Scimone, M.L.; Srivastava, M.; Bell, G.W.; Reddien, P.W. A regulatory program for excretory system regeneration in planarians. Development 2011, 138, 4387–4398. [Google Scholar] [CrossRef] [PubMed] [Green Version]
  24. Thi-Kim Vu, H.; Rink, J.C.; McKinney, S.A.; McClain, M.; Lakshmanaperumal, N.; Alexander, R.; Sanchez Alvarado, A. Stem cells and fluid flow drive cyst formation in an invertebrate excretory organ. eLife 2015, 4, e07405. [Google Scholar] [CrossRef] [PubMed]
  25. Forsthoefel, D.J.; Park, A.E.; Newmark, P.A. Stem cell-based growth, regeneration, and remodeling of the planarian intestine. Dev. Biol. 2011, 356, 445–459. [Google Scholar] [CrossRef] [PubMed] [Green Version]
  26. Flores, N.M.; Oviedo, N.J.; Sage, J. Essential role for the planarian intestinal GATA transcription factor in stem cells and regeneration. Dev. Biol. 2016, 418, 179–188. [Google Scholar] [CrossRef] [PubMed] [Green Version]
  27. Gonzalez-Sastre, A.; De Sousa, N.; Adell, T.; Salo, E. The pioneer factor Smed-gata456-1 is required for gut cell differentiation and maintenance in planarians. Int. J. Dev. Biol. 2017, 61, 53–63. [Google Scholar] [CrossRef] [PubMed] [Green Version]
  28. Forsthoefel, D.J.; Cejda, N.I.; Khan, U.W.; Newmark, P.A. Cell-type diversity and regionalized gene expression in the planarian intestine. eLife 2020, 9, e52613. [Google Scholar] [CrossRef] [PubMed]
  29. Witchley, J.N.; Mayer, M.; Wagner, D.E.; Owen, J.H.; Reddien, P.W. Muscle cells provide instructions for planarian regeneration. Cell Rep. 2013, 4, 633–641. [Google Scholar] [CrossRef] [Green Version]
  30. Cebria, F. Planarian Body-Wall Muscle: Regeneration and Function beyond a Simple Skeletal Support. Front. Cell Dev. Biol. 2016, 4, 8. [Google Scholar] [CrossRef] [Green Version]
  31. Adler, C.E.; Sanchez Alvarado, A. PHRED-1 is a divergent neurexin-1 homolog that organizes muscle fibers and patterns organs during regeneration. Dev. Biol. 2017, 427, 165–175. [Google Scholar] [CrossRef]
  32. Moritz, S.; Stockle, F.; Ortmeier, C.; Schmitz, H.; Rodriguez-Esteban, G.; Key, G.; Gentile, L. Heterogeneity of planarian stem cells in the S/G2/M phase. Int. J. Dev. Biol. 2012, 56, 117–125. [Google Scholar] [CrossRef] [Green Version]
  33. van Wolfswinkel, J.C.; Wagner, D.E.; Reddien, P.W. Single-cell analysis reveals functionally distinct classes within the planarian stem cell compartment. Cell Stem Cell 2014, 15, 326–339. [Google Scholar] [CrossRef] [Green Version]
  34. Molinaro, A.M.; Pearson, B.J. In silico lineage tracing through single cell transcriptomics identifies a neural stem cell population in planarians. Genome Biol. 2016, 17, 87. [Google Scholar] [CrossRef] [PubMed] [Green Version]
  35. Wurtzel, O.; Oderberg, I.M.; Reddien, P.W. Planarian Epidermal Stem Cells Respond to Positional Cues to Promote Cell-Type Diversity. Dev. Cell 2017, 40, 491–504.e495. [Google Scholar] [CrossRef] [PubMed] [Green Version]
  36. Zeng, A.; Li, H.; Guo, L.; Gao, X.; McKinney, S.; Wang, Y.; Yu, Z.; Park, J.; Semerad, C.; Ross, E.; et al. Prospectively Isolated Tetraspanin(+) Neoblasts Are Adult Pluripotent Stem Cells Underlying Planaria Regeneration. Cell 2018, 173, 1593–1608.e20. [Google Scholar] [CrossRef] [PubMed] [Green Version]
  37. Niu, K.; Xu, H.; Xiong, Y.Z.; Zhao, Y.; Gao, C.; Seidel, C.W.; Pan, X.; Ying, Y.; Lei, K. Canonical and early lineage-specific stem cell types identified in planarian SirNeoblasts. Cell Regen. 2021, 10, 15. [Google Scholar] [CrossRef] [PubMed]
  38. Raz, A.A.; Wurtzel, O.; Reddien, P.W. Planarian stem cells specify fate yet retain potency during the cell cycle. Cell Stem Cell 2021, 28, 1307–1322.e1305. [Google Scholar] [CrossRef] [PubMed]
  39. Felix, D.A.; Aboobaker, A.A. The TALE class homeobox gene Smed-prep defines the anterior compartment for head regeneration. PLoS Genet. 2010, 6, e1000915. [Google Scholar] [CrossRef] [Green Version]
  40. Hayashi, T.; Motoishi, M.; Yazawa, S.; Itomi, K.; Tanegashima, C.; Nishimura, O.; Agata, K.; Tarui, H. A LIM-homeobox gene is required for differentiation of Wnt-expressing cells at the posterior end of the planarian body. Development 2011, 138, 3679–3688. [Google Scholar] [CrossRef] [Green Version]
  41. Higuchi, S.; Hayashi, T.; Tarui, H.; Nishimura, O.; Nishimura, K.; Shibata, N.; Sakamoto, H.; Agata, K. Expression and functional analysis of musashi-like genes in planarian CNS regeneration. Mech. Dev. 2008, 125, 631–645. [Google Scholar] [CrossRef] [PubMed]
  42. Wagner, D.E.; Wang, I.E.; Reddien, P.W. Clonogenic neoblasts are pluripotent adult stem cells that underlie planarian regeneration. Science 2011, 332, 811–816. [Google Scholar] [CrossRef] [PubMed]
  43. Rodriguez-Esteban, G.; Gonzalez-Sastre, A.; Rojo-Laguna, J.I.; Salo, E.; Abril, J.F. Digital gene expression approach over multiple RNA-Seq data sets to detect neoblast transcriptional changes in Schmidtea mediterranea. BMC Genom. 2015, 16, 361. [Google Scholar] [CrossRef] [Green Version]
  44. Fincher, C.T.; Wurtzel, O.; de Hoog, T.; Kravarik, K.M.; Reddien, P.W. Cell type transcriptome atlas for the planarian Schmidtea mediterranea. Science 2018, 360. [Google Scholar] [CrossRef] [PubMed] [Green Version]
  45. Wenemoser, D.; Lapan, S.W.; Wilkinson, A.W.; Bell, G.W.; Reddien, P.W. A molecular wound response program associated with regeneration initiation in planarians. Genes Dev. 2012, 26, 988–1002. [Google Scholar] [CrossRef] [PubMed] [Green Version]
  46. Abril, J.F.; Cebria, F.; Rodriguez-Esteban, G.; Horn, T.; Fraguas, S.; Calvo, B.; Bartscherer, K.; Salo, E. Smed454 dataset: Unravelling the transcriptome of Schmidtea mediterranea. BMC Genom. 2010, 11, 731. [Google Scholar] [CrossRef] [PubMed] [Green Version]
  47. Blythe, M.J.; Kao, D.; Malla, S.; Rowsell, J.; Wilson, R.; Evans, D.; Jowett, J.; Hall, A.; Lemay, V.; Lam, S.; et al. A dual platform approach to transcript discovery for the planarian Schmidtea mediterranea to establish RNAseq for stem cell and regeneration biology. PLoS ONE 2010, 5, e15617. [Google Scholar] [CrossRef] [PubMed] [Green Version]
  48. Adamidi, C.; Wang, Y.; Gruen, D.; Mastrobuoni, G.; You, X.; Tolle, D.; Dodt, M.; Mackowiak, S.D.; Gogol-Doering, A.; Oenal, P.; et al. De novo assembly and validation of planaria transcriptome by massive parallel sequencing and shotgun proteomics. Genome Res. 2011, 21, 1193–1200. [Google Scholar] [CrossRef] [PubMed]
  49. Qin, Y.F.; Fang, H.M.; Tian, Q.N.; Bao, Z.X.; Lu, P.; Zhao, J.M.; Mai, J.; Zhu, Z.Y.; Shu, L.L.; Zhao, L.; et al. Transcriptome profiling and digital gene expression by deep-sequencing in normal/regenerative tissues of planarian Dugesia japonica. Genomics 2011, 97, 364–371. [Google Scholar] [CrossRef] [PubMed] [Green Version]
  50. Sandmann, T.; Vogg, M.C.; Owlarn, S.; Boutros, M.; Bartscherer, K. The head-regeneration transcriptome of the planarian Schmidtea mediterranea. Genome Biol. 2011, 12, R76. [Google Scholar] [CrossRef] [PubMed] [Green Version]
  51. Galloni, M. Global irradiation effects, stem cell genes and rare transcripts in the planarian transcriptome. Int. J. Dev. Biol. 2012, 56, 103–116. [Google Scholar] [CrossRef] [PubMed] [Green Version]
  52. Labbe, R.M.; Irimia, M.; Currie, K.W.; Lin, A.; Zhu, S.J.; Brown, D.D.; Ross, E.J.; Voisin, V.; Bader, G.D.; Blencowe, B.J.; et al. A comparative transcriptomic analysis reveals conserved features of stem cell pluripotency in planarians and mammals. Stem Cells 2012, 30, 1734–1745. [Google Scholar] [CrossRef] [PubMed] [Green Version]
  53. Nishimura, O.; Hirao, Y.; Tarui, H.; Agata, K. Comparative transcriptome analysis between planarian Dugesia japonica and other platyhelminth species. BMC Genom. 2012, 13, 289. [Google Scholar] [CrossRef] [PubMed] [Green Version]
  54. Onal, P.; Grun, D.; Adamidi, C.; Rybak, A.; Solana, J.; Mastrobuoni, G.; Wang, Y.; Rahn, H.P.; Chen, W.; Kempa, S.; et al. Gene expression of pluripotency determinants is conserved between mammalian and planarian stem cells. EMBO J. 2012, 31, 2755–2769. [Google Scholar] [CrossRef] [PubMed] [Green Version]
  55. Resch, A.M.; Palakodeti, D.; Lu, Y.C.; Horowitz, M.; Graveley, B.R. Transcriptome analysis reveals strain-specific and conserved stemness genes in Schmidtea mediterranea. PLoS ONE 2012, 7, e34447. [Google Scholar] [CrossRef]
  56. Solana, J.; Kao, D.; Mihaylova, Y.; Jaber-Hijazi, F.; Malla, S.; Wilson, R.; Aboobaker, A. Defining the molecular profile of planarian pluripotent stem cells using a combinatorial RNAseq, RNA interference and irradiation approach. Genome Biol. 2012, 13, R19. [Google Scholar] [CrossRef] [PubMed] [Green Version]
  57. Kao, D.; Felix, D.; Aboobaker, A. The planarian regeneration transcriptome reveals a shared but temporally shifted regulatory program between opposing head and tail scenarios. BMC Genom. 2013, 14, 797. [Google Scholar] [CrossRef] [Green Version]
  58. Sikes, J.M.; Newmark, P.A. Restoration of anterior regeneration in a planarian with limited regenerative ability. Nature 2013, 500, 77–80. [Google Scholar] [CrossRef] [PubMed]
  59. Scimone, M.L.; Kravarik, K.M.; Lapan, S.W.; Reddien, P.W. Neoblast specialization in regeneration of the planarian Schmidtea mediterranea. Stem Cell Rep. 2014, 3, 339–352. [Google Scholar] [CrossRef] [PubMed] [Green Version]
  60. Srivastava, M.; Mazza-Curll, K.L.; van Wolfswinkel, J.C.; Reddien, P.W. Whole-body acoel regeneration is controlled by Wnt and Bmp-Admp signaling. Curr. Biol. 2014, 24, 1107–1113. [Google Scholar] [CrossRef] [Green Version]
  61. Vogg, M.C.; Owlarn, S.; Perez Rico, Y.A.; Xie, J.; Suzuki, Y.; Gentile, L.; Wu, W.; Bartscherer, K. Stem cell-dependent formation of a functional anterior regeneration pole in planarians requires Zic and Forkhead transcription factors. Dev. Biol. 2014, 390, 136–148. [Google Scholar] [CrossRef] [PubMed] [Green Version]
  62. Reuter, H.; Marz, M.; Vogg, M.C.; Eccles, D.; Grifol-Boldu, L.; Wehner, D.; Owlarn, S.; Adell, T.; Weidinger, G.; Bartscherer, K. Beta-catenin-dependent control of positional information along the AP body axis in planarians involves a teashirt family member. Cell Rep. 2015, 10, 253–265. [Google Scholar] [CrossRef] [PubMed] [Green Version]
  63. Wheeler, N.J.; Agbedanu, P.N.; Kimber, M.J.; Ribeiro, P.; Day, T.A.; Zamanian, M. Functional analysis of Girardia tigrina transcriptome seeds pipeline for anthelmintic target discovery. Parasites Vectors 2015, 8, 34. [Google Scholar] [CrossRef] [Green Version]
  64. Pang, Q.; Gao, L.; Hu, W.; An, Y.; Deng, H.; Zhang, Y.; Sun, X.; Zhu, G.; Liu, B.; Zhao, B. De Novo Transcriptome Analysis Provides Insights into Immune Related Genes and the RIG-I-Like Receptor Signaling Pathway in the Freshwater Planarian (Dugesia japonica). PLoS ONE 2016, 11, e0151597. [Google Scholar] [CrossRef] [PubMed] [Green Version]
  65. Raz, A.A.; Srivastava, M.; Salvamoser, R.; Reddien, P.W. Acoel regeneration mechanisms indicate an ancient role for muscle in regenerative patterning. Nat. Commun. 2017, 8, 1260. [Google Scholar] [CrossRef] [PubMed] [Green Version]
  66. Mihaylova, Y.; Abnave, P.; Kao, D.; Hughes, S.; Lai, A.; Jaber-Hijazi, F.; Kosaka, N.; Aboobaker, A.A. Conservation of epigenetic regulation by the MLL3/4 tumour suppressor in planarian pluripotent stem cells. Nat. Commun. 2018, 9, 3633. [Google Scholar] [CrossRef] [PubMed] [Green Version]
  67. Ross, K.G.; Molinaro, A.M.; Romero, C.; Dockter, B.; Cable, K.L.; Gonzalez, K.; Zhang, S.; Collins, E.S.; Pearson, B.J.; Zayas, R.M. SoxB1 Activity Regulates Sensory Neuron Regeneration, Maintenance, and Function in Planarians. Dev. Cell. 2018, 47, 331–347.e335. [Google Scholar] [CrossRef] [PubMed] [Green Version]
  68. Sekii, K.; Yorimoto, S.; Okamoto, H.; Nagao, N.; Maezawa, T.; Matsui, Y.; Yamaguchi, K.; Furukawa, R.; Shigenobu, S.; Kobayashi, K. Transcriptomic analysis reveals differences in the regulation of amino acid metabolism in asexual and sexual planarians. Sci. Rep. 2019, 9, 6132. [Google Scholar] [CrossRef] [PubMed]
  69. Zayas, R.M.; Hernandez, A.; Habermann, B.; Wang, Y.; Stary, J.M.; Newmark, P.A. The planarian Schmidtea mediterranea as a model for epigenetic germ cell specification: Analysis of ESTs from the hermaphroditic strain. Proc. Natl. Acad. Sci. USA 2005, 102, 18491–18496. [Google Scholar] [CrossRef] [PubMed] [Green Version]
  70. Robb, S.M.; Ross, E.; Sanchez Alvarado, A. SmedGD: The Schmidtea mediterranea genome database. Nucleic Acids Res. 2008, 36, D599–D606. [Google Scholar] [CrossRef] [PubMed] [Green Version]
  71. Zeng, A.; Li, Y.Q.; Wang, C.; Han, X.S.; Li, G.; Wang, J.Y.; Li, D.S.; Qin, Y.W.; Shi, Y.; Brewer, G.; et al. Heterochromatin protein 1 promotes self-renewal and triggers regenerative proliferation in adult stem cells. J. Cell Biol. 2013, 201, 409–425. [Google Scholar] [CrossRef] [PubMed]
  72. Almazan, E.M.P.; Lesko, S.L.; Markey, M.P.; Rouhana, L. Girardia dorotocephala transcriptome sequence, assembly, and validation through characterization of piwi homologs and stem cell progeny markers. Dev. Biol. 2018, 433, 433–447. [Google Scholar] [CrossRef] [PubMed]
  73. Fernandez-Taboada, E.; Moritz, S.; Zeuschner, D.; Stehling, M.; Scholer, H.R.; Salo, E.; Gentile, L. Smed-SmB, a member of the LSm protein superfamily, is essential for chromatoid body organization and planarian stem cell proliferation. Development 2010, 137, 1055–1065. [Google Scholar] [CrossRef] [Green Version]
  74. Van Roten, A.; Barakat, A.Z.A.; Wouters, A.; Tran, T.A.; Mouton, S.; Noben, J.P.; Gentile, L.; Smeets, K. A carcinogenic trigger to study the function of tumor suppressor genes in Schmidtea mediterranea. Dis. Model. Mech. 2018, 11, dmm032573. [Google Scholar] [CrossRef] [Green Version]
  75. Pearson, B.J.; Eisenhoffer, G.T.; Gurley, K.A.; Rink, J.C.; Miller, D.E.; Sanchez Alvarado, A. Formaldehyde-based whole-mount in situ hybridization method for planarians. Dev. Dyn. 2009, 238, 443–450. [Google Scholar] [CrossRef]
  76. Reddien, P.W.; Sanchez Alvarado, A. Fundamentals of planarian regeneration. Annu. Rev. Cell Dev. Biol. 2004, 20, 725–757. [Google Scholar] [CrossRef] [Green Version]
  77. Gentile, L.; Cebria, F.; Bartscherer, K. The planarian flatworm: An in vivo model for stem cell biology and nervous system regeneration. Dis. Model. Mech. 2011, 4, 12–19. [Google Scholar] [CrossRef] [PubMed] [Green Version]
  78. Tariq, M.A.; Kim, H.J.; Jejelowo, O.; Pourmand, N. Whole-transcriptome RNAseq analysis from minute amount of total RNA. Nucleic Acids Res. 2011, 39, e120. [Google Scholar] [CrossRef]
  79. Eisenhoffer, G.T.; Kang, H.; Sanchez Alvarado, A. Molecular analysis of stem cells and their descendants during cell turnover and regeneration in the planarian Schmidtea mediterranea. Cell Stem Cell 2008, 3, 327–339. [Google Scholar] [CrossRef] [PubMed] [Green Version]
  80. Katayama, S.; Tomaru, Y.; Kasukawa, T.; Waki, K.; Nakanishi, M.; Nakamura, M.; Nishida, H.; Yap, C.C.; Suzuki, M.; Kawai, J.; et al. Antisense transcription in the mammalian transcriptome. Science 2005, 309, 1564–1566. [Google Scholar] [CrossRef] [PubMed]
  81. Ashburner, M.; Ball, C.A.; Blake, J.A.; Botstein, D.; Butler, H.; Cherry, J.M.; Davis, A.P.; Dolinski, K.; Dwight, S.S.; Eppig, J.T.; et al. Gene ontology: Tool for the unification of biology. The Gene Ontology Consortium. Nat. Genet. 2000, 25, 25–29. [Google Scholar] [CrossRef] [Green Version]
  82. Wenemoser, D.; Reddien, P.W. Planarian regeneration involves distinct stem cell responses to wounds and tissue absence. Dev. Biol. 2010, 344, 979–991. [Google Scholar] [CrossRef] [Green Version]
  83. Gurley, K.A.; Rink, J.C.; Sanchez Alvarado, A. Beta-catenin defines head versus tail identity during planarian regeneration and homeostasis. Science 2008, 319, 323–327. [Google Scholar] [CrossRef] [Green Version]
  84. Agata, K.; Soejima, Y.; Kato, K.; Kobayashi, C.; Umesono, Y.; Watanabe, K. Structure of the planarian central nervous system (CNS) revealed by neuronal cell markers. Zoolog. Sci. 1998, 15, 433–440. [Google Scholar] [CrossRef] [PubMed] [Green Version]
  85. Sanchez Alvarado, A.; Newmark, P.A. Double-stranded RNA specifically disrupts gene expression during planarian regeneration. Proc. Natl. Acad. Sci. USA 1999, 96, 5049–5054. [Google Scholar] [CrossRef] [PubMed] [Green Version]
  86. Newmark, P.A.; Wang, Y.; Chong, T. Germ cell specification and regeneration in planarians. Cold Spring Harb. Symp. Quant. Biol. 2008, 73, 573–581. [Google Scholar] [CrossRef] [PubMed] [Green Version]
  87. Collins, J.J., 3rd; Hou, X.; Romanova, E.V.; Lambrus, B.G.; Miller, C.M.; Saberi, A.; Sweedler, J.V.; Newmark, P.A. Genome-wide analyses reveal a role for peptide hormones in planarian germline development. PLoS Biol. 2010, 8, e1000509. [Google Scholar] [CrossRef] [PubMed] [Green Version]
  88. Wang, Y.; Stary, J.M.; Wilhelm, J.E.; Newmark, P.A. A functional genomic screen in planarians identifies novel regulators of germ cell development. Genes Dev. 2010, 24, 2081–2092. [Google Scholar] [CrossRef] [PubMed] [Green Version]
  89. Gurley, K.A.; Elliott, S.A.; Simakov, O.; Schmidt, H.A.; Holstein, T.W.; Sanchez Alvarado, A. Expression of secreted Wnt pathway components reveals unexpected complexity of the planarian amputation response. Dev. Biol. 2010, 347, 24–39. [Google Scholar] [CrossRef] [Green Version]
  90. Kobayashi, C.; Watanabe, K.; Agata, K. The process of pharynx regeneration in planarians. Dev. Biol. 1999, 211, 27–38. [Google Scholar] [CrossRef] [PubMed] [Green Version]
  91. Orii, H.; Ito, H.; Watanabe, K. Anatomy of the planarian Dugesia japonica I. The muscular system revealed by antisera against myosin heavy chains. Zoolog. Sci. 2002, 19, 1123–1131. [Google Scholar] [CrossRef] [PubMed] [Green Version]
  92. Reddien, P.W.; Bermange, A.L.; Murfitt, K.J.; Jennings, J.R.; Sanchez Alvarado, A. Identification of genes needed for regeneration, stem cell function, and tissue homeostasis by systematic gene perturbation in planaria. Dev. Cell 2005, 8, 635–649. [Google Scholar] [CrossRef] [Green Version]
  93. Molina, M.D.; Salo, E.; Cebria, F. The BMP pathway is essential for re-specification and maintenance of the dorsoventral axis in regenerating and intact planarians. Dev. Biol. 2007, 311, 79–94. [Google Scholar] [CrossRef] [PubMed] [Green Version]
  94. Mannini, L.; Rossi, L.; Deri, P.; Gremigni, V.; Salvetti, A.; Salo, E.; Batistoni, R. Djeyes absent (Djeya) controls prototypic planarian eye regeneration by cooperating with the transcription factor Djsix-1. Dev. Biol. 2004, 269, 346–359. [Google Scholar] [CrossRef] [PubMed]
  95. Cutie, S.; Hoang, A.T.; Payumo, A.Y.; Huang, G.N. Unconventional Functions of Muscles in Planarian Regeneration. Dev. Cell 2017, 43, 657–658. [Google Scholar] [CrossRef] [Green Version]
  96. Scimone, M.L.; Cote, L.E.; Reddien, P.W. Orthogonal muscle fibres have different instructive roles in planarian regeneration. Nature 2017, 551, 623–628. [Google Scholar] [CrossRef]
  97. Gross, J.M.; Dowling, J.E. Tbx2b is essential for neuronal differentiation along the dorsal/ventral axis of the zebrafish retina. Proc. Natl. Acad. Sci. USA 2005, 102, 4371–4376. [Google Scholar] [CrossRef] [PubMed] [Green Version]
  98. Forsthoefel, D.J.; James, N.P.; Escobar, D.J.; Stary, J.M.; Vieira, A.P.; Waters, F.A.; Newmark, P.A. An RNAi screen reveals intestinal regulators of branching morphogenesis, differentiation, and stem cell proliferation in planarians. Dev. Cell 2012, 23, 691–704. [Google Scholar] [CrossRef] [Green Version]
  99. Vij, S.; Rink, J.C.; Ho, H.K.; Babu, D.; Eitel, M.; Narasimhan, V.; Tiku, V.; Westbrook, J.; Schierwater, B.; Roy, S. Evolutionarily ancient association of the FoxJ1 transcription factor with the motile ciliogenic program. PLoS Genet. 2012, 8, e1003019. [Google Scholar] [CrossRef]
  100. Cowles, M.W.; Brown, D.D.; Nisperos, S.V.; Stanley, B.N.; Pearson, B.J.; Zayas, R.M. Genome-wide analysis of the bHLH gene family in planarians identifies factors required for adult neurogenesis and neuronal regeneration. Development 2013, 140, 4691–4702. [Google Scholar] [CrossRef] [Green Version]
  101. Iyer, H.; Collins, J.J., 3rd; Newmark, P.A. NF-YB Regulates Spermatogonial Stem Cell Self-Renewal and Proliferation in the Planarian Schmidtea mediterranea. PLoS Genet. 2016, 12, e1006109. [Google Scholar] [CrossRef] [PubMed]
  102. Owlarn, S.; Bartscherer, K. Go ahead, grow a head! A planarian’s guide to anterior regeneration. Regeneration 2016, 3, 139–155. [Google Scholar] [CrossRef] [PubMed] [Green Version]
  103. Handberg-Thorsager, M.; Salo, E. The planarian nanos-like gene Smednos is expressed in germline and eye precursor cells during development and regeneration. Dev. Genes Evol. 2007, 217, 403–411. [Google Scholar] [CrossRef] [PubMed]
  104. Velten, L.; Haas, S.F.; Raffel, S.; Blaszkiewicz, S.; Islam, S.; Hennig, B.P.; Hirche, C.; Lutz, C.; Buss, E.C.; Nowak, D.; et al. Human haematopoietic stem cell lineage commitment is a continuous process. Nat. Cell Biol. 2017, 19, 271–281. [Google Scholar] [CrossRef] [Green Version]
  105. Tran, T.A.; Gentile, L. A lineage CLOUD for neoblasts. Semin. Cell Dev. Biol. 2019, 87, 22–29. [Google Scholar] [CrossRef]
Figure 1. Experimental plan and sampling. (A) Schematics showing the experimental setup and the main techniques used to generate the shortlist of transcription factors involved in the anterior blastema regeneration. (B) Wild-type (a–f) and irradiated (g–l) animals 3 and 6 days after amputation in three fragments: head, trunk, and tail. (C) Day 3 wt trunk fragment under bright field and UV light illumination. The blastema is highly refractive under UV light, allowing the precise definition of the laser cut path (bottom). Red arrowhead: blastema-postblastema boundary; green line: laser cutting path (1st); red line: laser cutting path (2nd). (D) After RNA extraction and cDNA synthesis, the array of samples used in the study were assessed via qPCR for smedwi1, prog1, Agat1, and SmB (shown for SmB-KD sample only).
Biomolecules 11 01782 g001
Figure 2. RNA-seq data relative to the expression of known genes. (A) Relative expression of genes representative of the FACS cell fractions in X1, X2, and Xin RNA-seq samples. (B) Genes differentially expressed between anterior blastema (B) and the respective non-regenerating rest of the body (RoB) at day 3 (left panel) and day 6 (center panel) of regeneration or between anterior blastema day 3 and anterior blastema day 6 (right panel), represented as butterfly charts. The position of some representative genes is provided (red dots). A threshold of 1.5-folds was applied, the trendlines represent the ratio of the expression of the genes considered between the pairs of samples shown.
Biomolecules 11 01782 g002
Figure 3. RNA-Seq analysis pipeline. Alongside the core analysis of the raw data (assembly, mapping, and annotation), the complete pipeline also consisted of data sorting. Putative transcription factors active in the blastema were selected according to their relative expression level in the considered samples and their functional annotation (Blastx, InterProScan and GO). A total of 60 putative blastema transcription factors were eventually shortlisted.
Biomolecules 11 01782 g003
Figure 4. Sorting of the RNA-seq data. (A) A heat map was populated with 3586 genes that were sorted based on the differential expression among the samples, as explained in Figure 3. (B) The Pearson’s correlation based on the shortlist of 3586 genes showed how the samples analyzed in this study correlate expression-wise. Two main clusters of samples are visible: one that is stem cell-enriched (X1, X2 samples) and one that is non-stem cell-enriched (Xin, RoB, Irr d3, Irr d6, SmB(RNAi), blastema samples). Within the non-stem cell-enriched samples, the blastema samples clustered together in a sub-group (second most relevant hierarchical division). (CE) The 3586 genes were grouped according to their molecular function (C). A lower hierarchical level of molecular functions was showed by the different classes of genes with binding activity (D). The pie chart showed how the 111 genes with nucleic acid binding activity distribute in the two main classes of nucleic acid binding: DNA- and RNA-binding (E).
Biomolecules 11 01782 g004
Figure 5. Expression of the shortlisted putative transcription factors in fragments at either day 3 or 6 of regeneration and in homeostatic animals, as for WISH. (A) SC-like patter of H2A. (B) Ets-1, Prep, ZicA, and FoxJ1 were expressed in the region anterior to the photoreceptors. (C) Rfc3 and Dr1 were expressed along the midline. (D) Irx3, Hsf1, and Pax2/5/8 were expressed only in regenerating fragments, either in the blastema or in other districts, but not in homeostatic animals. (E) Tbx2, Ap2, and Zgpat were expressed in the CNS. (F) Tcf15 and Elf4 were expressed in the mouth. (G) Egr1 and Zfp were expressed in the pharynx. (H) Hr96, FoxF, and Zmym6 were expressed in both mouth and pharynx. (I) Traf5, Etv6, and Nfat5 were expressed in the intestine. (J) Egr1 and Zfp were expressed in the testes. Scale bar: 1 mm.
Biomolecules 11 01782 g005
Figure 6. Expression of the shortlisted blastema transcription factors in day 3 blastema, as for WISH. Transcription factors expressed in the anterior blastema of tail fragments after 3 days of regeneration, except for Zmym6, which is shown in the anterior blastema of a trunk fragment. In green, two genes that are not transcription factors but have some transcriptional regulation activity (Smad4 and Smarcb1).
Biomolecules 11 01782 g006
Figure 7. Co-localization of the transcripts of the shortlisted TFs with those of tissue-specific markers. (A,B) Co-localization of Tbx2/3 (A) and Taf11 (B) mRNAs with the pan-neuronal marker PC2 (as for double-WISH) in day 3 blastema of regenerating head fragments. The areas in the upper panels surrounded with the yellow frames are enlarged in the respective lower panels. Scale bars: 50 μm. (C) Traf5 expressing cells are located around the gut linen, which is marked by porcupine (as for double-WISH), both at day 3 (upper and middle panels) and at day 6 (lower panel) of regeneration. Traf5 signal is stronger in the newly formed tissue close to the wound, especially in the early phase of regeneration (white arrowheads). The yellow frames in the upper panel show the regions enlarged in the middle panel. Scale bars: 50 μm. (DF) Co-localizion of Six-1 (D), FoxF (E), or MyoD (F) mRNAs with Myhc mRNA (as for double-WISH) in blastema at day 3 of regeneration. The areas in the upper panels surrounded with the yellow frames are enlarged in the respective lower panels. Scale bars: 50 μm. (G) Cells co-expressing Zfp mRNA with the germinal histone 4 mRNA, in the trunk fragment of planarians at day 6 of regeneration. Either double-positive or double-negative cells are visible. The inserts show an enlargement of the areas surrounded by the yellow frames. Scale bars: 50 μm.
Biomolecules 11 01782 g007
Figure 8. The knock-down of the blastema transcription factors resulted in regeneration defects. (A) Following dsRNA-mediated gene knock-down, most of the blastema transcription factors tested resulted in regeneration defects. The Knock-down of Smad4, Lmh1a, and Egr1 resulted in tail regeneration defects (n = 7/9, 13/17, 17/24, respectively) and occasionally in eye regeneration defects (n = 3/9, 4/8, 20/43, respectively). The knock-down of Zfp, Fli1, Tigd1 and Six-1 resulted in a blastema of a reduced size, regardless of the fragment considered (n = 32/42, 41/53, 11/19, 16/23, respectively). The Knock-down of Zfp, MyoD, Isl-1 and Tbx2/3 resulted in eye regeneration defects (n = 21/23, 26/26, 10/10, 9/13, respectively). The Knock-down of Traf5 and Etv6 resulted in gut regeneration defects and the formation of body-wide lesions (n = 14/16, 20/20, respectively). (B) In spite of the regeneration defects displayed, most of the knocked-down genes did not alter significantly the lethality rate; exceptions to this rule were Etv6, with an average lethality of almost 50% at 9 dpa (n = 27/60) and MyoD, with a lethality rate >50% but limited to the head fragments (n = 48/60). (C) The immunostaining against arrestin (VC-1) showed that the knock-down of virtually all genes that produced tail, blastema or eye regeneration defects resulted also in the mis-projection of the visual neurons (e.g., Zfp, MyoD, Tbx2) or the reduced size of the photoreceptors (e.g., Egr1, Fli1, Tigd1, Six-1). Scale bars in C: 50 μm.
Biomolecules 11 01782 g008
Figure 9. The blastema transcriptional regulatory genes landscape. The transcription factors expressed by the cells within the blastema could be either restricted to a specific lineage/tissue or not, as emerged from WISH and RNAi data. (functionally-validated genes are shown in bold).
Biomolecules 11 01782 g009
Table 1. Peer-reviewed articles presenting planarian transcriptome studies.
No. YearAuthorTranscriptome AnalysisSpeciesSequencing Samples
12010Blythe, et al.454, SOLiD3S. mediterraneaRegenerating fragments at 6, 12, 24, 36, 48, 72, 96, 120, 144 h
of anterior and posterior regeneration and intact
22010Abril, et al.454S. mediterraneaMixed sample of intact and regenerating planarians (1, 3, 5, and 7 days),
Irradiates intact and regenerating animals (1, 3, 5, and 7 days of regeneration)
32011Qin, et al. Illumina HiseqTM 2000D. japonicaRegenerating planarian from Day 1 to Day 10 and intact
42011Adamidi, et al. 454, Illumina GAIIXS. mediterraneaWhole animal
52011Sandmann, et al.Illumina Genome Analyzer IIS. mediterraneaRegenerating head from 0 to 3 days
SOLiD3S. mediterraneaRegenerating head and tail regions at 0, 1, and 6 h after amputation
62012Solana, et al.SOLiD4S. mediterraneaIraddiate animals at 2, 4, 7 days and wild type intact
72012Shibata, et al.HiCEPD. japonicaIntact, Irradiated planarians, Neoblasts from X1/2 fractions
82012Galloni, et al.DGES. mediterraneaIrradiated and normal regenerating samples at 0–7 days after amputation
92012Resch, et al.Illumina GAIIXS. mediterraneanon-irradiated or irradiated
102012Nishimura, et al. Sanger SequencesD. japonicaHead fragments after amputation
112012Lapan, et al.Illumina Genome Analyzer IIS. mediterraneaEyes, amputated heads (above the pharynx and coronal amputation was made to
remove dorsal tissues including eye)
122012Labbe, et al.Illumina HiSeq 2000S. mediterraneaFACS sorted stem cells, irradiate animals at 7 days post irradiation
132012Onal, et al.Illumina Genome Analyzer IIS. mediterraneaX1, X2, Xin
142013Sikes, et al.Illumina SequencingProcotyla fluviatillsFragments of worms, intact
152013März, et al.Illumina HiScanSQS. mediterraneaSmed-pitx RNAi and control fragments at 3 days post amputation
162013Kao, et al.SOLiD3S. mediterraneaRegenerating head and tail fragments 0, 6, 12, 24, 46, 48, and 72 h after amputation.
454G. tigrinaTail fragments of Smed-Prep RNAi animals 24 h after amputation
Hofstenia miamiaEmbryonic development (2-cell stage through nine days old embryos from multiple parents)
172014Srivastana, et al.454S. mediterraneaRegeneration at 1, 6, 18, 24, 72 h after amputation
182014Vogg, et al.Illumina HiScanSQS. mediterraneaFoxD RNAi tail stumps at 0 and 3 days post amputation and regenerating control
192014Scimone, et al.Illumina HiSeqS. mediterraneaX1 isolation after amputation
202015Reuter, et al.Illumina HiScanSQS. mediterraneadsRNA notum, 18 h post amputation
212015Wheeler, et al.Illumina HiSeq 2000G. tigrinaAmputation, +serotonin, control
222016Pang, et al.Illumina HiSeq 2000D. japonicaWhole animal
232016Molinaro, et al.Illumina HiSeq 2500, Single Cell SeqS. mediterraneaFACS sorted X1, X2 from head
242018Almazan, et al.Illumina HiSeq 2500G. dorotocephala MA-C2Intact, 1, 4, days post amputation, Auricles
252018Zeng, et al.Illumina HiSeq 2500, scRNA-seqS. mediterraneaBulk RNA-seq of live cells and fixed cells (X1, X2, Xin), X1 neoblasts (200,000 cells) from
wild-type animals, X1 + X2 cells from 7 day sub-lethally irradiated animals
262018Mihaylova, et al.Illumina NextSeqS. mediterraneaFACS sorted G2/M cells from knockdown and control RNAi animals 3days of regeneration
272018Ross, et al.HiSeq 2000S. mediterraneaSoxB1-2 RNAi and control RNAi animals at day 6, 14, and 24 after the first RNAI treatment
scRNA-seq (Molinaro, et al., 2016)
282019Sekii, et al.Illumina HiSeq 2000D. ryukyuensisAsexual sample, Sexual sample, Innate Sexual sample
292020Forsthoefel, et al.Nextseq 500S. mediterraneaLCM (medial intestine, lateral intestine, non-intestine)
Publisher’s Note: MDPI stays neutral with regard to jurisdictional claims in published maps and institutional affiliations.

