
Triple Isozyme Lactic Acid Dehydrogenase Inhibition in Fully Viable MDA-MB-231 Cells Induces Cytostatic Effects That Are Not Reversed by Exogenous Lactic Acid


Abstract
:1. Introduction
2. Materials and Methods
2.1. Materials
2.2. Cell Culture
2.3. Cell Viability
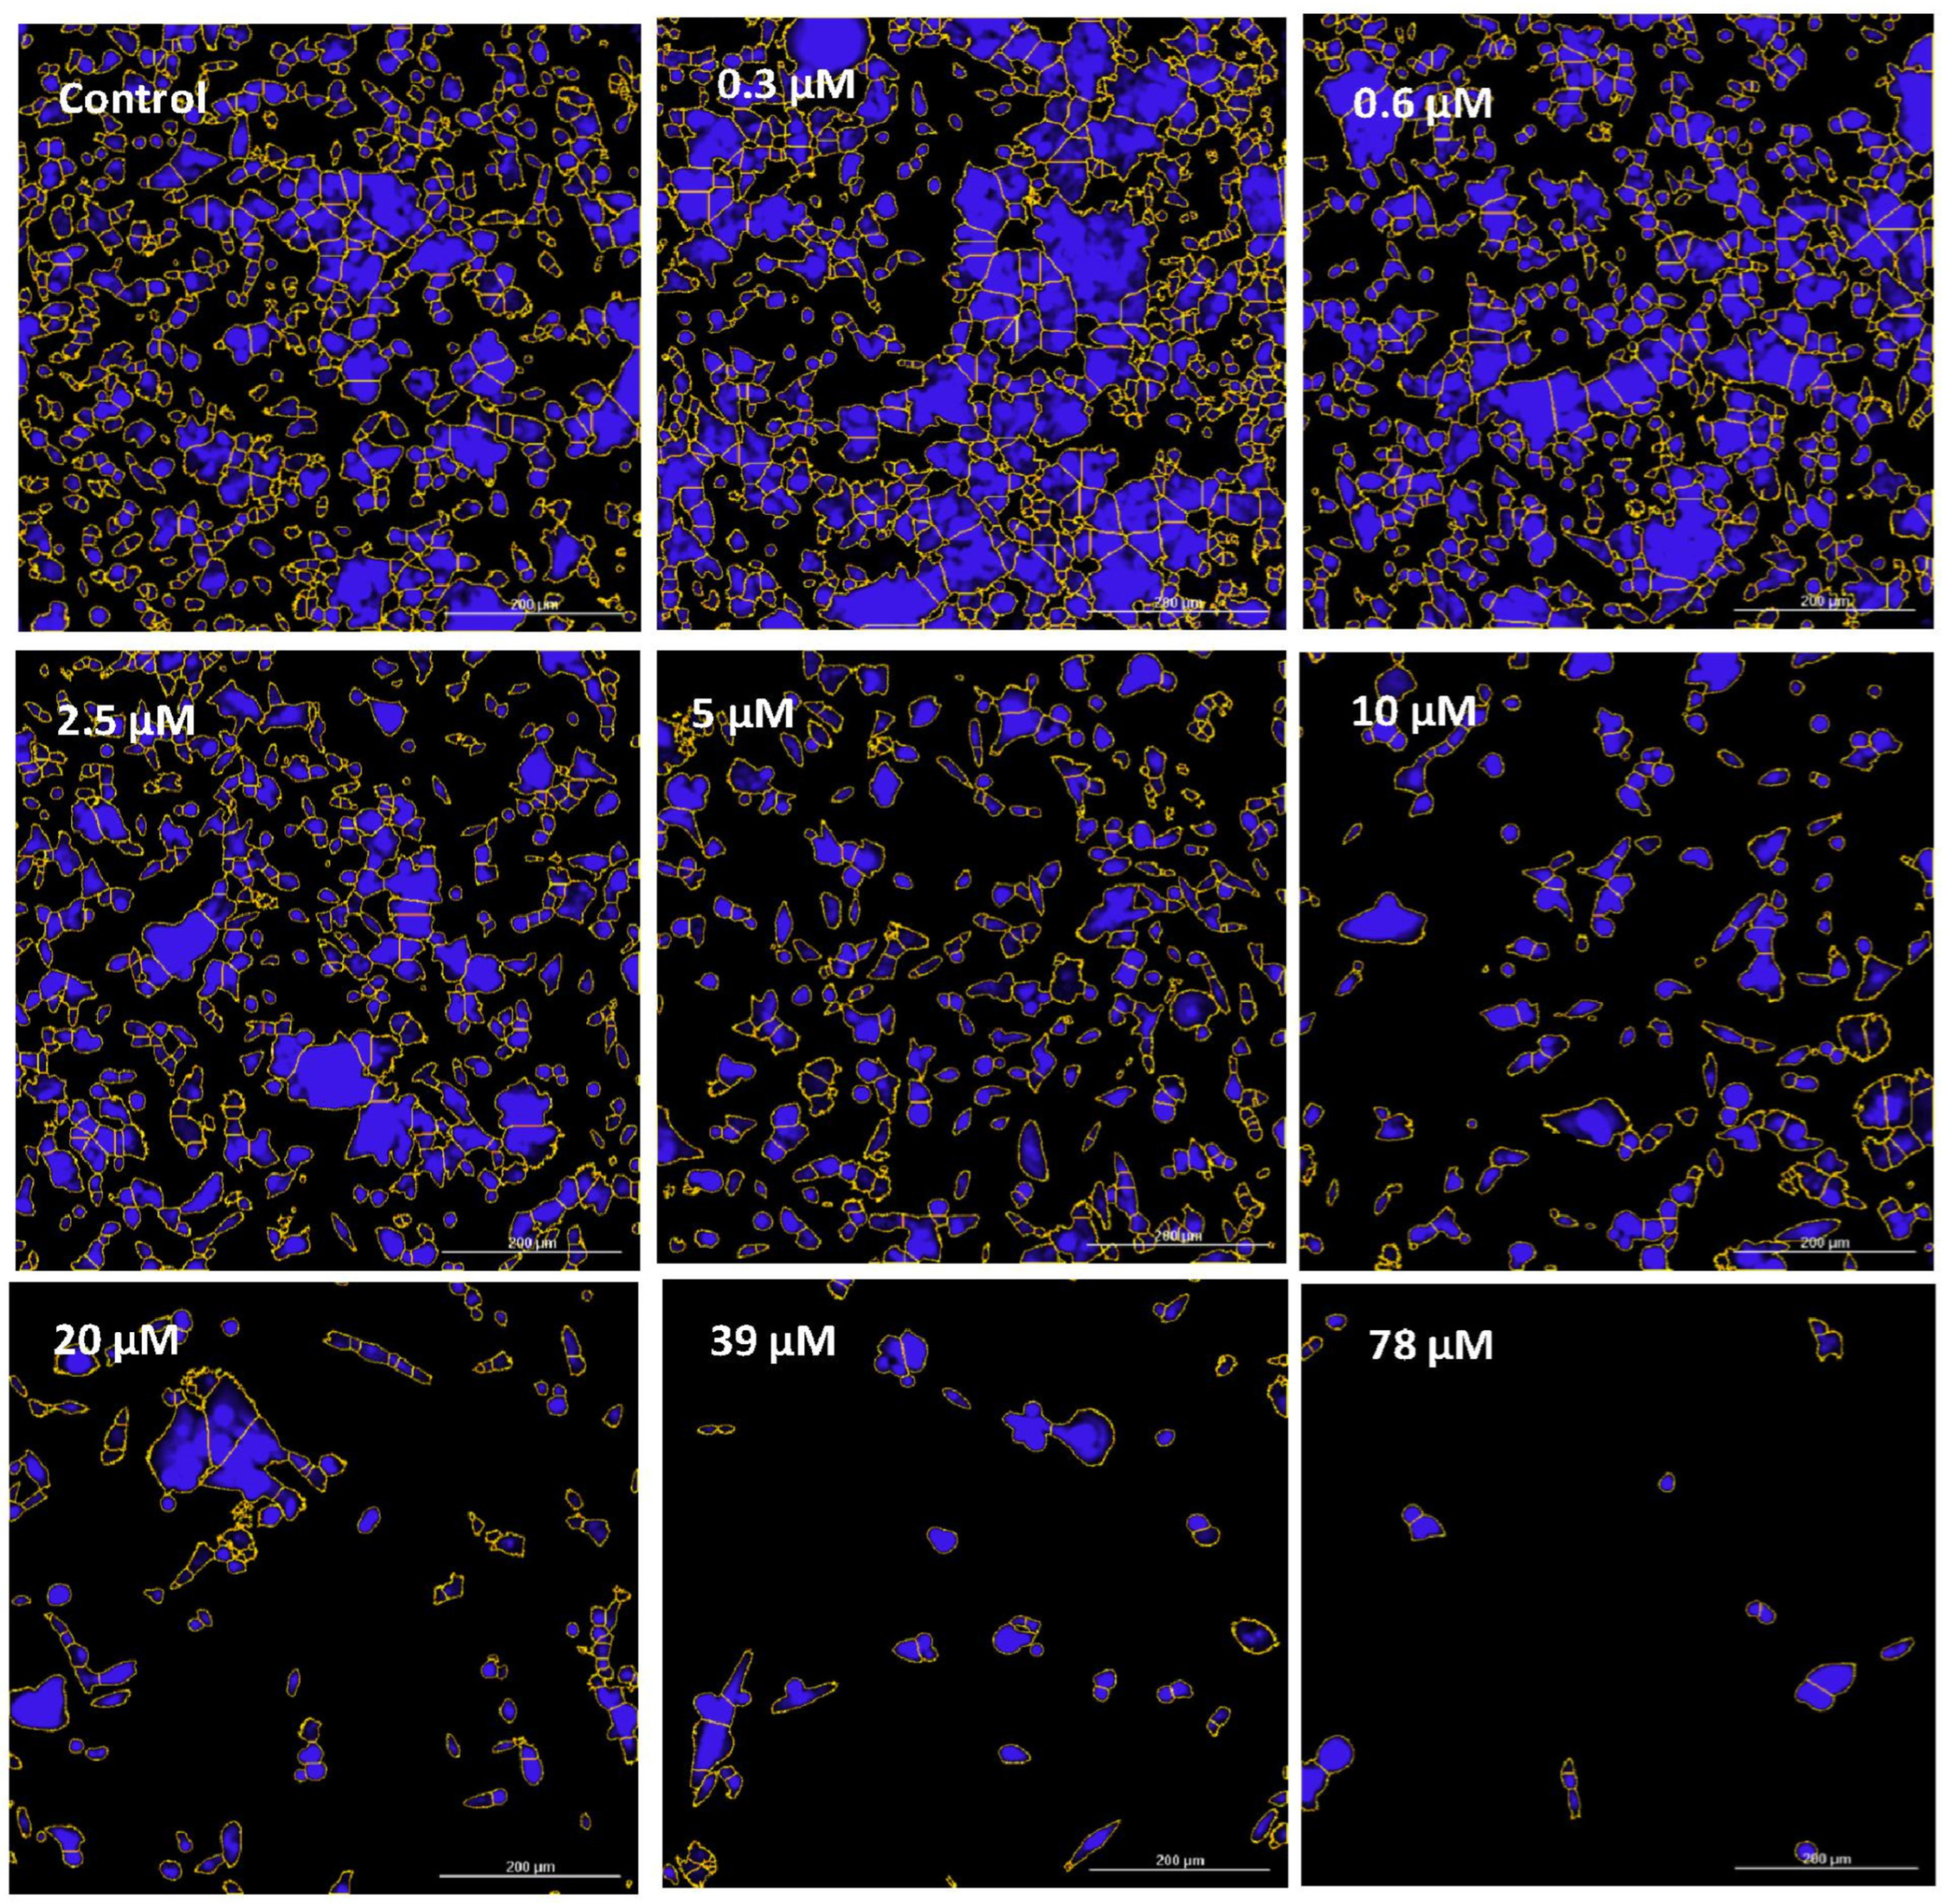
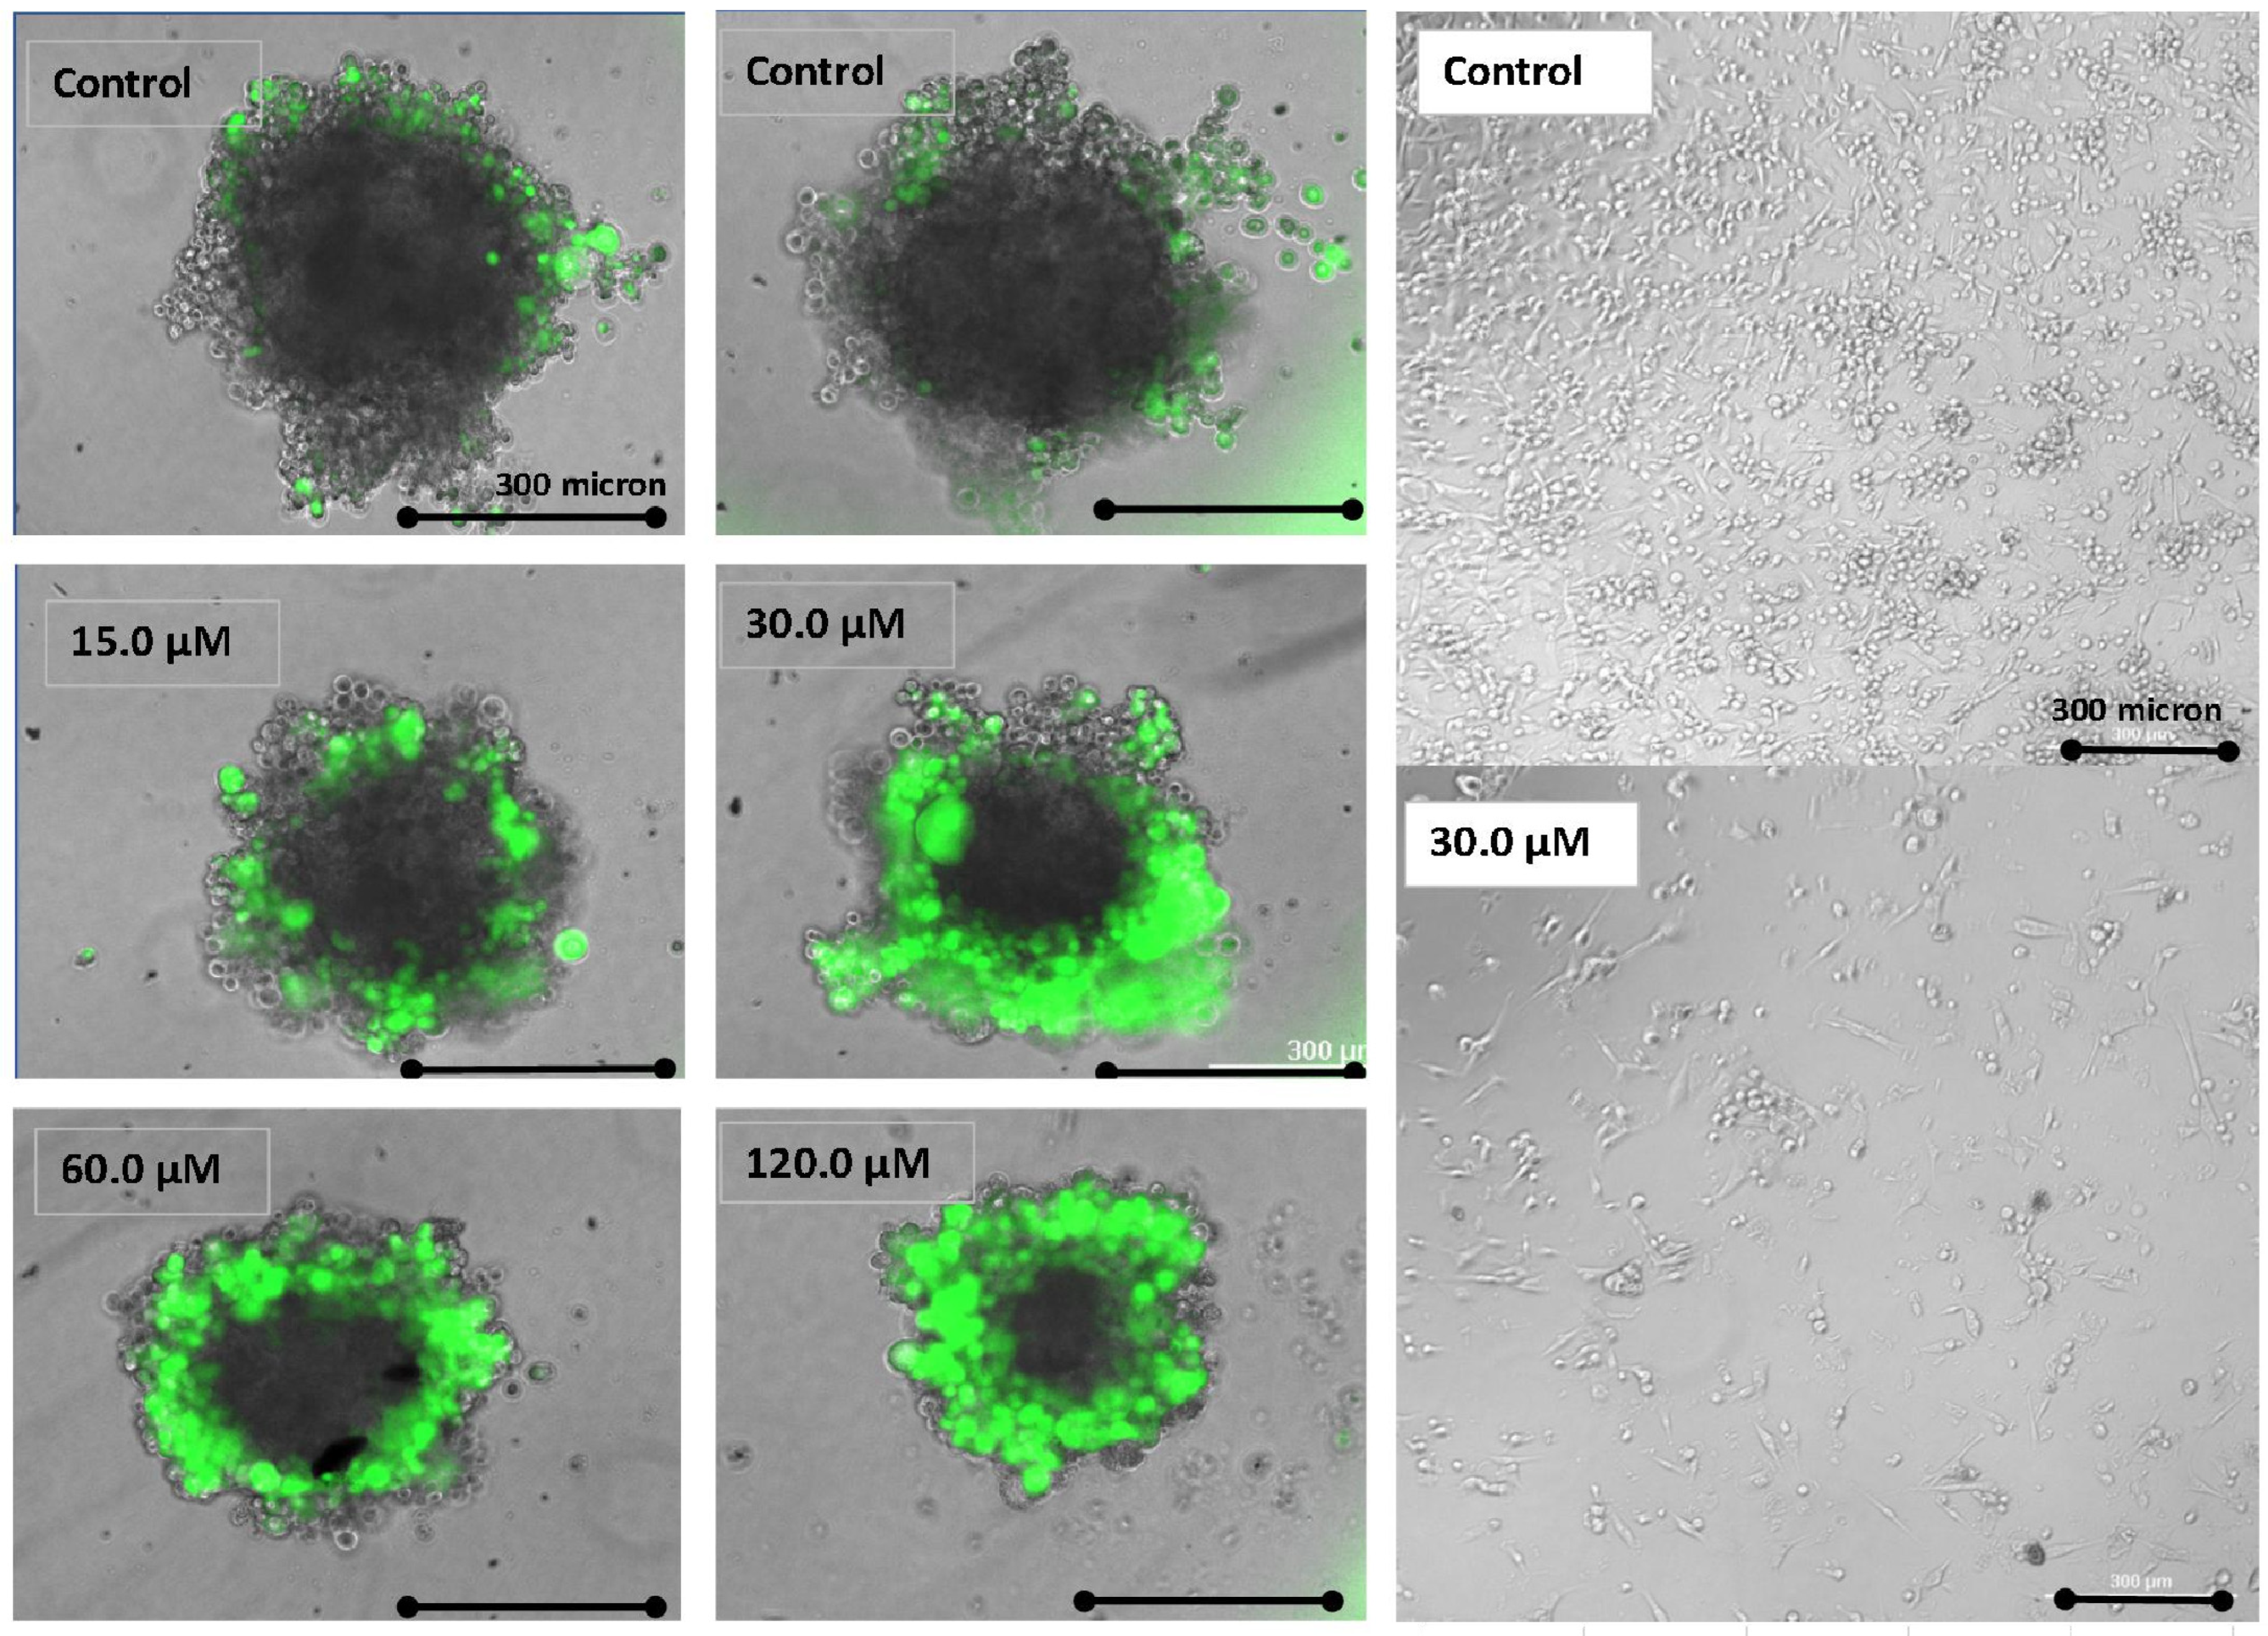
2.4. Imaging—Mitochondria, Morphology, and Nuclear Staining
2.5. Glucose and Lactic Acid
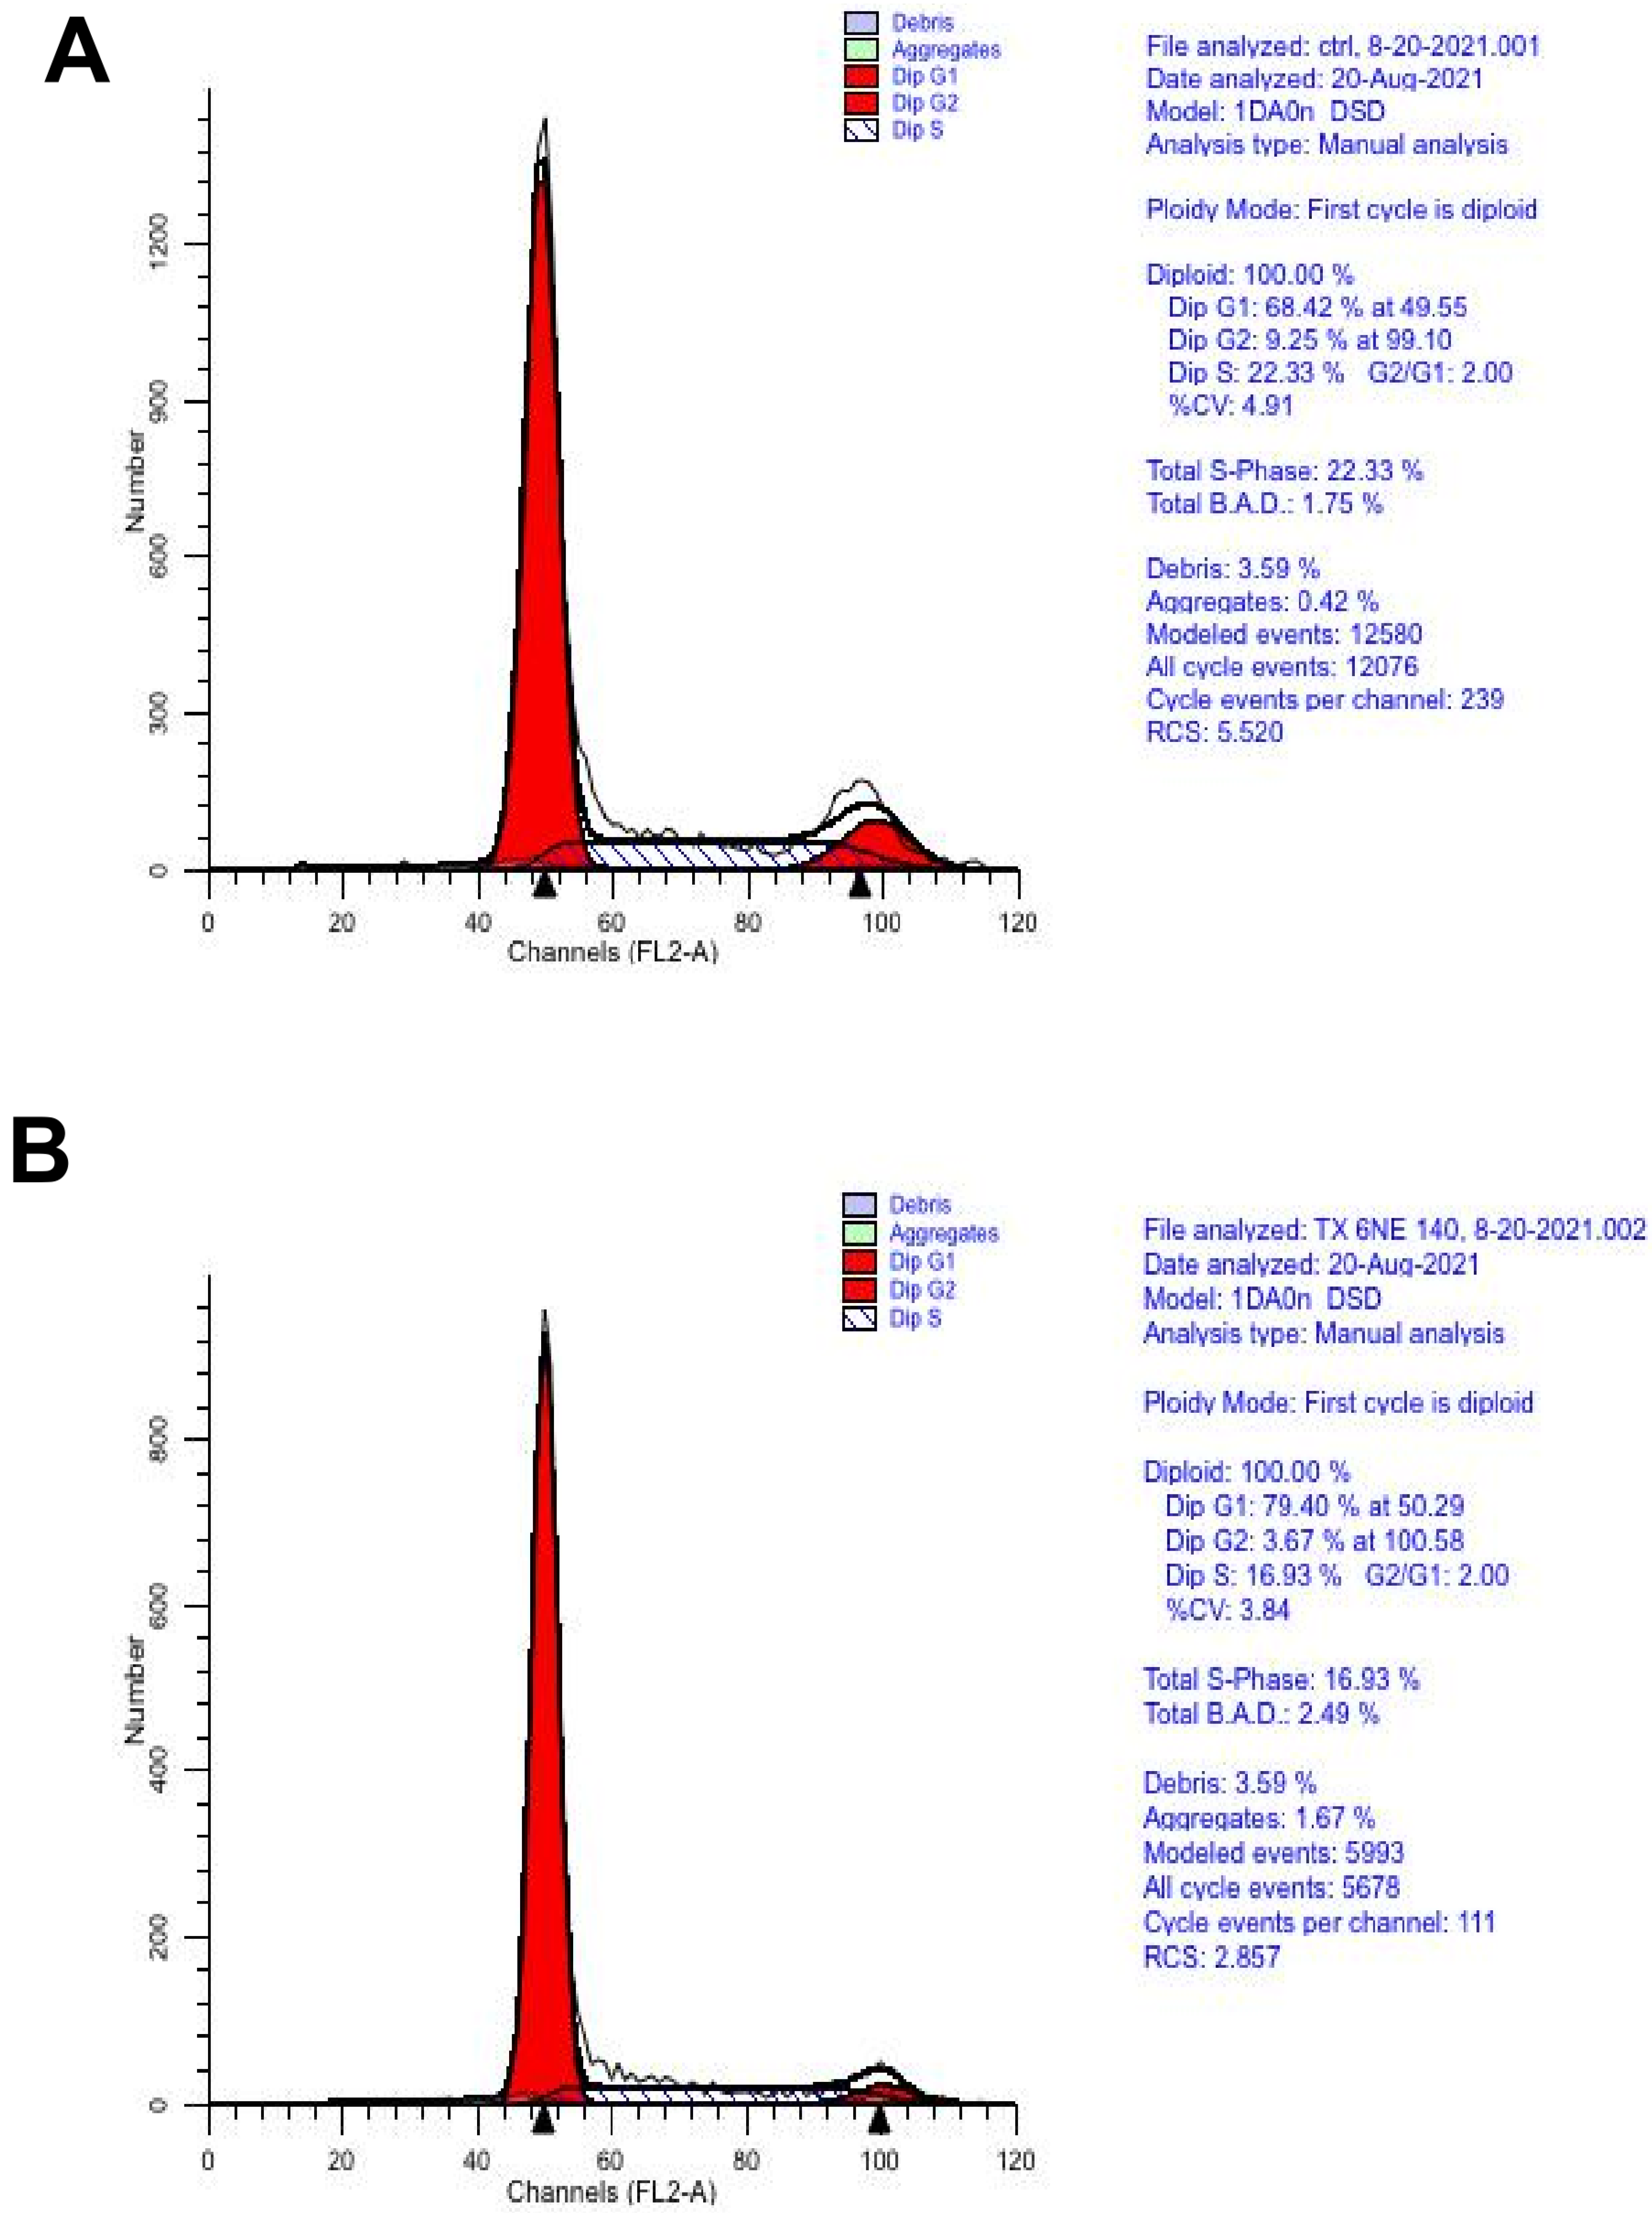
2.6. Cytometry
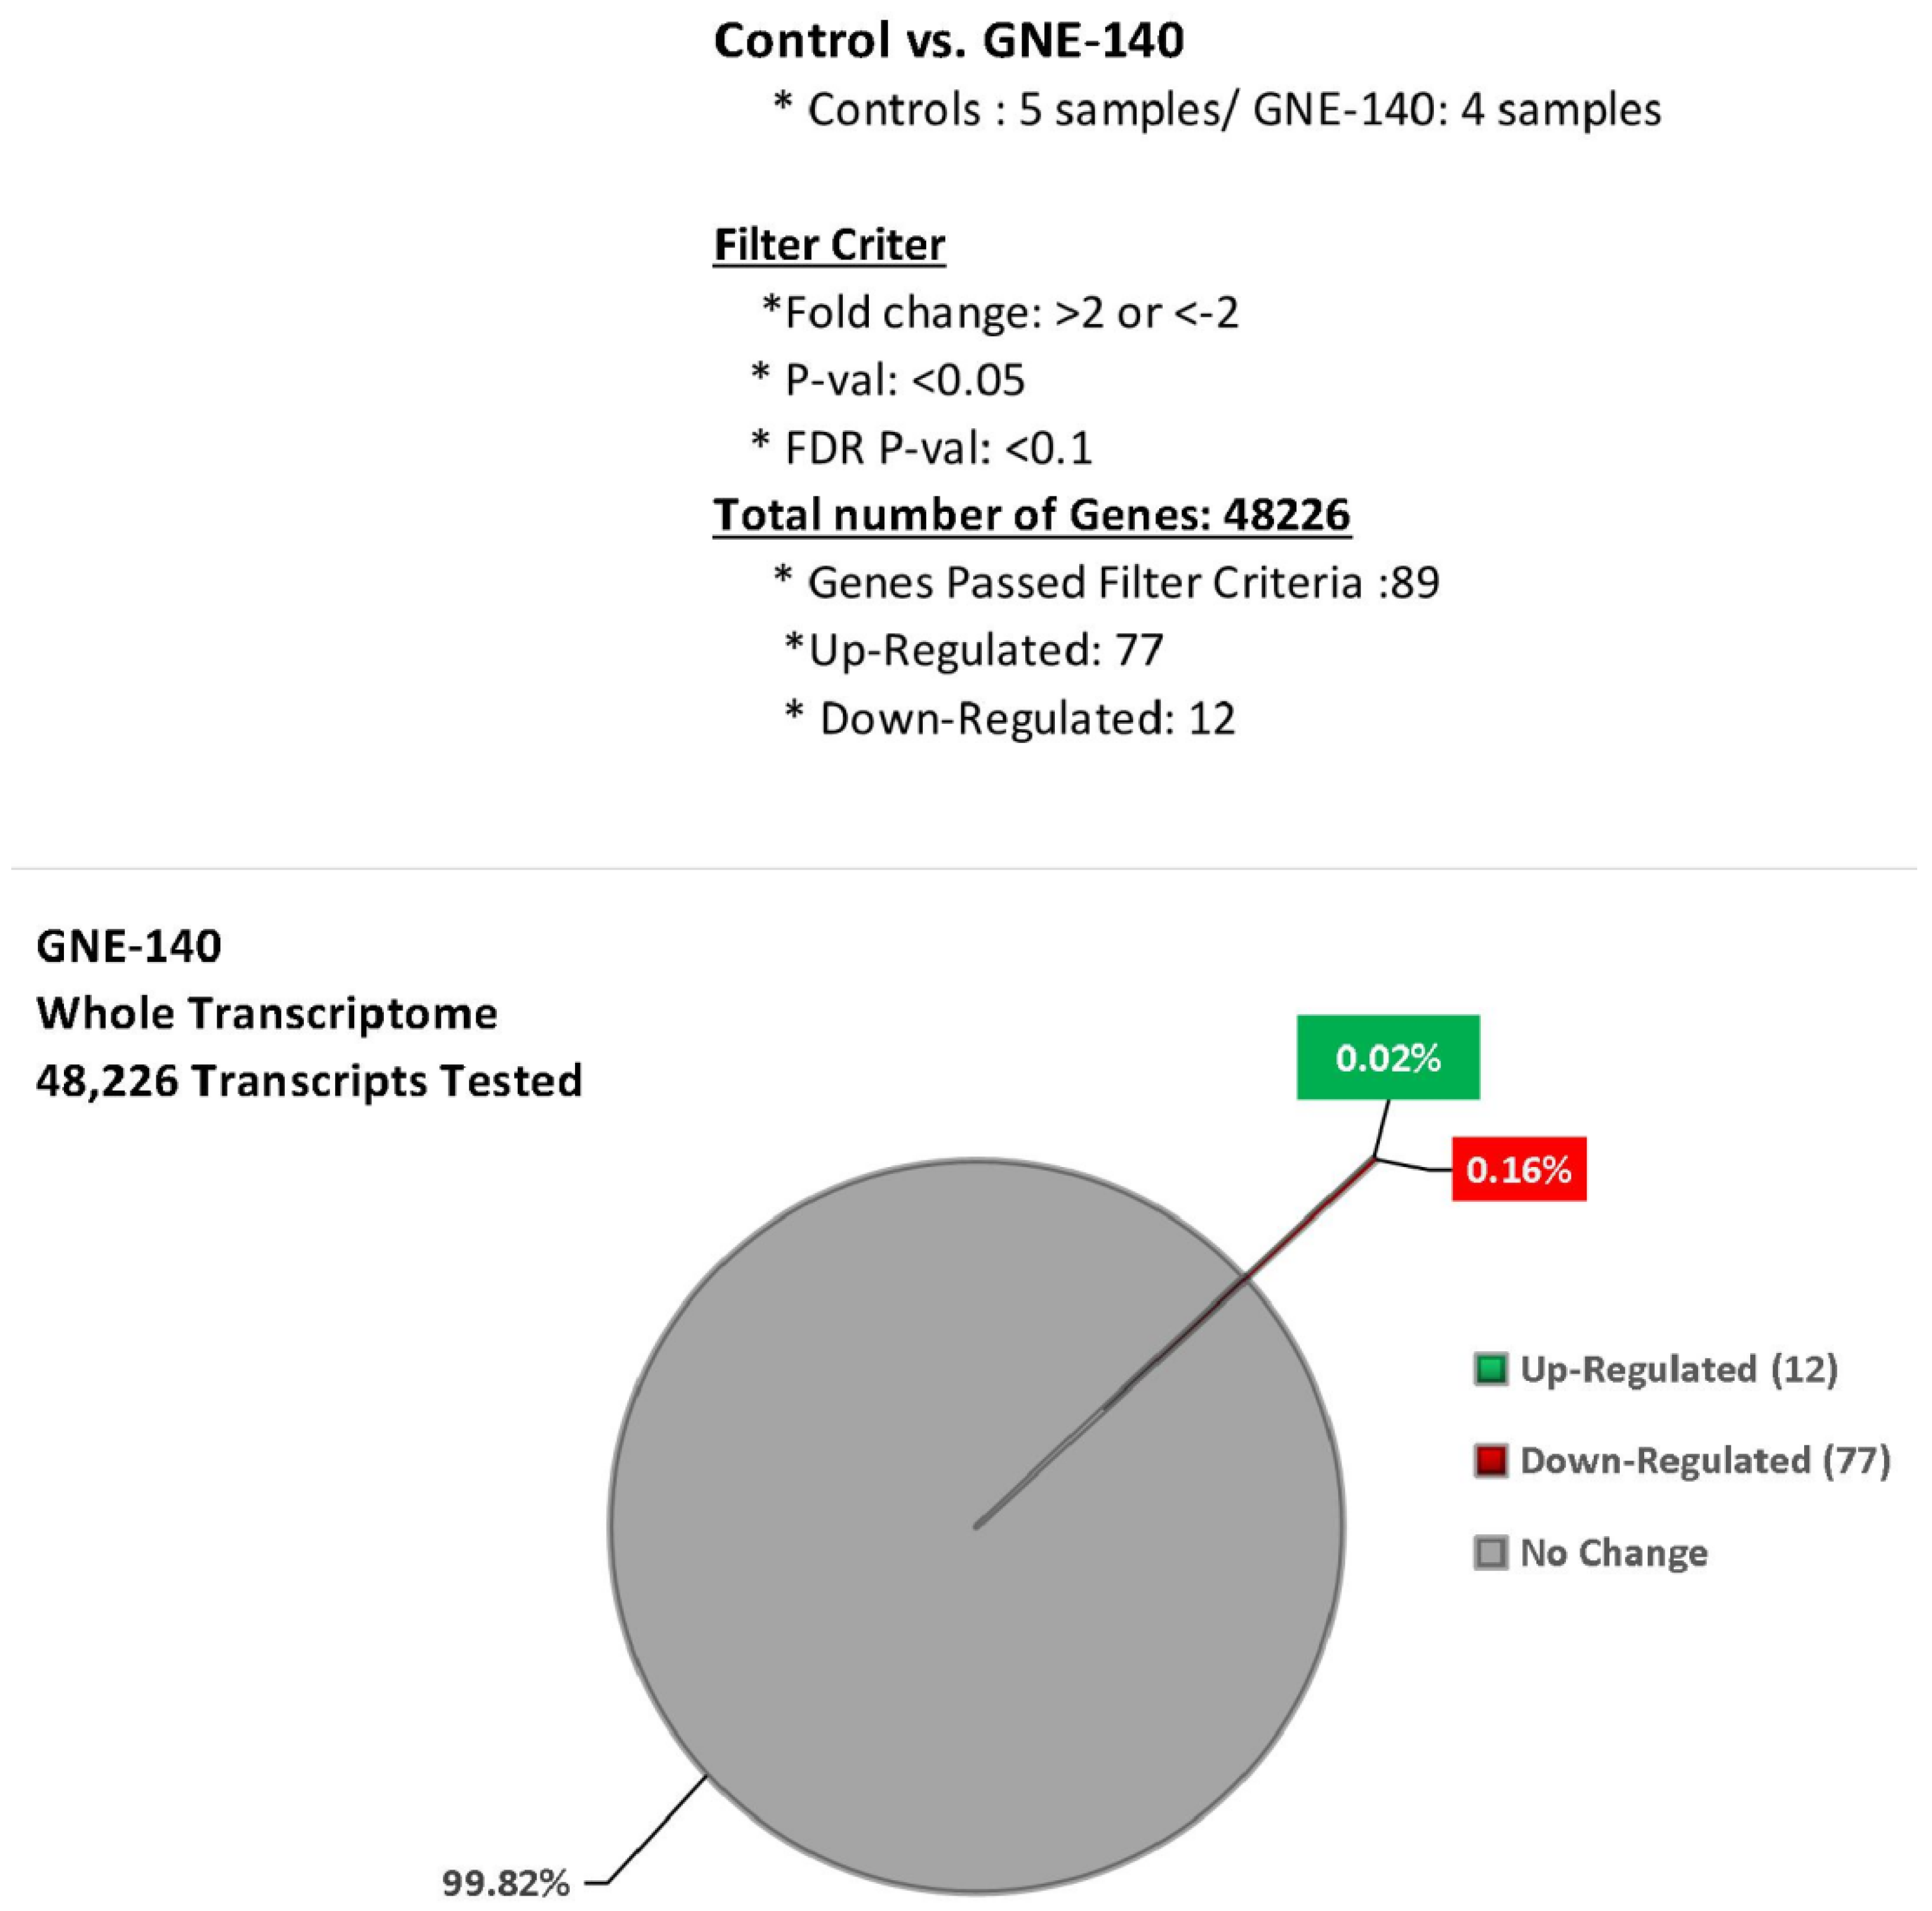
2.7. Microarray WT Human Datasets
2.8. Data Analysis
3. Results
4. Discussion
5. Conclusions
Author Contributions
Funding
Institutional Review Board Statement
Informed Consent Statement
Data Availability Statement
Acknowledgments
Conflicts of Interest
References
- Brezden-Masley, C.; Fathers, K.E.; Coombes, M.E.; Pourmirza, B.; Xue, C.; Jerzak, K.J. A population-based comparison of treatment patterns, resource utilization, and costs by cancer stage for Ontario patients with triple-negative breast cancer. Cancer Med. 2020, 9, 7548–7557. [Google Scholar] [CrossRef] [PubMed]
- Gómez-Miragaya, J.; Morán, S.; Calleja-Cervantes, M.E.; Collado-Sole, A.; Paré, L.; Gómez, A.; Serra, V.; Dobrolecki, L.E.; Lewis, M.T.; Diaz-Lagares, A.; et al. The Altered Transcriptome and DNA Methylation Profiles of Docetaxel Resistance in Breast Cancer PDX Models. Mol. Cancer Res. 2019, 17, 2063–2076. [Google Scholar] [CrossRef] [PubMed]
- Huang, X.; Li, X.; Xie, X.; Ye, F.; Chen, B.; Song, C.; Tang, H.; Xie, X. High expressions of LDHA and AMPK as prognostic biomarkers for breast cancer. Breast 2016, 30, 39–46. [Google Scholar] [CrossRef]
- Doyen, J.; Trastour, C.; Ettore, F.; Peyrottes, I.; Toussant, N.; Gal, J.; Ilc, K.; Roux, D.; Parks, S.K.; Ferrero, J.M.; et al. Expression of the hypoxia-inducible monocarboxylate transporter MCT4 is increased in triple negative breast cancer and correlates independently with clinical outcome. Biochem. Biophys. Res. Commun. 2014, 451, 54–61. [Google Scholar] [CrossRef]
- Feng, L.; E, L.L.; Soloveiv, M.M.; Wang, D.S.; Zhang, B.O.; Dong, Y.W.; Liu, H.C. Synergistic cytotoxicity of cisplatin and Taxol in overcoming Taxol resistance through the inhibition of LDHA in oral squamous cell carcinoma. Oncol. Lett. 2015, 9, 1827–1832. [Google Scholar] [CrossRef] [PubMed] [Green Version]
- Hou, L.; Zhao, Y.; Song, G.Q.; Ma, Y.H.; Jin, X.H.; Jin, S.L.; Fang, Y.H.; Chen, Y.C. Interfering cellular lactate homeostasis overcomes Taxol resistance of breast cancer cells through the microRNA-124-mediated lactate transporter (MCT1) inhibition. Cancer Cell Int. 2019, 19, 193. [Google Scholar] [CrossRef] [PubMed] [Green Version]
- Mack, N.; Mazzio, E.A.; Bauer, D.; Flores-Rozas, H.; Soliman, K.F. Stable shRNA Silencing of Lactate Dehydrogenase A (LDHA) in Human MDA-MB-231 Breast Cancer Cells Fails to Alter Lactic Acid Production, Glycolytic Activity, ATP or Survival. Anticancer. Res. 2017, 37, 1205–1212. [Google Scholar] [PubMed] [Green Version]
- Deiab, S.; Mazzio, E.; Messeha, S.; Mack, N.; Soliman, K.F. High-Throughput Screening to Identify Plant Derived Human LDH-A Inhibitors. Eur. J. Med. Plants 2013, 3, 603–615. [Google Scholar] [CrossRef] [PubMed]
- Deiab, S.; Mazzio, E.; Eyunni, S.; McTier, O.; Mateeva, N.; Elshami, F.; Soliman, K.F. 1,2,3,4,6-Penta-O-galloylglucose within Galla Chinensis Inhibits Human LDH-A and Attenuates Cell Proliferation in MDA-MB-231 Breast Cancer Cells. Evid. Based Complement Alternat. Med. 2015, 2015, 276946. [Google Scholar] [CrossRef] [Green Version]
- Mazzio, E.; Badisa, R.; Mack, N.; Cassim, S.; Zdralevic, M.; Pouyssegur, J.; Soliman, K.F.A. Whole-transcriptome Analysis of Fully Viable Energy Efficient Glycolytic-null Cancer Cells Established by Double Genetic Knockout of Lactate Dehydrogenase A/B or Glucose-6-Phosphate Isomerase. Cancer Genom. Proteom. 2020, 17, 469–497. [Google Scholar] [CrossRef]
- Zdralevic, M.; Brand, A.; Di Ianni, L.; Dettmer, K.; Reinders, J.; Singer, K.; Peter, K.; Schnell, A.; Bruss, C.; Decking, S.M.; et al. Double genetic disruption of lactate dehydrogenases A and B is required to ablate the “Warburg effect” restricting tumor growth to oxidative metabolism. J. Biol. Chem. 2018, 293, 15947–15961. [Google Scholar] [CrossRef] [Green Version]
- Brand, A.; Singer, K.; Koehl, G.E.; Kolitzus, M.; Schoenhammer, G.; Thiel, A.; Matos, C.; Bruss, C.; Klobuch, S.; Peter, K.; et al. LDHA-Associated Lactic Acid Production Blunts Tumor Immunosurveillance by T and NK Cells. Cell Metab. 2016, 24, 657–671. [Google Scholar] [CrossRef] [Green Version]
- Ngo, H.; Tortorella, S.M.; Ververis, K.; Karagiannis, T.C. The Warburg effect: Molecular aspects and therapeutic possibilities. Mol. Biol. Rep. 2015, 42, 825–834. [Google Scholar] [CrossRef] [PubMed]
- Boudreau, A.; Purkey, H.E.; Hitz, A.; Robarge, K.; Peterson, D.; Labadie, S.; Kwong, M.; Hong, R.; Gao, M.; Del Nagro, C.; et al. Metabolic plasticity underpins innate and acquired resistance to LDHA inhibition. Nat. Chem. Biol. 2016, 12, 779–786. [Google Scholar] [CrossRef] [PubMed]
- Hayes, C.; Donohoe, C.L.; Davern, M.; Donlon, N.E. The oncogenic and clinical implications of lactate induced immunosuppression in the tumour microenvironment. Cancer Lett. 2021, 500, 75–86. [Google Scholar] [CrossRef]
- Billiard, J.; Dennison, J.B.; Briand, J.; Annan, R.S.; Chai, D.; Colon, M.; Dodson, C.S.; Gilbert, S.A.; Greshock, J.; Jing, J.; et al. Quinoline 3-sulfonamides inhibit lactate dehydrogenase A and reverse aerobic glycolysis in cancer cells. Cancer Metab. 2013, 1, 19. [Google Scholar] [CrossRef] [Green Version]
- Massey, A.J. Modification of tumour cell metabolism modulates sensitivity to Chk1 inhibitor-induced DNA damage. Sci. Rep. 2017, 7, 40778. [Google Scholar] [CrossRef]
- Zhang, Y.; Li, J.; Wang, B.; Chen, T.; Chen, Y.; Ma, W. LDH-A negatively regulates dMMR in colorectal cancer. Cancer Sci. 2021, 112, 3050–3063. [Google Scholar] [CrossRef] [PubMed]
- Cheng, G.; Pi, Z.; Zheng, Z.; Liu, S.; Liu, Z.; Song, F. Magnetic nanoparticles-based lactate dehydrogenase microreactor as a drug discovery tool for rapid screening inhibitors from natural products. Talanta 2020, 209, 120554. [Google Scholar] [CrossRef] [PubMed]
- Granchi, C.; Fortunato, S.; Meini, S.; Rizzolio, F.; Caligiuri, I.; Tuccinardi, T.; Lee, H.Y.; Hergenrother, P.J.; Minutolo, F. Characterization of the Saffron Derivative Crocetin as an Inhibitor of Human Lactate Dehydrogenase 5 in the Antiglycolytic Approach against Cancer. J. Agric. Food Chem. 2017, 65, 5639–5649. [Google Scholar] [CrossRef] [PubMed]
- Cheng, S.Y.; Yang, Y.C.; Ting, K.L.; Wen, S.Y.; Viswanadha, V.P.; Huang, C.Y.; Kuo, W.W. Lactate dehydrogenase downregulation mediates the inhibitory effect of diallyl trisulfide on proliferation, metastasis, and invasion in triple-negative breast cancer. Environ. Toxicol. 2017, 32, 1390–1398. [Google Scholar] [CrossRef]
- Rupiani, S.; Guidotti, L.; Manerba, M.; Di Ianni, L.; Giacomini, E.; Falchi, F.; Di Stefano, G.; Roberti, M.; Recanatini, M. Synthesis of natural urolithin M6, a galloflavin mimetic, as a potential inhibitor of lactate dehydrogenase A. Org. Biomol. Chem. 2016, 14, 10981–10987. [Google Scholar] [CrossRef]
- Fang, X.L.; Akrofi, R.; Yang, H.; Chen, Q.Y. The NIR inspired nano-CuSMn(II) composites for lactate and glycolysis attenuation. Colloids Surf B Biointerfaces 2019, 181, 728–733. [Google Scholar] [CrossRef]
- Kim, E.Y.; Chung, T.W.; Han, C.W.; Park, S.Y.; Park, K.H.; Jang, S.B.; Ha, K.T. A Novel Lactate Dehydrogenase Inhibitor, 1-(Phenylseleno)-4-(Trifluoromethyl) Benzene, Suppresses Tumor Growth through Apoptotic Cell Death. Sci. Rep. 2019, 9, 3969. [Google Scholar] [CrossRef] [PubMed] [Green Version]
- Lu, N.N.; Weng, Z.Y.; Chen, Q.Y.; Boison, D.; Xiao, X.X.; Gao, J. Evaluation on the inhibition of pyrrol-2-yl ethanone derivatives to lactate dehydrogenase and anticancer activities. Spectrochim. Acta A Mol. Biomol. Spectrosc. 2016, 165, 21–25. [Google Scholar] [CrossRef] [PubMed] [Green Version]
- Nonomiya, Y.; Noguchi, K.; Katayama, K.; Sugimoto, Y. Novel pharmacological effects of poly (ADP-ribose) polymerase inhibitor rucaparib on the lactate dehydrogenase pathway. Biochem. Biophys. Res. Commun. 2019, 510, 501–507. [Google Scholar] [CrossRef]
- Gao, S.; Tu, D.N.; Li, H.; Jiang, J.X.; Cao, X.; You, J.B.; Zhou, X.Q. Pharmacological or genetic inhibition of LDHA reverses tumor progression of pediatric osteosarcoma. Biomed. Pharmacother. 2016, 81, 388–393. [Google Scholar] [CrossRef]
- Li, J.; Zhu, S.; Tong, J.; Hao, H.; Yang, J.; Liu, Z.; Wang, Y. Suppression of lactate dehydrogenase A compromises tumor progression by downregulation of the Warburg effect in glioblastoma. Neuroreport 2016, 27, 110–115. [Google Scholar] [CrossRef] [Green Version]
- Kim, D.; Koh, B.; Kim, K.R.; Kim, K.Y.; Jung, W.H.; Kim, H.Y.; Kim, S.; Dal Rhee, S. Anticancer effect of XAV939 is observed by inhibiting lactose dehydrogenase A in a 3-dimensional culture of colorectal cancer cells. Oncol. Lett. 2019, 18, 4858–4864. [Google Scholar] [CrossRef] [Green Version]
- Chung, T.W.; Kim, E.Y.; Han, C.W.; Park, S.Y.; Jeong, M.S.; Yoon, D.; Choi, H.J.; Jin, L.; Park, M.J.; Kwon, Y.J.; et al. Machilin A Inhibits Tumor Growth and Macrophage M2 Polarization Through the Reduction of Lactic Acid. Cancers 2019, 11, 963. [Google Scholar] [CrossRef] [PubMed] [Green Version]
- Cai, H.; Li, J.; Zhang, Y.; Liao, Y.; Zhu, Y.; Wang, C.; Hou, J. LDHA Promotes Oral Squamous Cell Carcinoma Progression Through Facilitating Glycolysis and Epithelial-Mesenchymal Transition. Front. Oncol. 2019, 9, 1446. [Google Scholar] [CrossRef]
- Muramatsu, H.; Sumitomo, M.; Morinaga, S.; Kajikawa, K.; Kobayashi, I.; Nishikawa, G.; Kato, Y.; Watanabe, M.; Zennami, K.; Kanao, K.; et al. Targeting lactate dehydrogenaseA promotes docetaxelinduced cytotoxicity predominantly in castrationresistant prostate cancer cells. Oncol. Rep. 2019, 42, 224–230. [Google Scholar] [PubMed]
- Koukourakis, M.I.; Kakouratos, C.; Kalamida, D.; Bampali, Z.; Mavropoulou, S.; Sivridis, E.; Giatromanolaki, A. Hypoxia-inducible proteins HIF1alpha and lactate dehydrogenase LDH5, key markers of anaerobic metabolism, relate with stem cell markers and poor post-radiotherapy outcome in bladder cancer. Int. J. Radiat Biol. 2016, 92, 353–363. [Google Scholar] [CrossRef] [PubMed]
- Hao, J.; Graham, P.; Chang, L.; Ni, J.; Wasinger, V.; Beretov, J.; Deng, J.; Duan, W.; Bucci, J.; Malouf, D.; et al. Proteomic identification of the lactate dehydrogenase A in a radioresistant prostate cancer xenograft mouse model for improving radiotherapy. Oncotarget 2016, 7, 74269–74285. [Google Scholar] [CrossRef] [Green Version]
- Umar, S.M.; Kashyap, A.; Kahol, S.; Mathur, S.R.; Gogia, A.; Deo, S.V.S.; Prasad, C.P. Prognostic and therapeutic relevance of phosphofructokinase platelet-type (PFKP) in breast cancer. Exp. Cell Res. 2020, 396, 112282. [Google Scholar] [CrossRef]
- Pouyssegur, J.; Zdralevic, M. Reply to Beltinger: Double genetic disruption of lactate dehydrogenases A and B is required to ablate the “Warburg effect” restricting tumor growth to oxidative metabolism. J. Biol. Chem. 2019, 294, 67. [Google Scholar] [CrossRef] [Green Version]
- Cassim, S.; Vucetic, M.; Zdralevic, M.; Pouyssegur, J. Warburg and Beyond: The Power of Mitochondrial Metabolism to Collaborate or Replace Fermentative Glycolysis in Cancer. Cancers 2020, 12, 1119. [Google Scholar] [CrossRef]
- Thornburg, J.M.; Nelson, K.K.; Clem, B.F.; Lane, A.N.; Arumugam, S.; Simmons, A.; Eaton, J.W.; Telang, S.; Chesney, J. Targeting aspartate aminotransferase in breast cancer. Breast Cancer Res. 2008, 10, R84. [Google Scholar] [CrossRef] [Green Version]
- Ranjbar-Navazi, Z.; Fathi, M.; Abdolahinia, E.D.; Omidi, Y.; Davaran, S. MUC-1 aptamer conjugated InP/ZnS quantum dots/nanohydrogel fluorescent composite for mitochondria-mediated apoptosis in MCF-7 cells. Mater. Sci. Eng. C Mater. Biol. Appl. 2021, 118, 111469. [Google Scholar] [CrossRef] [PubMed]
- El-Sisi, A.E.; Sokar, S.S.; Abu-Risha, S.E.; El-Mahrouk, S.R. Oxamate potentiates taxol chemotherapeutic efficacy in experimentally-induced solid ehrlich carcinoma (SEC) in mice. Biomed. Pharmacother. 2017, 95, 1565–1573. [Google Scholar] [CrossRef] [PubMed]
- Serganova, I.; Cohen, I.J.; Vemuri, K.; Shindo, M.; Maeda, M.; Mane, M.; Moroz, E.; Khanin, R.; Satagopan, J.; Koutcher, J.A.; et al. LDH-A regulates the tumor microenvironment via HIF-signaling and modulates the immune response. PLoS ONE 2018, 13, e0203965. [Google Scholar] [CrossRef] [PubMed] [Green Version]
- Renner, K.; Bruss, C.; Schnell, A.; Koehl, G.; Becker, H.M.; Fante, M.; Menevse, A.N.; Kauer, N.; Blazquez, R.; Hacker, L.; et al. Restricting Glycolysis Preserves T Cell Effector Functions and Augments Checkpoint Therapy. Cell Rep. 2019, 29, 135–150.e139. [Google Scholar] [CrossRef] [PubMed] [Green Version]
- Chen, P.; Zuo, H.; Xiong, H.; Kolar, M.J.; Chu, Q.; Saghatelian, A.; Siegwart, D.J.; Wan, Y. Gpr132 sensing of lactate mediates tumor-macrophage interplay to promote breast cancer metastasis. Proc. Natl. Acad. Sci. USA 2017, 114, 580–585. [Google Scholar] [CrossRef] [PubMed] [Green Version]


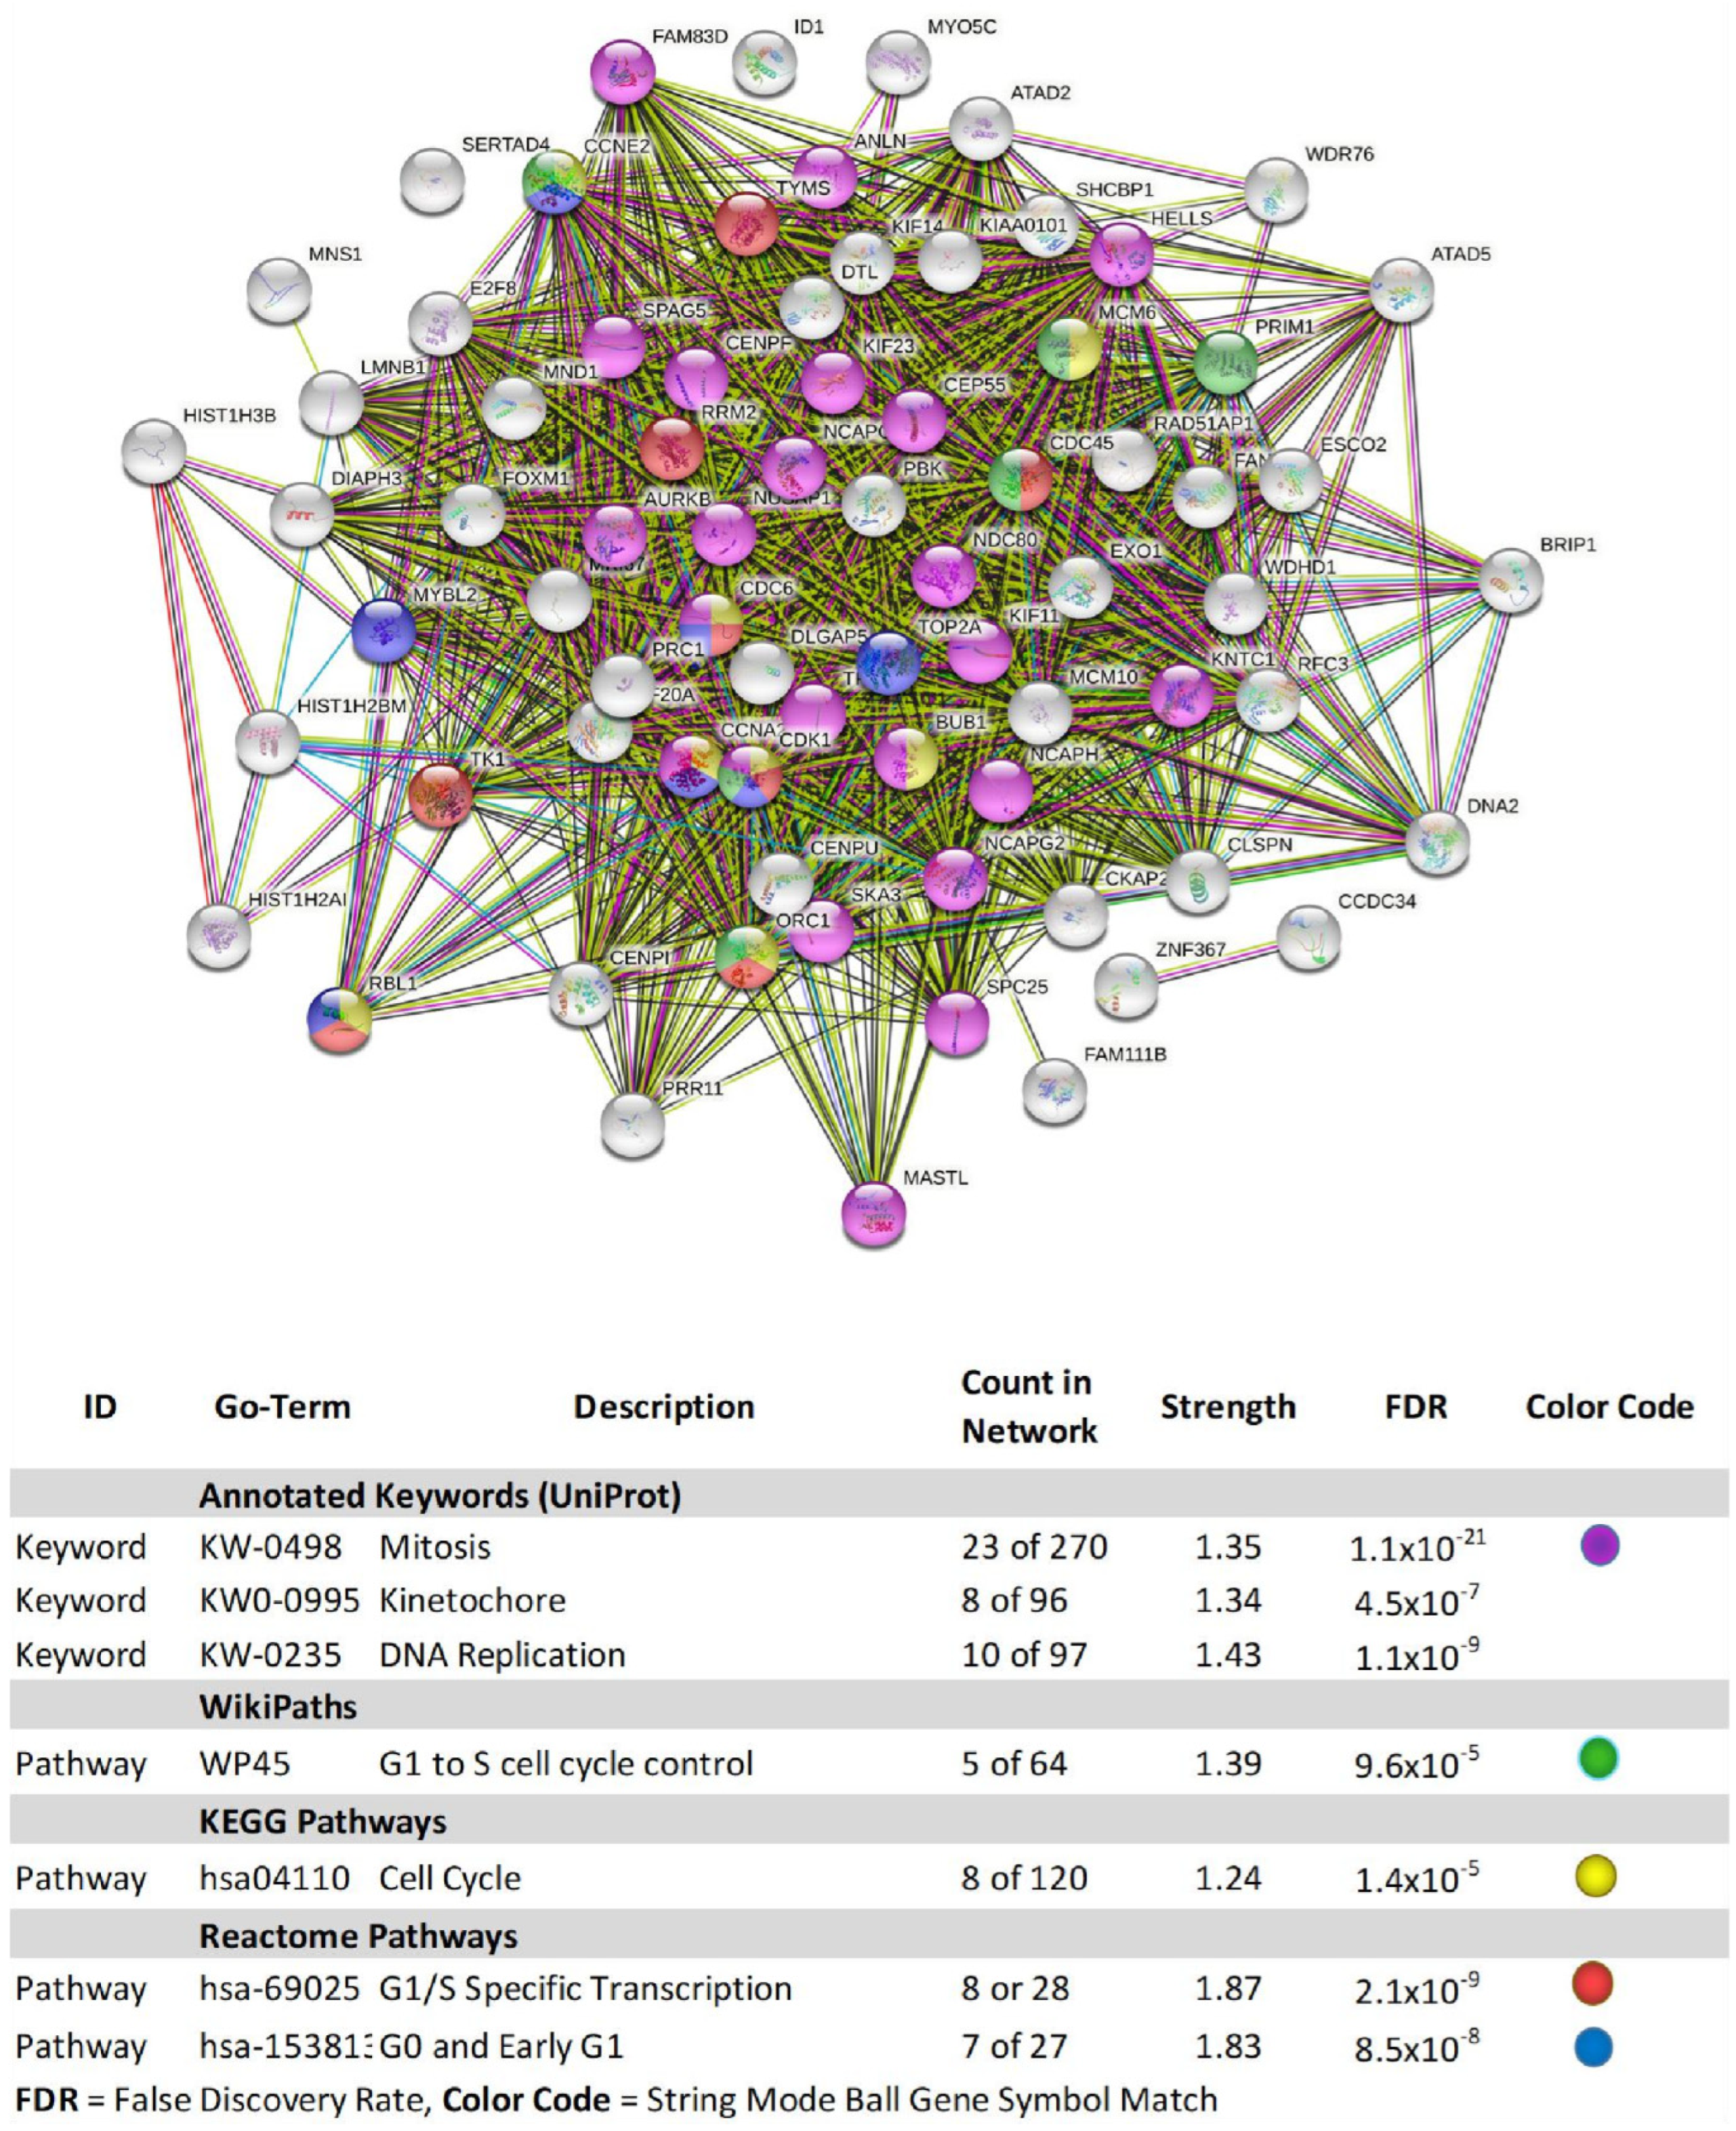
| Gene | Description | FC | p-Value | FDR p-Value | |
|---|---|---|---|---|---|
| 1 | SNORA38B | small nucleolar RNA, H/ACA box 38B | −6.59 | 2.58 × 10⁻⁵ | 0.0259 |
| 2 | BRIP1 | BRCA1 interacting protein C-terminal helicase 1 | −4.65 | 1.31 × 10⁻⁵ | 0.0257 |
| 3 | HIST1H3B | histone cluster 1, H3b | −4.40 | 6.50 × 10⁻⁶ | 0.0257 |
| 4 | PBK | PDZ binding kinase | −4.19 | 1.30 × 10⁻⁵ | 0.0257 |
| 5 | NDC80 | NDC80 kinetochore complex component | −3.94 | 3.70 × 10⁻⁶ | 0.0257 |
| 6 | NCAPG | non-SMC condensin I complex subunit G | −3.91 | 9.67 × 10⁻⁶ | 0.0257 |
| 7 | FANCI | Fanconi anemia complementation group I | −3.78 | 4.27 × 10⁻⁵ | 0.0355 |
| 8 | HIST1H2AI | histone cluster 1, H2ai | −3.62 | 3.74 × 10⁻⁵ | 0.0328 |
| 9 | EXO1 | exonuclease 1 | −3.51 | 1.09 × 10⁻⁵ | 0.0257 |
| 10 | ANLN | anillin actin binding protein | −3.49 | 8.98 × 10⁻⁶ | 0.0257 |
| 11 | TYMS | thymidylate synthetase | −3.49 | 8.01 × 10⁻⁶ | 0.0257 |
| 12 | SHCBP1 | SHC SH2-domain binding protein 1 | −3.46 | 3.54 ×10⁻⁵ | 0.0322 |
| 13 | FAM111B | family with sequence similarity 111, member B | −3.40 | 2.00 ×10⁻⁴ | 0.0676 |
| 14 | HIST1H2BM | histone cluster 1, H2bm | −3.39 | 6.37 ×10⁻⁵ | 0.0436 |
| 15 | CDK1 | cyclin-dependent kinase 1 | −3.35 | 1.47 ×10⁻⁵ | 0.0257 |
| 16 | DIAPH3 | diaphanous-related formin 3 | −3.28 | 1.24 × 10⁻⁵ | 0.0257 |
| 17 | MYBL2 | v-myb avian myeloblastosis viral oncogene homolog-like 2 | −3.28 | 1.62 × 10⁻⁵ | 0.0257 |
| 18 | KIF11 | kinesin family member 11 | −3.27 | 2.55 × 10⁻⁵ | 0.0259 |
| 19 | HELLS | helicase, lymphoid-specific | −3.16 | 2.00 × 10⁻⁴ | 0.0665 |
| 20 | RRM2 | ribonucleotide reductase M2 | −3.11 | 1.37 × 10⁻⁵ | 0.0257 |
| 21 | CENPU | centromere protein U | −3.09 | 1.78 × 10⁻⁵ | 0.0257 |
| 22 | CCNA2 | cyclin A2 | −3.06 | 2.40 × 10⁻⁵ | 0.0257 |
| 23 | TOP2A | topoisomerase (DNA) II alpha | −3.01 | 1.50 × 10⁻⁵ | 0.0257 |
| 24 | SKA3 | spindle and kinetochore associated complex subunit 3 | −2.99 | 1.83 × 10⁻⁵ | 0.0257 |
| 25 | CCNE2 | cyclin E2 | −2.97 | 4.83 × 10⁻⁵ | 0.0388 |
| 26 | ESCO2 | establishment of sister chromatid cohesion N-acetyltransferase 2 | −2.94 | 6.92 × 10⁻⁵ | 0.0445 |
| 27 | RAD51AP1 | RAD51 associated protein 1 | −2.91 | 2.00 × 10⁻⁴ | 0.0727 |
| 28 | CLSPN | claspin | −2.87 | 2.45 × 10⁻⁵ | 0.0257 |
| 29 | MKI67 | marker of proliferation Ki−67 | −2.85 | 7.56 × 10⁻⁵ | 0.0457 |
| 30 | TK1 | thymidine kinase 1, soluble | −2.85 | 1.76 × 10⁻⁵ | 0.0257 |
| 31 | MCM10 | minichromosome maintenance 10 replication initiation factors | −2.83 | 1.97 × 10⁻⁵ | 0.0257 |
| 32 | NUSAP1 | nucleolar and spindle associated protein 1 | −2.80 | 1.78 × 10⁻⁵ | 0.0257 |
| 33 | SPAG5 | sperm associated antigen 5 | −2.78 | 7.33 × 10⁻⁵ | 0.0457 |
| 34 | SERTAD4 | SERTA domain containing 4 | −2.75 | 2.00 × 10⁻⁴ | 0.0665 |
| 35 | MNS1 | meiosis-specific nuclear structural 1 | −2.74 | 7.71 × 10⁻⁵ | 0.0457 |
| 36 | DNA2 | DNA replication helicase/nuclease 2 | −2.73 | 1.00 × 10⁻⁴ | 0.0525 |
| 37 | CDC6 | cell division cycle 6 | −2.71 | 4.93 × 10⁻⁵ | 0.0389 |
| 38 | DLGAP5 | discs, large (Drosophila) homolog-associated protein 5 | −2.70 | 6.80 × 10⁻⁵ | 0.0443 |
| 39 | KIF14 | kinesin family member 14 | −2.70 | 2.68 × 10⁻⁵ | 0.0264 |
| 40 | CEP55 | centrosomal protein 55kDa | −2.69 | 3.39 × 10⁻⁵ | 0.0315 |
| 41 | ATAD5 | ATPase family, AAA domain containing 5 | −2.68 | 6.59 × 10⁻⁵ | 0.0439 |
| 42 | CDC45 | cell division cycle 45 | −2.67 | 9.80 × 10⁻⁵ | 0.0518 |
| 43 | ATAD2 | ATPase family, AAA domain containing 2 | −2.64 | 4.48 × 10⁻⁵ | 0.0367 |
| 44 | NCAPH | non-SMC condensin I complex subunit H | −2.61 | 8.88 × 10⁻⁵ | 0.049 |
| 45 | CCDC34 | coiled-coil domain containing 34 | −2.61 | 3.88 × 10⁻⁵ | 0.0328 |
| 46 | MND1 | meiotic nuclear divisions 1 | −2.55 | 3.00 × 10⁻⁴ | 0.0911 |
| 47 | DTL | denticleless E3 ubiquitin protein ligase homolog (Drosophila) | −2.54 | 5.08 × 10⁻⁵ | 0.0391 |
| 48 | NCAPG2 | non-SMC condensin II complex subunit G2 | −2.48 | 3.85 × 10⁻⁵ | 0.0328 |
| 49 | SPC25 | SPC25, NDC80 kinetochore complex component | −2.48 | 6.39 × 10⁻⁵ | 0.0436 |
| 50 | KNTC1 | kinetochore associated 1 | −2.43 | 5.36 × 10⁻⁵ | 0.0391 |
| 51 | WDR76 | WD repeat domain 76 | −2.42 | 7.45 × 10⁻⁵ | 0.0457 |
| 52 | E2F8 | E2F transcription factor 8 | −2.37 | 7.77 × 10⁻⁵ | 0.0457 |
| 53 | WDHD1 | WD repeat and HMG-box DNA binding protein 1 | −2.36 | 6.64 × 10⁻⁵ | 0.0439 |
| 54 | CKAP2L | cytoskeleton associated protein 2-like | −2.35 | 5.35 × 10⁻⁵ | 0.0391 |
| 55 | MASTL | microtubule associated serine/threonine kinase-like | −2.34 | 6.22 × 10⁻⁵ | 0.0436 |
| 56 | CENPI | centromere protein I | −2.32 | 1.00 × 10⁻⁴ | 0.0601 |
| 57 | PRIM1 | primase, DNA, polypeptide 1 (49kDa) | −2.31 | 7.12 × 10⁻⁵ | 0.0452 |
| 58 | FAM83D | family with sequence similarity 83, member D | −2.29 | 1.00 × 10⁻⁴ | 0.0542 |
| 59 | HIST2H3A; HIST2H3C | histone cluster 2, H3a; histone cluster 2, H3c | −2.28 | 1.00 × 10⁻⁴ | 0.0575 |
| 60 | KIF23 | kinesin family member 23 | −2.27 | 1.00 × 10⁻⁴ | 0.0575 |
| 61 | MCM6 | minichromosome maintenance complex component 6 | −2.27 | 1.00 × 10⁻⁴ | 0.0575 |
| 62 | ZNF367 | zinc finger protein 367 | −2.25 | 8.12 × 10⁻⁵ | 0.0466 |
| 63 | LMNB1 | lamin B1 | −2.23 | 1.00 × 10⁻⁴ | 0.0601 |
| 64 | BUB1 | BUB1 mitotic checkpoint serine/threonine kinase | −2.22 | 8.93 × 10⁻⁵ | 0.049 |
| 65 | ID1 | inhibitor of DNA binding 1, dominant negative helix-loop-helix protein | −2.21 | 1.00 × 10⁻⁴ | 0.0534 |
| 66 | CENPF | centromere protein F | −2.21 | 9.11 × 10⁻⁵ | 0.0493 |
| 67 | KIAA0101 | KIAA0101 | −2.21 | 2.00 × 10⁻⁴ | 0.0653 |
| 68 | AURKB | aurora kinase B | −2.20 | 2.00 × 10⁻⁴ | 0.0651 |
| 69 | TPX2 | TPX2, microtubule-associated | −2.18 | 1.00 × 10⁻⁴ | 0.0525 |
| 70 | ORC1 | origin recognition complex subunit 1 | −2.18 | 2.00 × 10⁻⁴ | 0.0653 |
| 71 | RBL1 | retinoblastoma-like 1 | −2.17 | 2.00 × 10⁻⁴ | 0.0789 |
| 72 | FOXM1 | forkhead box M1 | −2.17 | 1.00 × 10⁻⁴ | 0.0525 |
| 73 | KIF20A | kinesin family member 20A | −2.16 | 3.00 × 10⁻⁴ | 0.0885 |
| 74 | MYO5C | myosin VC | −2.10 | 3.00 × 10⁻⁴ | 0.0842 |
| 75 | PRC1 | protein regulator of cytokinesis 1 | −2.09 | 2.00 × 10⁻⁴ | 0.0772 |
| 76 | PRR11 | proline rich 11 | −2.05 | 2.00 × 10⁻⁴ | 0.0651 |
| 77 | RFC3 | replication factor C subunit 3 | −2.04 | 2.00 × 10⁻⁴ | 0.0667 |
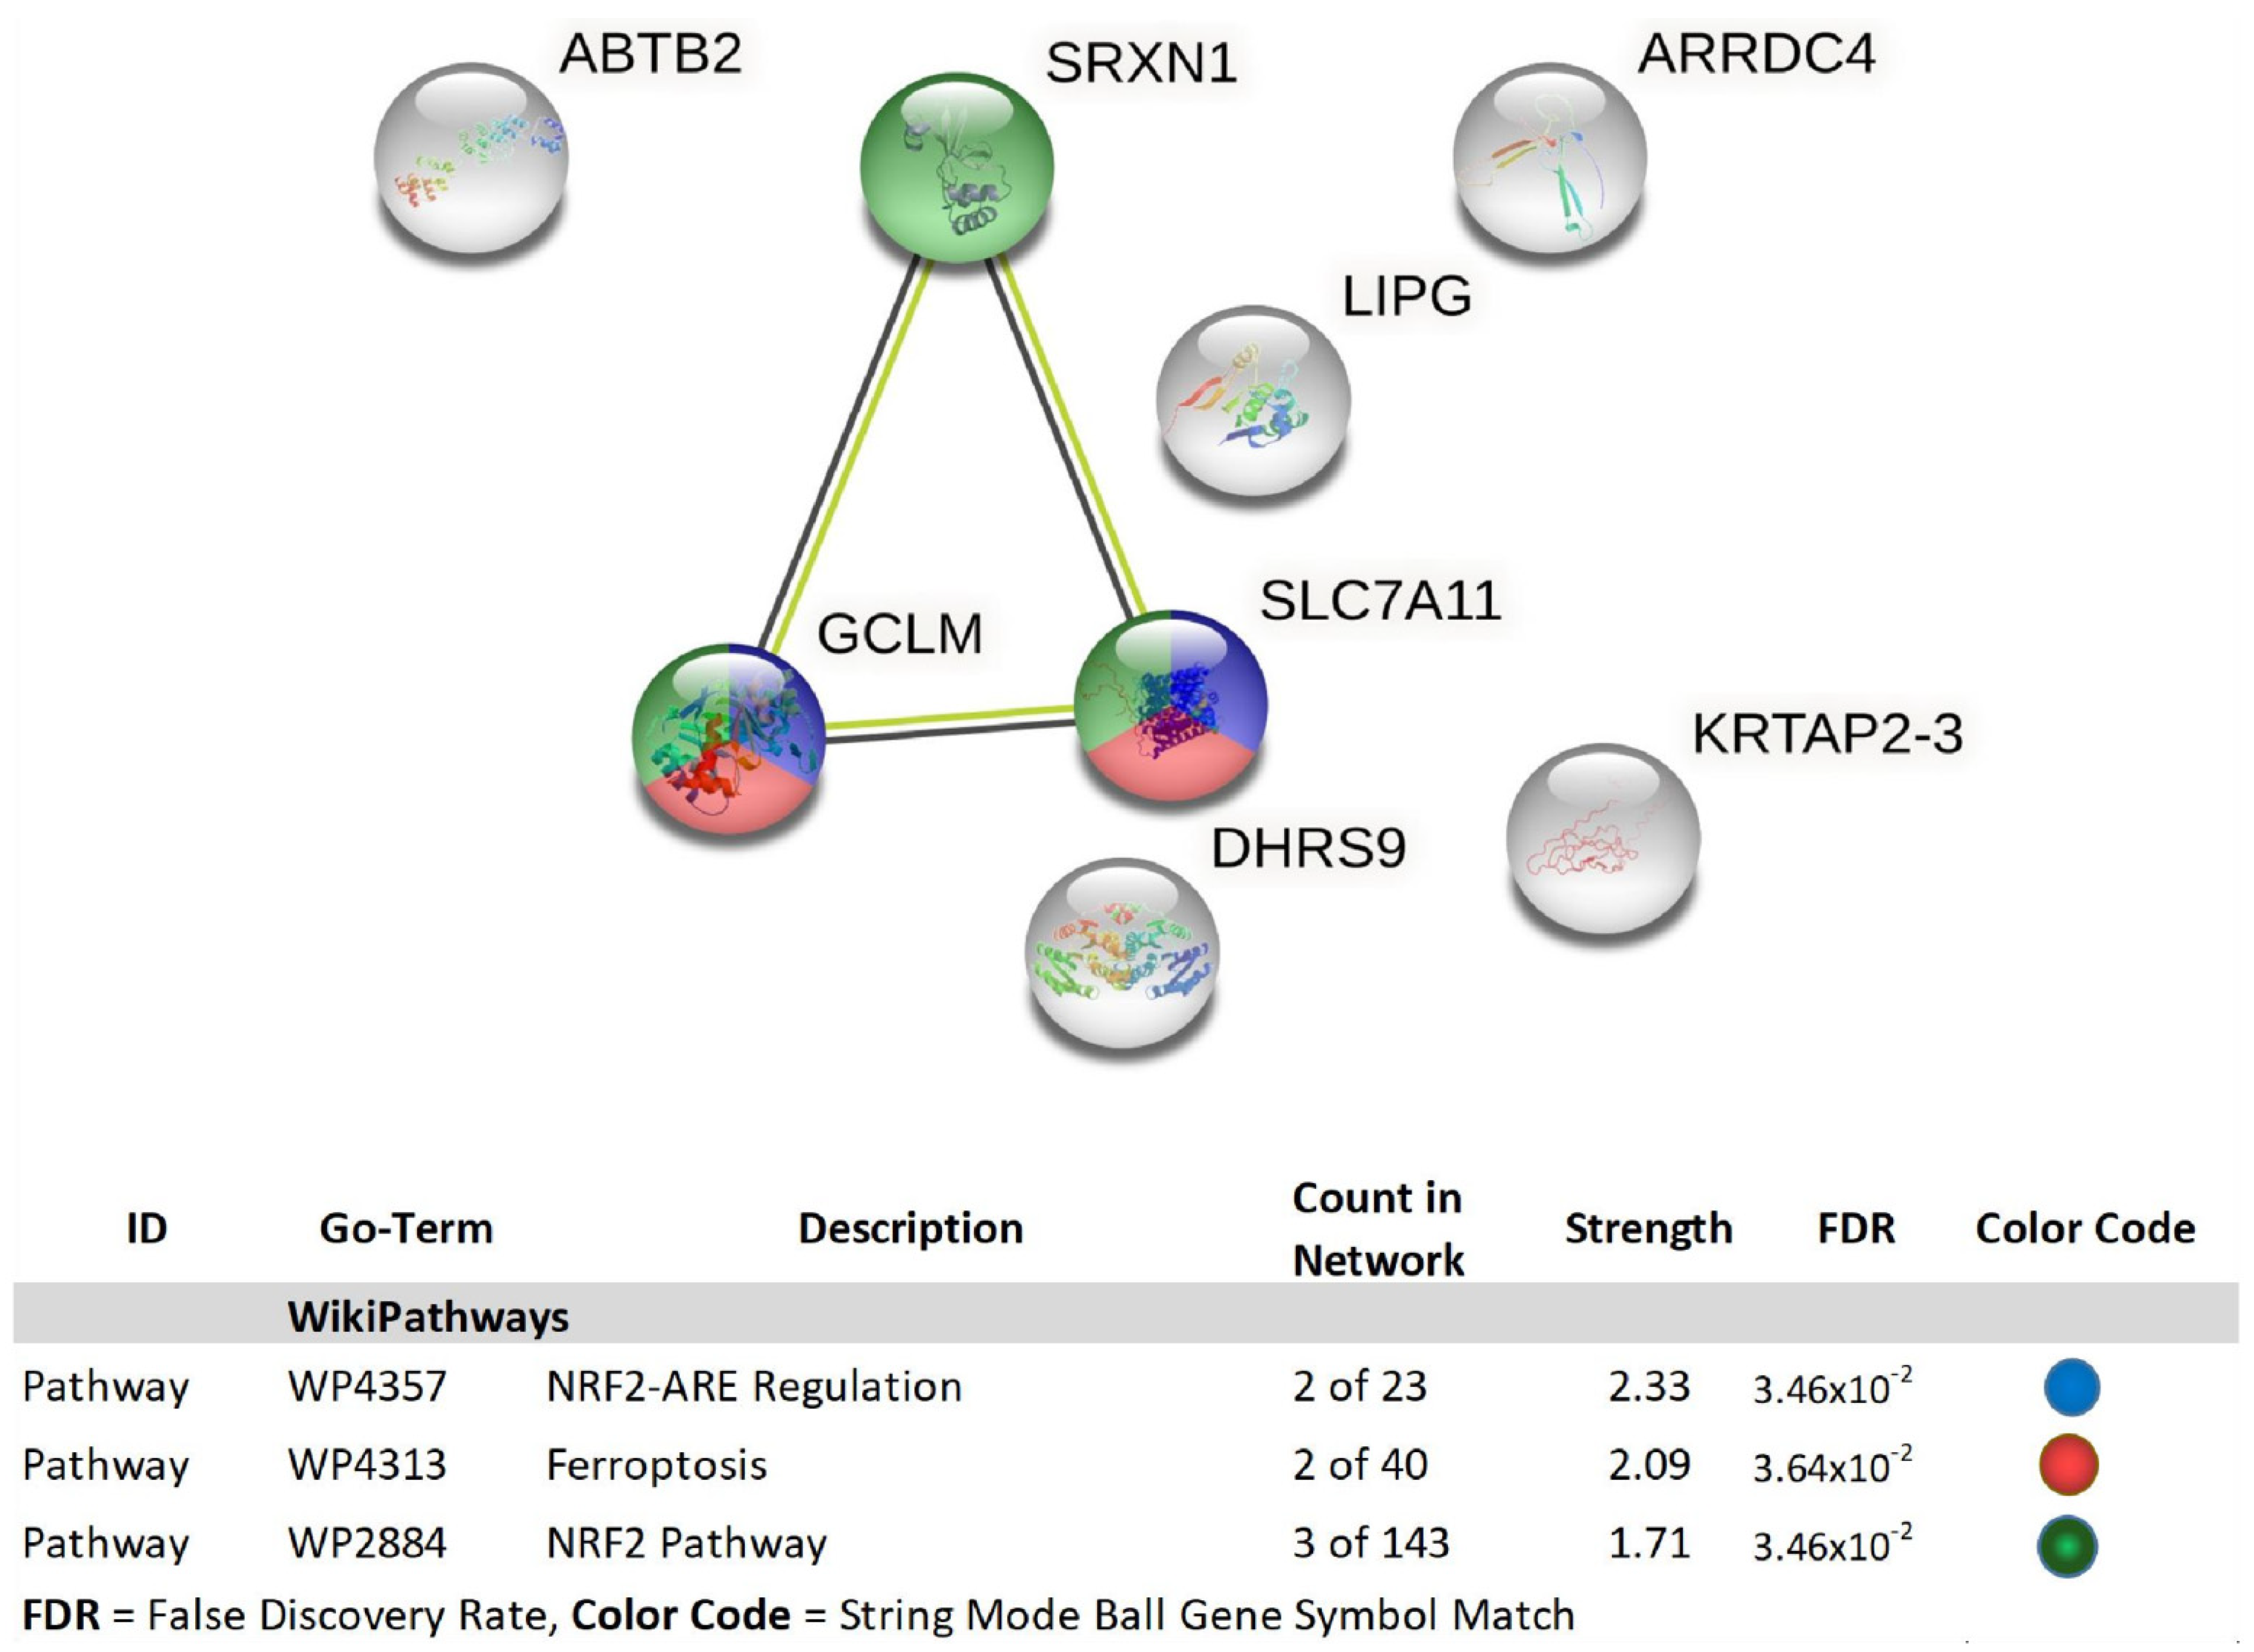
| 1 | GCLM | glutamate-cysteine ligase, modifier subunit | 2.01 | 3.00 × 10⁻⁴ | 0.0973 |
| 2 | ABTB2 | ankyrin repeat and BTB (POZ) domain containing 2 | 2.15 | 9.88 × 10⁻⁵ | 0.0518 |
| 3 | LOC344887 | NmrA-like family domain containing 1 pseudogene | 2.18 | 3.00 × 10⁻⁴ | 0.088 |
| 4 | SRXN1 | sulfiredoxin 1 | 2.24 | 1.00 × 10⁻⁴ | 0.0525 |
| 5 | LIPG | lipase, endothelial | 2.33 | 1.00 × 10⁻⁴ | 0.0549 |
| 6 | LUCAT1 | lung cancer associated transcript 1 (non-protein coding) | 2.39 | 5.67 × 10⁻⁵ | 0.0408 |
| 7 | DLGAP1-AS1 | DLGAP1 antisense RNA 1 | 2.39 | 2.00 × 10⁻⁴ | 0.0674 |
| 8 | SLC7A11 | solute carrier family 7 (anionic amino acid transporter light chain, xc-system), member 11 | 2.47 | 9.21 × 10⁻⁵ | 0.0493 |
| 9 | MIR22HG; MIR22 | MIR22 host gene; microRNA 22 | 2.58 | 2.00 × 10⁻⁴ | 0.0657 |
| 10 | KRTAP2-3 | keratin associated protein 2-3 | 2.88 | 3.14 × 10⁻⁵ | 0.0296 |
| 11 | DHRS9 | dehydrogenase/reductase (SDR family) member 9 | 2.94 | 2.06 × 10⁻⁵ | 0.0257 |
| 12 | ARRDC4 | arrestin domain containing 4 | 4.15 | 2.25 × 10⁻⁵ | 0.0257 |
Publisher’s Note: MDPI stays neutral with regard to jurisdictional claims in published maps and institutional affiliations. |
© 2021 by the authors. Licensee MDPI, Basel, Switzerland. This article is an open access article distributed under the terms and conditions of the Creative Commons Attribution (CC BY) license (https://creativecommons.org/licenses/by/4.0/).
Share and Cite
Mazzio, E.; Mack, N.; Badisa, R.B.; Soliman, K.F.A. Triple Isozyme Lactic Acid Dehydrogenase Inhibition in Fully Viable MDA-MB-231 Cells Induces Cytostatic Effects That Are Not Reversed by Exogenous Lactic Acid. Biomolecules 2021, 11, 1751. https://doi.org/10.3390/biom11121751
Mazzio E, Mack N, Badisa RB, Soliman KFA. Triple Isozyme Lactic Acid Dehydrogenase Inhibition in Fully Viable MDA-MB-231 Cells Induces Cytostatic Effects That Are Not Reversed by Exogenous Lactic Acid. Biomolecules. 2021; 11(12):1751. https://doi.org/10.3390/biom11121751
Chicago/Turabian StyleMazzio, Elizabeth, Nzinga Mack, Ramesh B. Badisa, and Karam F. A. Soliman. 2021. "Triple Isozyme Lactic Acid Dehydrogenase Inhibition in Fully Viable MDA-MB-231 Cells Induces Cytostatic Effects That Are Not Reversed by Exogenous Lactic Acid" Biomolecules 11, no. 12: 1751. https://doi.org/10.3390/biom11121751
APA StyleMazzio, E., Mack, N., Badisa, R. B., & Soliman, K. F. A. (2021). Triple Isozyme Lactic Acid Dehydrogenase Inhibition in Fully Viable MDA-MB-231 Cells Induces Cytostatic Effects That Are Not Reversed by Exogenous Lactic Acid. Biomolecules, 11(12), 1751. https://doi.org/10.3390/biom11121751