1. Introduction
Establishing a causal relationship between physical properties, mechanisms, and events is important for understanding plasma dynamics, validating models, and isolating the factors that influence plasma conditions. Methods for doing this are not new, and we do not delve into the subject beyond the familiar level. However, we cite van Milligen et al. [
1], who employed the transfer entropy technique, measuring information transfer to conclude that the causal relationship between nonlinearly interacting fields in complex systems can be unraveled, as demonstrated in an electron-cyclotron-resonance-heated stellarator plasma [
2]. In our paper, we claim that our documentation of causality unambiguously exceeds the minimum threshold of credible fluctuation correlation, with the help of bispectral analysis. This paper includes a brief overview (
Section 2), ample technique description (
Section 3 and
Section 4), and key experimental results and interpretation (
Section 5) of two categories of plasma fluctuations: one driven by magnetic field-aligned current [
3] and the other driven by shear in plasma flow [
4], where the shear and the flow are both perpendicular to the magnetic field and to each other.
Our objective is to distinguish two parent waves from the daughter wave in a broadband spectrum of three-wave interactions so that coupling and cause and effect can be recognized. To establish signatures of actual wave–wave coupling and to distinguish these from artifact signatures, we establish that the (broadband, ion-cyclotron range, shear-driven) inhomogeneous energy-density driven spectrum, as evidenced by plasma fluctuation data from the WVU-Q machine [
5,
6], is shown to exhibit a degree of coupling to various spectral components of the lower-frequency drift-wave oscillations [
7] that is absent in the case of the (narrowband, ion-cyclotron range, current-driven) electrostatic ion-cyclotron spectrum. First, we describe the algorithm used to identify the parent waves and fraction of power associated with three-wave coupling.
3. Causality Determination
Now we apply these concepts of nonlinear coupling to interpreting the roles of waves associated with narrowband and broadband turbulence and to making comparisons. Specifically, we describe an algorithm to identify the parent waves involved in a quadratic coupling interaction and to tabulate the signatures of such an interaction in
Table 1 and
Table 2.
A non-zero value of B(
ωj,
ωk) indicates a quadratic coupling of two modes, but the parent modes are not necessarily ω
j and ω
k (see
Table 2). Since quadratic coupling produces both a sum and a difference frequency, other candidate pairs (
ωj with
ωj +
ωk and
ωk with
ωj +
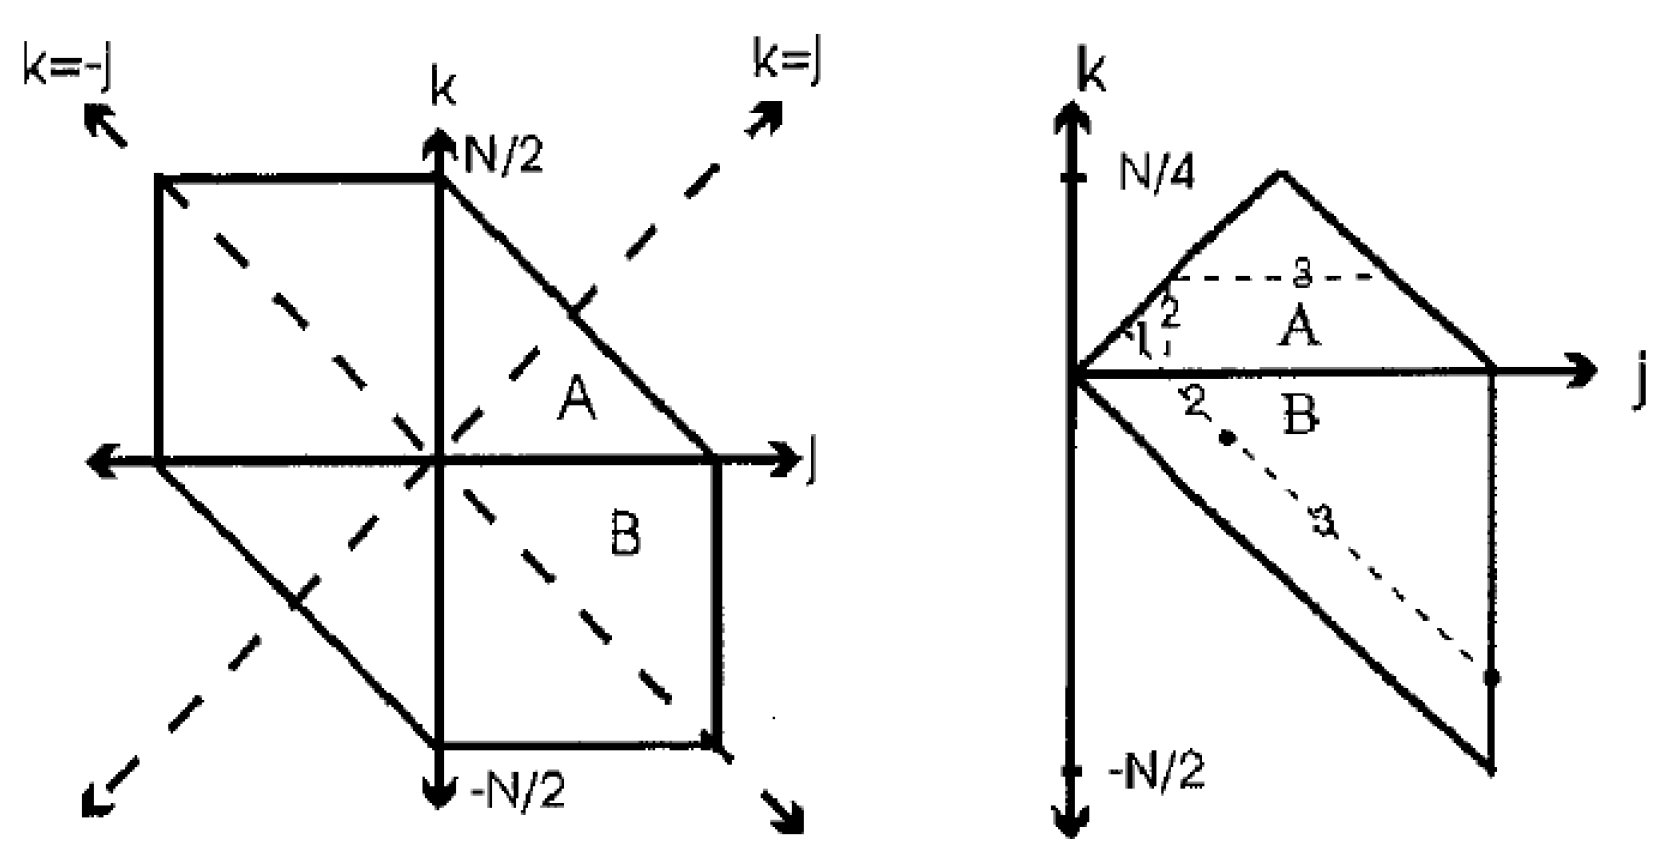
ωk) can be investigated by looking for bispectrum peaks at the corresponding sum and difference frequencies. The generally accepted convention of plotting the bispectrum over a triangular region where
ωj > _0,
ωj >
ωk, and
ωj <
ωj max −
ωk exploits certain symmetry properties. In this condensed representation, any observed bispectral feature represents a three-wave interaction involving the modes on the axes, say,
ωj and
ωk, and a third (daughter) mode at the sum,
ωj +
ωk. The three-wave interaction involving a daughter at the difference frequency would be represented, in this case, by a bispectral feature at (
ωk, ωj − ωk), where again, the sum of the mode locations gives the third (daughter) wave involved in the interaction, i.e.,
ωj (see first row of
Table 1).
From Equation (1), the bispectrum is non-zero if the spectral features at ω
j, ω
k and their
sum frequency
ωj + ωk are phase-correlated. Thus, we must inspect all the possible
difference interactions between those three waves to find the parents. In
Table 1, row 1, for example, a feature at (
ωj, ωk) represents the three-wave relationship with the parents and the “sum-frequency daughter” (column 4). A feature at (
ωk, ωj − ωk) represents the three-wave relationship with the “difference-frequency daughter” (column 5).
For a parent at ωj and another parent at frequency ωk, we would expect to see bispectrum peaks at (ωj, ωj) or (ωk, ωk) only if harmonics of the parents were present in the signal. Because we plot the bispectrum only in the region where ωj > ωk, the only plotted (non-negative) difference-frequency daughter is at ωj − ωk.
While helpful in understanding where bispectral features can be expected when the parent frequencies are known,
Table 1 does not help us evaluate experimental data where the identity of the parent waves might not be known in advance. To facilitate the identification of parent waves, we found it helpful to rearrange
Table 1 for a given bispectral feature at coordinates (ω
j, ω
k).
The first row of
Table 2 means a bispectral feature at
(ωk,
ωj − ωk) and represents a difference-frequency–daughter interaction (thus the (
ωj,
ωk) feature represents the sum-frequency–daughter interaction), whereas the second and third rows correspond to sum-frequency–daughter interactions (meaning the (
ωj,
ωk) feature represents the difference-frequency–daughter interaction). There are two options listed in the first row of
Table 2, because the bispectrum is typically plotted only in the region where the first coordinate is larger than the second (see
Figure 1), so the order of coordinates depends on the relative magnitudes of ω
j and ω
k. For example, in row 1, if ω
j > 2ω
k, the (ω
k, ω
j − ω
k) point would not be plotted.
Accordingly, for a given spectral feature in a fast Fourier transform (FFT), the bispectrum should make it possible to determine if that feature corresponds to an independent mode or is the result of nonlinear coupling between two waves. In practice, the identification of coupled modes is complicated by the broadness of spectral peaks typical of a nonstationary or inhomogeneous plasma process, and the occasional absence of one of the daughters (there is no guarantee that both daughters are resonant or are natural modes of the system), but it is often possible to identify the parents of the interaction, even within a turbulent-looking FFT, from the bispectrum with the help of
Table 2. This will be demonstrated with a test signal in
Section 4 and experimental plasma data in
Section 5.
4. Test Signal Tutorial
For example, consider a test signal (from [
8]) comprised of three cosine waves with random phase angles and
ωa + ωb = ωc:
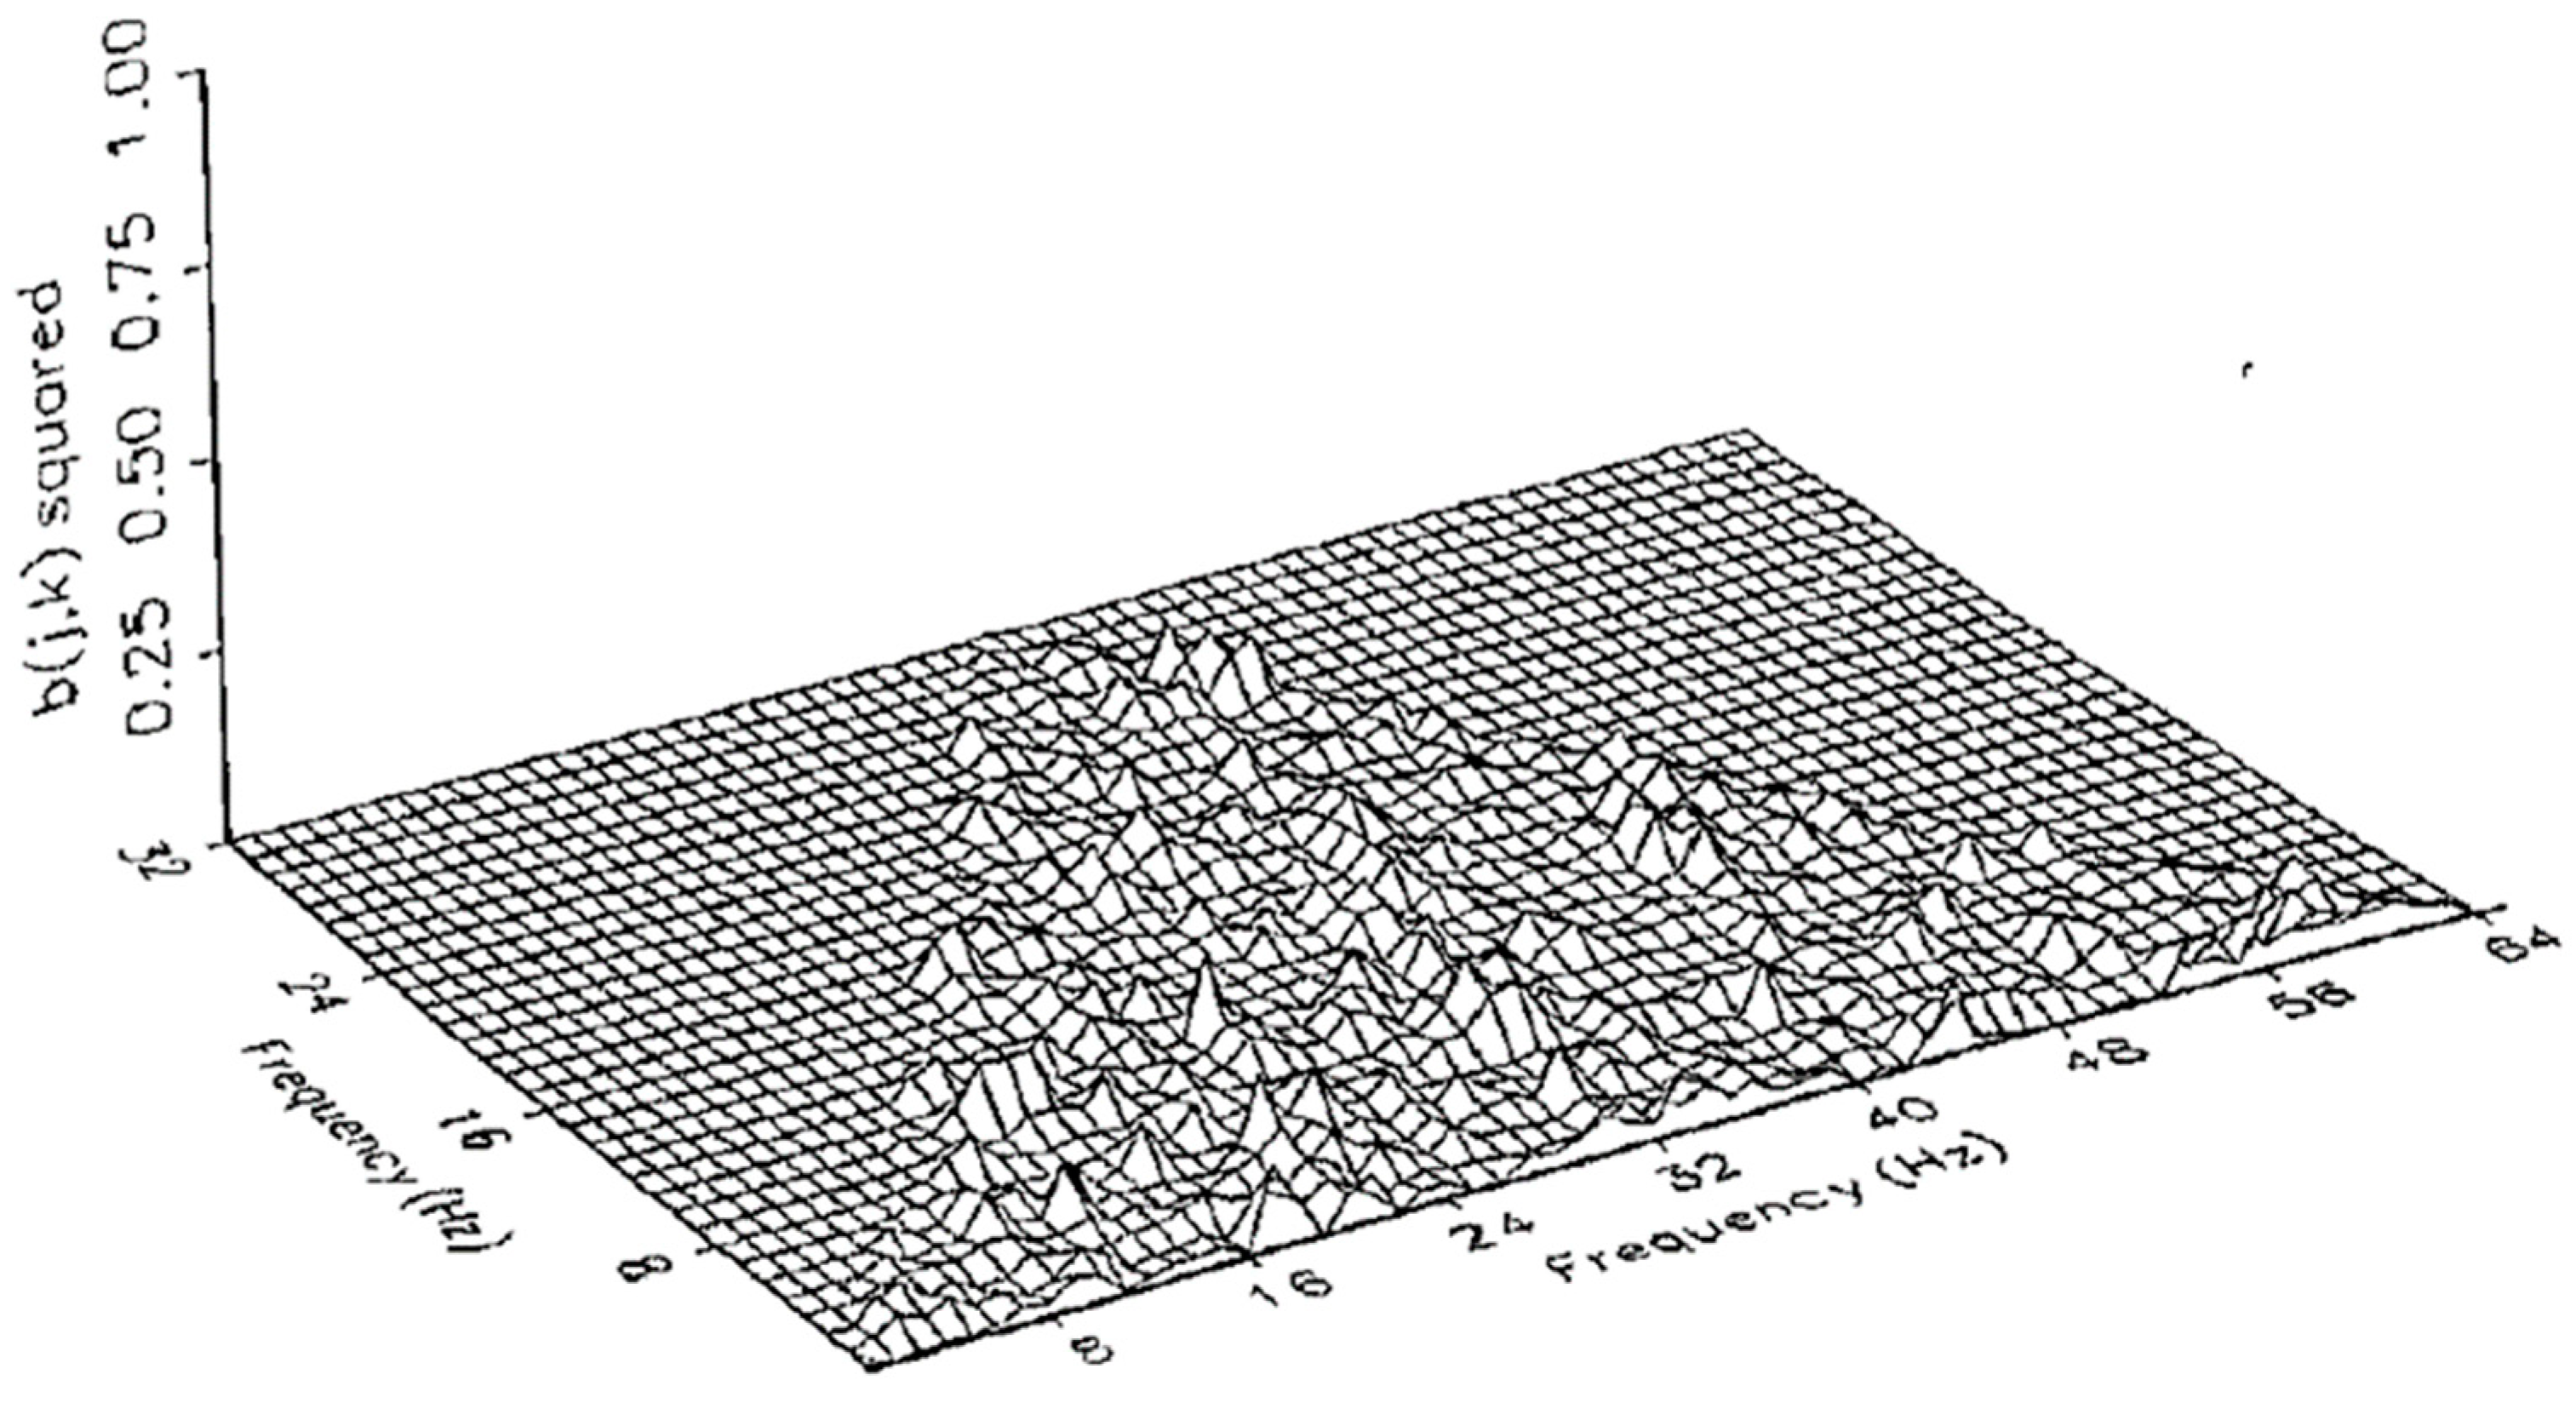
In sum, 64 records of 128-point time series were generated with random noise added to each record. Phase-incoherent waves such as this produce no bispectrum peaks, even if the wavenumber selection rule
ωa + ωb = ωc is met (
Figure 2).
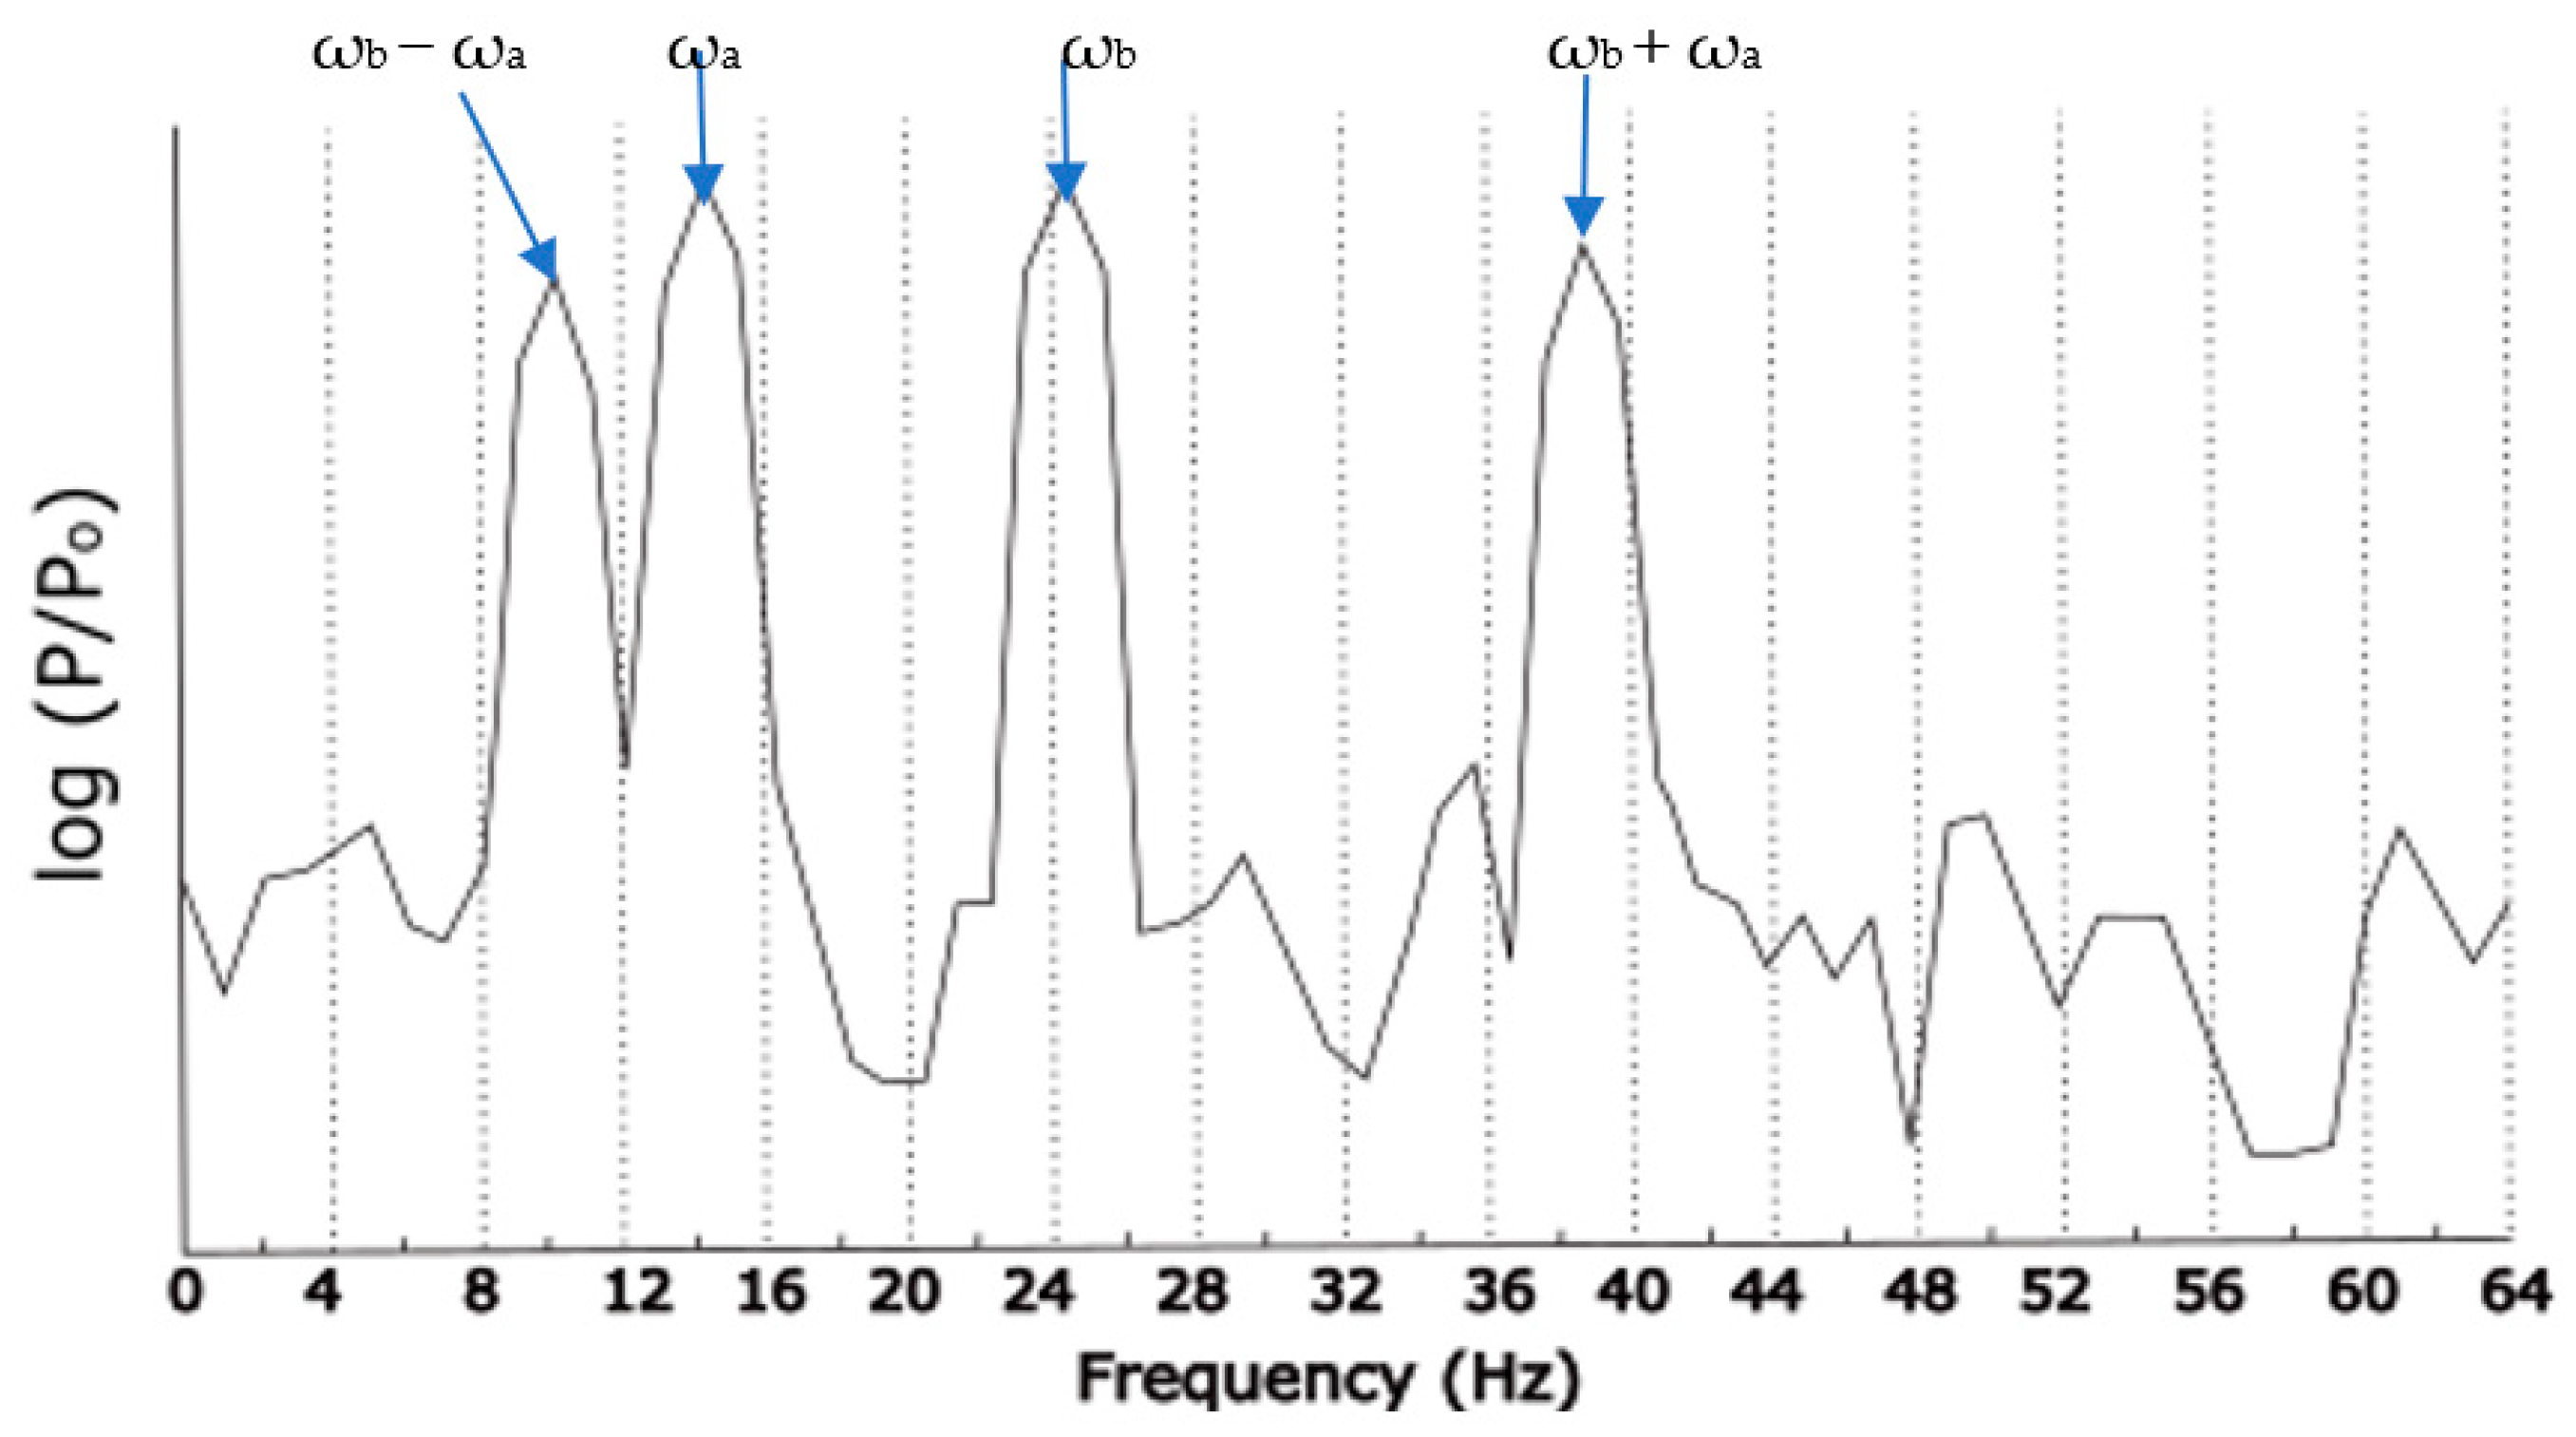
However, if we use a test signal that includes coupled cosines (see
Figure 3), such as:
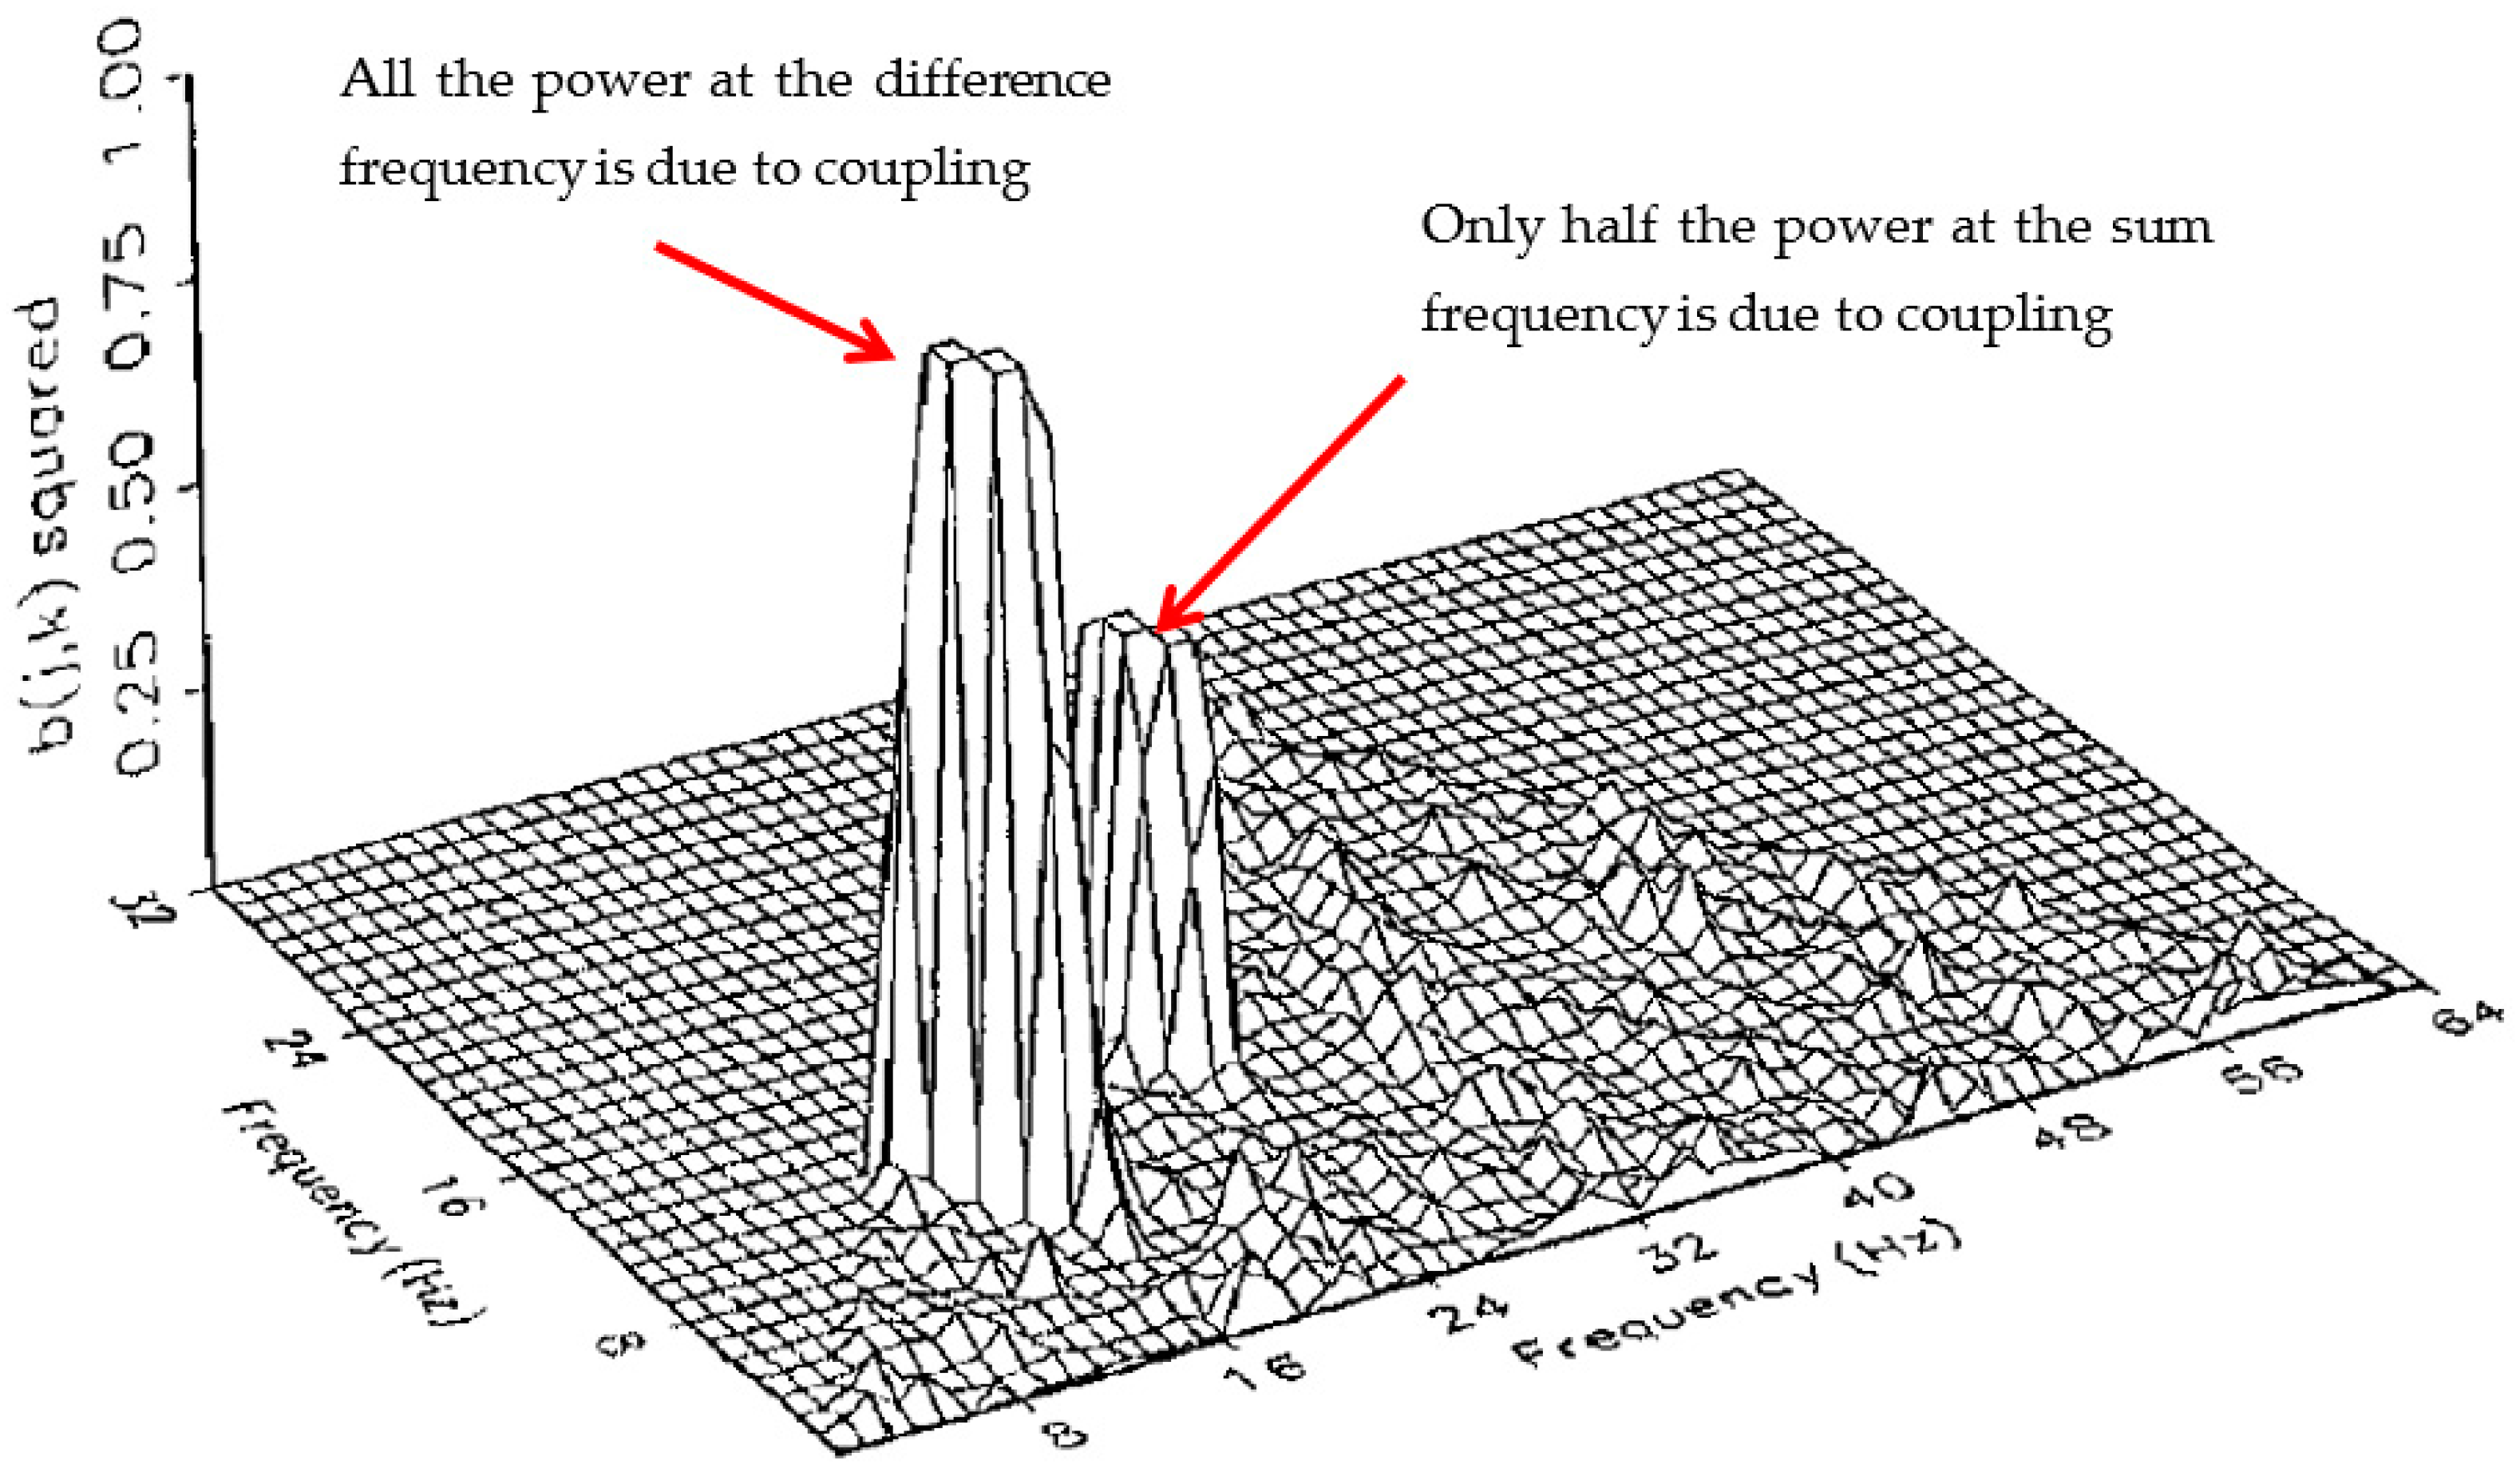
Then the bispectrum would produce peaks proportional to the fraction of power due to coupling (see
Figure 4).
This is because
cos(
a)
cos(
b) = ½ [
cos(
a +
b) +
cos(
a −
b)], so we would expect Fourier components at the sum and difference frequencies as shown in
Figure 3, but only half of the power at the sum frequency
ωc is due to coupling (the other half is not phase-coherent), so the amplitude of b
2 is 0.5 there.
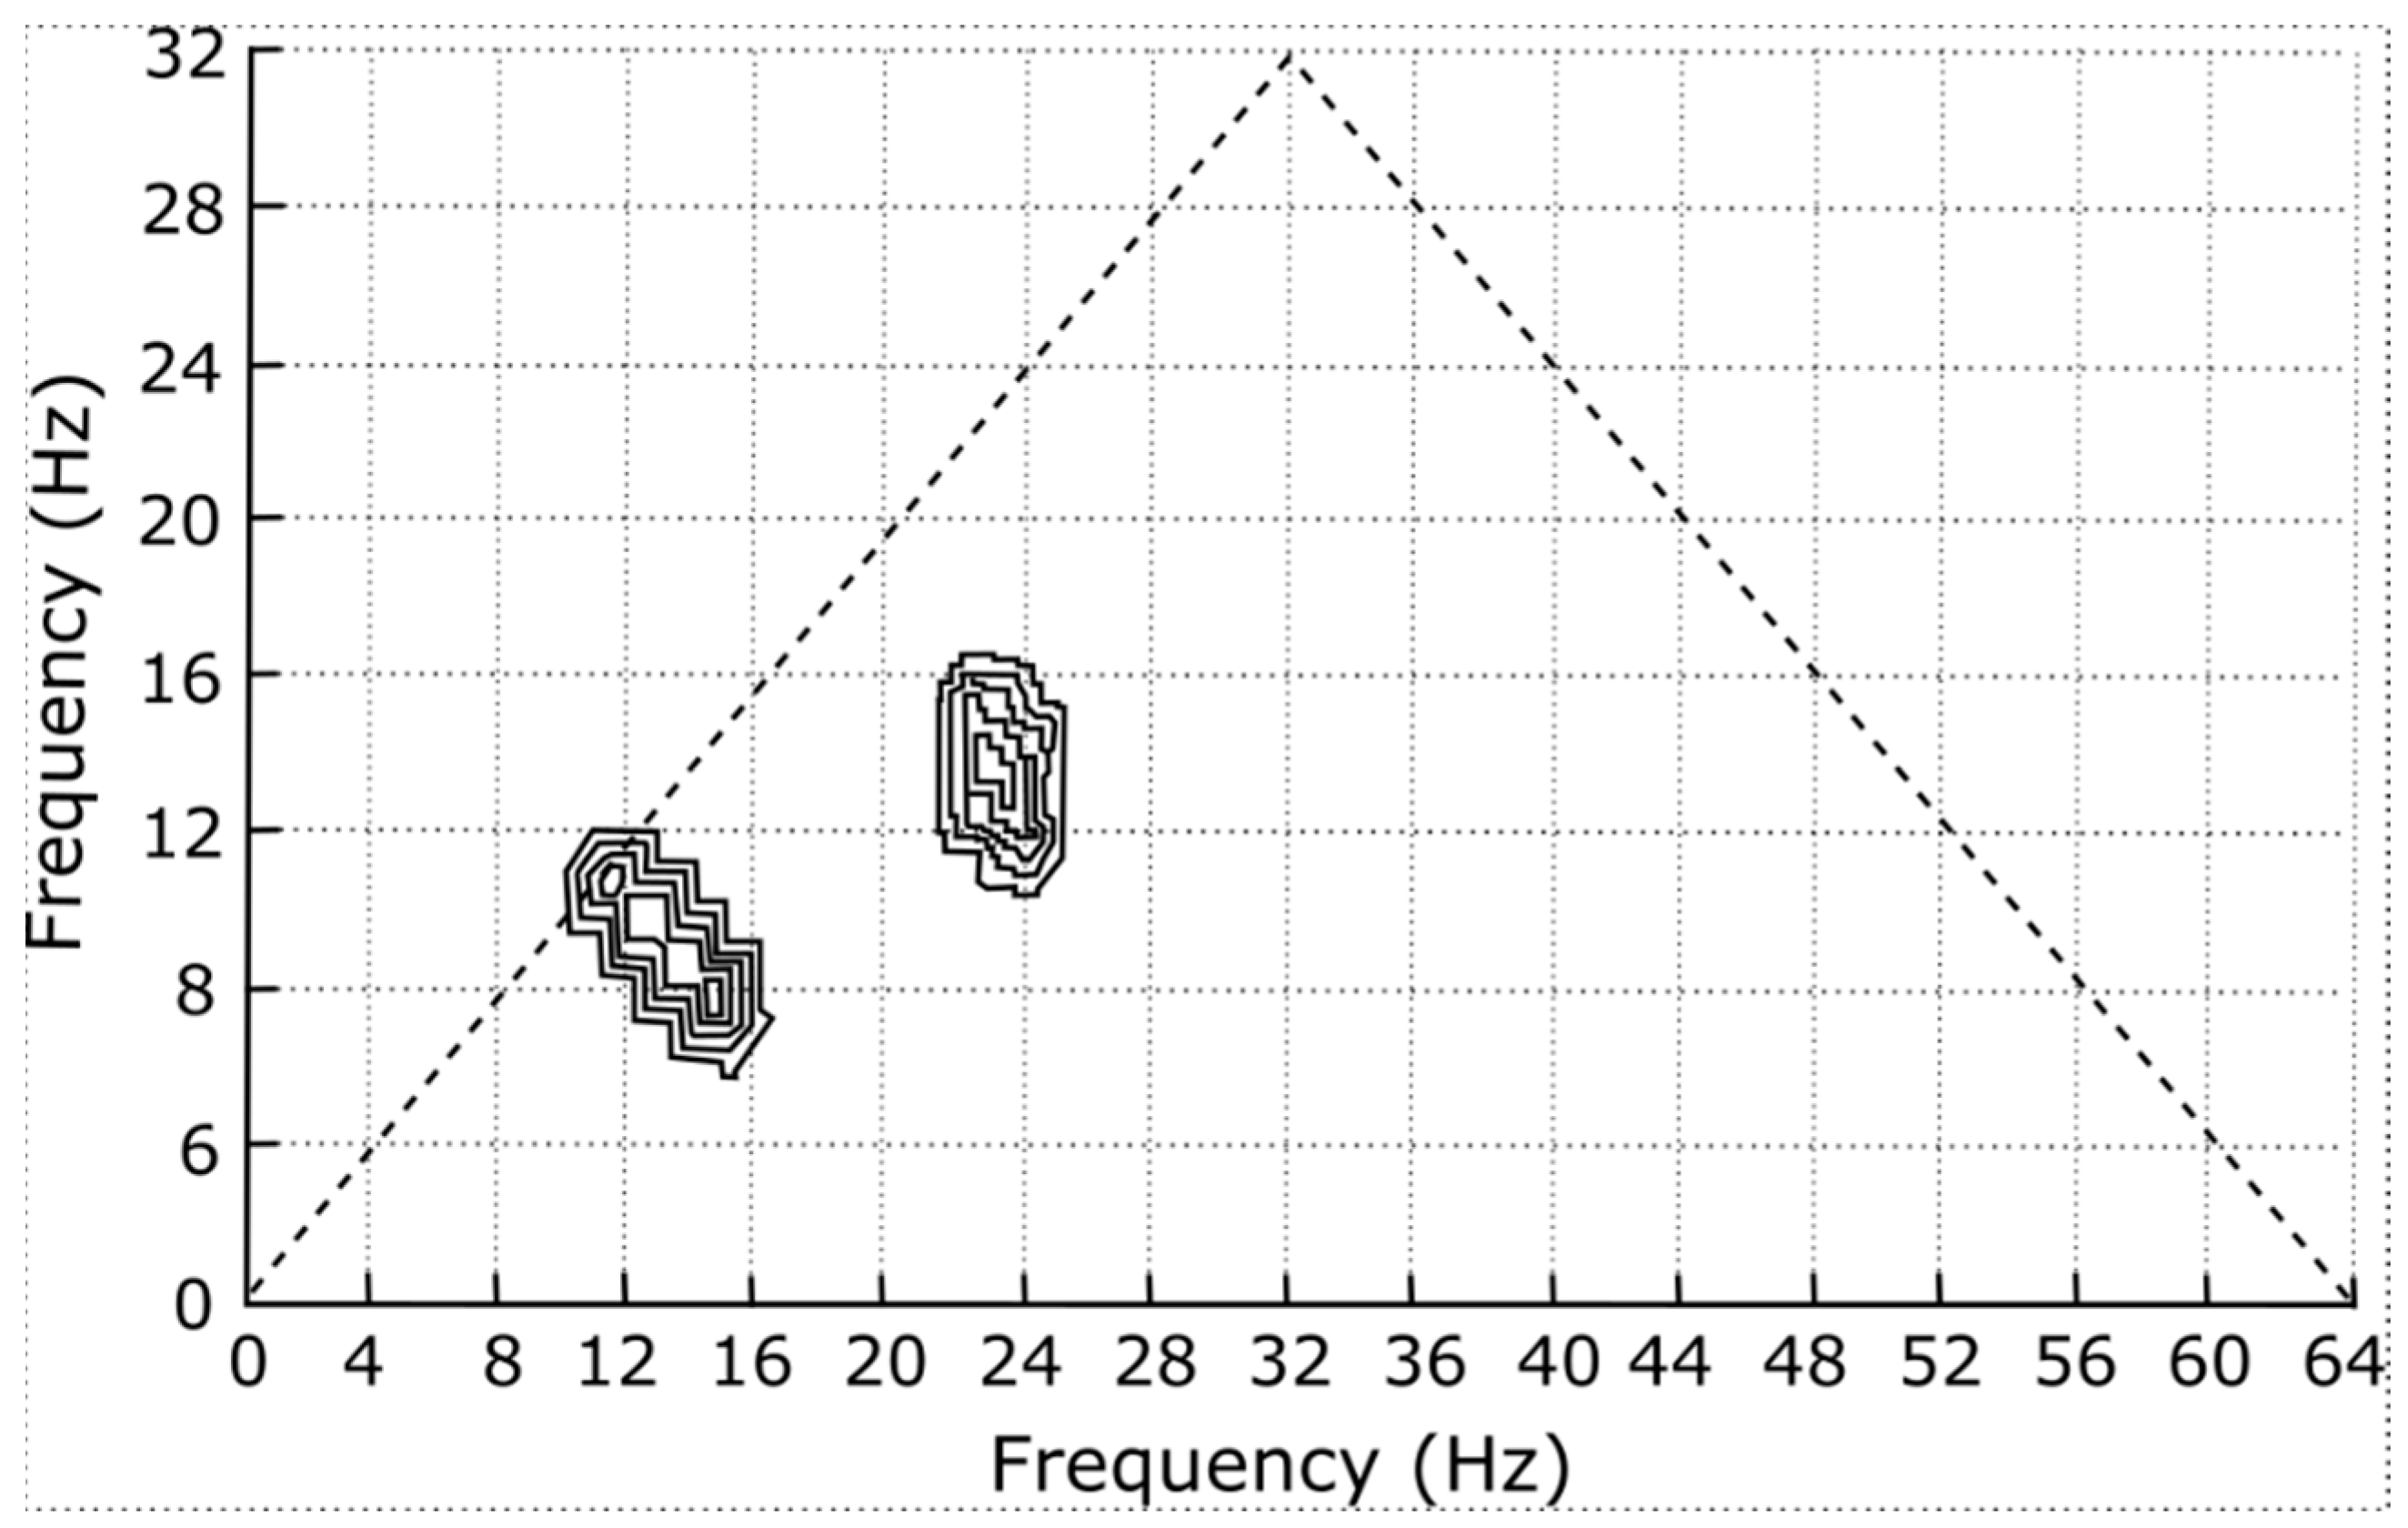
In the absence of any information about this computer-generated test signal, we could still identify the parents of any wave–wave interactions from a contour plot of the bispectrum (see
Figure 5).
Here is how we might use
Table 2 to find the parents:
For peak at (ωj, ωk) = (24, 14):
Is there a difference-frequency peak at (14, 10)? Yes.
Is there a sum-frequency peak at (38, 14)? No.
Is there a sum-frequency peak at (38, 24)? No.
The first row of
Table 2 indicates that the parent frequencies are therefore 14 Hz and 24 Hz, and the magnitude of this peak tells us what fraction of the power at the
difference frequency (10 Hz) is due to coupling.
For peak at (ωj, ωk) = (14, 10):
Is there a difference-frequency peak at (10, 4)? No.
Is there a sum-frequency peak at (24, 10)? No.
Is there a sum-frequency peak at (24, 14)? Yes.
The third row of
Table 2 indicates that the parents are at the sum frequency, 24 Hz, and ω
j (14 Hz), and the magnitude of this peak tells us what fraction of the power at the
sum frequency (38 Hz) is due to coupling.
5. Bispectral Analysis of Interfacial Broadband Cyclotron Waves
As an application of bispectral techniques to a turbulent-mixing paradigm, we analyze previously acquired plasma fluctuation data [
13,
14,
15,
16]. Two related categories of waveforms are used. One category is associated with (broadband, ion-cyclotron-range, shear-driven) inhomogeneous energy-density driven (IEDD) instability, and the other is associated with (narrowband, ion-cyclotron range, current-driven) electrostatic ion-cyclotron (CDEIC) instability. For the same value of magnetic field-aligned plasma current, IEDDI waves have significantly larger wave amplitude than CDEIC waves because of the contribution of E × B velocity-shear inhomogeneity to the instability growth rate. The setup for this experiment is documented in [
13,
17,
18,
19]. The sampling frequency for each 1024-point realization was one mega-sample per second, and a bandpass filter (10 kHz to 240 kHz) was used to suppress drift waves at 3 kHz and eliminate interference at 240 kHz.
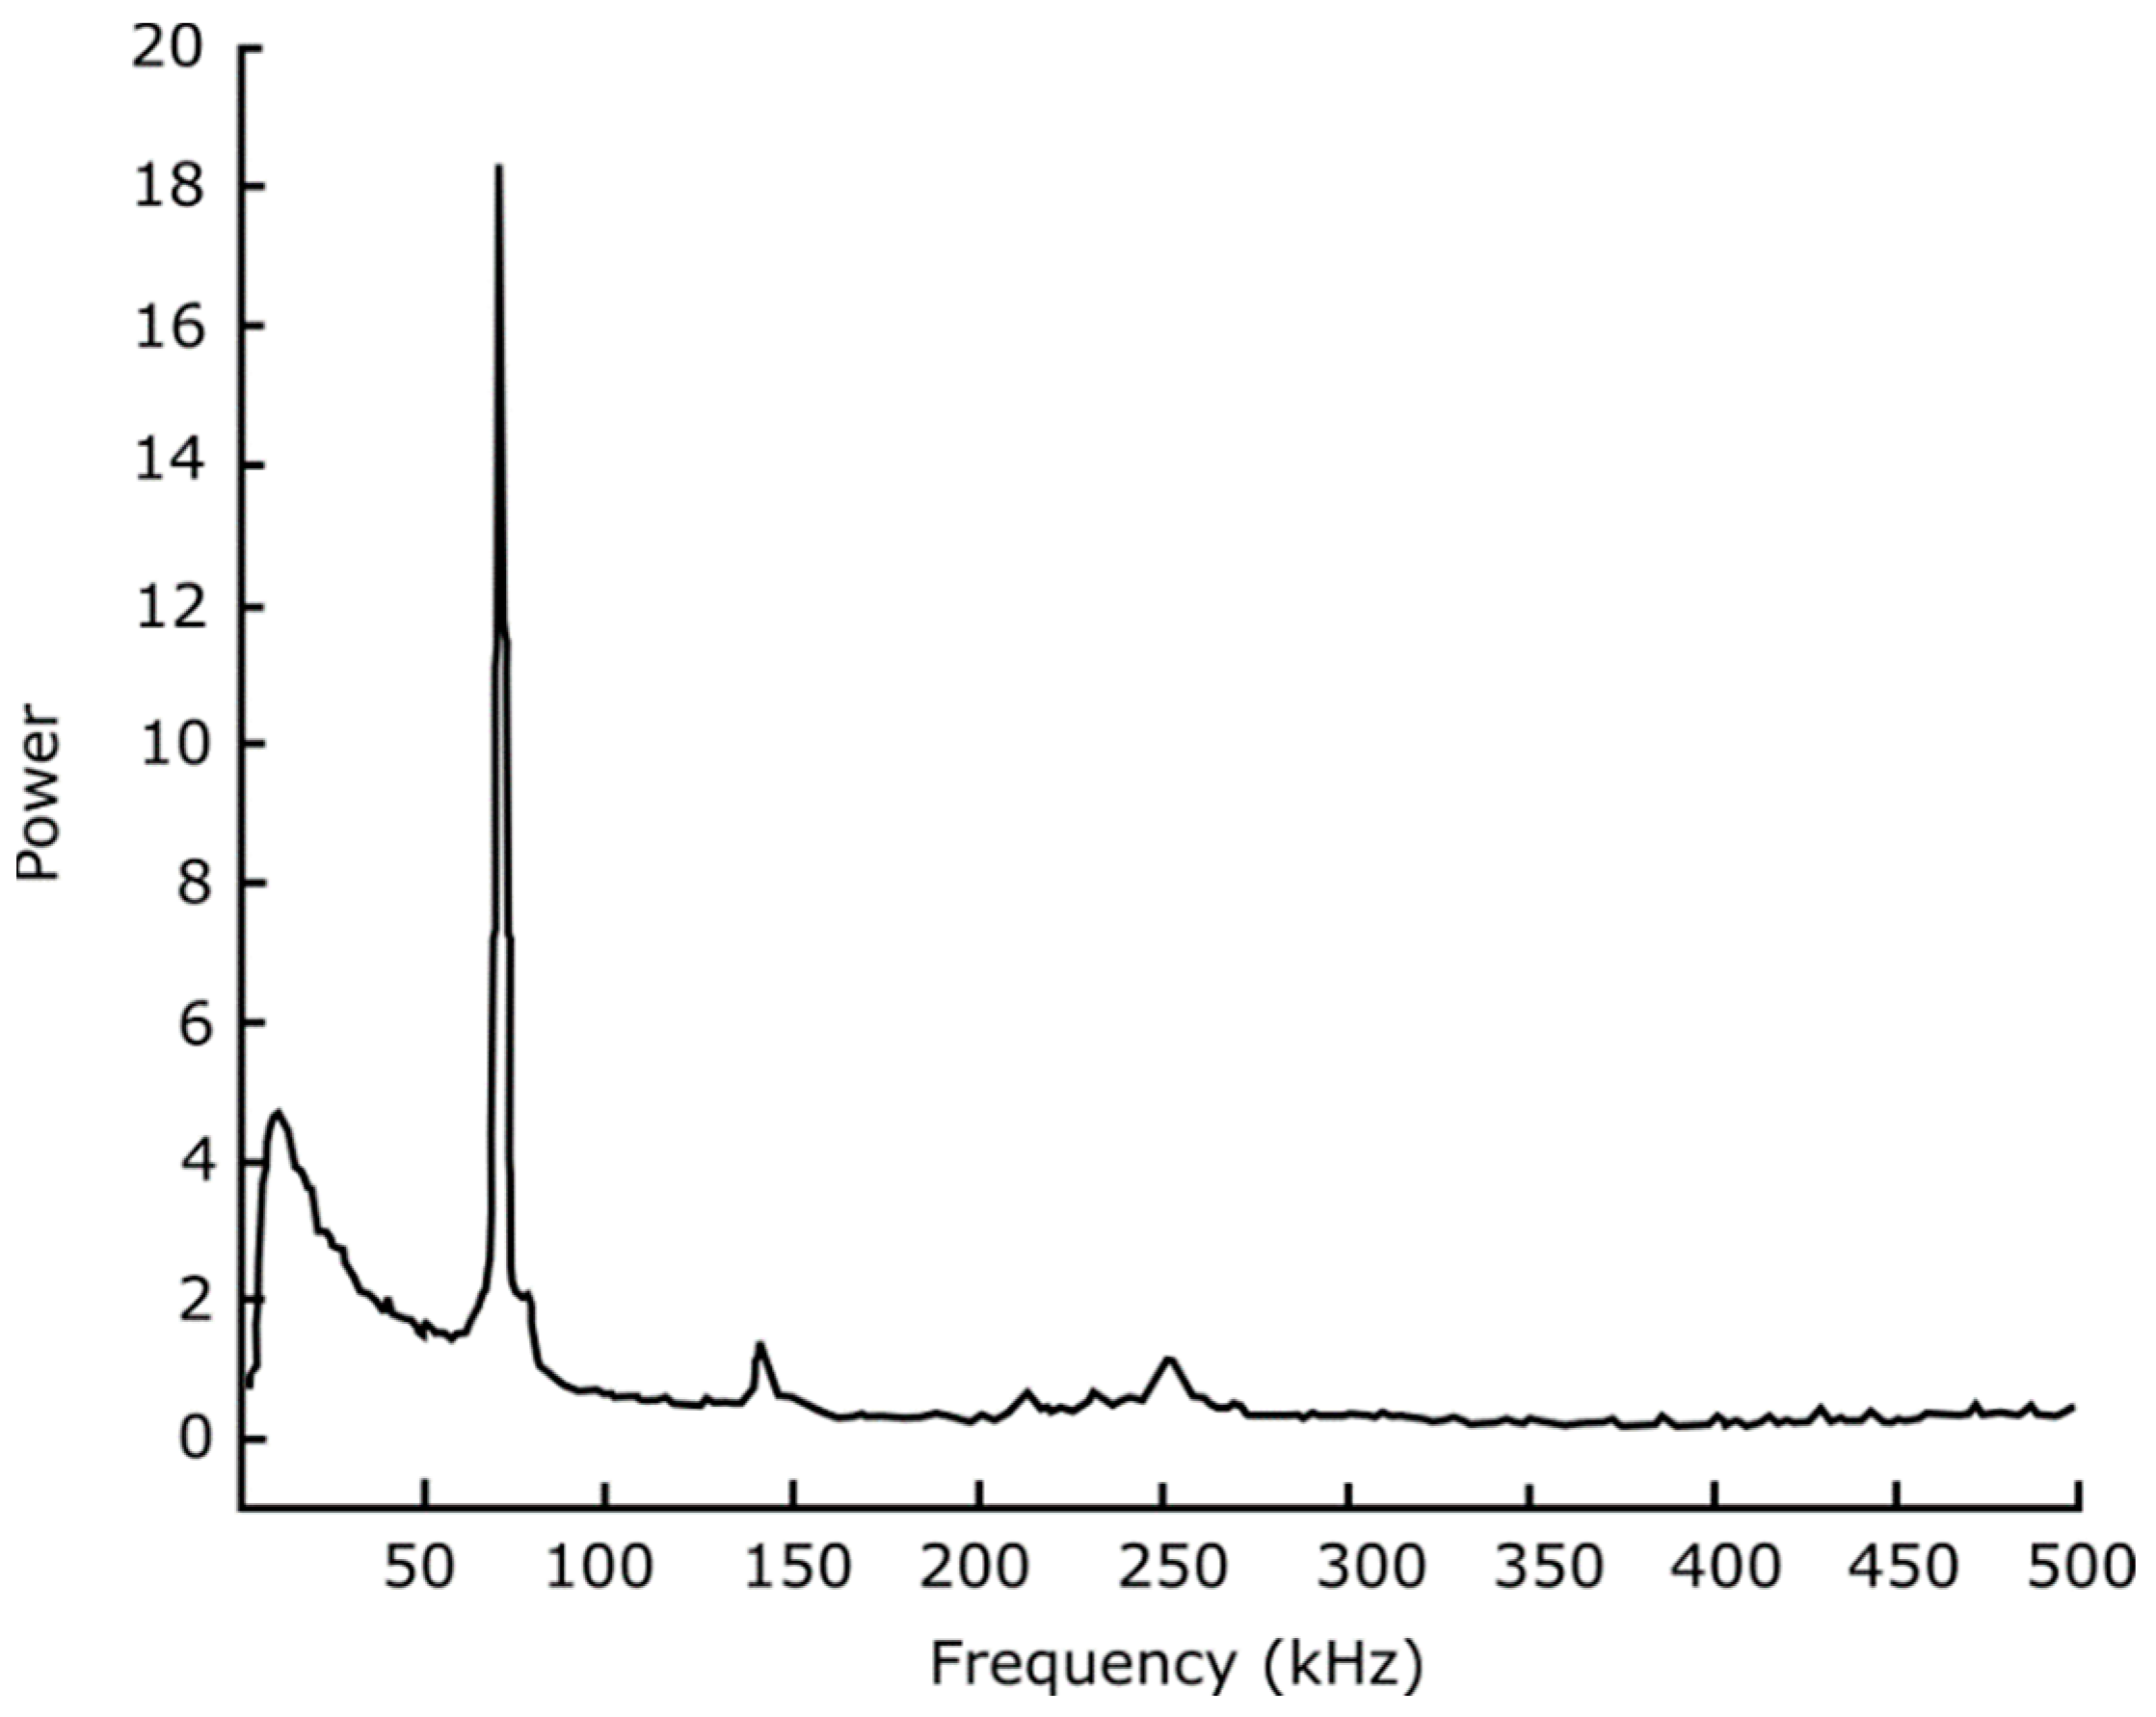
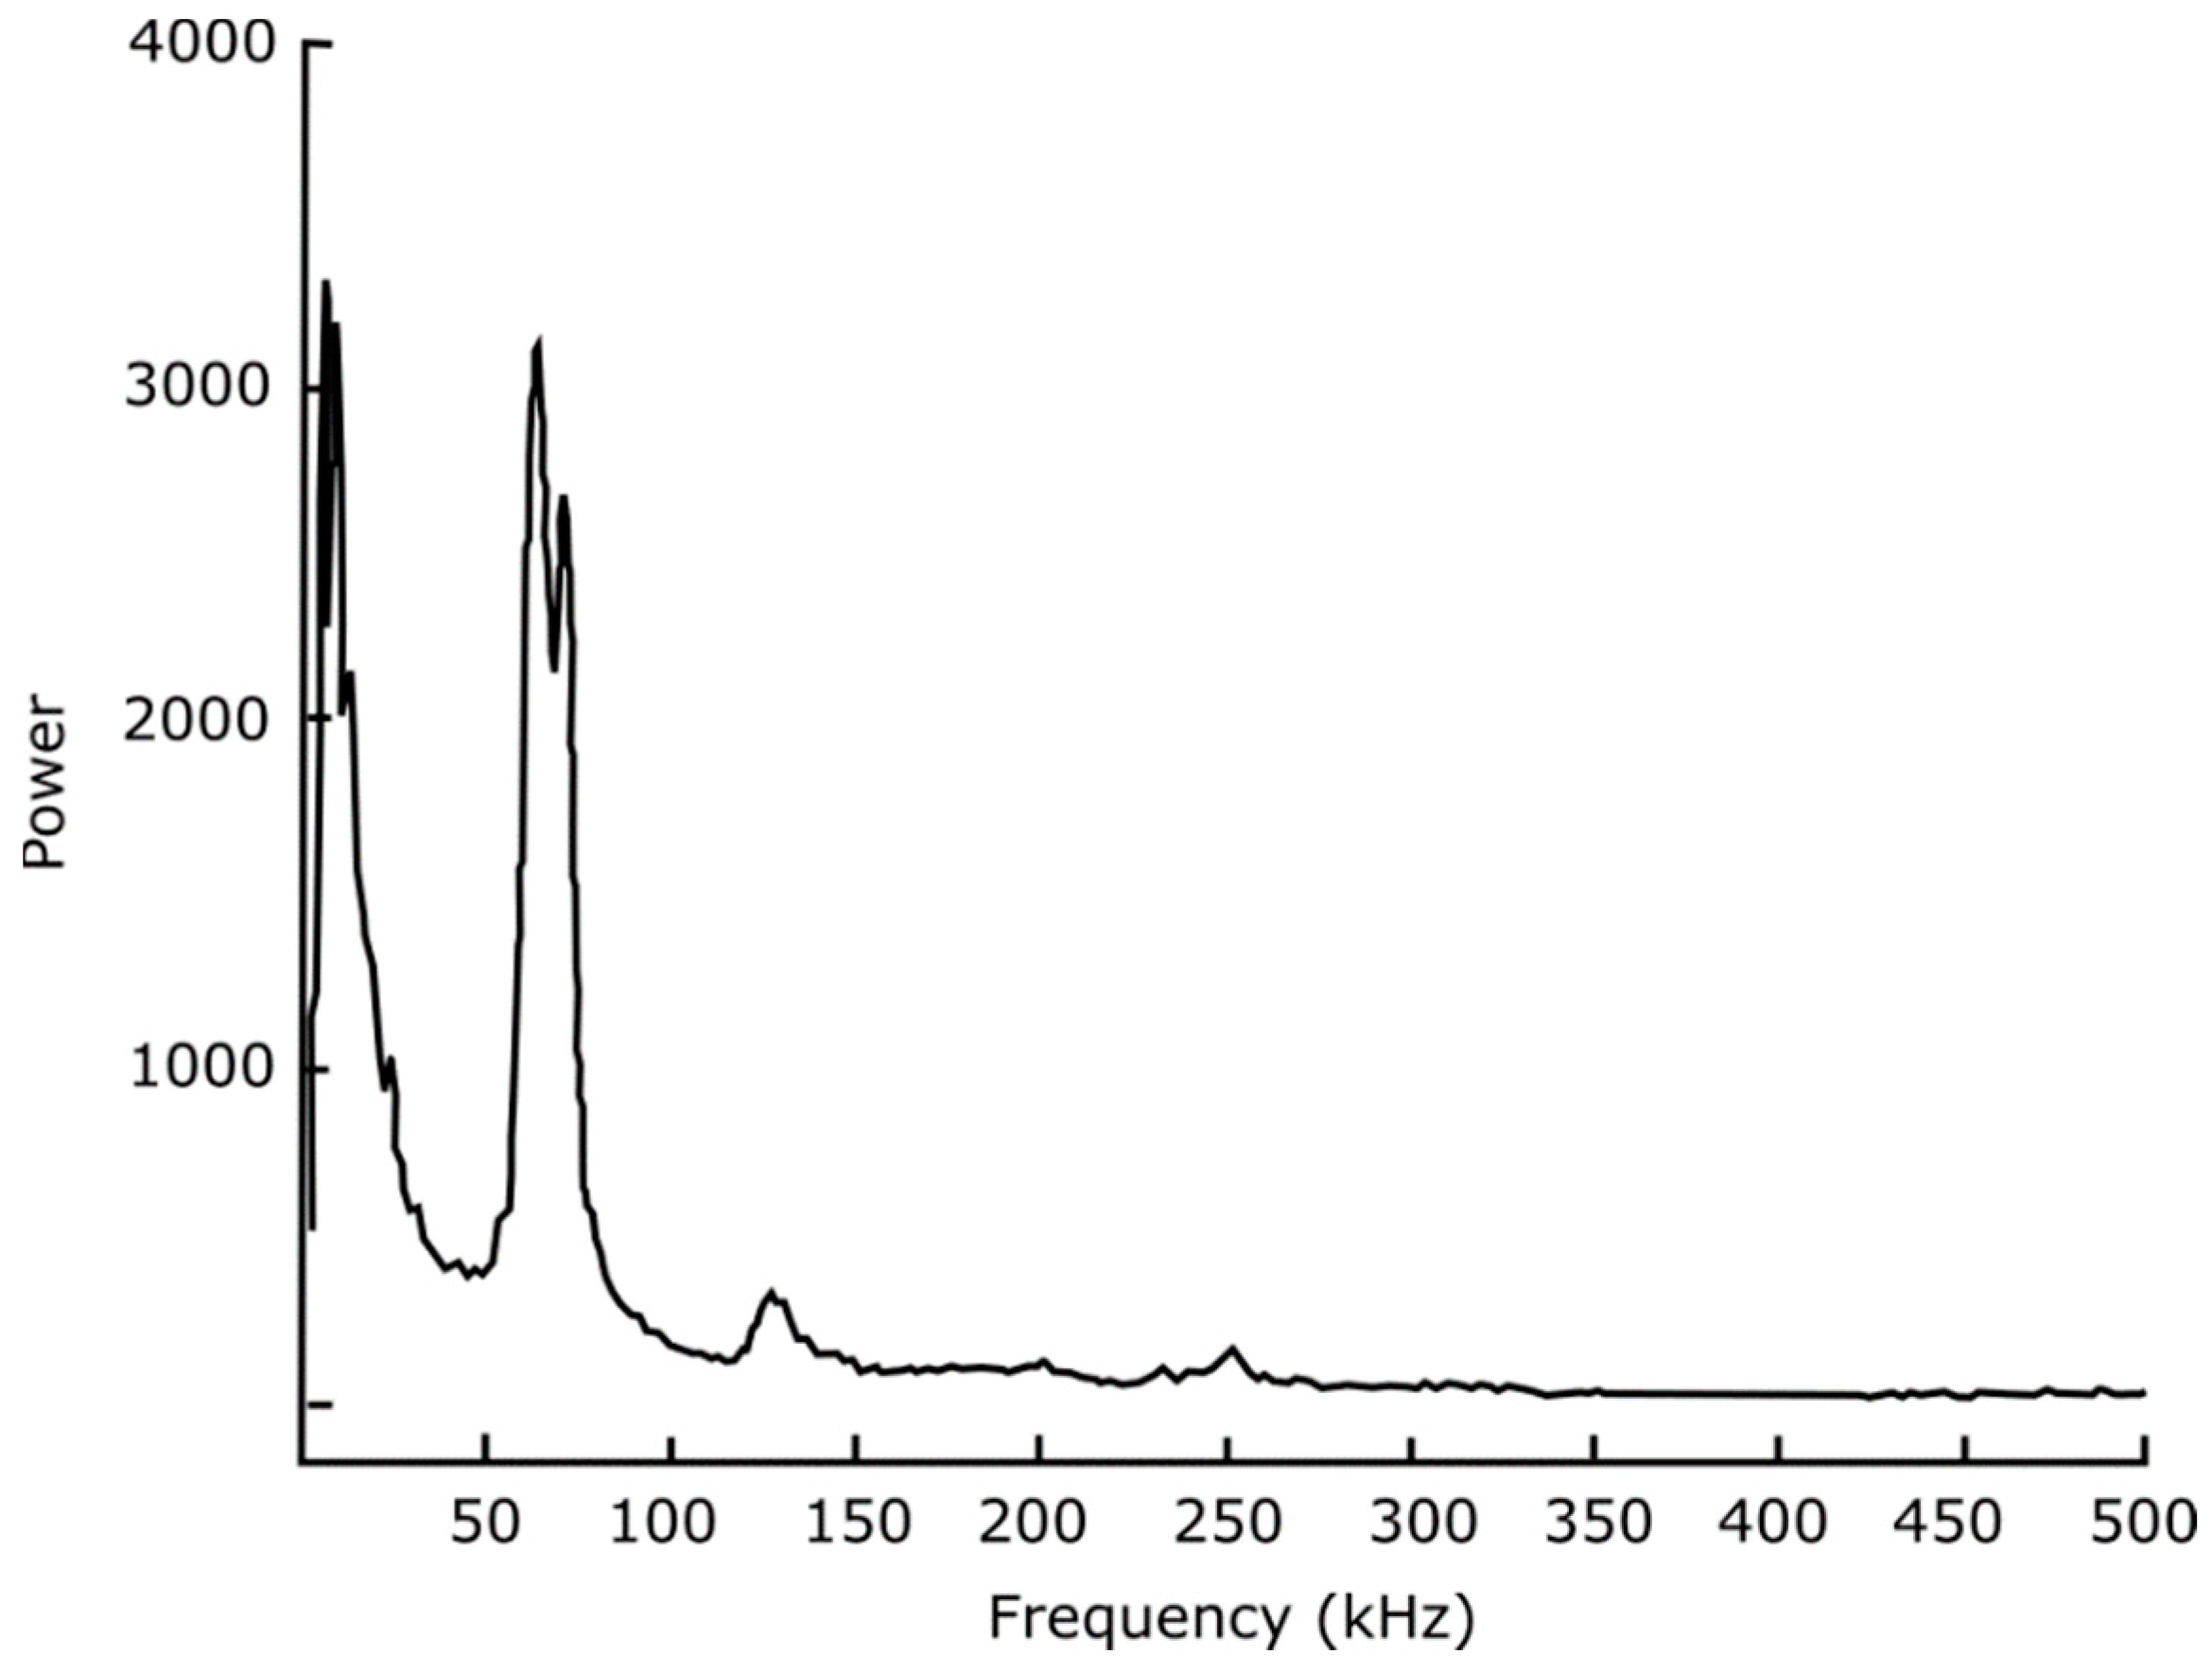
The average power spectra of the two plasma instabilities, shown in
Figure 6 and
Figure 7, are quite distinct. The CDEIC mode, seen at 71 kHz, is almost monochromatic, and the spectrum displays only small relative amounts of energy in the 5–10 kHz frequency range. Conversely, the frequency spectrum associated with the IEDDI mode, seen at approximately 65 kHz, is broadband with significantly more relative power in the 5 kHz–25 kHz range. These low-frequency fluctuations have been identified as drift waves by their three-dimensional mode characteristics and magnetic field-dependent frequency.
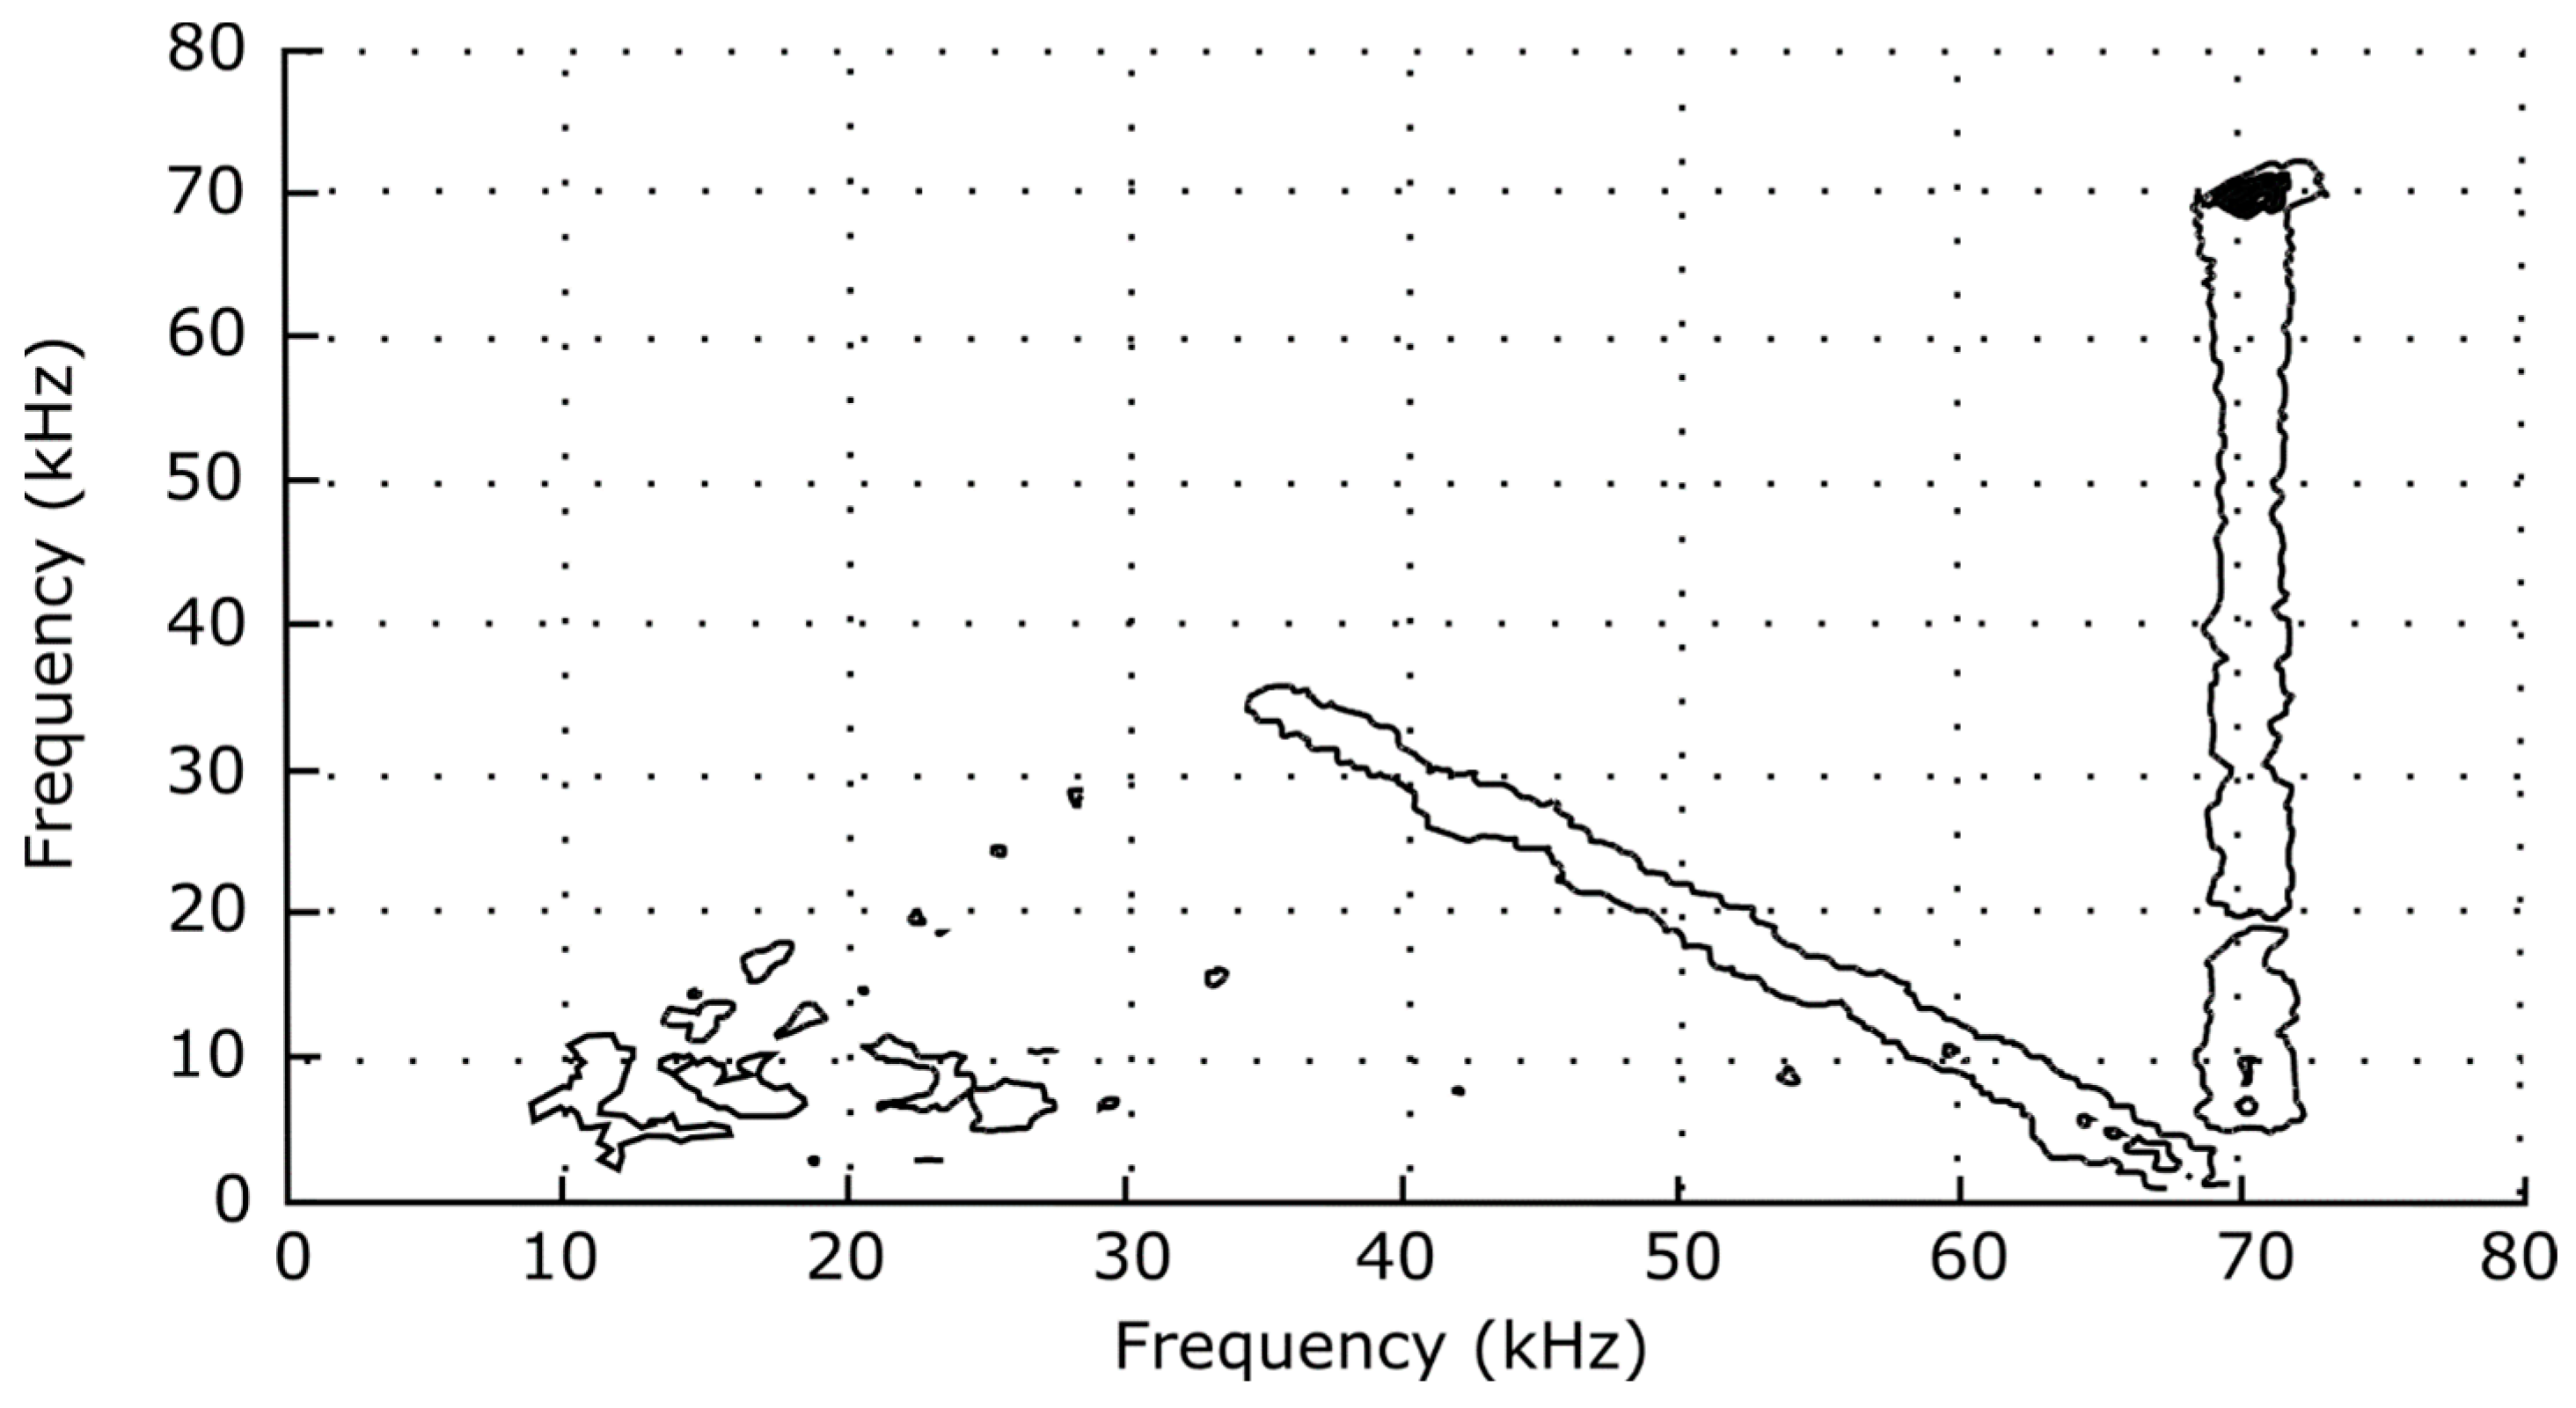
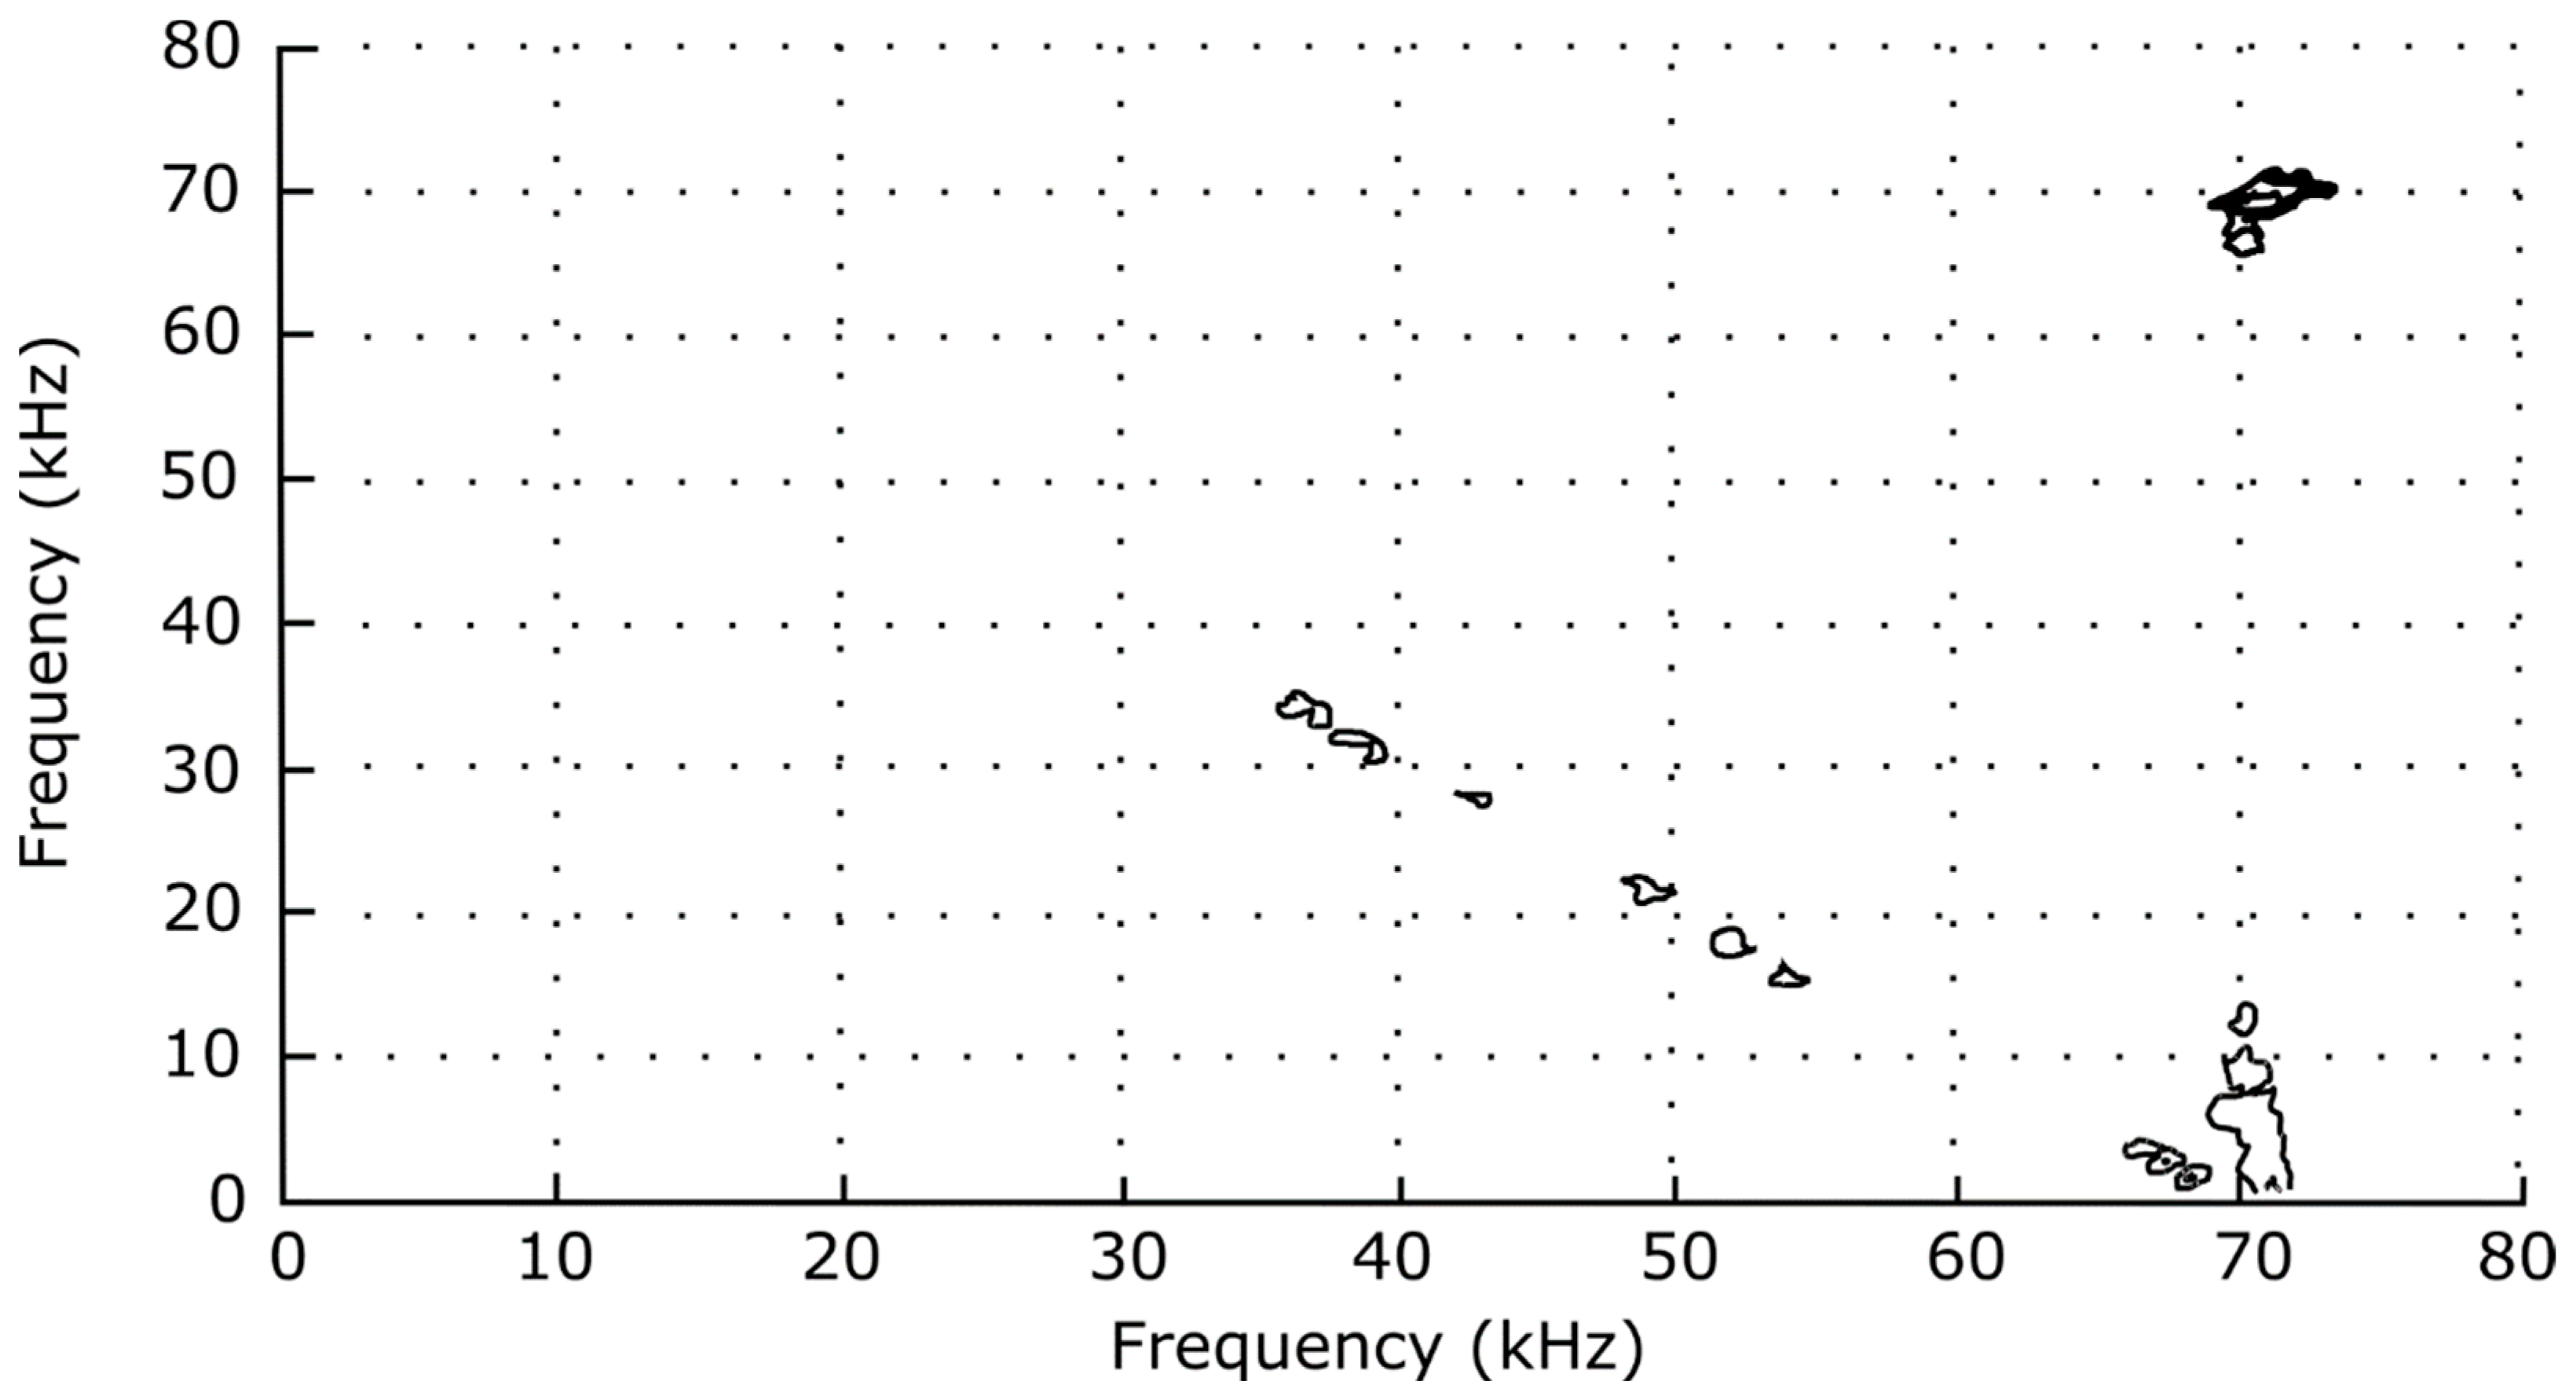
The coherency of the CDEIC spectrum is particularly evident in the contour plot of the bispectrum and bicoherence spectrum (
Figure 8 and
Figure 9), where the most significant feature indicates “coupling” of f
CDEIC with its first harmonic. Also note the 71 kHz iso-daughter line starting at 35.5 kHz and sloping down to the right. Every possible combination of frequencies satisfying the selection rule for
ωj + ωk = 71 kHz exhibits some, albeit much smaller, degree of coherence with the CDEIC spectrum, implying that 71 kHz is just one of the many components required in the Fourier decomposition of the longer-wavelength pulse shapes. Such a bispectrum would be expected from any time series containing the sum of a periodic, non-sinusoidal low-frequency waveform and a sinusoidal high-frequency waveform and should not be interpreted as an indication of significant active nonlinear coupling.
The cluster in the lower left-hand corner of the bispectrum plot of
Figure 8, however, is indicative of some nonlinear interactions present among the low-frequency fluctuations, a result consistent with previous experiments on drift wave-type turbulence in tokamaks [
11] and linear plasma discharges [
13,
20]. Tsui [
11], in particular, used the Hasegawa–Mima drift-wave turbulence equation to derive Equation (4), showing that δ
2 increases with turbulence broadening of spectral components.
As an interesting confirmation of Tsui’s result in the present experiment, the sum of the squared bicoherence of the interactions involving each frequency was calculated using the program documented in [
13,
17]. The bicoherence of all interactions at a certain frequency lies along three separate lines in the reduced triangular region.
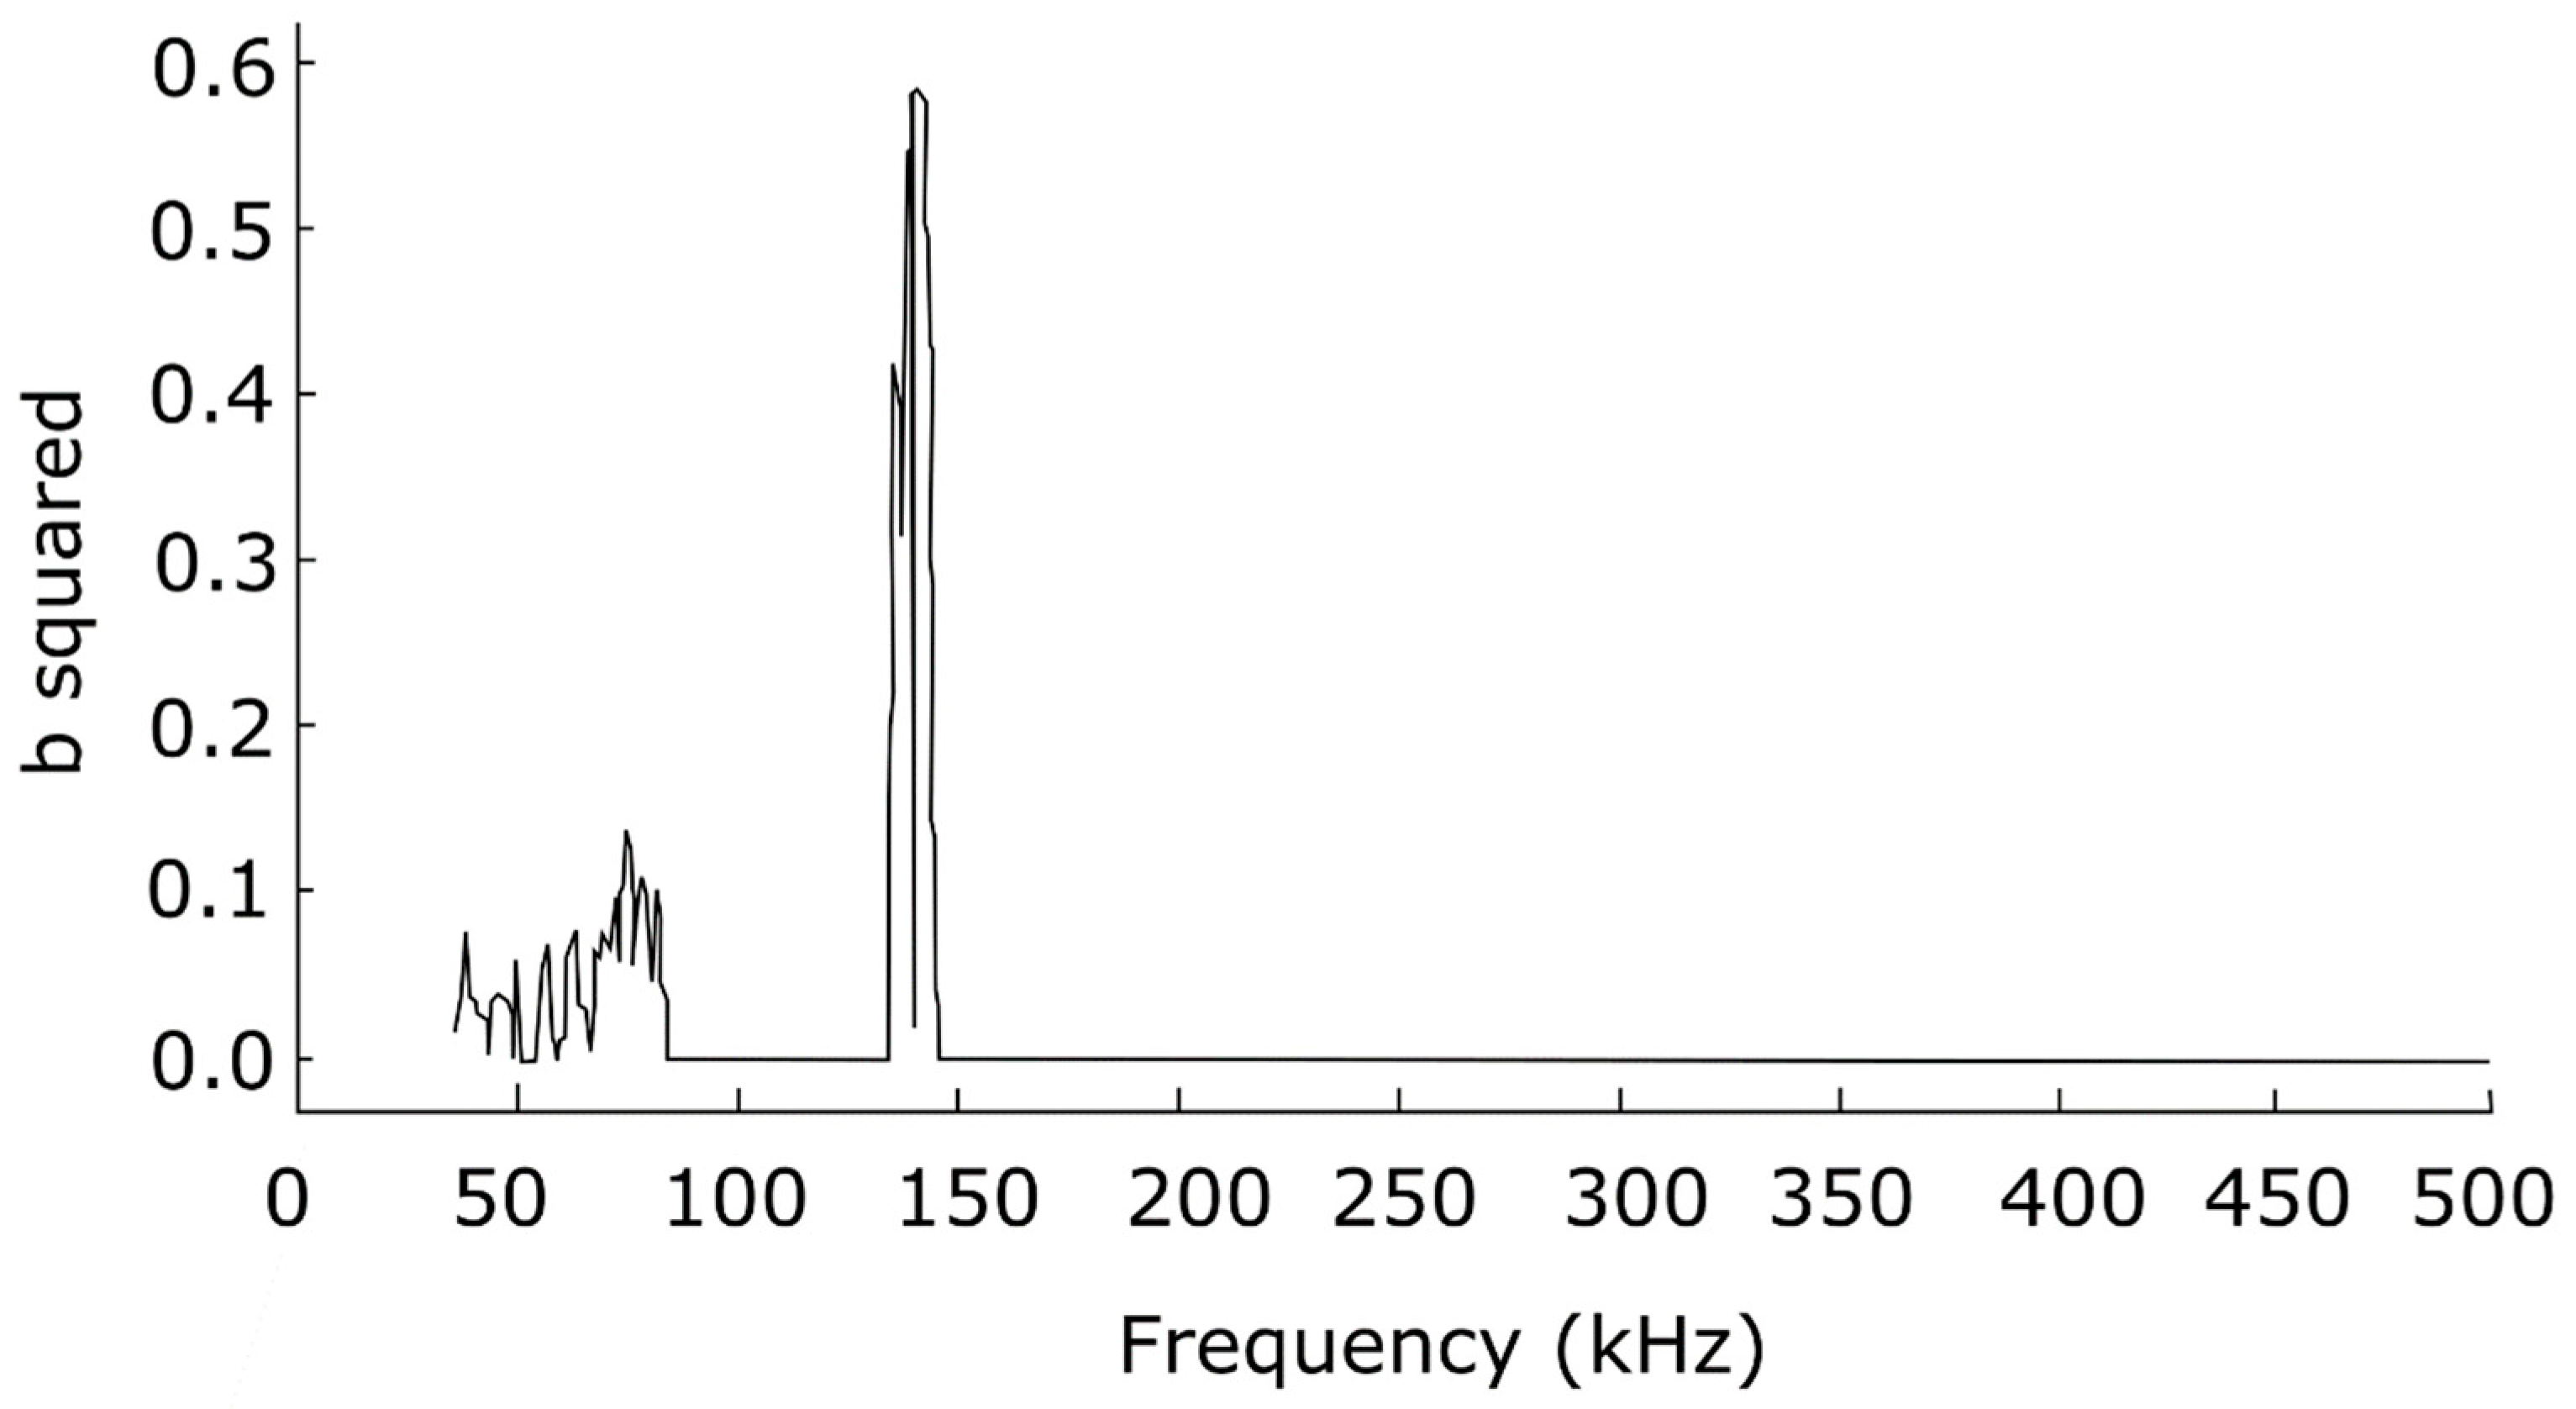
Figure 10 is the bicoherence of all interactions involving the mode at 71 kHz, where the x axis is the frequency of one of the triplets satisfying
ωm = ωj + ωk, for ω
m fixed at 71 kHz. The amplitude of the cluster at 35 to 70 kHz, though smaller than the self-coherent 71 kHz peak, is still much larger than the statistical uncertainty of 1/M = 0.009.
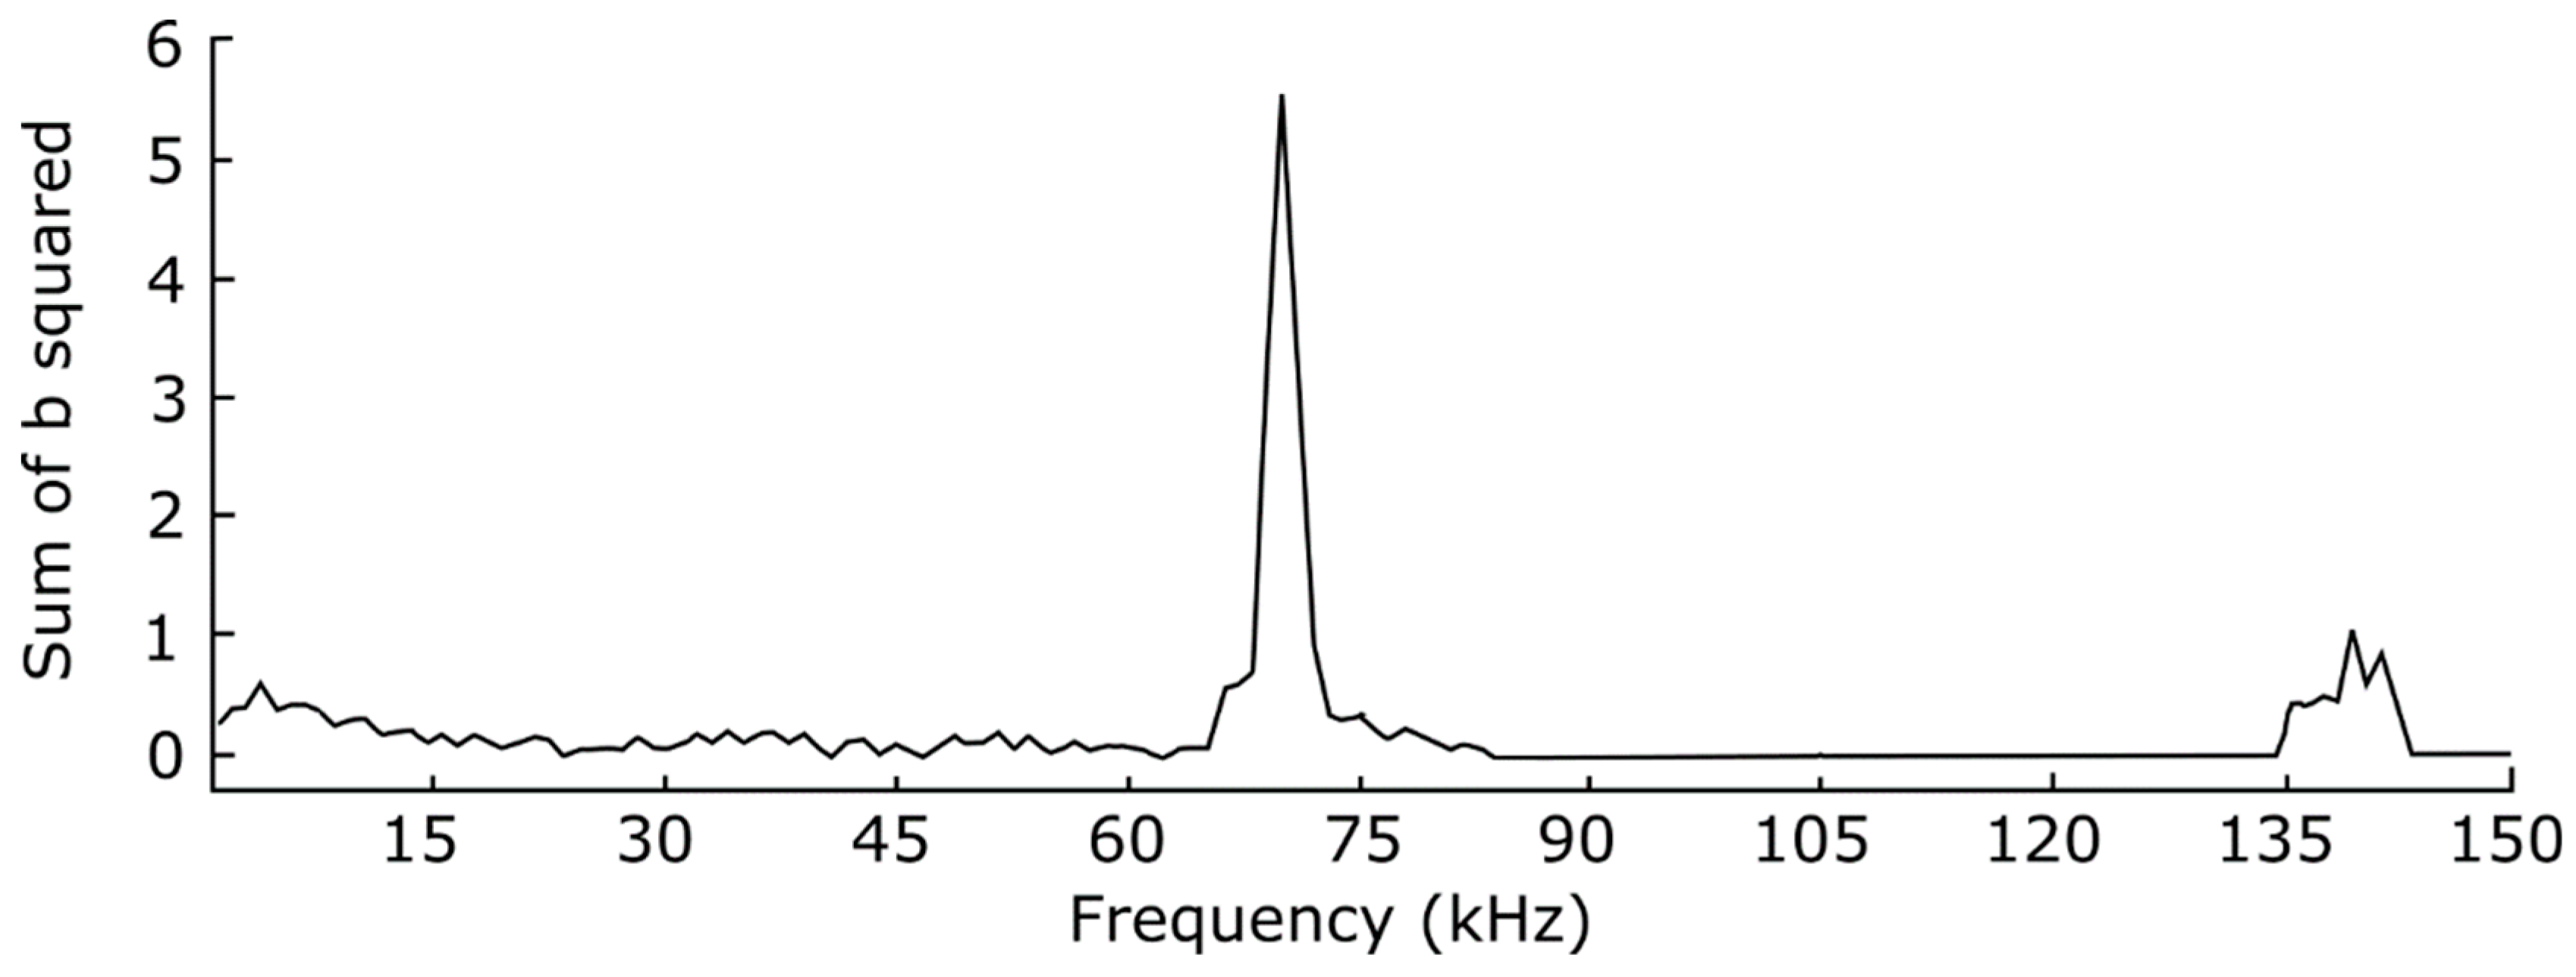
Plotting the area under each such curve as a function of the interaction frequency produces the graph shown in
Figure 11. For the range of frequencies associated with drift-wave turbulence, the sum is indeed less than one. The difference of 0.4 between unity and the sum of b
2 for f
drift = 3 kHz is attributed to the spectral broadening term δ
2.
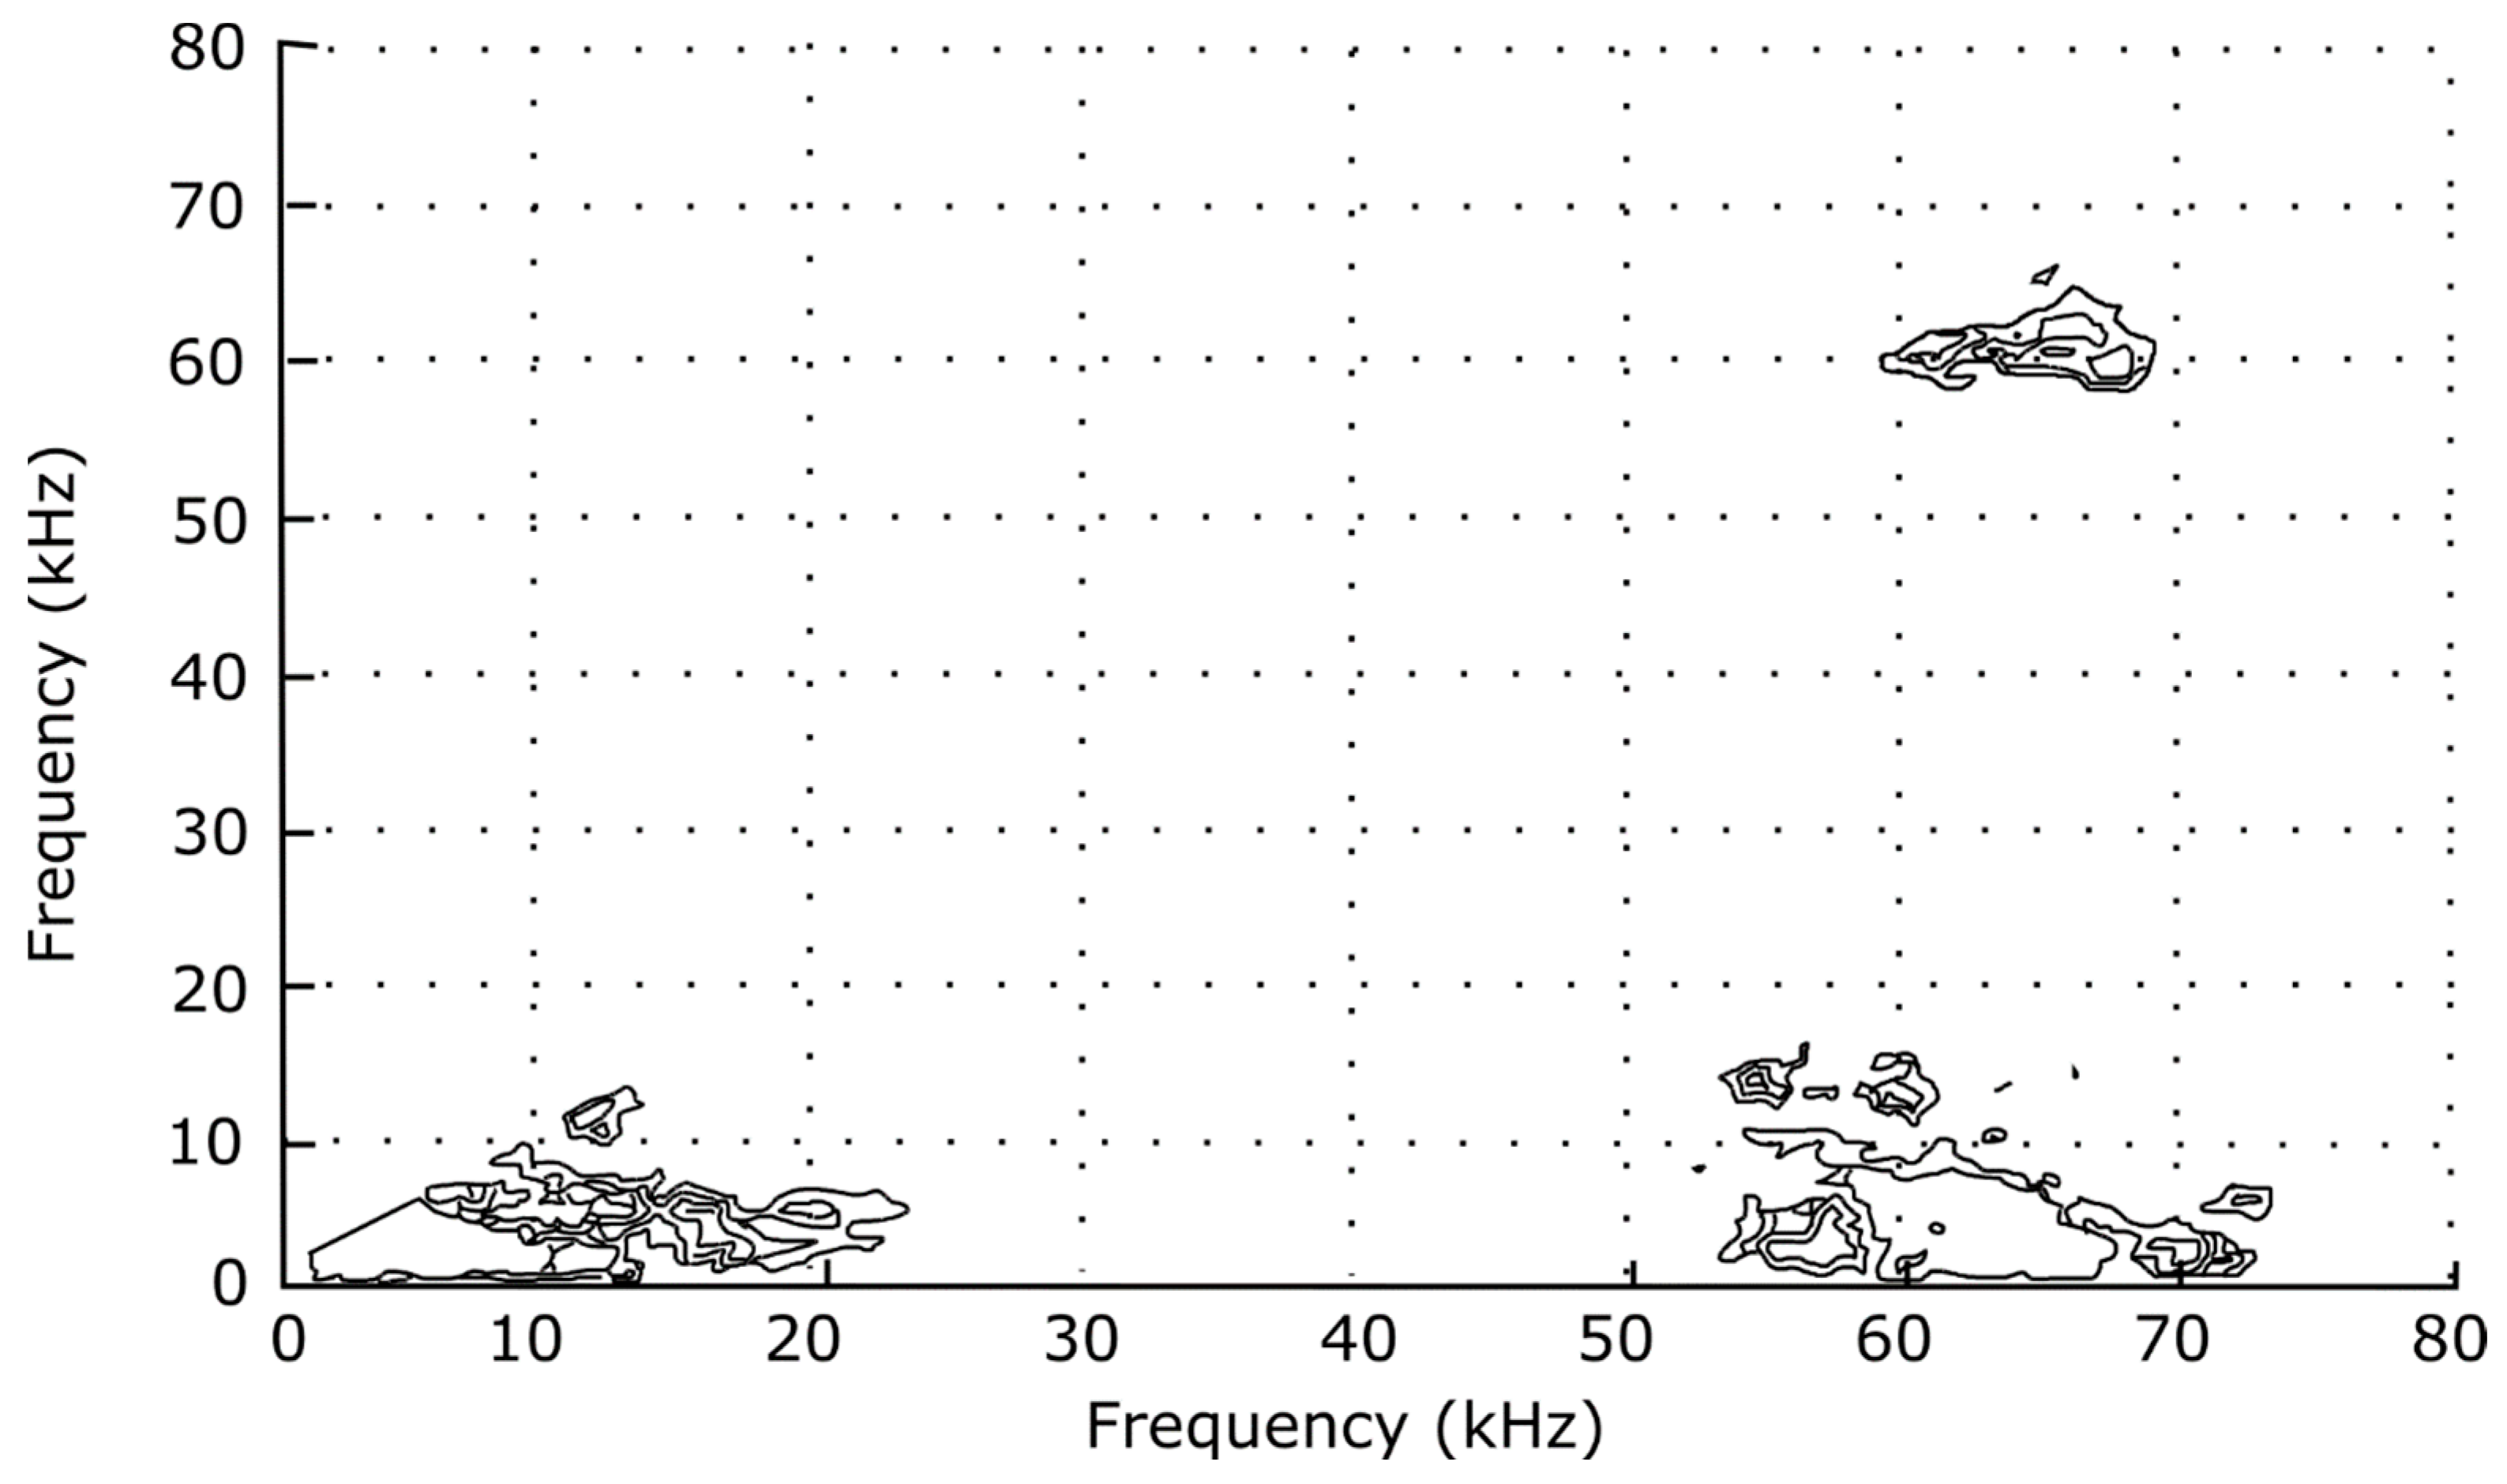
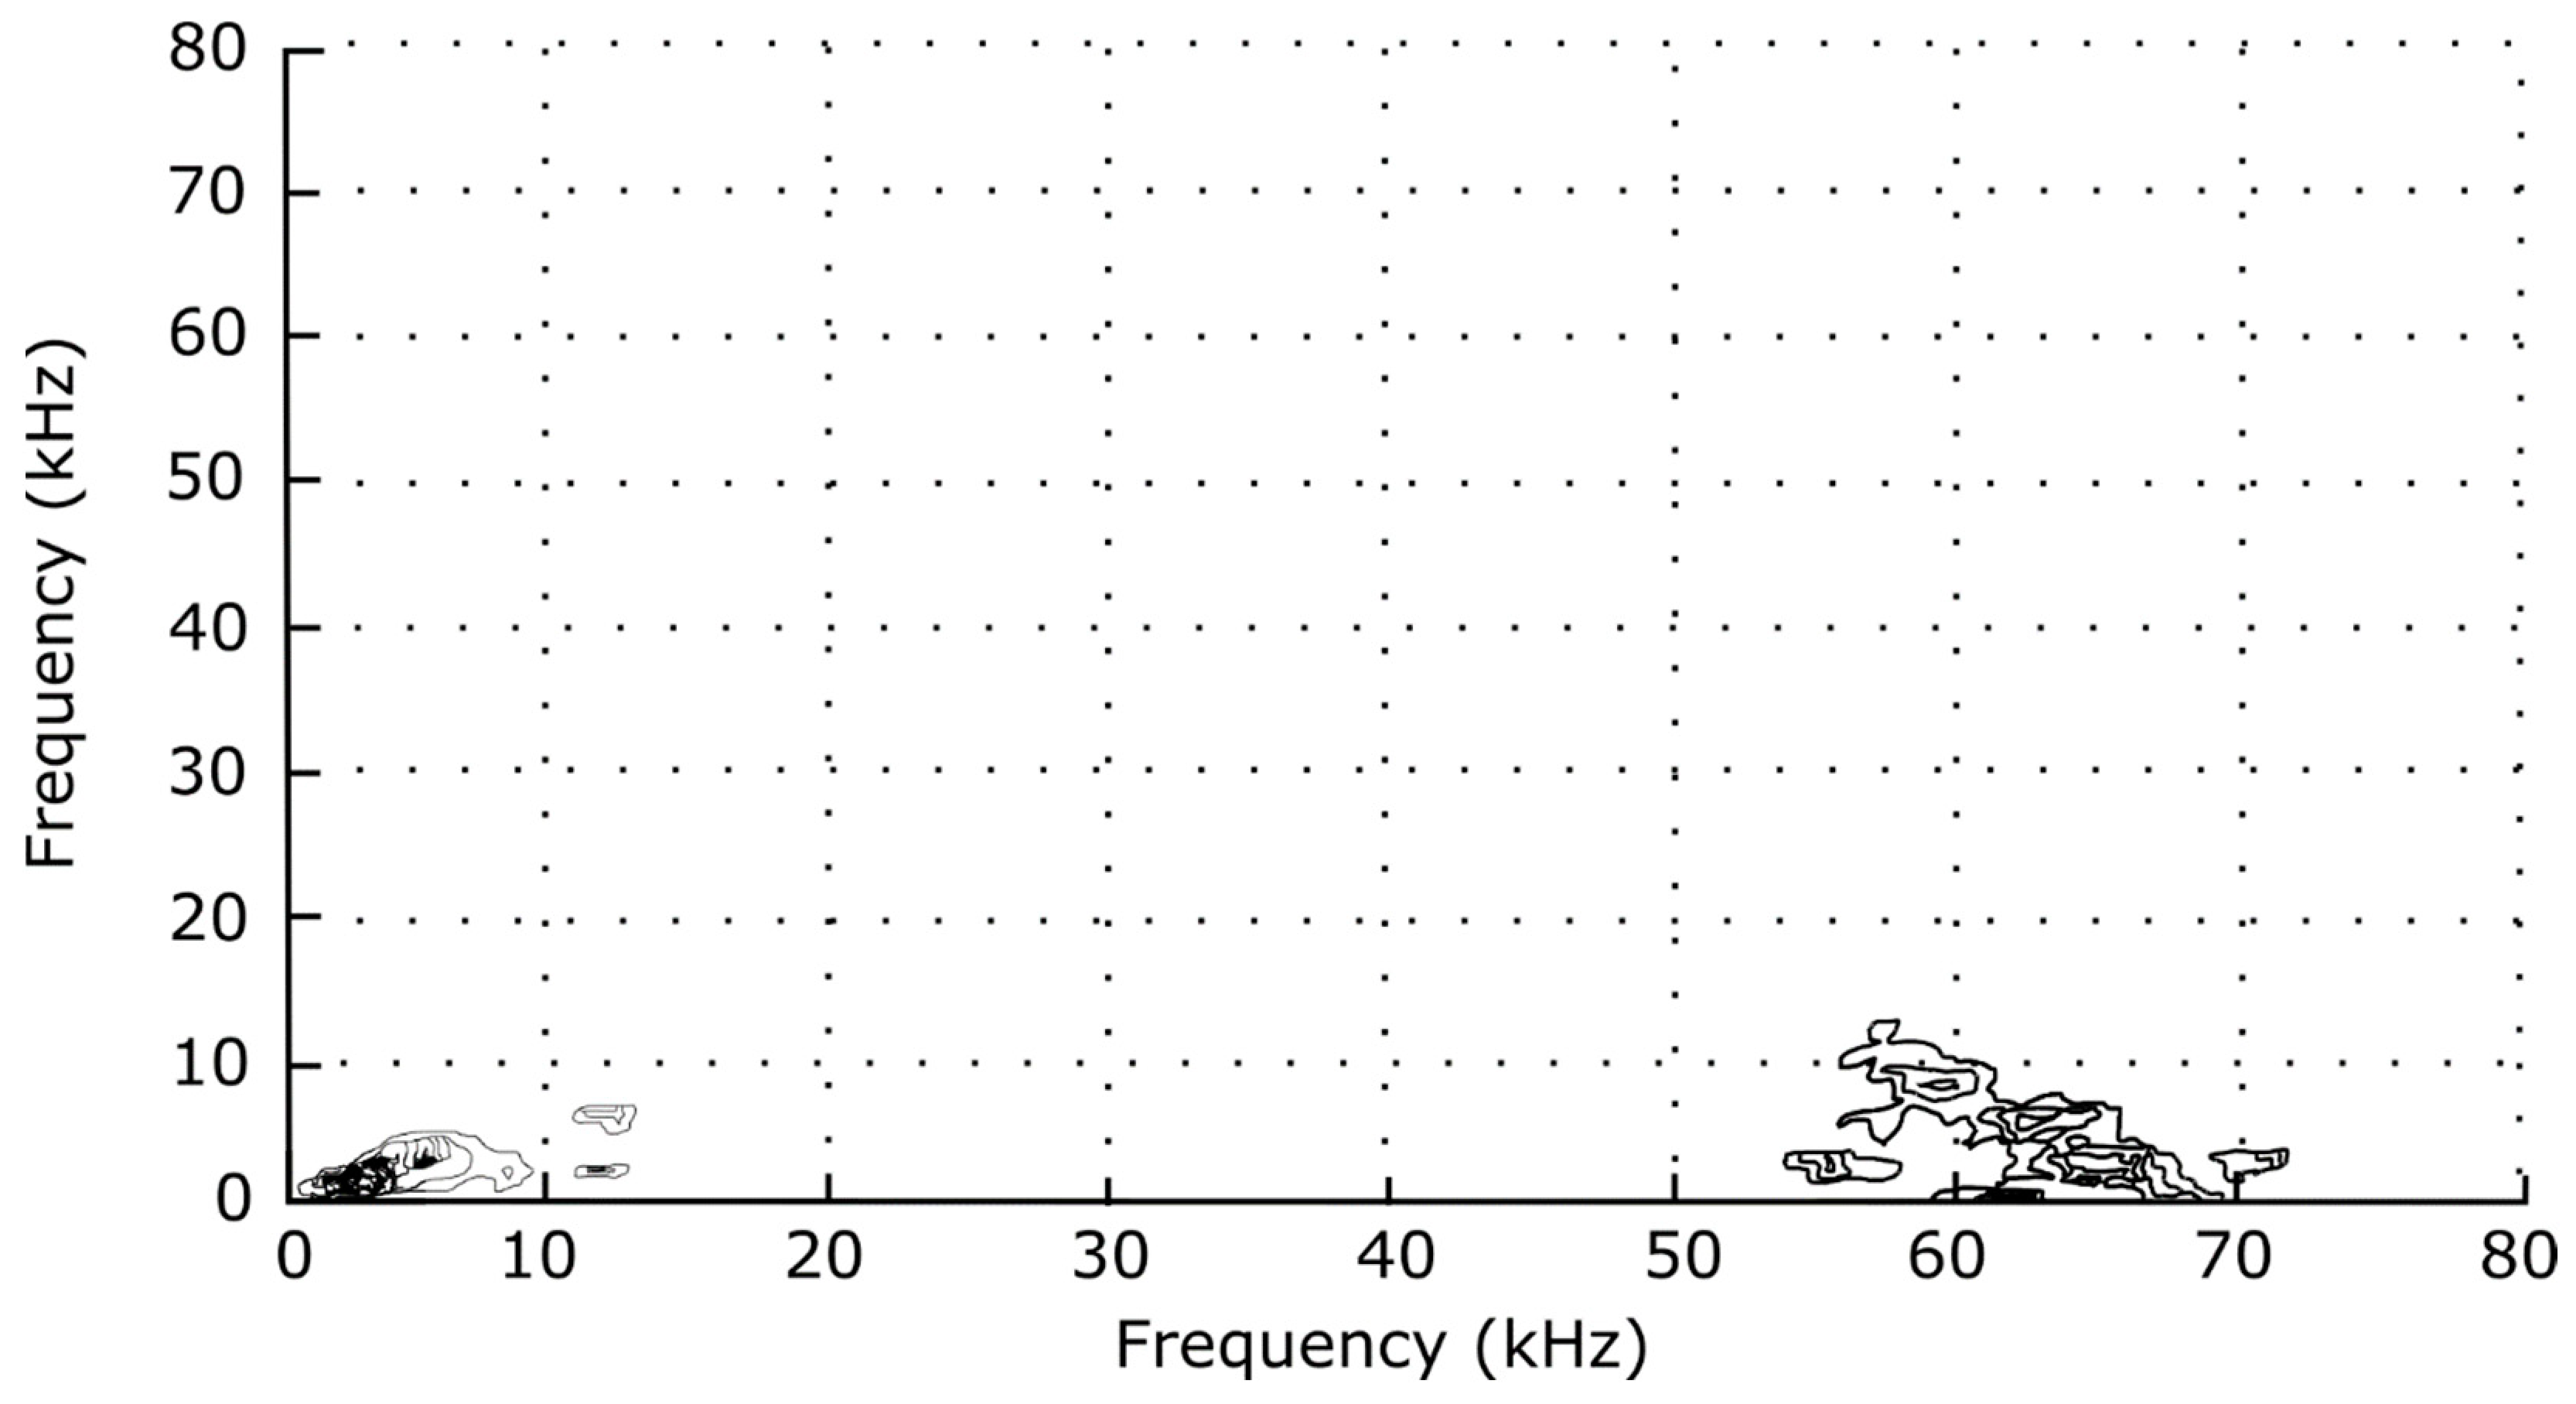
In contrast, the IEDD bispectrum indicates a coupling of the high-frequency spectrum to drift waves that is absent in the CDEIC fluctuations (see
Figure 12 and
Figure 13 and [
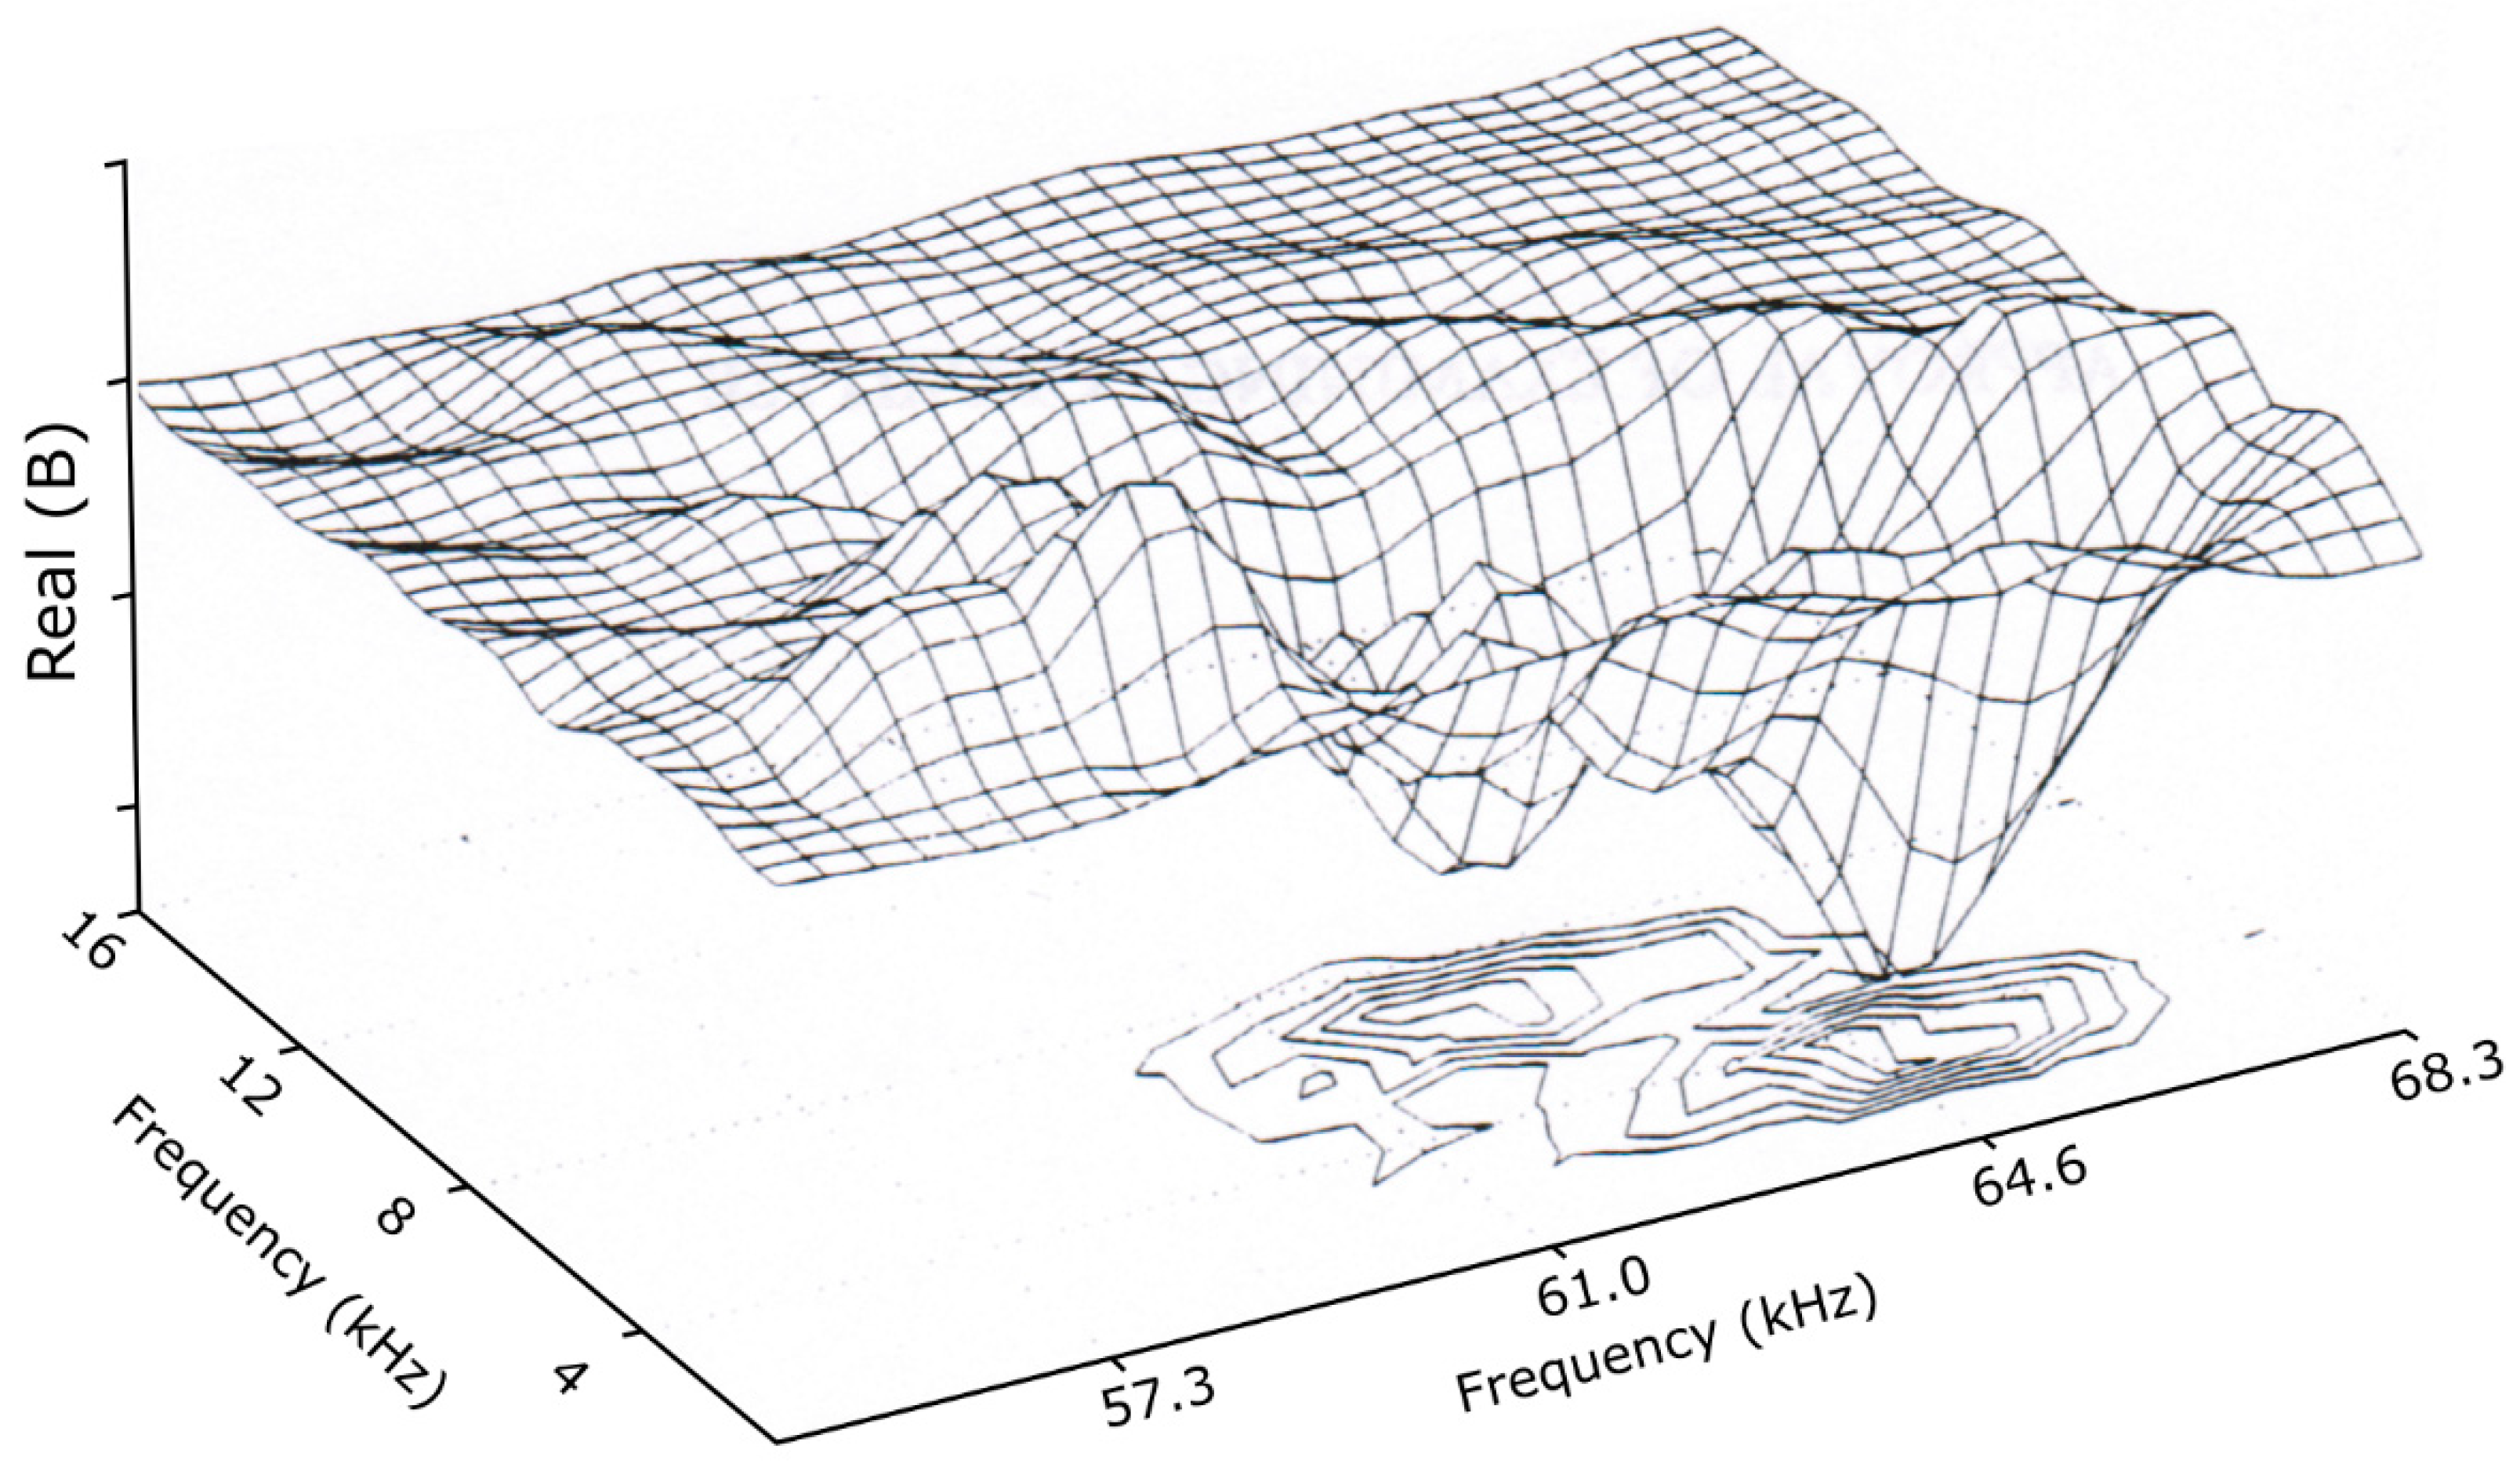
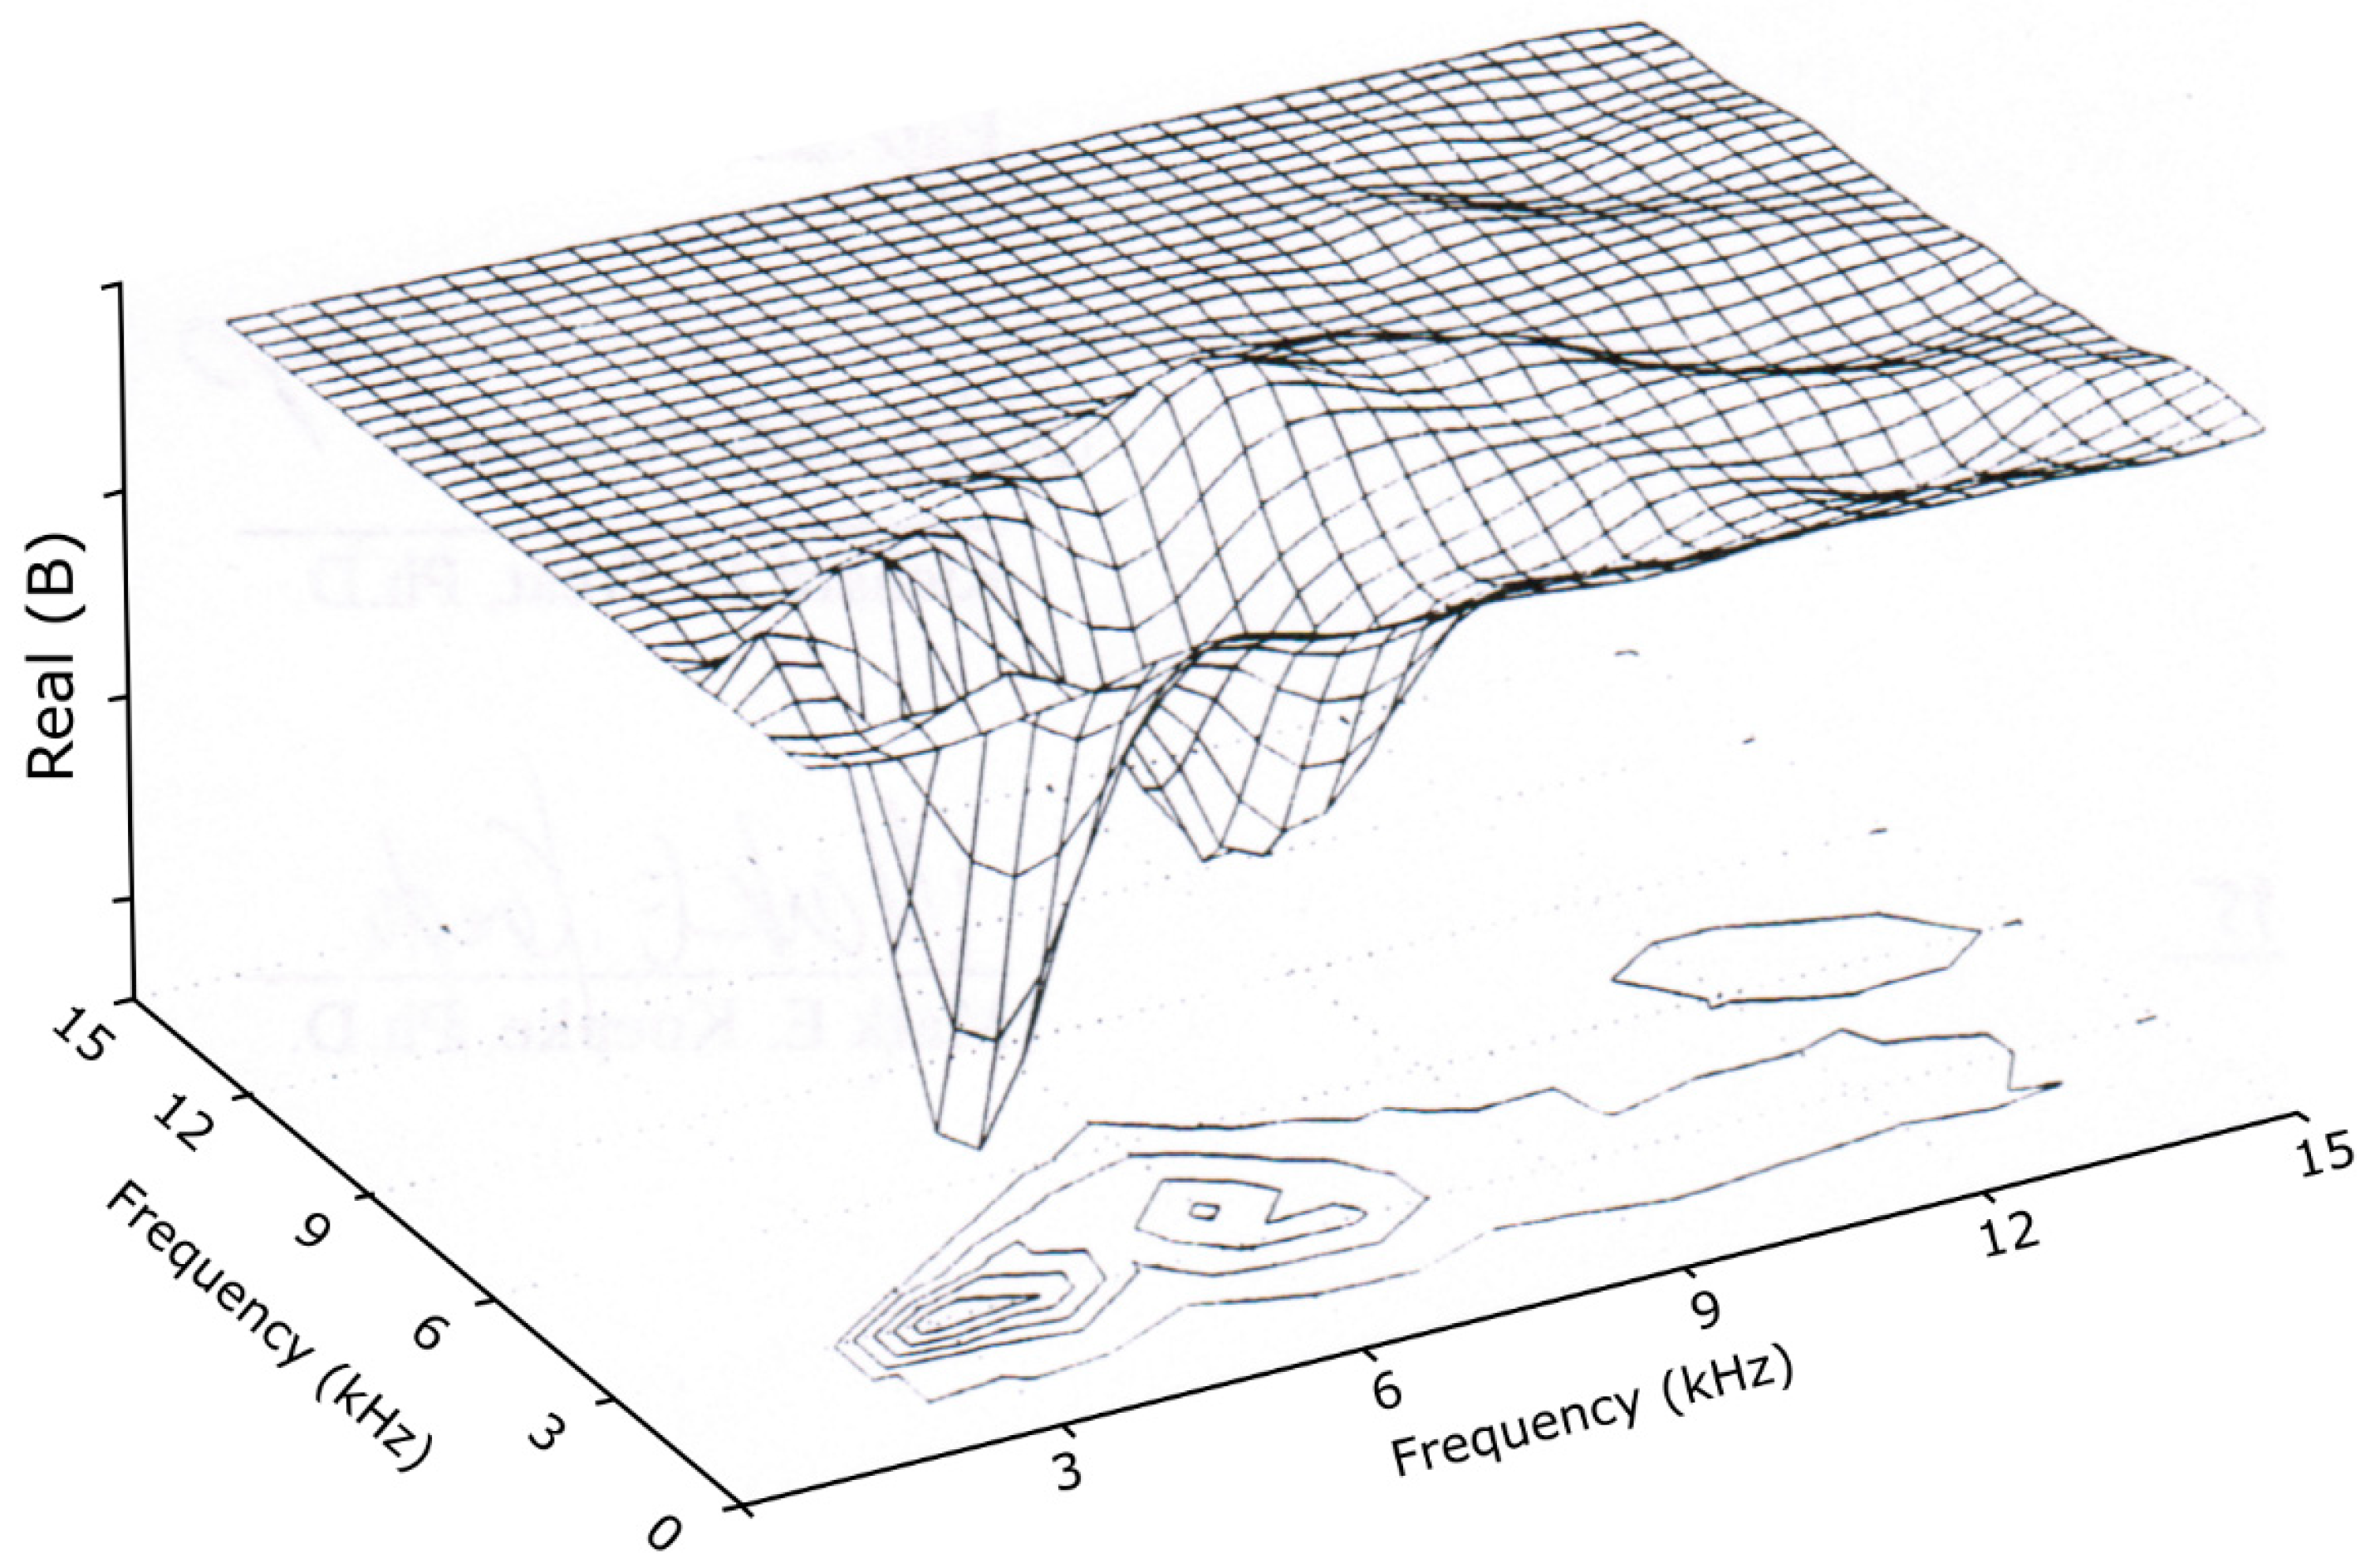
19]). Inspection of the 3D surface plots of the low-frequency group (
Figure 14) and the high-frequency group (
Figure 15) reveals the four most significant spectral features: (f
j, f
k) = (3, 3), (6, 3), (62, 6), and (65, 3), all in kHz. The third feature, evaluated with the help of
Table 2, unequivocally points to parents at (68, 62), and the fourth feature probably indicates parent waves at (68, 65).
The low-frequency peaks are more ambiguous, since none of the rows of
Table 2 can be eliminated with a significant degree of certainty, except for the (9,6) parent of the second feature. The power spectrum suggests the formation of harmonics of the 3 kHz wave. The presence of the (3,3) peak on the bispectrum confirms that the mode at the 6 kHz peak is indeed the second harmonic of 3 kHz, and not a self-excited mode. In summary, bispectral analysis suggests a “mixing down” of the IEDD spectrum into the lower-frequency drift spectrum and a coupling among various spectral components of the drift-wave oscillations.
A few words of caution are perhaps in order. First, resonant wave–wave interactions can be only partially verified without a corresponding k-space analysis, since the wavenumbers of the three modes may or may not satisfy the wavenumber selection criteria required for quadratic coupling to an acceptable degree of precision. Second, no correction has been made to offset the frequency-dependent phase shifts introduced by the bandpass filtering of the time-series data, so even a priori knowledge of wavenumbers and coupling coefficients would be subject to a complicated interpretation of the biphase. A filter similar to the one used to collect the plasma data was used to measure the phase shifts of a generated sine wave at the frequencies of interest. The result was −72 degrees at 6 kHz, +22 degrees at 62 kHz, and +24 degrees at 68 kHz, where the plus sign indicates that the output lags the input. Using this convention, and letting ϕ be the phase shift introduced by the filter:
gives a β
corrected (68 kHz, 62 kHz) value of −4 ± 12°. This indicates a reinforcing phase relation of the parent waves with respect to the low-frequency daughter wave.
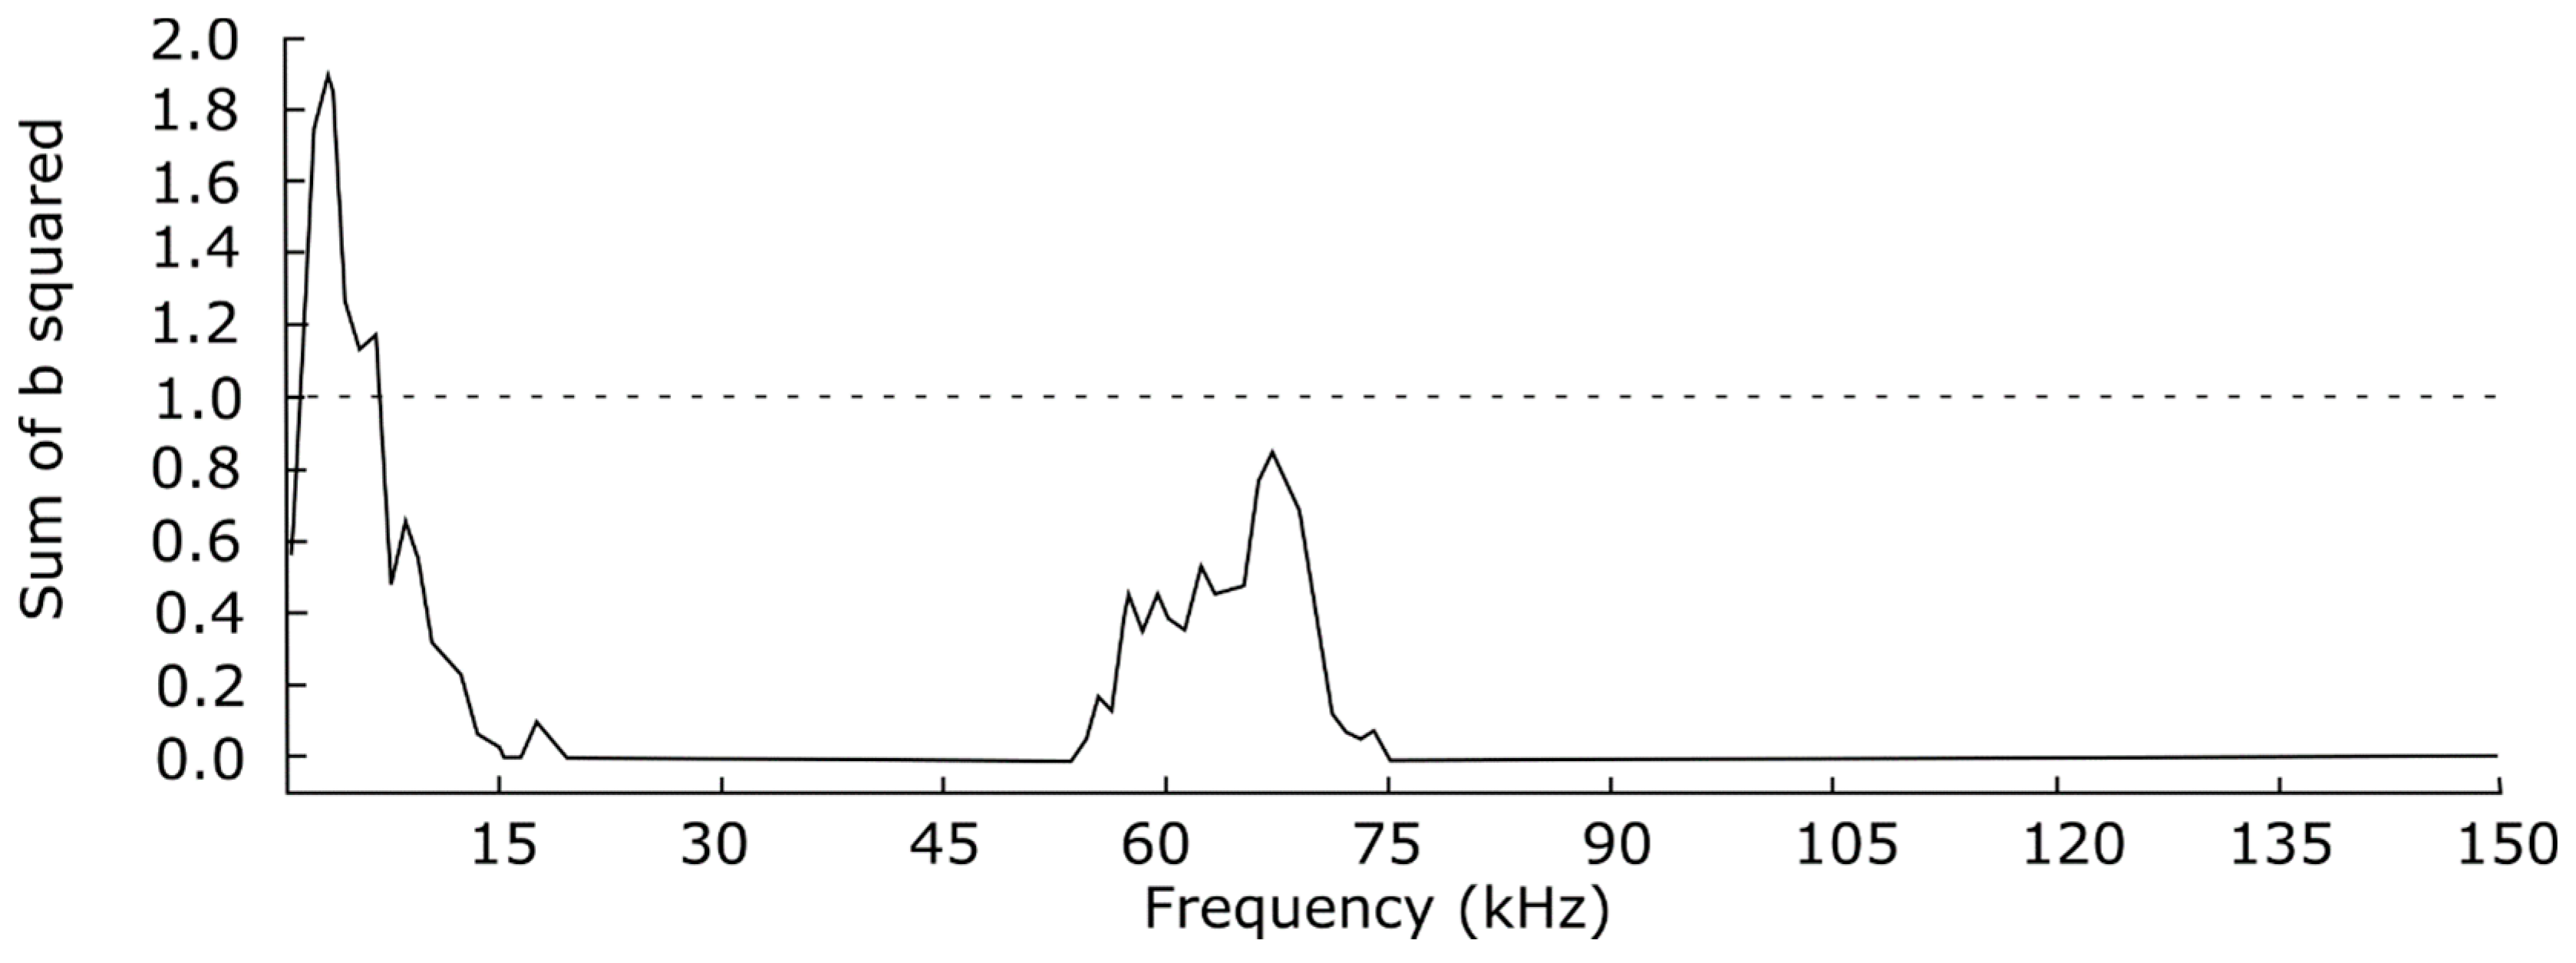
The plot of summed bicoherence vs. interaction frequency for the IEDD data provides an additional indication that something other than the coupling of drift waves among themselves is responsible for the growth in low-frequency turbulence (see
Figure 16).
Compared to drift waves in the CDEIC case, drift waves present in the IEDD spectrum seem to exhibit a much stronger degree of coherence—in fact, more than is allowed for drift-wave nonlinear interactions. One could infer that the difference is the result of coupling with the higher-frequency IEDD instability (harmonic generation of drift waves is not excluded in Tsui’s derivation). It may be plausible that this coupling is facilitated by the more broadband spectrum associated with IEDD fluctuations and is inhibited by the narrow CDEIC wave spectrum. Also note that at the center frequency of the IEDD mode, the sum of the squared bicoherence is close to one. In the context of three-wave coupling models, a value of one indicates coherent wave coupling [
10]. The low value of this sum at intermediate (20 kHz–55 kHz) and high frequencies (greater than 75 kHz) is consistent with random, non-coherent interactions among the background turbulence (a somewhat surprising result, given the relatively high power of the intermediate frequencies).
6. Conclusions
Our experimental efforts to identify shear-driven and shear-modified mechanisms have contributed to linking the cause and effect of plasma heating, mixing, and transport. Applying a radially localized radial electric field reduces the parallel-to-B current threshold for exciting ion-cyclotron turbulence, broadens the wave spectrum in the ion-cyclotron-range, strengthens the amplitude and frequency range of the lower-frequency drift-wave spectrum, and increases the coherence between ion-cyclotron spectral components and between those components and drift-wave spectral components. This represents the direct relevance of this work to non-equilibrium dynamics, interfaces and mixing. Compared to drift waves in the CDEIC case, the drift waves present in the IEDD spectrum exhibit a stronger degree of coherence—probably as a result of coupling with the higher-frequency IEDD instability. It may be plausible that this coupling is facilitated by the more broadband spectrum associated with IEDD fluctuations and is inhibited by the narrow CDEIC wave spectrum. In contrast, the background turbulence is characterized by random, non-coherent interactions.
We offer an identification scheme for parents and daughter, which is the second novel dimension of this work. We distinguish narrowband from broadband (turbulence) waves, the difference being the enhancement of the low-frequency drift waves. Specifically, a method of determining causality is proposed and subjected to empirical tests with these signals. The proposed method is shown to be valid (with some limitations) in experimental systems. A bispectral analysis of two distinct plasma instabilities reveals a degree of coupling of the IEDD mode to drift waves that is absent in the CDEIC fluctuations. It is concluded, with acceptable ambiguity, that the parents of the nonlinear interaction are the high-frequency IEDD modes. The quadratic coupling of these waves produces daughters at a difference frequency that tends to increase the power of the drift waves.
