Emission of β+ Particles Via Internal Pair Production in the 0+ – 0+ Transition of 90Zr: Historical Background and Current Applications in Nuclear Medicine Imaging

Abstract
:1. Introduction
2. Internal Pair Production Following the 0+ – 0+ Transition of 90Zr
 (1.022 MeV, where me is the mass of the electron), transition can occur via electron-positron internal pair creation. c) two-photon emission, which is generally negligibly small.
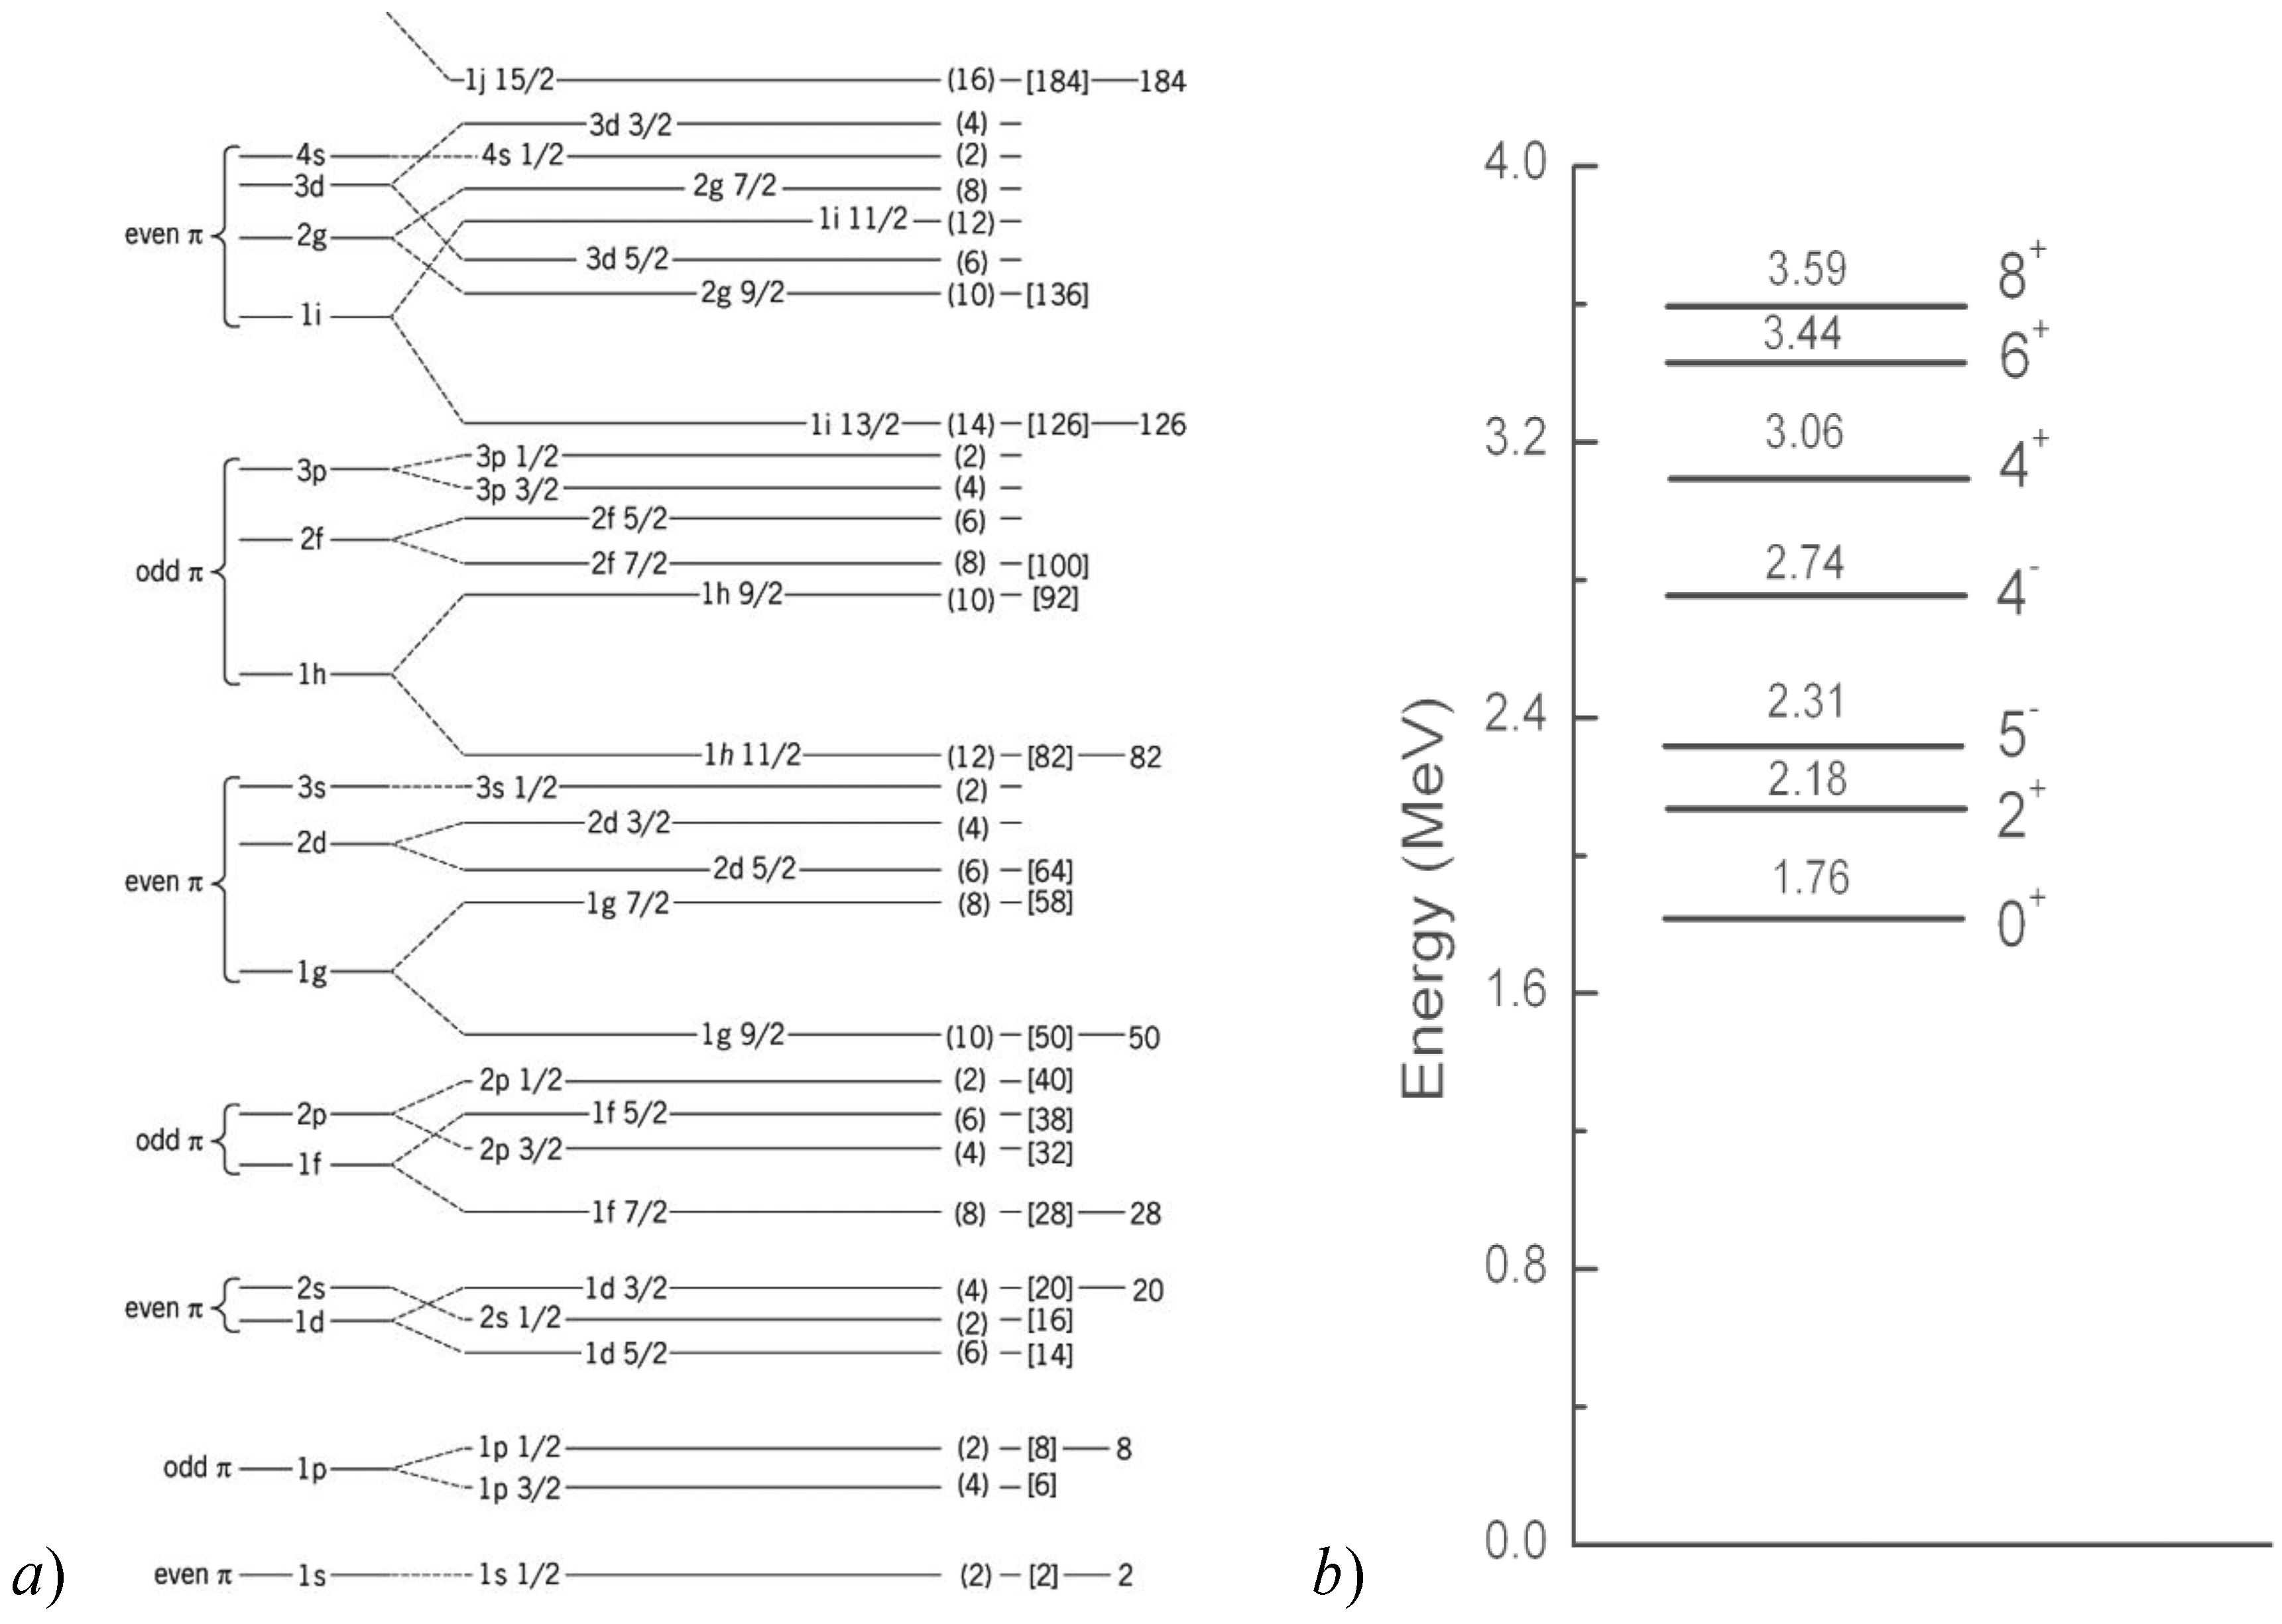
 . 28 of 40 protons fill first four shells, while the remaining 12 fill
  ,
,  and
and  . If one of the protons in is excited to , the remaining proton in and the proton in can form states with odd parity and
  and 5. There are indeed 4- and 5- states. - State 5 is lower presumably because two protons are closer in space by lining up the orbital angular momenta. If both protons are excited from to , it could give
  Nevertheless, the anti-symmetry of the wave function allows only states with
  .They should all have even parity. Indeed, 0+, 2+, 4+, 6+, 8+ are observed in this order (Figure 1b).
 . These authors also reported the probability of pair creation per beta decay as:
 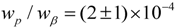 .
.  the nuclear wave function one has [4]:

 to state
  is defined by:

 represents a summation over all nuclear protons at positions
  and the parameter
  is the nuclear radius. Therefore the internal pair production probability,
  , depends on the relevant matrix
  [4,5]. Most notably, they observed that the evaluation of this matrix element could only be estimated from some nuclear models. On the other hand, the relative probabilities for the emission of conversion electrons,
  , or of a positron electron pair involve only an evaluation of the electron wave functions at the nuclear surface. Using the Thomas formulation for and no specific nuclear property, not even the nuclear radius, enter the ratio of internal conversion to internal pair creation. is given by the following analytic formula [5]:


 , α=1/137 fine structure constant, R nuclear radius, Z atomic number of the element and
  denotes the gamma function. In Equation 3, units have been chosen such that m, c,
  are equal to unity. , is:

 is the energy of the outgoing electron, E is the transition energy and
  is its momentum of the electron. For large Z (>60), so that
  , the following useful approximation may be inserted into Equation (5):

 , good for all nuclei with
  . Then one immediately obtains the relative probability of the emission of conversion electrons to that of a positron electron pair creation:


 and a probability of pair creation per beta decay
 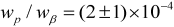 . As a consequence, using the experimental data obtained by Johnson, one would obtain:

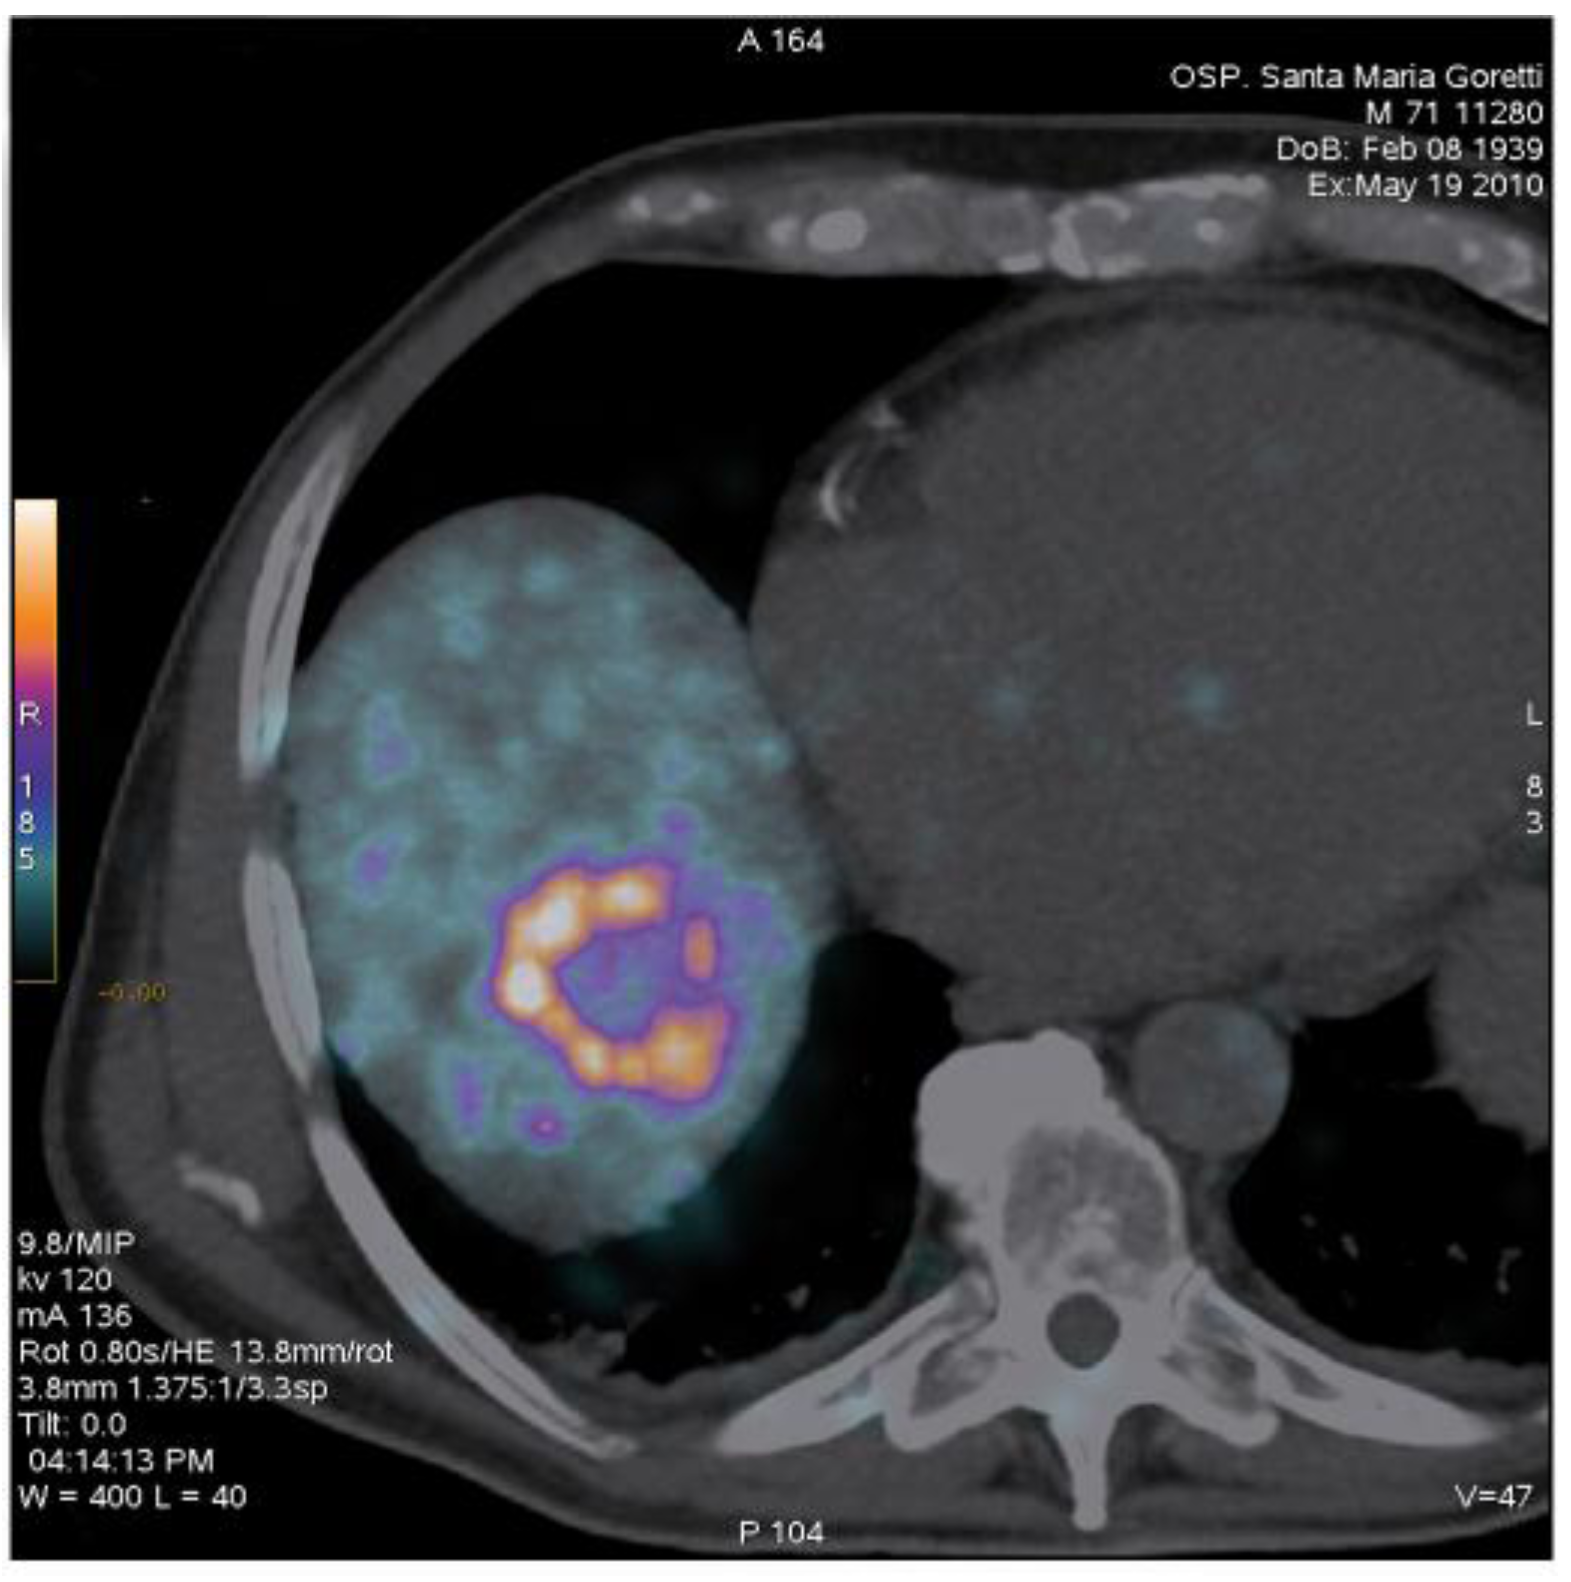
 ratio obtained by the two authors, Greenberg and Deutsch decided to measure the number of positrons per beta decay of 90Y with their apparatus.
 . Combined with the data for the intensity of the conversion line obtained by from Johnson and colleagues, they obtained an experimental value for the probability of pair creation per beta decay as
  , in moderate agreement with the calculation of Thomas.
 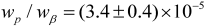 and a relative probability of the emission of conversion electrons to that of total beta decays to be
  .
.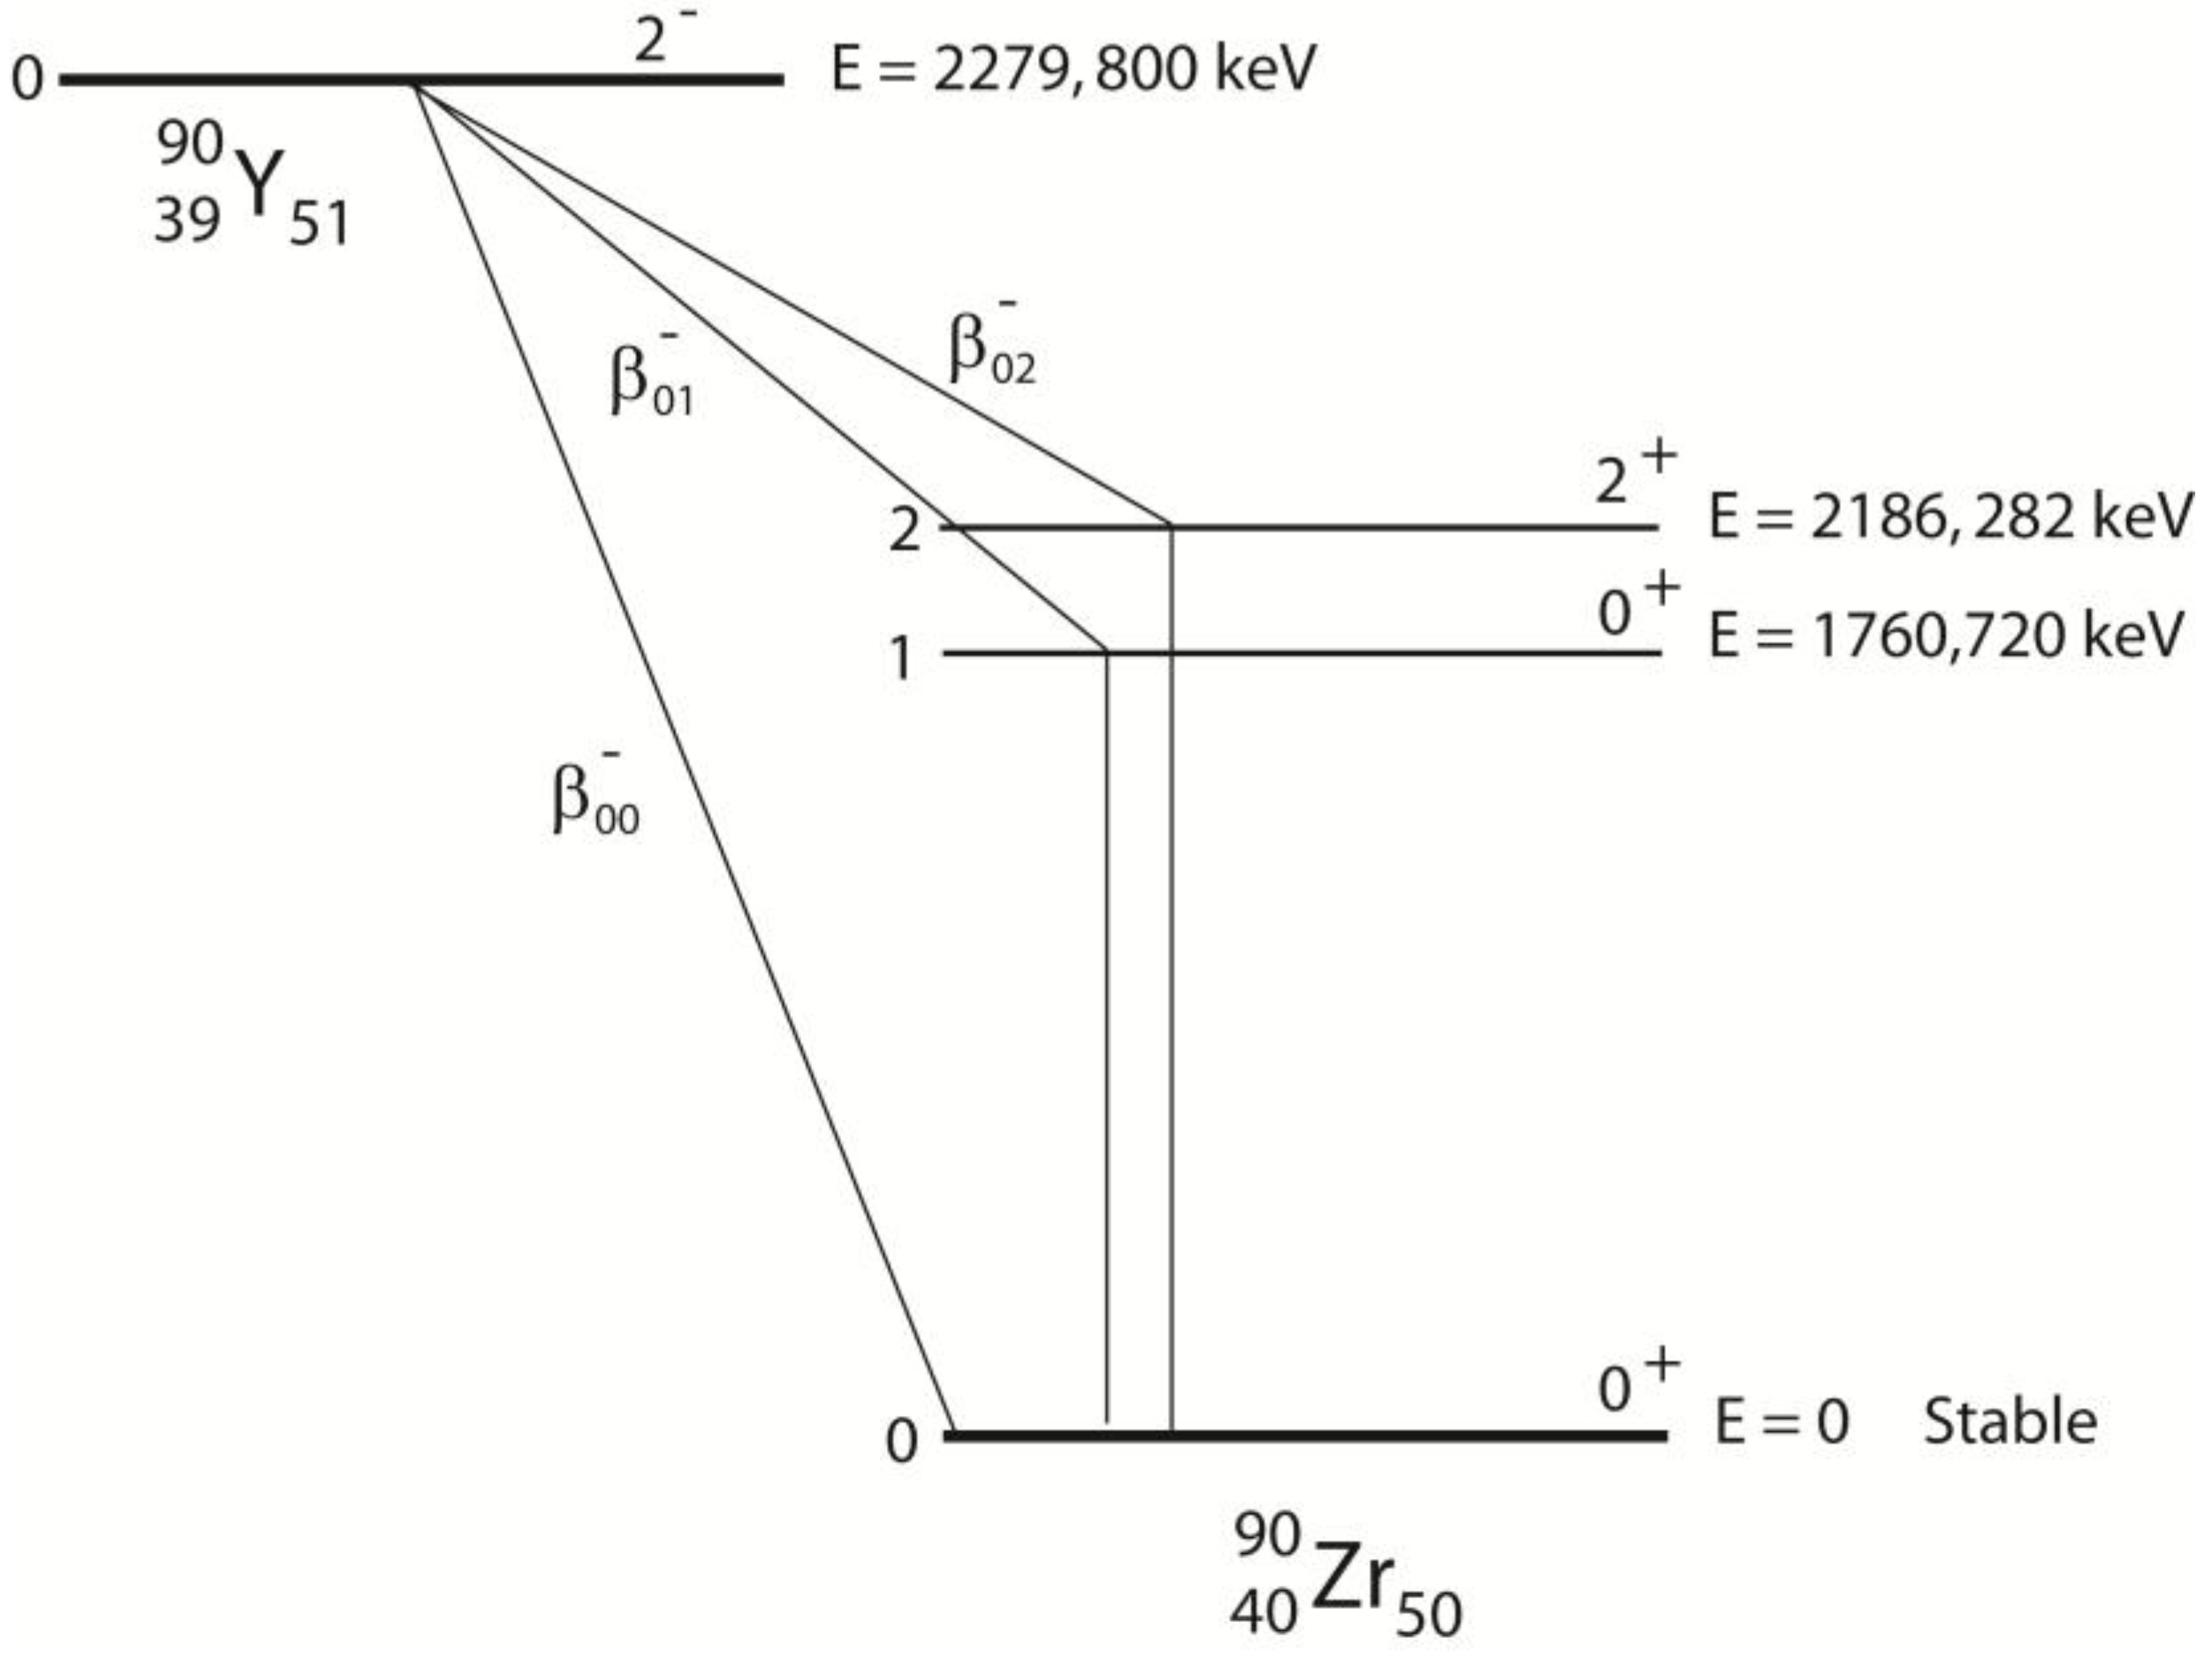
 . Figure 3 shows the decay scheme of 90Y, while in Table 1 the experimental values for the internal pair production branch ratio of the 0+/0+ transition of 90Zr are reported.
| Reference |  | Detector |
|---|---|---|
| Johnson et al.(1955) |  | NaI |
| Greenberg and Deutsch (1955) |  | NaI |
| Langhoff and Hennies (1961) |  | NaI |
| Selwyn et al. (2006) |  | HPGe |
| Energy (keV) | Probability (x 100) | Nature | |
|---|---|---|---|
 | 93.5 (17) | 0.0000014 (3) | 1st forbidden |
 | 519,1 (17) | 0,017 (6) | Unique first forbidden |
 | 2279,8 (17) | 99,983 (6) | Unique first forbidden |
| Energy (keV) | Probability γ+ce (x 100) | Multipolarity | |
|---|---|---|---|
 | 1760,7 (2) | 0.0000014 (3) | E0 |
 | 2186,282 (10) | 0,017 (6) | E2 |
3. Exploitation in Nuclear Medicine of the β+/β–Emission from the 0+ – 0+ Transition of 90Zr

4. Conclusions
 , measured by Selwyn and colleagues using a HPGe detector. Different studies indicate that the high-resolution images attainable with 90Y PET may allow for accurate patient dosimetry after locoregional administration of 90Y for therapeutic purposes.
 References and Notes
- Schirmer, J.; Habs, D.; Kroth, R. Double Gamma Decay in 40Ca and 90Zr. Phys. Rev. 1984, 53, 1897. [Google Scholar]
- Ford, K. Predicted 0+ level of Zr90. Phys. Rev. 1955, 98, 1516. [Google Scholar] [CrossRef]
- Johnson, O.; Johnson, R.; Langer, L. Evidence for a 0+ first excited state in Zr90. Phys. Rev. 1955, 98, 1517–1518. [Google Scholar] [CrossRef]
- Greenberg, J.S.; Deutsch, M. Positrons from the decay of P32 and Y90. Phys. Rev. 1956, 102, 415–421. [Google Scholar] [CrossRef]
- Thomas, R. Internal pair production in radium C’. Phys. Rev. 1940, 58, 714–715. [Google Scholar] [CrossRef]
- Ryde, H.; Thieberger, P.; Alvager, T. Two-photon de-excitation of the 0+ level in Zr90. Phys. Rev. Lett. 1961, 6, 475–476. [Google Scholar] [CrossRef]
- Langhoff, H.; Hennies, H. Zum experimentellen Nachweis von Zweiquantenzerfall beim 0+–0+ Ubergang des Zr90. Zeitschrift fur Physik 1961, 164, 166–173. [Google Scholar] [CrossRef]
- Selwyn, R.G.; Nickles, R.J.; Thomadsen, B.R.; DeWerd, L.A.; Micka, J.A. A new internal pair production branching ratio of 90Y: the development of a non-destructive assay for 90Y and 90Sr. Appl. Radiat. Isot. 2006, 65, 318–327. [Google Scholar]
- Bé, M.-M.; Chisté, V.; Dulieu, C.; Mougeot, X.; Browne, E.; Chechev, V.; Kuzmenko, N.; Kondev, F.; Luca, A.; Galán, M.; Arinc, A.; Huang, X. Table of Radionuclides, Monographie BIPM-5. 2010; ISBN 92-822-2207-7. [Google Scholar]
- Brans, B.; Linden, O.; Giammarile, F.; Tennvall, J.; Punt, C. Clinical applications of newer radionuclide therapies. Eur. J. Cancer 2006, 42, 994–1003. [Google Scholar] [CrossRef]
- Nickles, R.J.; Roberts, A.D.; Nye, J.A.; Converse, A.K.; Barnhart, T.E.; Avila-Rodirguez, M.A. Assaying and PET imaging of yttrium-90: l>>34 ppm>0. IEEE Nuclear Science Symposium Record 2004, 6, 3412–3414. [Google Scholar]
- Lhommel, R.; Goffette, P.; Van den Eynde, M.; Jamar, F.; Pauwels, S.; Bilbao, J.; Walrand, S. Yttrium-90 TOF PET scan demonstrates high-resolution biodistribution after liver SIRT. Eur. J. Nucl. Med. Mol. Imaging 2009, 36, 1696. [Google Scholar] [CrossRef]
- Lhommel, R.; van Elmbt, L.; Goffette, P.; Van den Eynde, M.; Jamar, F.; Pauwels, S.; Walrand, S. Feasibility of 90Y TOF PET-based dosimetry in liver metastasis therapy using SIR-Spheres. Eur. J. Nucl. Med. Mol. Imaging 2010, 37, 1654–1662. [Google Scholar]
- Werner, M.K.; Brechtel, K.; Beyer, T.; Dittmann, H.; Pfannenberg, C.; Kupfershlager, J. PET/CT for the assessment and quantification of 90Y biodistribution after selective internal radiotherapy (SIRT) of liver metastases. Eur. J. Nucl. Med. Mol. Imaging 2010, 37, 407–408. [Google Scholar] [CrossRef]
- Gates, V.L.; Esmail, A.A.; Marshall, K.; Spies, S.; Salem, R. Internal pair production of 90Y permits hepatic localization of microspheres using routine PET: proof of concept. J. Nucl. Med. 2011, 52, 72–76. [Google Scholar]
- Bagni, O.; D’Arienzo, M.; Chiaramida, P.; Chiacchiararelli, L.; Cannas, P.; D’Agostini, A.; Cianni, R.; Salvatori, R.; Scopinaro, F. 90Y-PET for the assessment of microsphere biodistribution after selective internal radiotherapy (SIRT). Nucl. Med. Commun. 2012, 33, 198–204. [Google Scholar] [CrossRef]
- D'Arienzo, M.; Chiaramida, P.; Chiacchiararelli, L.; Coniglio, A.; Cianni, R.; Salvatori, R.; Ruzza, A.; Scopinaro, F.; Bagni, O. 90Y PET-based dosimetry after selective internal radiotherapy treatments. Nucl. Med. Commun. 2012, 33, 633–640. [Google Scholar]
- Willowson, K.; Forwood, N.; Jakoby, B.W.; Smith, A.M.; Bailey, D.L. Quantitative 90Y image reconstruction in PET. Med. Phys. 2012, 39, 7153–7159. [Google Scholar]
- Fabbri, C.; Mattone, V.; Casi, M.; De Lauro, F.; Agostini, M.; Bartolini, N.; D'Arienzo, M.; Marchi, G.; Bartolomei, M.; Sarti, G. Quantitative Evaluation On 90Y-DOTATOC PET And SPECT Imaging By Phantom Acquisitions And Clinical Applications In Locoregional And Systemic Treatments. Q. J. Nucl. Med. Mol. Imaging 2012, 56, 522–528. [Google Scholar]
© 2013 by the authors; licensee MDPI, Basel, Switzerland. This article is an open access article distributed under the terms and conditions of the Creative Commons Attribution license (http://creativecommons.org/licenses/by/3.0/).
Share and Cite
D'Arienzo, M. Emission of β+ Particles Via Internal Pair Production in the 0+ – 0+ Transition of 90Zr: Historical Background and Current Applications in Nuclear Medicine Imaging. Atoms 2013, 1, 2-12. https://doi.org/10.3390/atoms1010002
D'Arienzo M. Emission of β+ Particles Via Internal Pair Production in the 0+ – 0+ Transition of 90Zr: Historical Background and Current Applications in Nuclear Medicine Imaging. Atoms. 2013; 1(1):2-12. https://doi.org/10.3390/atoms1010002
Chicago/Turabian StyleD'Arienzo, Marco. 2013. "Emission of β+ Particles Via Internal Pair Production in the 0+ – 0+ Transition of 90Zr: Historical Background and Current Applications in Nuclear Medicine Imaging" Atoms 1, no. 1: 2-12. https://doi.org/10.3390/atoms1010002
APA StyleD'Arienzo, M. (2013). Emission of β+ Particles Via Internal Pair Production in the 0+ – 0+ Transition of 90Zr: Historical Background and Current Applications in Nuclear Medicine Imaging. Atoms, 1(1), 2-12. https://doi.org/10.3390/atoms1010002