Abstract
Thanks to the VIR spectrometer onboard NASA’s Dawn spacecraft, which orbited Vesta in 2011–2012, thousands of hyperspectral images of its surface have been collected. The mission confirmed the HED (Howardite–Eucrite–Diogenite) meteorite composition of Vesta. Moreover, the VIR spectrometer detected the 2.8 µm absorption band, due to the presence of the OH molecule. In this work, we took advantage of the newly calibrated data of the VIR spectrometer by characterizing new spectral features thanks to the improved signal-to-noise (S/N) ratio for these spectra. The main goals of this work are as follows: (1) to characterize Vesta’s surface in the visible range and (2) to confirm, reinforce and characterize the OH distribution on Vesta by studying the 2.8 µm band and looking for OH combination bands around 2.2–2.4 µm. A possible relation between the 1.9 µm absorption band due to the presence of pyroxenes and the one at 0.5 µm was analyzed. Finally, the analysis of hydroxyl absorption bands evidenced an anti-correlation between the abundance of hydroxyl-bearing molecules and the surface reflectance. This confirms that the hydroxyl presence is linked to the dark units on Vesta.
1. Introduction
NASA’s Dawn mission was launched in September 2007 and orbited the Vesta (2011–2012) and Ceres (2015–2018) asteroids. The Dawn spacecraft’s scientific payload consisted of a Framing Camera (FC) [1], a Visible and InfraRed spectrometer (VIR) [2] and a Gamma Ray and Neutron Detector (GRaND) [3], as well as a radio science experiment.
The 4 Vesta asteroid is a differentiated asteroid, i.e., it has experienced melting, and now its structure is composed of distinct layers: crust, mantle and nucleus [4]. Hence, the study of the materials coming from different depths of Vesta can help to understand its evolutionary history.
Before Dawn’s arrival in 2011, telescopic observations of Vesta showed a similar surface composition with an increasing number of small asteroids that, as a consequence, were taxonomically classified as V-type asteroids [5,6]. The reflectance spectra of Vesta and of V-type asteroids are very similar to those of HEDs (Howardite–Eucrite–Diogenite meteorites) [7], suggesting that it is their parent body [4].
After Dawn’s arrival, Vesta’s VIR spectra showed two absorption bands at 0.9 and 1.9 µm due to electronic transitions and associated with iron-bearing low-calcium pyroxenes [4,8,9,10], and also two absorption bands around 506 and 550 nm due to the Fe2+ spin-forbidden transition [11,12], which have been mapped on Vesta’s surface [13,14].
A fundamental vibrational absorption at 2.8 µm due to the presence of hydroxyl on Vesta is present in VIR data for some areas, but its distribution is uneven [15]. This result suggests that Vesta contains hydrated mineral phases that might be endogenic to Vesta or could have been supplied by OH-bearing impactors [15]. Alternatively, OH might be created by the interaction between solar-wind protons and the surface, forming superficial OH bonds [16,17]. On Vesta, there are no significant correlations between the 2.8 µm band depth and illumination or temperature, and since the temperature of the surface of Vesta is ≤273 K, its thermal emission is not detectable in the spectra around 2.8 µm [15]. OH-bearing impactors are the main candidates as sources of OH signatures, because the 2.8 µm signature is often associated with low albedo areas, i.e., its band depth increases with decreasing albedo [15,18]. This suggests that OH signatures could be associated with exogenous dark materials, probably carbonaceous chondrites accreted from infalling primitive asteroids that are common in the main belt.
Combination bands in the 2 µm region that involve the OH fundamental stretching mode generally appear in pairs between around 2.2 and 2.4 µm; this possible absorption band has never been found before in Vesta’s VIR spectra because of its weakness [19,20]. Since it is a combination band, it is also weaker than the 2.8 µm band, and considering that it is located inside the wide 1.9 µm absorption band, it was not observed in the old calibrated VIR spectra.
In this work, the 2.8 µm hydroxyl absorption band is analyzed as a function of reflectance in order to check their anti-correlation in newly calibrated data and identify possible geological units of Vesta outside of this general trend that could not be explained by the impact of exogenous carbonaceous chondrites. The hydroxyl combination band at 2.2–2.4 µm, hardly observed in previously calibrated data, is also studied with the purpose of finding a correlation with the 2.8 µm band. Finally, the 0.5 µm band is characterized by relating it with the pyroxene infrared absorption band at 1.9 µm.
2. Dataset Description and Calibration
2.1. VIR Spectrometer
The VIR spectrometer is derived from the VIRTIS-M on board the ESA’s Rosetta [21,22,23] and Venus Express missions [24]. VIR mapping spectrometer acquires data in two spectral channels. The visible channel spectral range is between 0.25 and 1.05 µm, and the infrared one is between 1.0 and 5.0 µm. The high spatial (IFOV = 250 µrad/pixel, FOV = 64 × 64 mrad) and spectral (ΔλVIS = 1.8 nm/band; ΔλIR = 9.8 nm/band) performances allow for the identification and mapping of the compositional units of the surfaces [2]. The VIR spectral range allowed us to analyze the spectral signatures of minerals expected on the surface of Vesta (and also of Ceres) and their distribution, providing further insight into the conditions of the early solar system. In Table 1, the altitude, latitude and spatial resolution of VIR are reported; the different phases correspond to different values of the orbital parameters. In the following, only data from Hamo and Hamo-2 phases were used, which have both good spatial resolution and high coverage of Vesta’s surface. They were also used to compare pixels with a similar spatial resolution.

Table 1.
Observation parameters of the orbital phases.
2.2. Data Calibration
After the radiometric and spectral calibration, the VIR data are still affected by residual artifacts that were removed by applying a denoising algorithm [25]. The denoising procedure consisted of computing the artifact profiles using the VIR data where there were no relevant absorptions in the spectra. Starting from this dataset, a median spectrum that characterized systematic residuals for each sample of the cube was obtained. A polynomial function was then fitted to each median spectrum. The artifact profiles were defined as . In the last step, the column-dependent artifacts were removed from the reflectance values applying the artifact profile to the VIR reflectance spectra for each line. Using this procedure, it was possible to remove the high-frequency variations. This correction was also verified on the VIR data of Ceres.
Moreover, correction factors derived from ground-based observations were applied to correct fictitious slopes on spectra of both VIR channels [26]. To apply the ground correction, it was necessary to obtain ground observations of Vesta and then calculate the ratio between the smooth averaged spectrum of the ground-based spectra and the average spectrum of the VIR-IR calibrated data after artifact correction. This ratio spectrum was used as a multiplicative correction factor on every single VIR spectrum.
Data acquired from Vesta by the visible channel of VIR are affected by the temperature of the visible sensor. The variations of the visible channel temperatures measured during the sessions of acquisitions were correlated with the variations in the spectral slope and shape for all the mission phases. An empirical correction based on a reference spectrum for the whole dataset was developed and applied [27]. Moreover, the thermal emission of Vesta was also removed from the data.
3. Pyroxene Signatures
In the previous work of reference [12], pyroxenes show two spin-forbidden absorption bands at 506 and 550 nm that were recently used to map the surface mineralogy of Vesta [14].
In Figure 1, the mean spectrum of about one thousand of Vesta’s VIR visible spectra is shown. In this spectrum, one predominant feature can be seen: the 0.9 µm absorption band, which was extensively studied by De Sanctis et al., 2012, 2013. The spin-forbidden absorption bands of pyroxene at 506 and 550 nm are also present in the mean spectra, with the difference that the 506 nm band is narrower and deeper than the other one. The feature around 700 nm is due to an order-sorting filter.
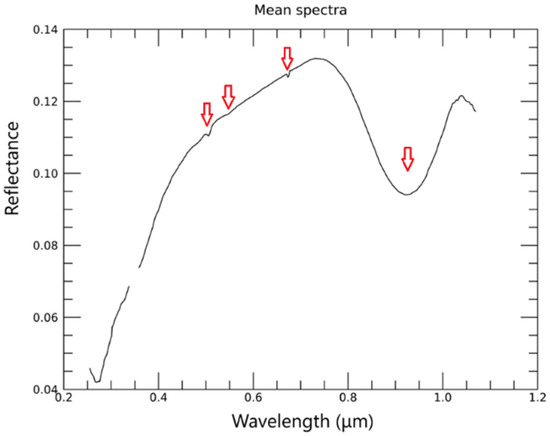
Figure 1.
Mean spectra of Vesta’s VIR visible spectrum. The read arrows indicate the spectral features present in this wavelength range.
Considering the newly calibrated VIR data characterized by a higher S/N, a procedure to characterize the 506 nm band is defined in this section. The aim is to find a correlation (across the two different channels of VIS-IR) with the well-known pyroxenes absorption band present in VIR spectra at 1.9 µm; this would confirm and reinforce the results found in the literature [14].
3.1. Methods
In order to find a relation between the 0.5 and 1.9 µm absorption bands, a procedure to calculate and then compare their band depths was defined.
To compute the band depth, the position of the band center of the absorption band, defined as the location of the reflectance minimum inside the band after the continuum removal, was calculated.
The continuum of the 0.5 µm band was defined with a linear regression between the maximum of the shoulders of the band; in particular, we defined the left shoulder between 0.49 and 0.5 µm and the right one between 0.51 and 0.52 µm.
The band depth was given by the following relation [28]:
where Rc and Rcon are the measured reflectance and the calculated continuum reflectance at the band center, respectively.
Since the 1.9 µm absorption band is wider, we have more spectral points describing it, so a different procedure to calculate its band depth was used, following Longobardo et al. (2014), Palomba et al. (2014) and Moskovitz et al. (2010). A second-order polynomial fit on the left shoulder, defined between 1.1 and 1.7 µm, and a third-order polynomial fit on the right shoulder, defined between 2.2 and 2.78 µm (Figure 2), were made. The continuum was removed from a second-order polynomial fit of the band trough in order to remove possible spikes or bumps around the band minima that could affect the value of the band depth, as shown in Figure 2. Finally, the band depth was calculated as previously defined.
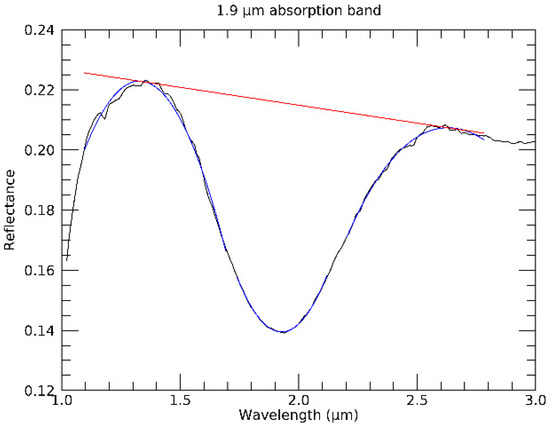
Figure 2.
The 1.9 µm absorption band and its continuum.
The band depth values of the 1.9 µm band show a dependence on the emission, incidence and phase angle of the radiation. To correct for these dependencies, the photometrical correction from Longobardo et al. 2014, described by the following relations, was applied:
where BDOBS is the observed band depth, and , BD30 is the band depth corrected at and is the reflectance corrected at . is defined in the following way:
where R is the measured reflectance, D is the Akimov disk function [29] and , , , , and are correction coefficients taken from Longobardo et al. (2014) [30].
Because of its low depth, the band depth of 0.5 µm can be considered independent of illumination and viewing angles.
3.2. Results and Discussion
The calculated band depths of the two absorption bands are plotted in a scatterplot in Figure 3 for a single datacube; specifically, a datacube where there is a higher variation in the values of the band depth of the 1.9 µm band to highlight the relation between the variables is shown.
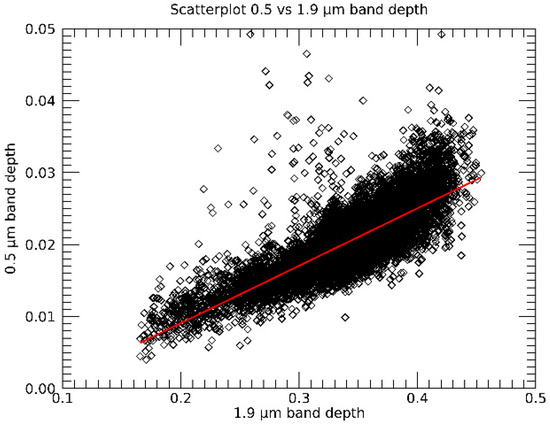
Figure 3.
Scatterplot between 0.5 and 1.9 µm band depth for a single datacube. The red line is the result of a linear fit of the points in the figure.
In Figure 3, a relation between the two spectral parameters is observed, as evidenced also by the linear fit between the two band depths. The Pearson coefficient is ρxy = 0.78, which indicates a strong linear correlation. The correlation between the 0.5 and 1.9 µm absorption bands is proved for the entire dataset.
This interpretation is strengthened by looking at the spatial distribution of the two band depths, shown in Figure 4, for one hyperspectral image. It is clear that, apart from the bright spot in the 0.5 μm map at around 67° S, 129° E that corresponds to a flawed pixel, the spatial correlation arises.
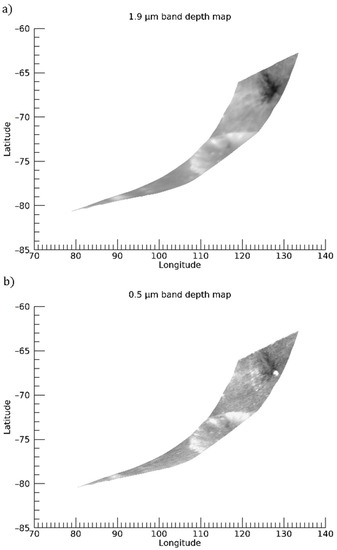
Figure 4.
(a) Map of 1.9 μm band depth. (b) Map of 0.5 μm band depth. The two maps represent a single datacube.
This correlation across two different VIR channels (IR and VIS) confirms and strengthens the relationship between the presence of the 0.5 μm absorption band and the presence of pyroxenes on Vesta.
4. Hydroxyl Signatures
In Figure 5, the mean spectrum of about four hundred of Vesta’s VIR IR spectra is shown. In this spectrum, an absorption band around 1.9 µm is present due to pyroxenes and it was largely studied by De Sanctis et al. (2012, 2013). Another band is present around 2.8 µm and is due to the presence of OH-bearing minerals [15], while its combination band around 2.2–2.4 µm is not detected by a preliminary visual inspection. Finally, above 4 µm, Vesta’s VIR IR spectra are dominated by the noise.
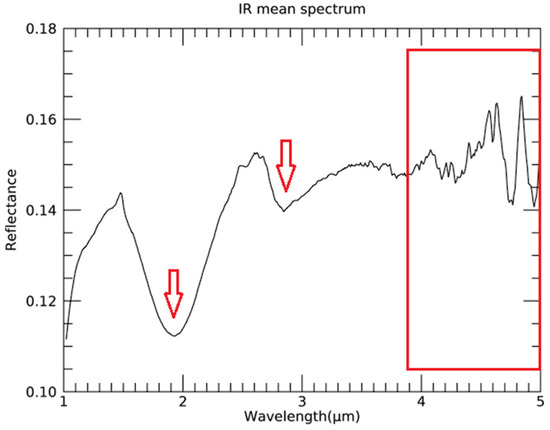
Figure 5.
IR mean spectrum of about four hundred VIR IR spectra. The red arrows indicate the spectral features in this wavelength range and the red box indicates the noisy region of the spectrum.
Here, the 2.8 µm absorption band and other possible OH signatures will be studied in greater detail, in order to characterize its distribution across Vesta’s surface and give information about its source.
4.1. Definition of the 2.8 µm Absorption Band
For the band depth, the same definition applied to other bands described previously was implemented. In this case, the S/N is lower than the 1.9 µm band; therefore, the spectra were smoothed with a boxcar on nine VIR spectral bands in the spectral range, including the hydroxyl absorption band, i.e., from 2.5 to 3.5 µm. Then, the left shoulder was defined as the maximum between 2.5 and 2.75 µm, the right shoulder as the maximum between 3 and 3.5 µm and the band trough as the minimum between 2.75 and 3 µm. The continuum is the linear fit between the two maxima.
Then, the relation between the 2.8 µm band depth and the reflectance at 1.2 µm was sought for the entire VIR dataset and compared with the results of previous works. If any difference arose, this would have meant that the high noise of the previous calibration affected the scientific conclusions about the distribution of the OH on Vesta’s surface.
To relate reflectance and OH band depth, the former was photometrically corrected, i.e., the dependence of the spectra on incidence, emission and phase angle was removed. To this end, the empirical model by Longobardo et al., 2014 (5) was adopted. The photometric correction of the 2.8 µm band depth was not necessary because it was verified that the OH band depth dependence on the phase is not negligible, but not significant for studying the OH band depth variation across Vesta’s surface [29].
4.2. Dark Regions on Vesta and Hydrated Materials
Vesta’s surface is not homogeneous in reflectance; it presents some dark areas that are listed in a catalog from Palomba et al. (2014). Dark and very dark areas on Vesta are regions where the reflectance is at least, respectively, 15% and 30% lower than the surroundings [18]. In Figure 6, the scatterplot of a single datacube containing a very dark unit is shown, chosen from those in the catalog from Palomba et al., 2014, in which the anti-correlation between the 2.8 µm band depth and the photometrically corrected reflectance at 1.2 µm is confirmed, as showed by De Sanctis et al. (2012) with the VIR data of the previous calibration.
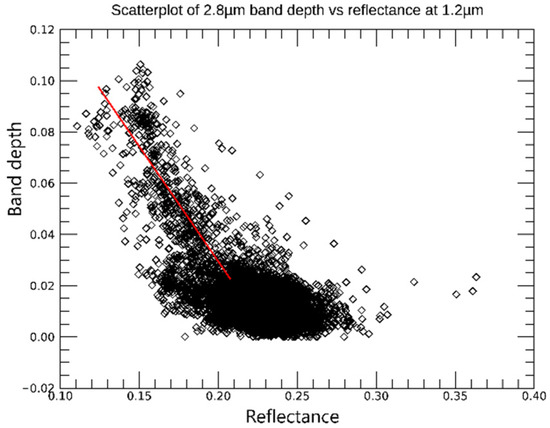
Figure 6.
Scatterplot between photometrically corrected reflectance and 2.8 µm band depth in a single datacube.
In Figure 7a,b, the OH band depth and photometrically corrected reflectance maps of the same datacube are shown. Comparing the two maps, it is clear that the 2.8 µm band depth is higher where the reflectance is lower, so the anti-correlation is also spatially verified.
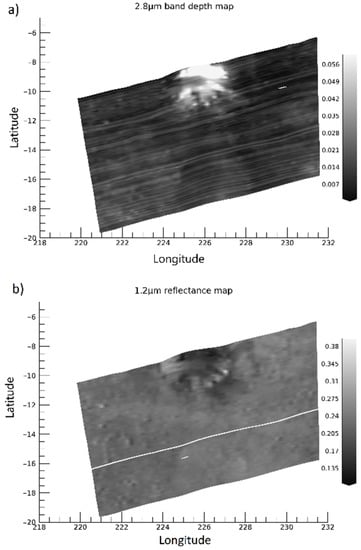
Figure 7.
(a) Map of 2.8 µm band depth values. (b) Map of 1.2 µm reflectance values.
Finally, in Figure 8, the scatterplot of 2.8 µm band depth vs. the photometrically corrected reflectance at 1.2 µm of all the very dark units in the catalog from Palomba et al. (2014) is shown with a Pearson coefficient of −0.55. Also, in this scatterplot, the anti-correlation between the band depth and the reflectance is evident. The fact that spatially uncorrelated pixels also show a slight anti-correlation confirms the anti-correlation between the two variables. Furthermore, since in Figure 8, all pixels follow the anti-correlation trend, this is evidence that all of Vesta’s dark regions include hydroxyl, ruling out other possible causes of the darkening and reinforcing the hypothesis of the presence of exogenous carbonaceous chondrites [15].
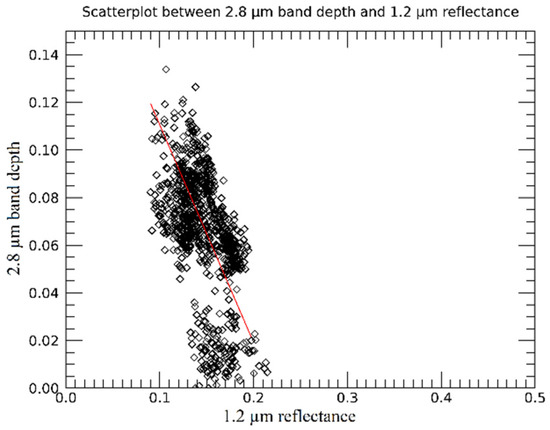
Figure 8.
Scatterplot between 2.8 µm band depth and 1.2 µm reflectance of every very dark unit on Vesta.
So far, only the very dark areas were considered, whose anti-correlation trend (Figure 8) was found even with the old calibration [18]. Otherwise, a dark unit was found outside this anti-correlation trend [18]. This area was investigated in greater detail with the newly calibrated spectra. The spectra of this area were analyzed, and some of them presented an anomalous spike on the left shoulder of the hydroxyl absorption band that induced higher band depth values. In Figure 9, the maps of reflectance and 2.8 µm band depth values are shown; in these maps, the band depth of pixels that presented the anomalous spike was set to the average band depth value of the whole datacube in order to prevent false positives. Differently from Palomba et al. (2014), the anti-correlation was found, suggesting that the anomalous behavior was due to a calibration issue and not a different darkening agent.
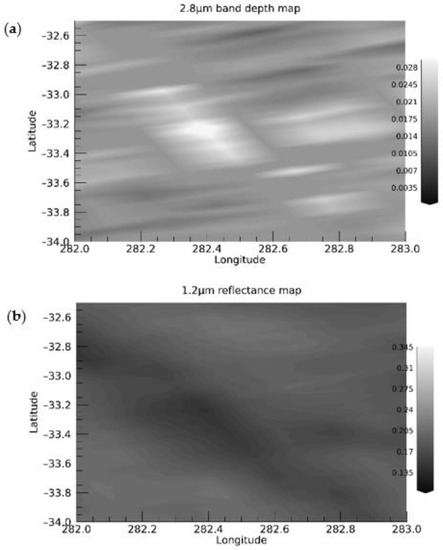
Figure 9.
(a) Map of 2.8 µm band depth map; (b) 1.2 µm reflectance map of the dark unit known to be outside the anticorrelation trend.
This anti-correlation is also confirmed in the scatterplot of reflectance versus band depth in Figure 10, with a Pearson coefficient of about 0.7. The pixels with the anomalous spike were removed from the scatterplot.
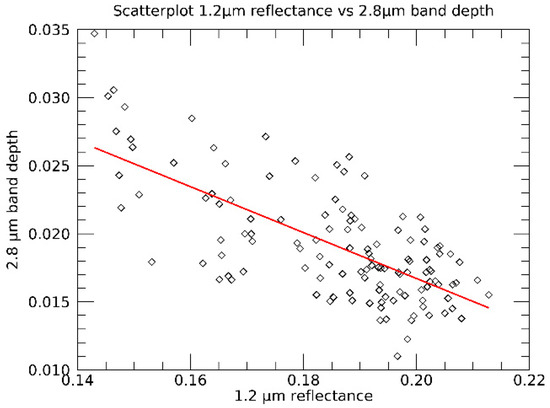
Figure 10.
Scatterplot of reflectance vs. band depth of the pixels of the dark unit known to be outside the anticorrelation trend.
These results lead to the conclusion that all dark units on Vesta are characterized by the presence of hydroxyl-bearing minerals, i.e., the dark areas on Vesta are probably due to the same source.
4.3. Search for Hydroxyl Combination Band
The OH combination band around 2.2–2.4 µm, that was not observed in the previously calibrated VIR data, was searched through all the very dark areas. The latter could appear as a couplet in the range of 2.2–2.4 µm [19]. However, from a preliminary visual analysis of the IR spectra, just one feature around 2.4 µm was observed (Figure 11).
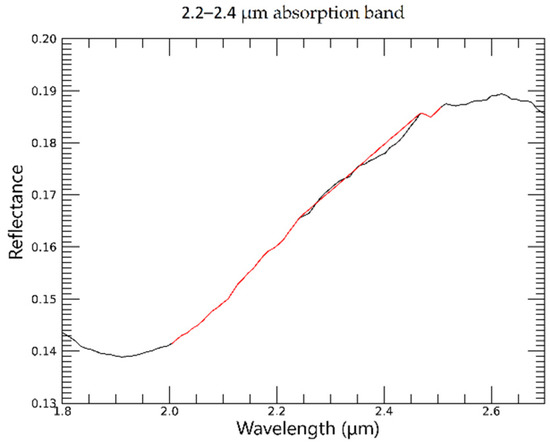
Figure 11.
Analysis procedure of 2.2–2.4 µm absorption band.
In order to verify the nature of this band (real absorption or spectral artifact), a procedure to estimate its depth was defined. Since the band is faint, the shoulders were defined as the value of the reflectance at 2.25 and 2.45 µm, respectively, and the line linking them was used as a continuum (Figure 11).
If the 2.2–2.4 µm band had been due to hydroxyl absorption, a linear dependence was expected in the scatterplot of the 2.2–2.4 µm band depth vs. the 2.8 µm band depth. This trend was not observed (Figure 12).
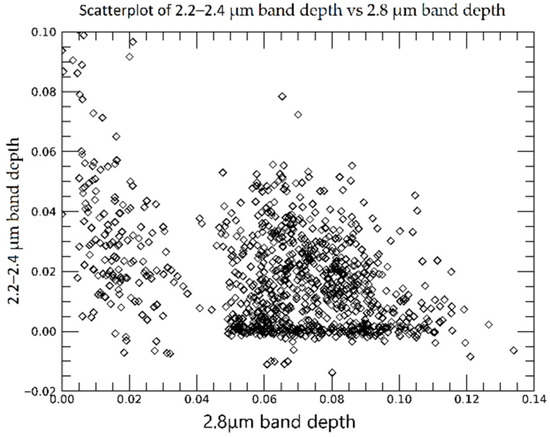
Figure 12.
Scatterplot between 2.2–2.4 and 2.8 µm band depth values of the very dark areas.
Therefore, if there is a feature related to the presence of hydroxyl, it cannot be resolved by VIR data.
Another band that could be expected on VIR spectra is the first overtone of the 2.8 µm band, which might be located at around 1.4 µm [19,20]. However, this wavelength corresponds to a VIR filter, so the associated reflectance value is not reliable, and it was not possible to look for and study this spectral signature. The fact that there are no other hydroxyl absorption bands besides the 2.8 µm one implies that the abundance of hydroxyl and hence carbonaceous chondrites can only be estimated from this band [18].
5. Conclusions
In this work, we took advantage of the new data released from the VIR spectrometer aboard NASA’s Dawn spacecraft to perform new studies focused on Vesta’s surface composition.
The goals of this work were to find diagnostic absorption bands in the visible range and analyze hydroxyl signatures.
The analysis performed on the visible spectra showed an absorption band around 0.5 µm, in addition to the well-known and strongest pyroxene absorption band centered at 0.9 µm. Thus, the link between the 0.5 µm band and the pyroxene on Vesta is confirmed and strengthened by showing the relation between the 0.5 µm band and the 1.9 µm pyroxene band. This emphasizes the results obtained in previous works, where a mineralogical characterization of Vesta was also based on the 0.5 µm absorption band [14].
The comparison of the distribution of the 2.8 µm band depth with the results known in the literature so far [15] confirms that the presence of hydroxyl is related to the dark units on Vesta. In particular, in Figure 8, it was found that every very dark unit on Vesta follows the anti-correlation trend and hence contains hydroxyl-bearing molecules. The same conclusion was obtained for the dark units, since with the analysis performed in this work (Figure 9 and Figure 10), even the dark unit that was found to be outside this trend by previous works [18] is indeed inside it. Then, the results of this work make it possible to suppose that the sources of dark units on Vesta’s surface are the same for every unit. Since OH is a component of carbonaceous chondrites, this finding supports the hypothesis that these chondrites are the main, if not the only, ones responsible for the darkening of several surface units.
Finally, additional information on hydroxyl could be obtained from the combination bands centered around 2.2–2.4 µm. In this case, a correlation between the 2.2–2.4 and the 2.8 µm band depth was investigated: a weak feature at 2.4 µm was found, but no correlation was proved; therefore, this feature is not related to the presence of hydroxyl. The absence of combination bands of the hydroxyl means that its abundance is not sufficient to detect these features.
Author Contributions
Conceptualization, E.P., A.L. and G.M; methodology, A.L., E.P. and G.M.; software, G.M. and A.L.; validation, E.P. and A.L.; formal analysis, A.L., E.P. and G.M; investigation, G.M.; resources, M.C.D.S.; writing—original draft preparation, G.M.; writing—review and editing, G.M., A.L., M.A., C.G., F.D., E.P., M.C.D.S., M.C., F.G.C. and A.R.; visualization, G.M., A.L., M.A., C.G., F.D., E.P., M.C.D.S., M.C., F.G.C. and A.R.; supervision, A.L. and E.P. All authors have read and agreed to the published version of the manuscript.
Funding
This research received no external funding.
Data Availability Statement
VIR data of Vesta are available on the Planetary Data System (PDS) archive (https://sbn.psi.edu/pds/resource/dawn/ accessed on 1 May 2023).
Conflicts of Interest
The authors declare no conflict of interest.
References
- Sierks, H.; Keller, H.U.; Jaumann, R.; Michalik, H.; Behnke, T.; Bubenhagen, F.; Büttner, I.; Carsenty, U.; Christensen, U.; Enge, R.; et al. The Dawn framing camera. Space Sci. Rev. 2011, 163, 263–327. [Google Scholar] [CrossRef]
- De Sanctis, M.C.; Coradini, A.; Ammannito, E.; Filacchione, G.; Capria, M.T.; Fonte, S.; Magni, G.; Barbis, A.; Bini, A.; Dami, M.; et al. The VIR spectrometer. In The Dawn Mission to Minor Planets 4 Vesta and 1 Ceres; Springer: New York, NY, USA, 2011; pp. 329–369. [Google Scholar]
- Prettyman, T.H.; Feldman, W.C.; McSween, H.Y.; Dingler, R.D.; Enemark, D.C.; Patrick, D.E.; Storms, S.A.; Hendricks, J.S.; Morgenthaler, J.P.; Pitman, K.M.; et al. Dawn’s gamma ray and neutron detector. In The Dawn Mission to Minor Planets 4 Vesta and 1 Ceres; Springer: New York, NY, USA, 2011; pp. 371–459. [Google Scholar]
- De Sanctis, M.C.; Ammannito, E.; Capria, M.T.; Tosi, F.; Capaccioni, F.; Zambon, F.; Carraro, F.; Fonte, S.; Frigeri, A.; Jaumann, R.; et al. Spectroscopic characterization of mineralogy and its diversity across Vesta. Science 2012, 336, 697–700. [Google Scholar] [CrossRef]
- DeMeo, F.E.; Binzel, R.P.; Slivan, S.M.; Bus, S.J. An extension of the Bus asteroid taxonomy into the near-infrared. Icarus 2009, 202, 160–180. [Google Scholar] [CrossRef]
- Angrisani, M.; Palomba, E.; Longobardo, A.; Raponi, A.; Dirri, F.; Gisellu, C. A new prospect to analyse the spectral properties of v-type asteroids. Icarus 2023, 390, 115320. [Google Scholar] [CrossRef]
- McSween, H.Y., Jr.; Binzel, R.P.; De Sanctis, M.C.; Ammannito, E.; Prettyman, T.H.; Beck, A.W.; Reddy, V.; Le Corre, L.; Gaffey, M.J.; McCord, T.B.; et al. Dawn; the Vesta–HED connection; and the geologic context for eucrites, diogenites, and howardites. Meteorit. Planet. Sci. 2013, 48, 2090–2104. [Google Scholar] [CrossRef]
- De Sanctis, M.C.; Ammannito, E.; Capria, M.T.; Capaccioni, F.; Combe, J.P.; Frigeri, A.; Longobardo, A.; Magni, G.; Marchi, S.; McCord, T.B.; et al. Vesta’s mineralogical composition as revealed by the visible and infrared spectrometer on Dawn. Meteorit. Planet. Sci. 2013, 48, 2166–2184. [Google Scholar] [CrossRef]
- McCord, T.B.; Adams, J.B.; Johnson, T.V. Asteroid Vesta: Spectral reflectivity and compositional implications. Science 1970, 168, 1445–1447. [Google Scholar] [CrossRef]
- Gaffey, M.J. Surface lithologic heterogeneity of asteroid 4 Vesta. Icarus 1997, 127, 130–157. [Google Scholar] [CrossRef]
- Burns, R.G. Crystal field spectra and evidence of cation ordering in olivine minerals. Am. Mineral. J. Earth Planet. Mater. 1970, 55, 1608–1632. [Google Scholar]
- Klima, R.L.; Pieters, C.M.; Dyar, M.D. Spectroscopy of synthetic Mg-Fe pyroxenes I: Spin-allowed and spin-forbidden crystal field bands in the visible and near-infrared. Meteorit. Planet. Sci. 2007, 42, 235–253. [Google Scholar] [CrossRef]
- Stephan, K.; Jaumann, R.; De Sanctis, M.C.; Ammannito, E.; Krohn, K.; Otto, K.; Tosi, F.; Combe, J.P.; Roatsch, T.; Matz, K.D.; et al. The Sextilia-region on Asteroid 4Vesta–Stratigraphy and variegation. Icarus 2015, 259, 162–180. [Google Scholar] [CrossRef]
- Rousseau, B.; De Sanctis, M.C.; Raponi, A.; Ciarniello, M.; Ammannito, E.; Frigeri, A.; Carrozzo, F.G.; Tosi, F.; Scarica, P.; Fonte, S.; et al. The surface of (4) Vesta in visible light as seen by Dawn/VIR. Astron. Astrophys. 2021, 653, A118. [Google Scholar] [CrossRef]
- De Sanctis, M.C.; Combe, J.-P.; Ammannito, E.; Palomba, E.; Longobardo, A.; McCord, T.B.; Marchi, S.; Capaccioni, F.; Capria, M.T.; Mittlefehldt, D.W.; et al. Detection of widespread hydrated materials on Vesta by the VIR imaging spectrometer on board the Dawn mission. Astrophys. J. Lett. 2012, 758, L36. [Google Scholar] [CrossRef]
- McCord, T.B.; Taylor, L.A.; Combe, J.-P.; Kramer, G.; Pieters, C.M.; Sunshine, J.M.; Clark, R.N. Sources and physical processes responsible for OH/H2O in the lunar soil as revealed by the Moon Mineralogy Mapper (M3). J. Geophys. Res. Planets 2011, 116. [Google Scholar] [CrossRef]
- Zeller, E.J.; Ronca, L.B.; Levy, P.W. Proton-induced hydroxyl formation on the lunar surface. J. Geophys. Res. 1966, 71, 4855–4860. [Google Scholar] [CrossRef]
- Palomba, E.; Longobardo, A.; De Sanctis, M.C.; Zambon, F.; Tosi, F.; Ammannito, E.; Capaccioni, F.; Frigeri, A.; Capria, M.T.; Cloutis, E.A.; et al. Composition and mineralogy of dark material units on Vesta. Icarus 2014, 240, 58–72. [Google Scholar] [CrossRef]
- Hunt, G.R. Spectral signatures of particulate minerals in the visible and near infrared. Geophysics 1977, 42, 501–513. [Google Scholar] [CrossRef]
- Clark, R.N.; Rencz, A.N. Spectroscopy of rocks and minerals, and principles of spectroscopy. Man. Remote Sens. 1999, 3, 3–58. [Google Scholar]
- Coradini, A.; Capaccioni, F.; Drossart, P.; Erard, S.; Filacchione, G.; De Sanctis, M.; Capria, M.; Crovisier, J.; Ammannito, E.; Orosei, R.; et al. VIRTIS: An imaging spectrometer for the Rosetta mission. Planet. Space Sci. 1998, 46, 1291–1304. [Google Scholar] [CrossRef]
- Reininger, F.M.; Coradini, A.; Capaccioni, F.; Capria, M.T.; Cerroni, P.; De Sanctis, M.C.; Magni, G.; Drossart, P.; Barucci, M.A. VIRTIS: Visible infrared thermal imaging spectrometer for the Rosetta mission. In Imaging Spectrometry II; SPIE: Bellingham, WA, USA, 1997; Volume 2819. [Google Scholar]
- Ammannito, E.; Filacchione, G.; Coradini, A.; Capaccioni, F.; Piccioni, G.; De Sanctis, M.C.; Dami, M.; Barbis, A. On-ground characterization of Rosetta/VIRTIS-MI Spectral and geometrical calibrations. Rev. Sci. Instrum. 2006, 77, 093109. [Google Scholar] [CrossRef]
- Drossart, P.; Piccioni, G.; Adriani, A.; Angrilli, F.; Arnold, G.; Baines, K.; Bellucci, G.; Benkhoff, J.; Bézard, B.; Bibring, J.-P.; et al. Scientific goals for the observation of Venus by VIRTIS on ESA/Venus Express mission. Planet. Space Sci. 2007, 55, 1653–1672. [Google Scholar] [CrossRef]
- Carrozzo, F.G.; Raponi, A.; De Sanctis, M.C.; Ammannito, E.; Giardino, M.; D’aversa, E.; Fonte, S.; Tosi, F. Artifacts reduction in VIR/Dawn data. Rev. Sci. Instrum. 2016, 87, 124501. [Google Scholar] [CrossRef] [PubMed]
- Raponi, A.; De Sanctis, M.C.; Carrozzo, F.G.; Ciarniello, M.; Rousseau, B.; Ferrari, M.; Ammannito, E.; De Angelis, S.; Vinogradoff, V.; Castillo-Rogez, J.C.; et al. Organic material on Ceres: Insights from visible and infrared space observations. Life 2020, 11, 9. [Google Scholar] [CrossRef] [PubMed]
- Rousseau, B.; Raponi, A.; Ciarniello, M.; Ammannito, E.; Carrozzo, F.G.; De Sanctis, M.C.; Fonte, S.; Frigeri, A.; Tosi, F. Correction of the VIR-visible data set from the Dawn mission. Rev. Sci. Instrum. 2019, 90, 123110. [Google Scholar] [CrossRef]
- Clark, R.N.; Roush, T.L. Reflectance spectroscopy: Quantitative analysis techniques for remote sensing applications. J. Geophys. Res. Solid Earth 1984, 89, 6329–6340. [Google Scholar] [CrossRef]
- Longobardo, A.; Palomba, E.; Capaccioni, F.; De Sanctis, M.C.; Tosi, F.; Ammannito, E.; Schröder, S.E.; Zambon, F.; Raymond, C.A.; Russell, C.T. Photometric behavior of spectral parameters in Vesta dark and bright regions as inferred by the Dawn VIR spectrometer. Icarus 2014, 240, 20–35. [Google Scholar] [CrossRef]
- Shkuratov, Y.; Kreslavsky, M.; Ovcharenko, A.; Stankevich, D.; Zubko, E.; Pieters, C.; Arnold, G. Opposition effect from Clementine data and mechanisms of backscatter. Icarus 1999, 141, 132–155. [Google Scholar] [CrossRef]


Disclaimer/Publisher’s Note: The statements, opinions and data contained in all publications are solely those of the individual author(s) and contributor(s) and not of MDPI and/or the editor(s). MDPI and/or the editor(s) disclaim responsibility for any injury to people or property resulting from any ideas, methods, instructions or products referred to in the content. |
© 2023 by the authors. Licensee MDPI, Basel, Switzerland. This article is an open access article distributed under the terms and conditions of the Creative Commons Attribution (CC BY) license (https://creativecommons.org/licenses/by/4.0/).