Article

Variations in Pulsating Aurora Emission in 337 nm and 391 nm Nitrogen Spectral Lines during Geomagnetic Substorms

1
Skobeltsyn Institute of Nuclear Physics, Lomonosov Moscow State University, 119991 Moscow, Russia
2
Faculty of Physics, Lomonosov Moscow State University, 119991 Moscow, Russia
3
Polar Geophysical Institute, 15, Khalturina St., 183010 Murmansk, Russia
*
Author to whom correspondence should be addressed.
Universe 2023, 9(10), 441; https://doi.org/10.3390/universe9100441
Submission received: 30 July 2023 / Revised: 22 September 2023 / Accepted: 27 September 2023 / Published: 30 September 2023
(This article belongs to the Special Issue Auroral Physics)

Abstract

:
Spectroscopic measurements of aurora emissions provide valuable insights into the altitude of electron atmospheric penetration and their maximum energy. To achieve this, the photometers used in the PAIPS (Pulsating Aurora Imaging Photometers System) project are equipped with spectrometers. These spectrometers enable the measurement of auroral emissions in narrow spectral lines with a temporal resolution of milliseconds. In this study, we present two cases of PsA (Pulsating Aurora) measurements in the 337 nm and 391 nm spectral lines. We demonstrate that during quiet geomagnetic conditions the ratio of night sky emissions in these bands is close to one and significantly increases during substorms. We propose and implement a special procedure for estimating this ratio. Our findings reveal that the intensity of emissions in both spectral lines correlates with the AL index of geomagnetic activity. However, the ratio between the emissions fluctuates around constant values over time and does not undergo significant changes throughout the entire PsA event, which can last for more than an hour.

1. Introduction

The origin of pulsating auroras (PsAs) remains an unresolved problem in the field of aurora physics [1]. Pulsating auroras are characterized by rapid variations in emissions that occur in a quasiperiodic manner, with periods ranging from 2 to 20 s [2]. The intervals between pulses are not constant and can vary widely even within a single train of pulsations. Additionally, there is a fine temporal structure in the form of the modulation of the main period at a higher frequency of approximately 3 Hz [3]. The fluctuations in radiation brightness are not harmonic but, rather, consist of alternating “on” and “off” phases. It is interesting to note that the “on” phase is concentrated within two ranges (0.2–0.5 s and 2–6 s) depending on the type of pulsating aurora, while the duration of the “off” phase is widely distributed, ranging from fractions of seconds to minutes [4].
The most significant large-scale characteristic of pulsations is their association with auroral substorms. PsAs typically occur following an auroral breakup in the midnight sector of the auroral oval, predominantly during the recovery phase of the auroral substorm [5].
PsAs are observed to occur below the diffuse aurora. The difference in altitudes between these phenomena is attributed to variations in the energies of the precipitating electrons. A study by Brown et al. (1976) [6] demonstrated that the altitude of pulsating aurora emissions corresponds to electron energies in the range of 30–60 keV. In contrast, electrons with energies below 1 keV are responsible for the formation of diffuse auroras. This distinction in electron energy levels contributes to the variation in altitude between pulsating and diffuse auroras.
The role of high-energy charged particles in PsA formation is an important aspect of their study. Mathematical modeling [7] and measurements conducted using incoherent scattering radars [8,9] indicate the presence of a significant population of electrons with energies above 50 keV. These high-energy electrons contribute to additional ionization and luminosity at altitudes ranging from 60 to 80 km, whereas visible auroras predominantly occur above 80 km.
Relativistic electrons can be generated through wave–particle interaction processes in the magnetosphere. For instance, a study by Miyoshi et al. (2020) [7] demonstrated that chorus waves can produce electron fluxes spanning a wide energy range, including relativistic energies, with a temporal structure resembling that of PsAs. Coordinated observations involving ground-based fast cameras from the PWING project [10,11] and the ARASE satellite have indicated a potential association between intensity modulations of PsAs and successive discrete chorus elements, as well as chorus subpacket structures [12].
Direct measurements of precipitating relativistic electron microbursts (REMs) have been conducted using an HILT detector on the Solar Anomalous Magnetospheric Particle Explorer (SAMPEX) mission [13,14]. A correlation between REMs and patchy auroras, as measured using THEMIS all-sky cameras, has been identified [15]. However, it should be noted that the temporal resolution of the all-sky cameras used in this study was limited to 3 s. As a result, a direct comparison between variations in electron flux and aurora pulsations was not possible.
A potential connection between high-energy electron flux (>100 keV) and pulsating auroras was indicated in a recent study by Klimov et al. (2022) [16]. The TUS detector, located on the Lomonosov satellite, measured the pulsations of near-UV emissions in the auroral region during periods of high-intensity, long-duration, continuous AE activity. Simultaneously, charged particle detectors such as DEPRON on the same spacecraft [17] and the MSGI-M and SKL-M detectors on the METEOR-M2 satellite [18] were used to measure the charged particle fluxes. These observations provide a hint of the potential relationship between high-energy electron fluxes and pulsating auroras.
Estimations of precipitating electron energy can be indirectly made through measurements of altitude-dependent luminosity characteristics, such as the emission spectrum. However, spectroscopic measurements of auroras, particularly for PsAs, are relatively rare. These observations require high temporal resolution and sensitivity, making the use of ordinary cameras inefficient. Photometers based on photomultiplier tubes (PMTs) are commonly used for such measurements, as they allow for single photon counting and offer temporal resolutions of less than 1 ms. One case of spectrometric measurements of PsAs is presented and discussed in a study by Tobiska et al. (1993) [19]. PsAs were observed from a rocket using the EF-11 instrument [20], which had four spectral channels: 130.4 nm, 337.1 nm, 391.4 nm, and 557.5 nm. The auroral emission observed in this study was attributed to an electron flux with characteristic energies of 2–3 keV. It was demonstrated that the ratio of 391.4 nm to 337.1 nm emissions remained constant at all altitudes, particularly above 150 km, with a value of 6.25.
Indeed, while there are indirect indications of a relationship between the precipitation of high-energy electrons, including those with relativistic energies, and pulsating auroras, there is currently a lack of direct measurements that simultaneously capture the energy of precipitating electrons in the atmosphere and the corresponding glow at low altitudes (below 80 km). Direct measurements of both of these factors would provide valuable insights into the mechanisms driving pulsating auroras and their connection to high-energy electron precipitation.

2. Instruments and Data Selection

In order to clarify these issues on the Kola Peninsula, SINP MSU and PGI are creating a system of highly sensitive imaging photometers (PAIPS, Pulsating Aurora Imaging Photometers System) for use in measurements in the near-UV range (300–400 nm) and for use in reconstructing the spatial distribution of aurora emissions using a triangulation method. One photometer was already installed at the Verkhnetulomsky observatory (VTL, 68.63 N, 31.78 E) in September 2021. Observations were made close to zenith with a time resolution of 1 ms (41 ms before September 2022) in continuous monitoring mode. The second photometer is planned to be installed in autumn 2023 at the Lovozero observatory (LOZ, 67.98 N, 35.01 E), 150 km from the VTL. The photometer in Lovozero will be directed towards the horizon and will measure the altitude distribution of the emission intensity over VTL in a range from 30 to 120 km.
High sensitivity and spatial resolution are ensured by the use of a matrix of multianode photomultiplier tubes (MAPMTs) operating in the photon counting mode and the area of the optical system (20 cm 2 for VTL and almost 500 cm 2 for LOZ). A more detailed description of the equipment can be found in [21,22].
A pair of photometers placed hundred of kilometers from each other will allow for direct measurements of the lower border of aurora emissions and estimate the maximum energy of precipitating electrons. In a monoscopic mode, this task may be solved using spectroscopic methods. For this purpose, in addition to the main imaging part of the photometer, a multichannel spectrometer based on a PMT with interference filters located on the PMT entrance windows was installed in VTL. It was performed at the end of February, 2023. Thus, we got the opportunity to carry out spectrometric measurements for two months in the spring of 2023.
The spectrometer uses Hamamatsu R1463 PMTs with 13 mm diameter of entrance window and multialkali photocathode. The maximum sensitivity is in the near-UV range; the quantum efficiency is about 20%. The readout electronics consist of a 16 channel multiplexer (AD8184), preamplifier (AD8032), and fast ADC (AD9203). These PMTs and readout scheme were already successfully used for a number of ground-based and satellite projects of SINP MSU, such as the DUV detector on board the Tatiana and Vernov satellites or the TUS detector on board Lomonosov. A detailed description can be found, for example, in [23]. The spectrometer has a gain control system which allows one to conduct measurements in a wide range of intensities (from dark moonless night to daylight).
Thus, the VTL spectrometer can measure in 16 wavelength bands which are determined by filters in front of PMTs. For the first season, only five channels with the following filters were used: (1) UFS1 (300–400 nm); (2) KS11 (600–800 nm); (3) 337 nm CWL, 10 nm FWHM; (4) 390 nm CWL, 10 nm FWHM; and (5) 430 nm CWL, 10 nm FWHM. The data from only two channels are discussed here: 337 nm and 391 nm.
Of greatest interest are the measurements of the lines of the second positive nitrogen system (N 2 2P), 337.1 nm, and the first negative system (N 2 + 1N), 391.4 nm. For the first system, the lifetime of the excited state is about 50 ns, which ensures that the effective quenching altitude via collisions with the neutral component of the atmosphere is only about 30 km. For the second one, the lifetime is 70 ns; the effective quenching altitude is about 48 km [24]. Thus, the ratio of the intensities of these lines can be used to estimate the height of the emission (the larger the proportion of N 2 2P, the lower the source of the emission in the atmosphere), and, hence, the energy of the electrons causing this aurora (for a more detailed discussion, see below).
Since the spectrometer was operating from the end of February 2023, we have considered March and April data only to find periods of quiet and disturbed geomagmetic conditions for the further analyses and comparison with spectrometer data. Figure 1 demonstrates the behavior of AU and AL geomagnetic indices. Periods when the spectrometer was operating are highlighted in red. When analyzing the measured light curves, it was found that all channels of the spectrometer saturate during substorms, with a maximum value of the AL index exceeding 500 nT (for example, the substorm of 24 March 2023). Therefore, these substorms cannot be used to study the intensities of emissions in spectral lines and their ratio.
For the entire period, observation conditions were analyzed using the Polar Geophysical Institute (PGI) all-sky cameras data. In April, the solar zenith angle was quite large and the total background light was also significant. This led to data distortion and, in particular, to a change in the R 391 / 337 ratio of intensities, measured with two spectral channels of the detector: 391 nm and 337 nm. Thus, these days were excluded from further study.
Other factors, including meteorological conditions, that have a significant impact on measurements are the position of the Moon, cloud cover, and the condition of the viewing window (presence of drops, snow, and ice). Examples of typical all-sky camera images for various conditions are presented in Figure 2.
Unfortunately, in most cases, the observational conditions (cloud coverage, precipitation, the position of the Sun and the Moon, and the level of geomagnetic activity) did not allow for the observation of the aurora. Therefore, in the following discussion, we will only focus on two nights of observations: 11/12 March 2023 and 17/18 March 2023.

3. Measurements Results

For two selected dates of measurements, the intensity of both channels, their ratio, and corresponding geomagnetic conditions were analyzed.

3.1. 11/12 March 2023

In Figure 3, the results for 11/12 March 2023 are summarized. Measurements were started on a clear sky with very quiet geomagnetic conditions. The AU and AL indices are close to zero. The Ratio R 391 / 337 is close to one. To calculate the ratio, the following formula is used:
R 391 / 337 = N 391 N 337 · p 337 η 337 τ 337 p 391 η 391 τ 391 · ε ,
where N 391 and N 337 are ADC codes of two channels with quantum efficiency of the photocathode p 337 = 0.19 , p 391 = 0.18 , filter transparency η 337 = 0.34 , η 391 = 0.49 and entrance window (blister) transparency τ 337 = 0.83 , and τ 391 = 0.9 . The PMT photocathode quantum efficiency is taken from the Hamamatsu datasheet [25]. Window and filter transparency were measured in laboratory before the installation of the detector. The relative sensitivity of two channels, ε = 1.9 , which takes into account the ratio of the gains of the dynode system of two PMTs, was obtained during calibrations of the detector. Relative calibrations of the spectrometer were made before its installation in VTL. All channels of the spectrometer were uniformly illuminated at a wavelength 405 nm. Input flux and its uniformity was controlled using an NIST photodiode and Ophir LaserStar Dual Channel power meter1.
A minor substorm with an AL index of 200 nT initiates at 19:00 UTC, resulting in an observable rise in the intensity of the auroral glow in both channels, as well as an increase in the R391/337 ratio. The second substorm, characterized by the maximum decrease in the AL index ( 400 nT), takes place at 23:00 UTC. This substorm is accompanied by a tenfold increase in the emission intensity, the emergence of sharp peaks in the lightcurve, and subsequent pulsations lasting over three hours. During this period, the R 391 / 337 ratio exhibits significant fluctuations, reaching values as high as three.
It should be noted that during certain periods of measurements, cloudiness was observed within the field of view of the spectrometer. During these moments, the measured intensity of the aurora decreases. However, as demonstrated below, the measurement of the baseline level can be considered when correcting the calculation of the ratio.

3.2. 17/18 March 2023

The results of measurements for the night of 17/18 March 2023 resemble, in general, the previous case. R 391 / 337 was obtained using the same procedure and parameters as described in a previous section. In Figure 4, it is well seen that for the quiet geomagnetic conditions after the sunset, R 391 / 337 is close to one. From the beginning of a weak substorm with a maximum AL ∼ 100 nT at ∼21:20 UTC, the intensity and R 391 / 337 start to rise. R 391 / 337 reaches a value of 1.5 by 22 UTC. At 22:15 UTC, a series of substorms started and they were accompanied by a bright emission at the very beginning and followed by continuous pulsations. The intensity of PsAs reached a maximum just after a midnight, as well as R 391 / 337 .

4. Discussion

In a number of previous studies and reviews, it was shown that PsAs mainly occur during the substorm recovery phase [26,27]. In this study, also both cases of PsAs were observed in a substorm recovery phase. Small substorms with an absolute value of the AL index less than 200 nT are not accompanied by PsAs.
In the previous section, it was shown that during pulsations, the R 391 / 337 ratio exceeds the value measured during a quiet geomagnetic period and clear sky by 2–3 times, reaching maximum values around three. On the one hand, this makes it possible to determine the presence of pulsating auroras, and on the other hand, it contradicts the existing model data on this ratio.
Thus, in the theoretical modeling [28,29] it was shown that in the upper part of the atmosphere (more than 100 km) the ratio of the intensities of the 2PG (337.1 nm) and 1NG (391.4 nm) lines is practically independent of altitudes and is about five. It is twice as large as what we observed with our spectrometer in VTL. However, these calculations were carried out for rather low electron energies from 0.1 to 16 keV.
For higher energies, a simulation of MeV electron beam transitions through the atmosphere was made [30]. Optical emission altitude profiles were obtained for different band systems of nitrogen and oxygen. The left panel of Figure 5 demonstrates the results of this modeling for the N 2 2P and N 2 + 1N band systems of nitrogen using solid lines.
From these results, the dependence of emission intensity in the 337 nm and 391 nm lines, which belong to different systems, on altitude can be derived. To accomplish this, we utilized the relative band intensities provided in Tables 4.9 and 4.11 of A.V. Jones (1974) [24]. In order to obtain the number of photons in the entrance pupil, we took into account atmospheric scattering, which is significant in the near-UV range and varies with wavelength and altitude. Additionally, we integrated the emission intensity over the thickness of the atmosphere corresponding to the radiation height, as the spectrometer is directed towards the zenith. These values are represented in the left panel of Figure 5 using rhombus markers. Finally the R 391 / 337 ratio for emissions at the entrance pupil was obtained, and one can see from the right panel of Figure 5 that it changes with altitude and lies in the range from 1.65 (for a height of about 55 km) to ∼2 (for 100 km).
In [27], it is discussed that the altitude of peak emission during PsAs decreases in time. It was shown that events starting within the first 2 h of storm recovery phases have a wider distribution of altitude and no tendency to decrease, while the emission altitude of events starting later in the storm recovery phases decreases from 110 to 100 km. This behavior may be explained by the increase in precipitation electron energies. In this context, it makes sense to expect an increase in the fraction of emission in the 337 nm line, since it has a lower quenching altitude and corresponds to higher energies of precipitating particles. Thus, the ratio should decrease with time towards the end of the substorm.
From a first glance, in Figure 2 and Figure 3, R 391 / 337 decreases at the end of the measurements and it follows intensity light curve. However, this ratio also includes the total background change, which influences the values of intensities. For example, during a full Moon or scattered sunlight, R 391 / 337 increases. The appearance of clouds also causes smooth, slight changes in the ratio. Moreover, PsAs can occur in the background of constant precipitation of low-energy electrons, which cause a quasi-permanent auroral glow and follow the AL index variations (correlation coefficient is more then 0.85).
To obtain the ratio of the two lines that is caused by the electrons responsible for pulsations, it is necessary to subtract the baseline curve. In order to achieve this, the following procedure was developed and implemented:
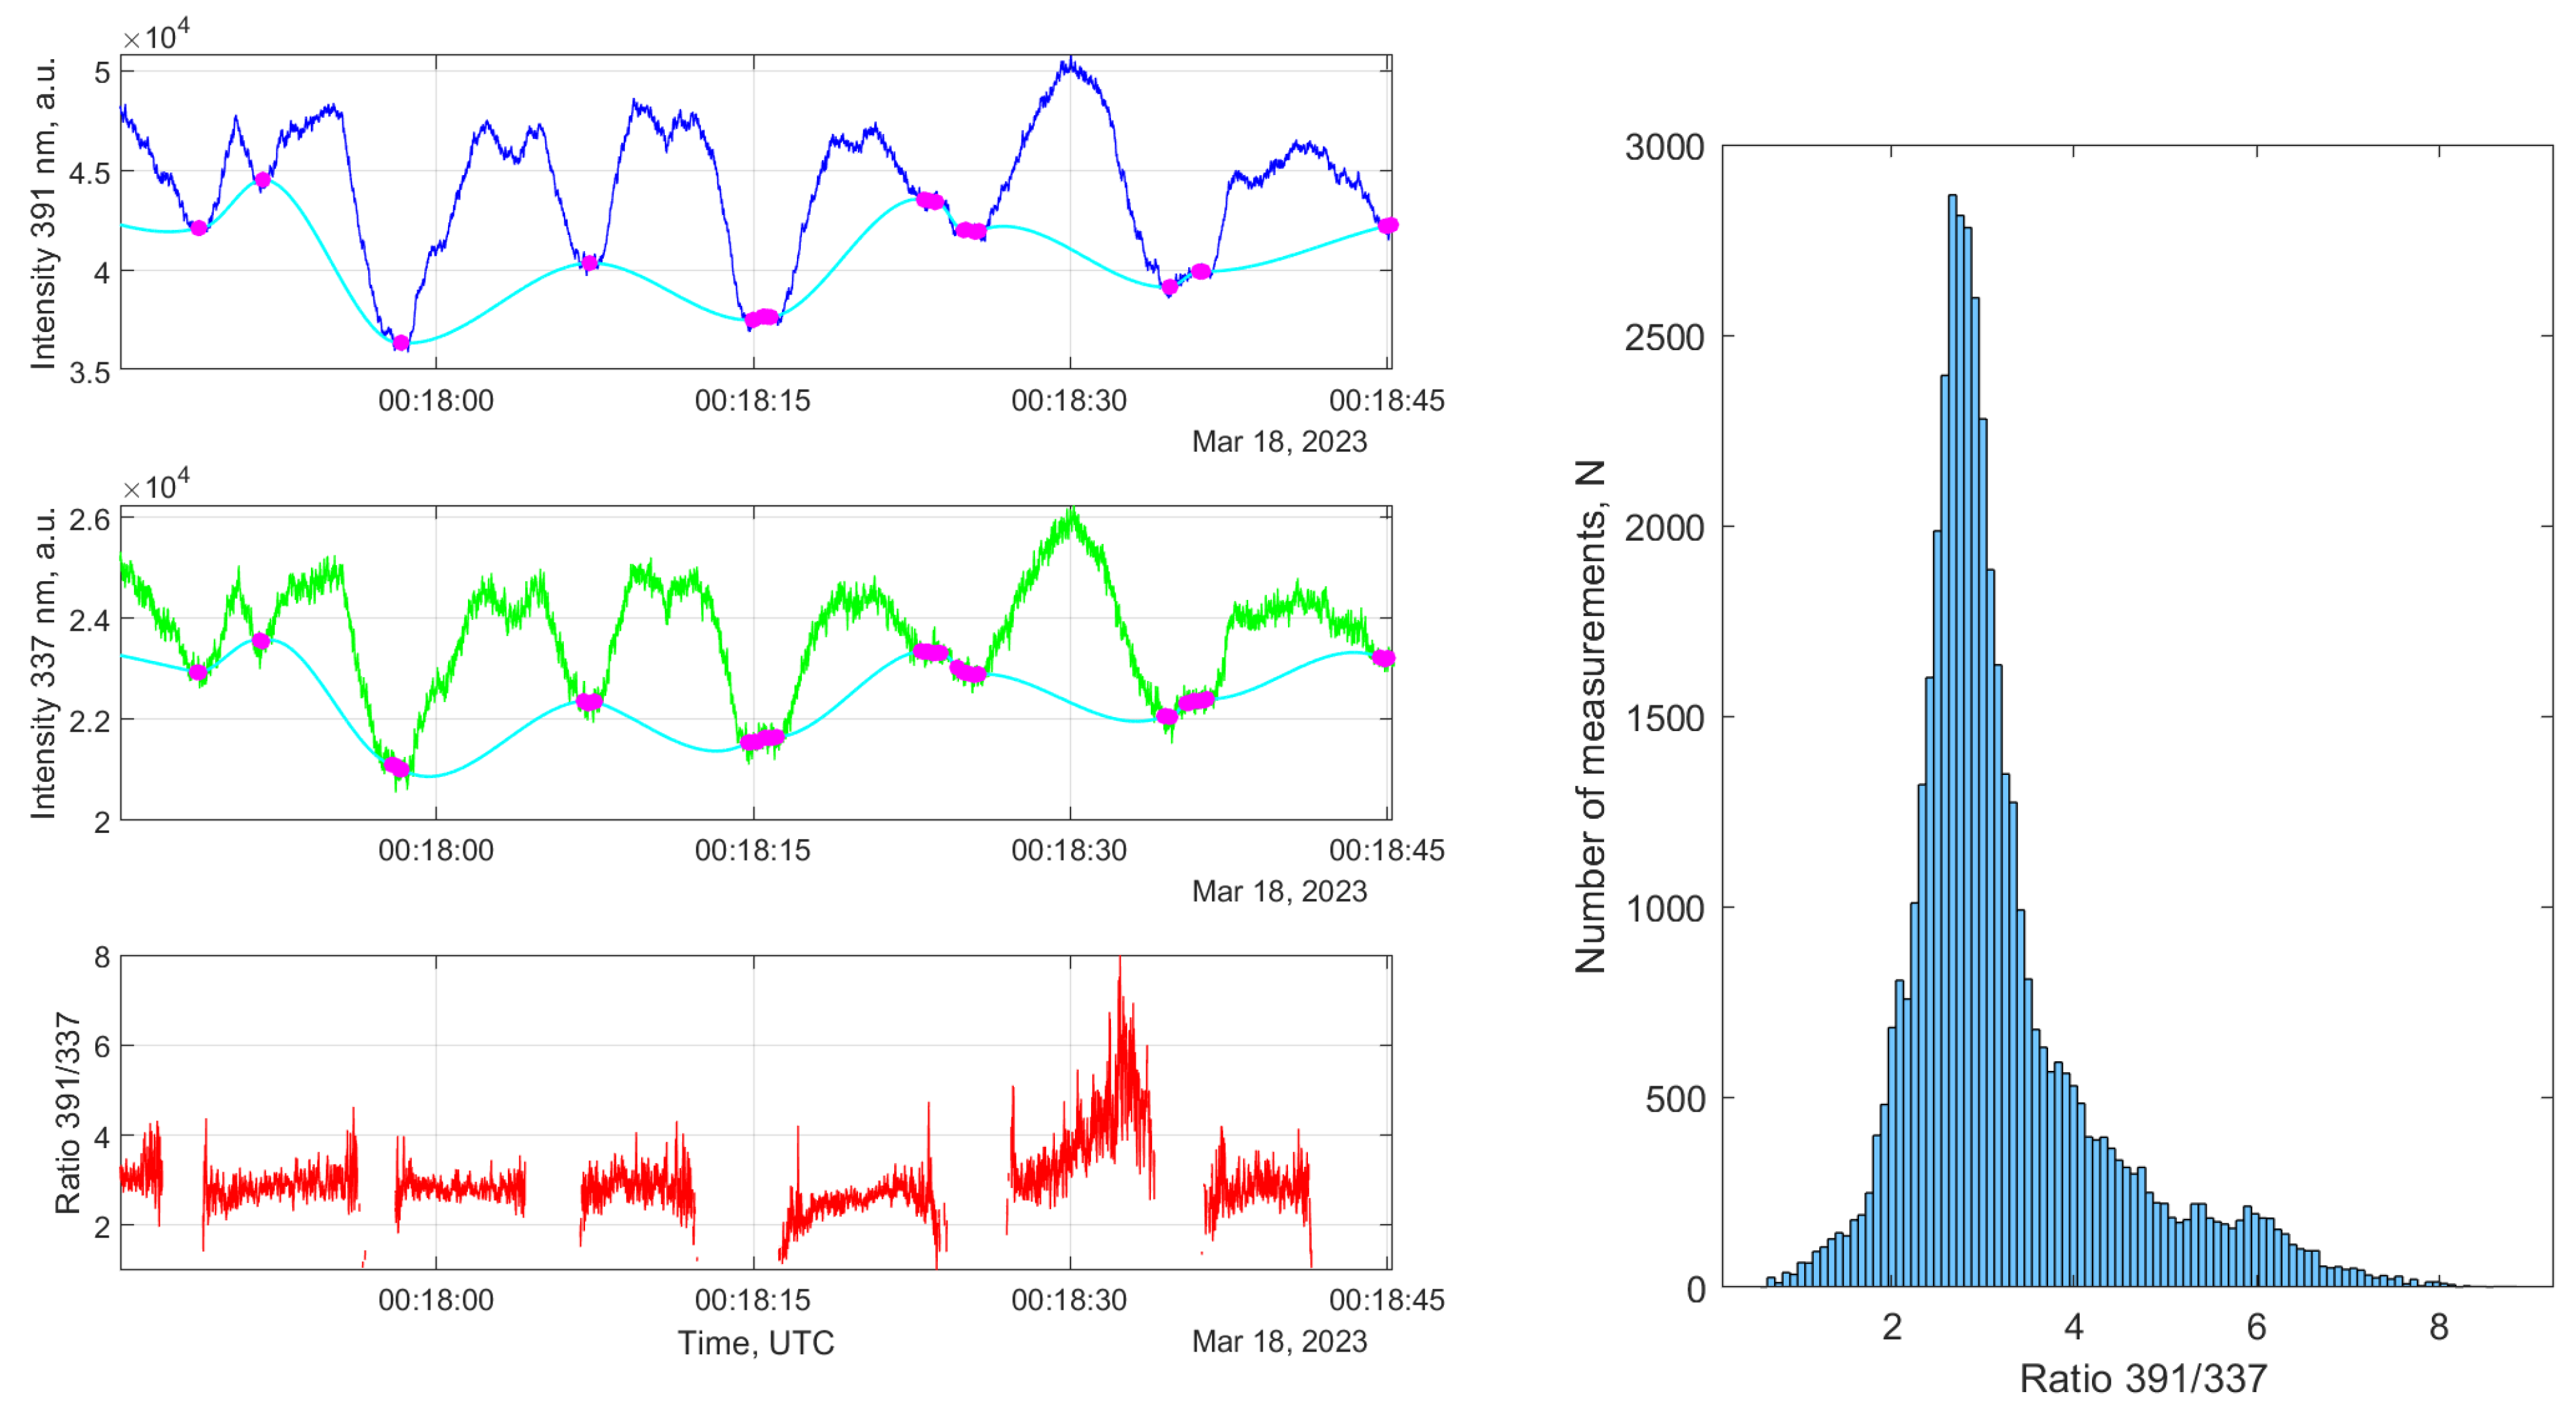
  • All measurements for both channels during PsAs were divided into “on” and “off” phases. “Off” phases constitute the set of measurements with lower intensities and are considered as a background for the “on” phases. The separation was conducted via a subtraction from a light curve a moving average and a time window equal to 30 s.
  • Intensities during “off” phases were interpolated for the periods with pulses to obtain the values of background emissions during “on” phases. In Figure 6, the example of the measured PsA signal and background interpolation is shown for a short but typical case.
  • The background intensity values obtained in a previous step were subtracted from measured intensities.
  • New values of ratio ( R 391 / 337 * ) were calculated as a ratio of two signals during “on” phases with a subtracted background. The example of the obtained R 391 / 337 * is shown in the bottom panel of Figure 6. It is well seen that average ratio is around three. There are some peaks at the edges of “on” phases—it is an artifact of the described procedure, and these points are eliminated from further analyses. It is interesting to note, rather, large variations in the ratio, which reaches values of about eight.
Since variations in the obtained ratio are rather large, we have calculated median values during each 2 min of measurements to study its global dynamics during PsA events. The example of a ratio distribution for 2 min is shown in the right panel of Figure 6.
In Figure 7 and Figure 8, the final information on the 391 and 337 nm emissions during the recovery phase of the substorms for the 11/12 March 2023 and 17/18 March 2023 events is presented. The upper panels show the dependence on time of the measured intensities. The bottom panels contain the initial values of R 391 / 337 (black line), which does not take into account changes in background and new ones (red lines with dots) obtained using the procedure described above.
It is well seen that corrected values R 391 / 337 * are always larger that initial ones. There is no significant and monotonous change in the R 391 / 337 * ratio during the substorm. It has large variations, which are smaller in the middle of time intervals. The amplitude of the corrected ratio variations remains the same (∼25%), so the proposed procedure does not add artificial data scatter.
The intensity of the emission decreases at the end of intervals and follows the AL index behavior. The correlation coefficients between the intensity and the AL index for 11/12 March 2023 are 0.87 and 0.88 for 391 nm and 337 nm, respectively. For 17/18 March 2023, both correlation coefficients are equal to 0.85. It means that the flux of charged particles decreases at the end, while the energy spectrum does not change in such a way that it is measurable by our instrument. This can be understood if we look at Figure 5 one more time. The difference in the emission ratio reaches 10% if the altitude varies from 100 km to 65 km. This altitude corresponds to very high-energy electrons whose flux is orders of magnitude smaller than that of low-energy electrons that cause the main glow at altitudes above 100 km.
It is interesting to note that our experimental values of R 391 / 337 * lie between the results of two theoretical models for different energy ranges: 0.1–16 keV [28,29] and 1 MeV [30]. This is in line with the results of experimental studies, where additional ionization was observed at low altitudes due to precipitating electrons with an energy of more than 50 keV [8,9]. Also, other additional factors that affect the ratio of lines are possible and must be taken into account.

5. Conclusions

In February 2023, a new spectrometer was installed at the Verkhnetulomsky observatory as part of the PAIPS system. This spectrometer measures emissions in two nitrogen spectral lines: 391 nm and 337 nm. In this study, the ratio of emission intensity between these two lines was analyzed. It was found that the emission intensity in both wavelengths is correlated with the geomagnetic AL index, which reflects the total flux of charged particles into the atmosphere. For quiet geomagnetic conditions, the intensities in both channels are similar, and their ratio is close to one.
A special procedure was suggested and implemented to analyze the R 391 / 337 * ratio during PsAs since the subtraction of emission background is needed. It is shown that the R 391 / 337 * varies around 2.5 for the event on 11/12 March 2023 and around 3 for the event on 17/18 March 2023. These values indicate that the role of high-energy electrons may be underestimated in the current theoretical modeling [28,30].
There is no obvious dependence of the R 391 / 337 * ratio on time, which can be expected with a significant change in the spectrum of precipitating electrons. Apparently, the fraction of high-energy electrons in pulsating auroras is small, and its contribution to the emission is not visible when observing patches at the zenith direction.
A more detailed analysis of the fine temporal structure of PsAs and on a larger number of events will be performed in the future. Moreover, after the installation of the second telescope, which observes the aurorae at an angle to the horizon in the direction of VTL from the Lovozero observatory, it will be possible to directly observe the vertical structure of the glow in the near-UV range and thereby estimate the maximum energy of the precipitating electrons.

Author Contributions

Conceptualization, P.K. and V.N.; methodology, V.N., B.K. and A.M.; software, A.B. and A.R.; formal analysis, P.K., V.N. and B.K.; investigation, P.K. and V.N.; writing—original draft preparation, P.K. and V.N.; writing—review and editing, B.K. and S.S.; visualization, V.N.; supervision, P.K. All authors have read and agreed to the published version of the manuscript.

Funding

This research was funded by Russian Scence Foundation grant number 22-62-00010 (https://rscf.ru/project/22-62-00010/, accessed on 28 July 2023).

Data Availability Statement

The data that support the findings of this study are available from the corresponding author, (P.K.), upon reasonable request. Quick-looks are available on the website of the PAIPS project https://uhecr.sinp.msu.ru/ru/paips.html (accessed on 28 July 2023).

Acknowledgments

The authors acknowledge the TUS and JEM-EUSO collaborations for the ability to use technologies developed in these collaborations for this study. The Geomagnetic Auroral Electrojet indices were provided by the World Data Center for Geomagnetism (WDC), Kyoto (http://wdc.kugi.kyoto-u.ac.jp/wdc/cresample.html, accessed on 28 July 2023).

Conflicts of Interest

The authors declare no conflict of interest.

Abbreviations

The following abbreviations are used in this manuscript:
DUVDetector of ultraviolet;
LOZLovozero;
MAPMTMultianode photomultiplier tube;
PAIPSPulsating Aurora Imaging Photometers System;
REMsRelativistic electron microbursts;
PsAPulsating aurora;
PMTPhotomultiplier tube;
PGIPolar Geophysical Institute;
SAMPEXSolar Anomalous Magnetospheric Particle Explorer;
SINP MSUSkobeltsyn Institute of Nuclear Physics, Lomonosov Moscow State University;
TUSTracking Ultraviolet Set-up;
UVUltraviolet;
VTLVerkhnetulomsky.

Note

1

References

  1. Nishimura, Y.; Lessard, M.R.; Katoh, Y.; Miyoshi, Y.; Grono, E.; Partamies, N.; Sivadas, N.; Hosokawa, K.; Fukizawa, M.; Samara, M.; et al. Diffuse and Pulsating Aurora. Space Sci. Rev. 2020, 216, 4. [Google Scholar] [CrossRef]
  2. Johnstone, A. Pulsating aurora. Nature 1978, 274, 119–126. [Google Scholar] [CrossRef]
  3. Hosokawa, K.; Miyoshi, Y.; Ozaki, M.; Oyama, S.I.; Ogawa, Y.; Kurita, S.; Kasahara, Y.; Kasaba, Y.; Yagitani, S.; Matsuda, S.; et al. Multiple time-scale beats in aurora: Precise orchestration via magnetospheric chorus waves. Sci. Rep. 2020, 10, 3380. [Google Scholar] [CrossRef]
  4. Yamamoto, T. On the temporal fluctuations of pulsating auroral luminosity. J. Geophys. Res. Space Phys. 1988, 93, 897–911. [Google Scholar] [CrossRef]
  5. Royrvik, O.; Davis, T. Pulsating aurora: Local and global morphology. J. Geophys. Res. 1977, 82, 4720–4740. [Google Scholar] [CrossRef]
  6. Brown, N.; Davis, T.; Hallinan, T.; Stenbaek-Nielsen, H. Altitude of pulsating aurora determined by a new instrumental technique. Geophys. Res. Lett. 1976, 3, 403–404. [Google Scholar] [CrossRef]
  7. Miyoshi, Y.; Saito, S.; Kurita, S.; Asamura, K.; Hosokawa, K.; Sakanoi, T.; Mitani, T.; Ogawa, Y.; Oyama, S.; Tsuchiya, F.; et al. Relativistic Electron Microbursts as High-Energy Tail of Pulsating Aurora Electrons. Geophys. Res. Lett. 2020, 47, e90360. [Google Scholar] [CrossRef]
  8. Miyoshi, Y.; Oyama, S.; Saito, S.; Kurita, S.; Fujiwara, H.; Kataoka, R.; Ebihara, Y.; Kletzing, C.; Reeves, G.; Santolik, O.; et al. Energetic electron precipitation associated with pulsating aurora: EISCAT and Van Allen Probe observations. J. Geophys. Res. (Space Phys.) 2015, 120, 2754–2766. [Google Scholar] [CrossRef]
  9. Tesema, F.; Partamies, N.; Nesse Tyssøy, H.; McKay, D. Observations of precipitation energies during different types of pulsating aurora. Ann. Geophys. 2020, 38, 1191–1202. [Google Scholar] [CrossRef]
  10. Kataoka, R.; Miyoshi, Y.; Sakanoi, T.; Yaegashi, A.; Ebihara, Y.; Shiokawa, K. Ground-based multispectral high-speed imaging of flickering aurora. Geophys. Res. Lett. 2011, 38, L14106. [Google Scholar] [CrossRef]
  11. Shiokawa, K.; Katoh, Y.; Hamaguchi, Y.; Yamamoto, Y.; Adachi, T.; Ozaki, M.; Oyama, S.I.; Nosé, M.; Nagatsuma, T.; Tanaka, Y.; et al. Ground-based instruments of the PWING project to investigate dynamics of the inner magnetosphere at subauroral latitudes as a part of the ERG-ground coordinated observation network. Earth Planets Space 2017, 69, 160. [Google Scholar] [CrossRef]
  12. Ozaki, M.; Shiokawa, K.; Miyoshi, Y.; Hosokawa, K.; Oyama, S.i.; Yagitani, S.; Kasahara, Y.; Kasaba, Y.; Matsuda, S.; Kataoka, R.; et al. Microscopic observations of pulsating aurora associated with chorus element structures: Coordinated Arase satellite-PWING observations. Geophys. Res. Lett. 2018, 45, 12,125–12,134. [Google Scholar] [CrossRef]
  13. Klecker, B.; Hovestadt, D.; Scholer, M.; Arbinger, H.; Ertl, M.; Kastele, H.; Kunneth, E.; Laeverenz, P.; Seidenschwang, E.; Blake, J.B.; et al. HILT: A heavy ion large area proportional counter telescope for solar and anomalous cosmic rays. IEEE Trans. Geosci. Remote Sens. 1993, 31, 542–548. [Google Scholar] [CrossRef]
  14. Blake, J.; Looper, M.; Baker, D.; Nakamura, R.; Klecker, B.; Hovestadt, D. New high temporal and spatial resolution measurements by SAMPEX of the precipitation of relativistic electrons. Adv. Space Res. 1996, 18, 171–186. [Google Scholar] [CrossRef]
  15. Shumko, M.; Gallardo-Lacourt, B.; Halford, A.J.; Liang, J.; Blum, L.W.; Donovan, E.; Murphy, K.R.; Spanswick, E. A strong correlation between relativistic electron microbursts and patchy aurora. Geophys. Res. Lett. 2021, 48, e2021GL094696. [Google Scholar] [CrossRef]
  16. Klimov, P.; Kalegaev, V.; Sigaeva, K.; Ivanova, A.; Antonyuk, G.; Benghin, V.; Zolotarev, I. Near-UV Pulsations in the Aurora Region Measured by Orbital Telescope TUS during High-Intensity and Long-Duration Continuous AE Activity. Remote Sens. 2022, 15, 147. [Google Scholar] [CrossRef]
  17. Benghin, V.V.; Nechaev, O.Y.; Zolotarev, I.A.; Amelyushkin, A.M.; Petrov, V.L.; Panasyuk, M.I.; Yashin, I.V. An experiment in radiation measurement using the depron instrument. Space Sci. Rev. 2018, 214, 9. [Google Scholar] [CrossRef]
  18. Kugusheva, A.; Kalegaev, V.; Vlasova, N.; Petrov, K.; Bazilevskaya, G.; Makhmutov, V. Space–Time Structure of Energetic Electron Precipitations according to the Data of Balloon Observations and Polar Satellite Measurements on February 1–6, 2015. Cosm. Res. 2021, 59, 446–455. [Google Scholar] [CrossRef]
  19. Tobiska, W.; Gladstone, G.; Chakrabarti, S.; Shepherd, M.; McConnell, J.; Link, R.; Schmidtke, G.; Stasek, G. FUV-visible photometric imaging of aurorae. J. Geophys. Res. Space Phys. 1993, 98, 17525–17535. [Google Scholar] [CrossRef]
  20. Schmidtke, G.; Stasek, G.; Wita, C.; Seidl, P.; Baker, K. Rocket-borne EUV-visible emission measurements. J. Atmos. Terr. Phys. 1985, 47, 147–158. [Google Scholar] [CrossRef]
  21. Belov, A.; Klimov, P.; Kozelov, B.; Barrillon, P.; Blin-Bondil, S.; Marszał, W.; Murashov, A.; Parizot, E.; Prévôt, G.; Roldugin, A.; et al. Optical complex for the study of pulsating aurora with sub-millisecond time resolution on the basis of the Verkhnetulomsky observatory. J. Atmos. Sol.-Terr. Phys. 2022, 235, 105905. [Google Scholar] [CrossRef]
  22. Klimov, P.; Sharakin, S.; Belov, A.; Kozelov, B.; Murashov, A.; Saraev, R.; Trofimov, D.; Roldugin, A.; Lubchich, V. System of Imaging Photometers for Upper Atmospheric Phenomena Study in the Arctic Region. Atmosphere 2022, 13, 1572. [Google Scholar] [CrossRef]
  23. Klimov, P.A.; Panasyuk, M.I.; Khrenov, B.A.; Garipov, G.K.; Kalmykov, N.N.; Petrov, V.L.; Sharakin, S.A.; Shirokov, A.V.; Yashin, I.V.; Zotov, M.Y.; et al. The TUS Detector of Extreme Energy Cosmic Rays on Board the Lomonosov Satellite. Space Sci. Rev. 2017, 212, 1687–1703. [Google Scholar] [CrossRef]
  24. Vallance Jones, A. Aurora; D. Reidel Publishing Company: Dordrecht, The Netherlands, 1974. [Google Scholar]
  25. Hamamatsu Photonics Photomultiplier Tube R1463. Available online: https://www.swpc.noaa.gov/products/usaf-45-day-ap-and-f107cm-flux-forecast (accessed on 30 July 2023).
  26. Lessard, M. A review of pulsating aurora. Auror. Phenomenol. Magnetos. Process. Earth Other Planets 2012, 197, 55–68. [Google Scholar]
  27. Partamies, N.; Whiter, D.; Kadokura, A.; Kauristie, K.; Nesse Tyssøy, H.; Massetti, S.; Stauning, P.; Raita, T. Occurrence and average behavior of pulsating aurora. J. Geophys. Res. Space Phys. 2017, 122, 5606–5618. [Google Scholar] [CrossRef]
  28. Kozelov, B.; Ivanov, V.; Sergienko, T. Auroral intensity variations in the area of combined electron and proton particles precipitation: Possibilities of determination of particle flux. Geonagm. Aeronom. 2002, 42, 513–518. [Google Scholar]
  29. Ivanov, V.; Kozelov, B. Passage of Electron and Proton-Hydrogen Beams in the Earth’s Atmosphere; Publishing House of the Kola Scientific Center of the Russian Academy of Sciences: Apatity, Russia, 2001. (In Russian) [Google Scholar]
  30. Marshall, R.A.; Xu, W.; Kero, A.; Kabirzadeh, R.; Sanchez, E. Atmospheric effects of a relativistic electron beam injected from above: Chemistry, electrodynamics, and radio scattering. Front. Astron. Space Sci. 2019, 6, 6. [Google Scholar] [CrossRef]
Figure 1. Auroral Electrojet indices AL and AU. Time intervals when the spectrometer made measurements are highlighted in red.
Universe 09 00441 g001
Figure 2. Typical images of colored all-sky camera in VTL. Top left: Clear sky with a Moon in field of view. Top right: Dense opaque clouds. Bottom left: Sunlight scattered in clouds. Bottom right: Weak aurora in clear sky conditions.
Universe 09 00441 g002
Figure 3. 11 March 2023 event overview. Upper panel: 337 nm (blue line) and 391 nm (green line) channels’ lightcurves. Middle panel: time dependence of R 391 / 337 . Bottom panel: AU and AL geomagnetic activity indices.
Universe 09 00441 g003
Figure 4. 17 March 2023 event overview. Upper panel: 337 and 391 nm channels’ lightcurves. Middle panel: time dependence of R 391 / 337 . Bottom panel: AU and AL geomagnetic activity indices.
Universe 09 00441 g004
Figure 5. Left panel: Optical emission profiles for N 2 + 1 N and N 2 2 P band systems from [30] (solid lines) and calculated intensities of 391 nm and 337 nm lines at the entrance pupil (rhombus markers). Right panel: R 391 / 337 obtained from optical emission altitude profile simulations.
Universe 09 00441 g005
Figure 6. Upper panel: intensity in 391 nm channel and interpolation of background using minimal values (light blue line). Central panel: intensity in 337 nm channel with a background interpolation. Bottom panel: R 391 / 337 * calculated as a ratio of two signals during “on” phase with subtracted background. On the right side, the distribution of R 391 / 337 * , including the time interval from the left panel.
Universe 09 00441 g006
Figure 7. Upper panel: intensities of 391 nm (blue line) and 337 nm (green line) channel during the event 11/12 March 2023. Bottom panel: R 391 / 337 calculated as a simple ratio of intensities (black line) and R 391 / 337 * obtained using the procedure described above (red line).
Universe 09 00441 g007
Figure 8. Upper panel: intensities of 391 nm (blue line) and 337 nm (green line) channel during the event 17/18 March 2023. Bottom panel: R 391 / 337 calculated as a simple ratio of intensities (black line) and R 391 / 337 * obtained using the procedure described above (red line).
Universe 09 00441 g008
Disclaimer/Publisher’s Note: The statements, opinions and data contained in all publications are solely those of the individual author(s) and contributor(s) and not of MDPI and/or the editor(s). MDPI and/or the editor(s) disclaim responsibility for any injury to people or property resulting from any ideas, methods, instructions or products referred to in the content.

