Article

Astroparticle Constraints from Cosmic Reionization and Primordial Galaxy Formation

1
Scuola Internazionale Superiore Studi Avanzati (SISSA), Physics Area, Via Bonomea 265, 34136 Trieste, Italy
2
IFPU—Institute for Fundamental Physics of the Universe, Via Beirut 2, 34014 Trieste, Italy
3
INFN-Sezione di Trieste, Via Valerio 2, 34127 Trieste, Italy
4
IRA-INAF, Via Gobetti 101, 40129 Bologna, Italy
5
Department of Physics and Astronomy, University of Southampton, Highfield SO17 1BJ, UK
*
Author to whom correspondence should be addressed.
Universe 2022, 8(9), 476; https://doi.org/10.3390/universe8090476
Submission received: 3 August 2022 / Revised: 5 September 2022 / Accepted: 7 September 2022 / Published: 10 September 2022
(This article belongs to the Section Cosmology)

Abstract

:
We derived astroparticle constraints in different dark matter scenarios that are alternatives to cold dark matter (CDM): thermal relic warm dark matter, WDM; fuzzy dark matter, ψ DM; self-interacting dark matter, SIDM; sterile neutrino dark matter, ν DM. Our framework is based on updated determinations of the high-redshift UV luminosity functions for primordial galaxies to redshift z 10 , on redshift-dependent halo mass functions in the above DM scenarios from numerical simulations, and on robust constraints on the reionization history of the Universe from recent astrophysical and cosmological datasets. First, we built an empirical model of cosmic reionization characterized by two parameters, namely the escape fraction f esc of ionizing photons from primordial galaxies, and the limiting UV magnitude M UV lim down to which the extrapolated UV luminosity functions steeply increased. Second, we performed standard abundance matching of the UV luminosity function and the halo mass function, obtaining a relationship between UV luminosity and the halo mass, whose shape depends on an astroparticle quantity X specific to each DM scenario (e.g., WDM particle mass); we exploited such a relationship to introduce (in the analysis) a constraint from primordial galaxy formation, in terms of the threshold halo mass above which primordial galaxies can efficiently form stars. Third, we performed Bayesian inference on the three parameters f esc , M UV lim , and X via a standard MCMC technique, and compared the outcomes of different DM scenarios on the reionization history. We also investigated the robustness of our findings against educated variations of still uncertain astrophysical quantities. Finally, we highlight the relevance of our astroparticle estimates in predicting the behavior of the high-redshift UV luminosity function at faint, yet unexplored magnitudes, which may be tested with the advent of the James Webb Space Telescope.

1. Introduction

Many astrophysical probes and cosmological experiments have firmly established that most of the matter content of the Universe is dark, i.e., is constituted by particles suffering very weak or negligible interactions with baryons apart from long-range gravitational forces. However, so far, such dark matter (DM) particles have escaped firm detection, both in colliders [1,2,3] and from direct [4,5] or indirect [6,7,8,9] searches in the sky.
The standard paradigm envisages DM to be constituted by weakly interacting particles (such as supersymmetric neutralinos or gravitinos) with masses in the GeV range [10]. Such a form of DM is said to be cold, meaning that particles are non-relativistic at the epoch of decoupling and feature negligible free-streaming1. As a consequence, bound cold DM (CDM) structures, called halos, grow sequentially in time and hierarchically in mass by stochastically merging together [11,12].
On large, cosmological scales, such a picture is remarkably consistent with the data, and most noticeably with microwave background detection experiments [13]. However, on galactic and subgalactic scales, the CDM hypothesis has been challenged by various issues, including: the flat shape of the inner density profiles in DM-dominated dwarfs with respect to the steep behavior measured in the halos of N-body simulations [14,15]; the discrepancy between the number and dynamical properties of observed Milky Way satellites with respect to those of subhalos in gravity-only simulations [16,17]; the emergence of tight relationships between properties of the dark and luminous components in disc-dominated galaxies, such as the universal core surface density or the radial acceleration relation [18,19], which may be indicative of a new dark sector and/or of non-gravitational coupling between DM particles and baryons. One possible explanation for the above effects invokes physical processes that can cause violent fluctuations in the inner gravitational potential and/or the transfer of energy and angular momentum from the baryons to DM, such as dynamical friction [20,21] or feedback effects from stars and active galactic nuclei [22,23,24].
An alternative, perhaps more fascinating solution is to abandon the CDM hypothesis and look at nonstandard particle candidates [25,26,27]. A few examples often considered in the literature and relevant for the present paper include: thermal warm dark matter (WDM) relics with masses ∼ a few keVs [28,29,30]; fuzzy or particle-wave dark matter ( ψ DM), i.e., Bose–Einstein condensates of ultralight axions with masses 10 22 eV [31,32]; self-interacting dark matter (SIDM) mediated by a massive dark photon decaying to a light–dark fermion [33,34,35]; non-thermally produced sterile neutrinos dark matter ( ν DM) with the keV-scale mass, and given lepton asymmetry [36,37,38]. As a consequence of free-streaming, quantum pressure effects, and/or dark-sector interaction, all these scenarios produce a matter power spectrum suppressed on small scales, fewer (sub)structures, and flatter inner density profiles within halos relative to CDM [33,35,39,40,41,42,43,44,45]. Indirect astrophysical constraints on the properties of such nonstandard DM scenarios, and especially of thermal WDM relics, have been obtained by investigating the Lyman- α forest [29,46,47], high-redshift galaxy counts [48,49,50,51], γ -ray bursts [52,53], cosmic reionization [54,55,56,57], integrated 21cm data [58,59,60,61], γ -ray emission [62,63], fossil records of the Local Group [64,65], and Milky Way satellite galaxies [66,67,68].
The present paper will mainly focus on the constraints to DM that can be derived from cosmic reionization. This is the process by which the intergalactic medium has transitioned again to an ionized state (it was already fully ionized before the epoch of recombination, when the Universe was younger than 380,000 years) due to the radiation from the first astrophysical sources, such as primordial galaxies and AGNs. Reionization constitutes a natural bridge between galaxy formation and the underlying cosmological model; in a nutshell, the basic argument runs as follows. The history of cosmic reionization, as reconstructed from cosmological and astrophysical observations, can be exploited to gauge the level of the ionizing background from primordial galaxies, and in turn (although with some assumptions to be discussed next) to probe their number densities. Such galaxies are faint and tend to live within small halos so that their numbers can inform us about the shape of the halo mass distribution and of the power spectrum at the low mass end, which is sensitive to the microscopic properties of the DM particles.
More specifically, in the present paper, we aimed to obtain revisited and additional astroparticle constraints for the aforementioned DM scenarios (WDM, ψ DM, SIDM, and ν DM) by combining different ingredients: (i) updated measurements of the high-redshift UV luminosity functions for primordial galaxies out to redshift z 10 ; (ii) precision determination of the redshift-dependent halo mass functions in different DM scenarios from numerical simulations; (iii) recent constraints on the reionization history of the Universe from astrophysical and cosmological probes. Such ingredients were exploited to build an empirical model of cosmic reionization to be compared with the data. The model depended on three basic parameters: the escape fraction of ionizing photons from primordial galaxies, the limiting UV magnitude down to which the UV luminosity function steeply increased, and an astroparticle property specific to the DM scenario (e.g., WDM particle mass). We then performed Bayesian inference on these three parameters via a standard MCMC technique, and at the same time, we investigated how the astroparticle constraints were degenerated with (and robust against) variations in crucial (but still uncertain) astrophysical quantities. The structure of the paper is as follows: in Section 2 we describe our methods and analysis; in Section 3 we present and discuss our results; in Section 4, we summarize our findings and future perspectives. Throughout the work, we adopted the standard, flat cosmology [13] with rounded parameter values: matter density Ω M 0.31 , baryon density Ω b 0.05 , Hubble constant H 0 = 100 h km s 1 Mpc 1 with h 0.68 . A Chabrier [69] initial mass function was assumed.

2. Methods and Analysis

In this section, we present our empirical model of reionization, derive a galaxy formation constraint from the abundance matching of the luminosity functions with the halo mass functions in a specific DM scenario, and finally describe our estimation procedure based on a Bayesian MCMC technique.

2.1. An Empirical Model of Reionization

To build a simple empirical model of reionization, we start from the recent determination of the UV luminosity functions by [70,71] out to redshift z 10 . Specifically, in Figure 1 we illustrate the binned luminosity functions (filled circles) at 1600 Å in the relevant redshift range z 4–10 (color-coded), together with the corresponding continuous Schechter function rendition (solid lines) in the form d N / d M UV d V 10 0.4 ( M UV M UV ) ( α + 1 ) × exp [ 10 0.4 ( M UV M UV ) ] . The luminosity functions were well determined down to a UV magnitude M UV 17 , with the faint end progressively steepening from a slope α 1.7 at z 4 to α 2.4 at z 10 , and a characteristic magnitude M UV 21 is almost independent of redshift for z 4 . Note that the UV magnitude can be related to the monochromatic UV luminosity at 1600 Å by the relation log L UV [erg s 1 Hz 1 ] 0.4 ( M UV 51.6 ) .
In Figure 1, we also report the intrinsic luminosity functions after correction for dust extinction (dashed lines), which have been computed exploiting the relation between extinction, the slope of the UV spectrum, and observed UV magnitude by [72,73]; we caveat the reader that such a dust correction can be considered well-established and robust only for UV magnitude M UV 22 and z 8 . The figure shows that the effects of dust extinction on the galaxy statistics are negligible in the present context since cosmic reionization is majorly contributed by faint galaxies with M UV 17 , where the intrinsic and observed luminosity functions are practically indistinguishable. The intrinsic UV luminosity is routinely linked to the physical star formation rate (SFR) of galaxies by the relation L UV = κ UV × SFR, with the quantity κ UV depending somewhat on the IMF, on galactic age and on chemical composition (see [74,75,76,77,78]); we adopt as a reference value κ UV 1.5 × 10 28 erg s 1 Hz 1 M 1 year, apt for a Chabrier IMF, age 10 8 years, and appreciably sub-solar metallicity. Then the relation log SFR [M year 1 ] 0.4 ( M UV + 18.5 )  holds.
From the intrinsic UV luminosity functions, we compute the cosmic SFR density as
ρ SFR ( z ) = M UV lim d M UV d N d M UV d V SFR ,
where M UV lim represents a limiting magnitude down to which the luminosity function is steeply increasing; the rationale is that at magnitudes fainter than such a threshold, the luminosity function bends downwards because the galaxy formation process becomes inefficient and/or because the power spectrum is cut-off due to the microscopic nature of DM [44,79,80]. The quantity M UV lim is uncertain since the observations of the UV luminosity function are limited to M UV 17 ; thus, it will be treated as a free parameter in our Bayesian analysis discussed in Section 2.3.
Then we compute the cosmic ionization photon rate as
N ˙ ion f esc k ion ρ SFR + N ˙ ion AGN ;
here k ion 4 × 10 53 is the number of ionizing photons s 1 M 1 year appropriate for a Chabrier IMF, f esc is the average escape fraction of ionizing photons from primordial galaxies [76,77,81,82], and N ˙ ion AGN is the contribution to the ionization rate from active galactic nuclei (AGNs).
The escape fraction from primordial galaxies is still a very uncertain quantity, with estimates ranging from a few percentage points to a few tens of percentage points [83,84,85,86,87,88,89,90]. We will keep f esc as a free parameter in our Bayesian analysis of Section 2.3, to highlight the impact of such an astrophysical uncertainty on the astroparticle constraints. However, we will also explore the implication of adopting a redshift-dependent escape fraction f esc ( z ) increasing from small values 5 % in the local Universe to around ≈20% at a high redshift, as suggested by cosmological radiative transfer simulations of the UV background [91].
The quantity k ion entering in Equation (2) is also somewhat uncertain because it depends on the adopted IMF, metallicity, and other stellar population properties; however, its values have been shown not to vary wildly [55,73,76,78,81]. Perhaps the only exception is when a hypothetically strongly top-heavy IMF is assumed, since in that case the number of ionizing photons is considerably enhanced; however, note that such an IMF would imply a correspondingly stronger metal and dust enrichment of the interstellar medium in primordial galaxies already at z 8 , which is not expected for these faint UV sources and in turn, would dramatically reduce their ionization efficiency. For the sake of simplicity, hereafter we will assume the aforementioned definite value of k ion , but notice that any constraint derived on f esc should actually be referred to as the combined quantity f esc × ( k ion / 4 × 10 53 s 1 M 1 year ) .
As for the AGN contribution N ˙ ion AGN appearing in Equation (2), we adopt the redshift-dependent parameterization by [92]
N ˙ ion AGN 1.1 × 10 50 f esc AGN ( 1 + z ) 5.865 e 0.731 z 15.6 + e 3.055 z ,
in units of ionizing photons s 1 Mpc 3 , which is based on the latest determination of the bolometric AGN luminosity functions. These imply a rapid decline in the number density of bright quasars and a relative paucity of faint AGNs for z 4 , though the latter point is still somewhat debated [92,93,94,95,96,97,98]. As a consequence, the AGN contribution to the overall N ˙ ion for z 5 is minor with respect to primordial galaxies, even when escape fractions around f esc AGN 100 % are adopted [99,100].
We then exploit N ˙ ion ( z ) from Equation (2) to compute the hydrogen ionizing fraction Q HII from the evolution equation
Q ˙ HII = N ˙ ion n ¯ H Q HII t rec ,
that takes into account the competition between ionization and recombination processes [76,81,101,102]. In the above, n ¯ H 2 × 10 7 ( Ω b h 2 / 0.022 ) cm 3 is the mean co-moving hydrogen number density, and t rec 3.2 Gyr [ ( 1 + z ) / 7 ] 3 C HII 1 is the recombination timescale for the case B coefficient and an IGM temperature of 2 × 10 4 K. The quantity C HII (appearing in the recombination time) is the clumping factor of the ionized hydrogen, for which we adopt the redshift-dependent parameterization C HII min [ 1 + 43 z 1.71 , 20 ] by [103,104].
Finally, we compute the electron scattering optical depth out to redshift z from
τ es ( < z ) = c σ T n ¯ H z d z f e Q HII ( z ) ( 1 + z ) 2 H 1 ( z ) ,
where H ( z ) = H 0 [ Ω M ( 1 + z ) 3 + 1 Ω M ] 1 / 2 is the Hubble parameter, c is the speed of light, σ T the Thomson cross section, and f e 1 + η Y / 4 X is the number of free-electron; we adopt primordial abundances Y 0.2454 and X 1 Y , and complete double helium ionization at z 4 so that η 2 for z 4 and η 1 for z 4 .

2.2. A Constraint from Primordial Galaxy Formation

As mentioned in Section 1, we consider different DM scenarios alternative to CDM: thermal warm dark matter (WDM) relics; fuzzy dark matter ( ψ DM); self-interacting dark matter (SIDM); sterile neutrinos dark matter ( ν DM). In all these scenarios, the number of small-mass halos is reduced relative to CDM; this is best specified in terms of the halo mass function, namely the number density of halos per co-moving volume and halo mass M H bins, which can be conveniently written in terms of the CDM one as
d N X d M H d V = d N CDM d M H d V 1 + α M H cut M H β γ ,
where α , β and γ are shape parameters, and M H cut is a cutoff halo mass. We compute the CDM halo mass function by exploiting the Python COLOSSUS package [105] and the fitting formula by [106] for virial masses. The parameters ( α , β , γ ) in Equation (6) are instead derived from fits to the outcomes of numerical simulations in the considered DM scenarios; the related values of the parameters, and the literature works from which these are taken, are reported in Table 1. We stress that for deriving robust constraints on different DM scenarios based on the halo mass function it is extremely important to rely on the results from detailed simulations (as done here), and not on semi-analytic derivations based on the excursion set formalism, whose outcomes on the shape of the mass function for masses M H M H cut are rather sensitive to several assumptions (e.g., the filter function used in deriving the mass variance from the power spectrum, the mass-dependence in the collapse barrier, etc.; e.g., [39,55]).
As to the cutoff mass M H cut , in WDM it is determined by free-streaming effects [107] and reads M H cut 1.9 × 10 10 M ( m X / keV ) 3.33 in terms of the particle mass m X . The quantity M H cut for WDM is also referred to as the half-mode mass, representing the mass where the amplitude of the WDM transfer function, i.e., the square root of the ratio between the WDM and the CDM power spectra, is reduced to 50%. Note that this is substantially larger (a factor of a few 10 3 ) than the free streaming mass, i.e., the mass related to the typical length-scale for diffusion of WDM particles out of primordial perturbations. In ψ DM, M H cut 1.6 × 10 10 M ( m X / 10 22 eV ) 1.33 is related to the coherent behavior of the condensate [41] for axions with mass m X . In the SIDM scenario, M H cut 7 × 10 7 M ( T X / keV ) 3 can be linked to the visible sector temperature T X when kinetic decoupling of the DM particles takes place [35]. In the ν DM scenario, M H cut depends not only on the particle mass m X but also on the lepton asymmetry L X with which sterile neutrinos are generated out of thermal equilibrium in the early Universe [43]. In this work, we actually set the sterile neutrino mass to m X 7 keV since such a particle may constitute an interesting candidate to explain the 3.55 keV line detected in stacked X-rays observations of galaxy clusters [108]. The corresponding values of the cutoff mass as a function of L X are non-monotonic, starting from M H cut 2.4 × 10 9 M for L X 1 , then decreasing to a minimum 1.3 × 10 8 M for L X 8 and then increasing again to 9.2 × 10 8 M for L X 11 up to 3.1 × 10 9 M for the maximal L X 120 .
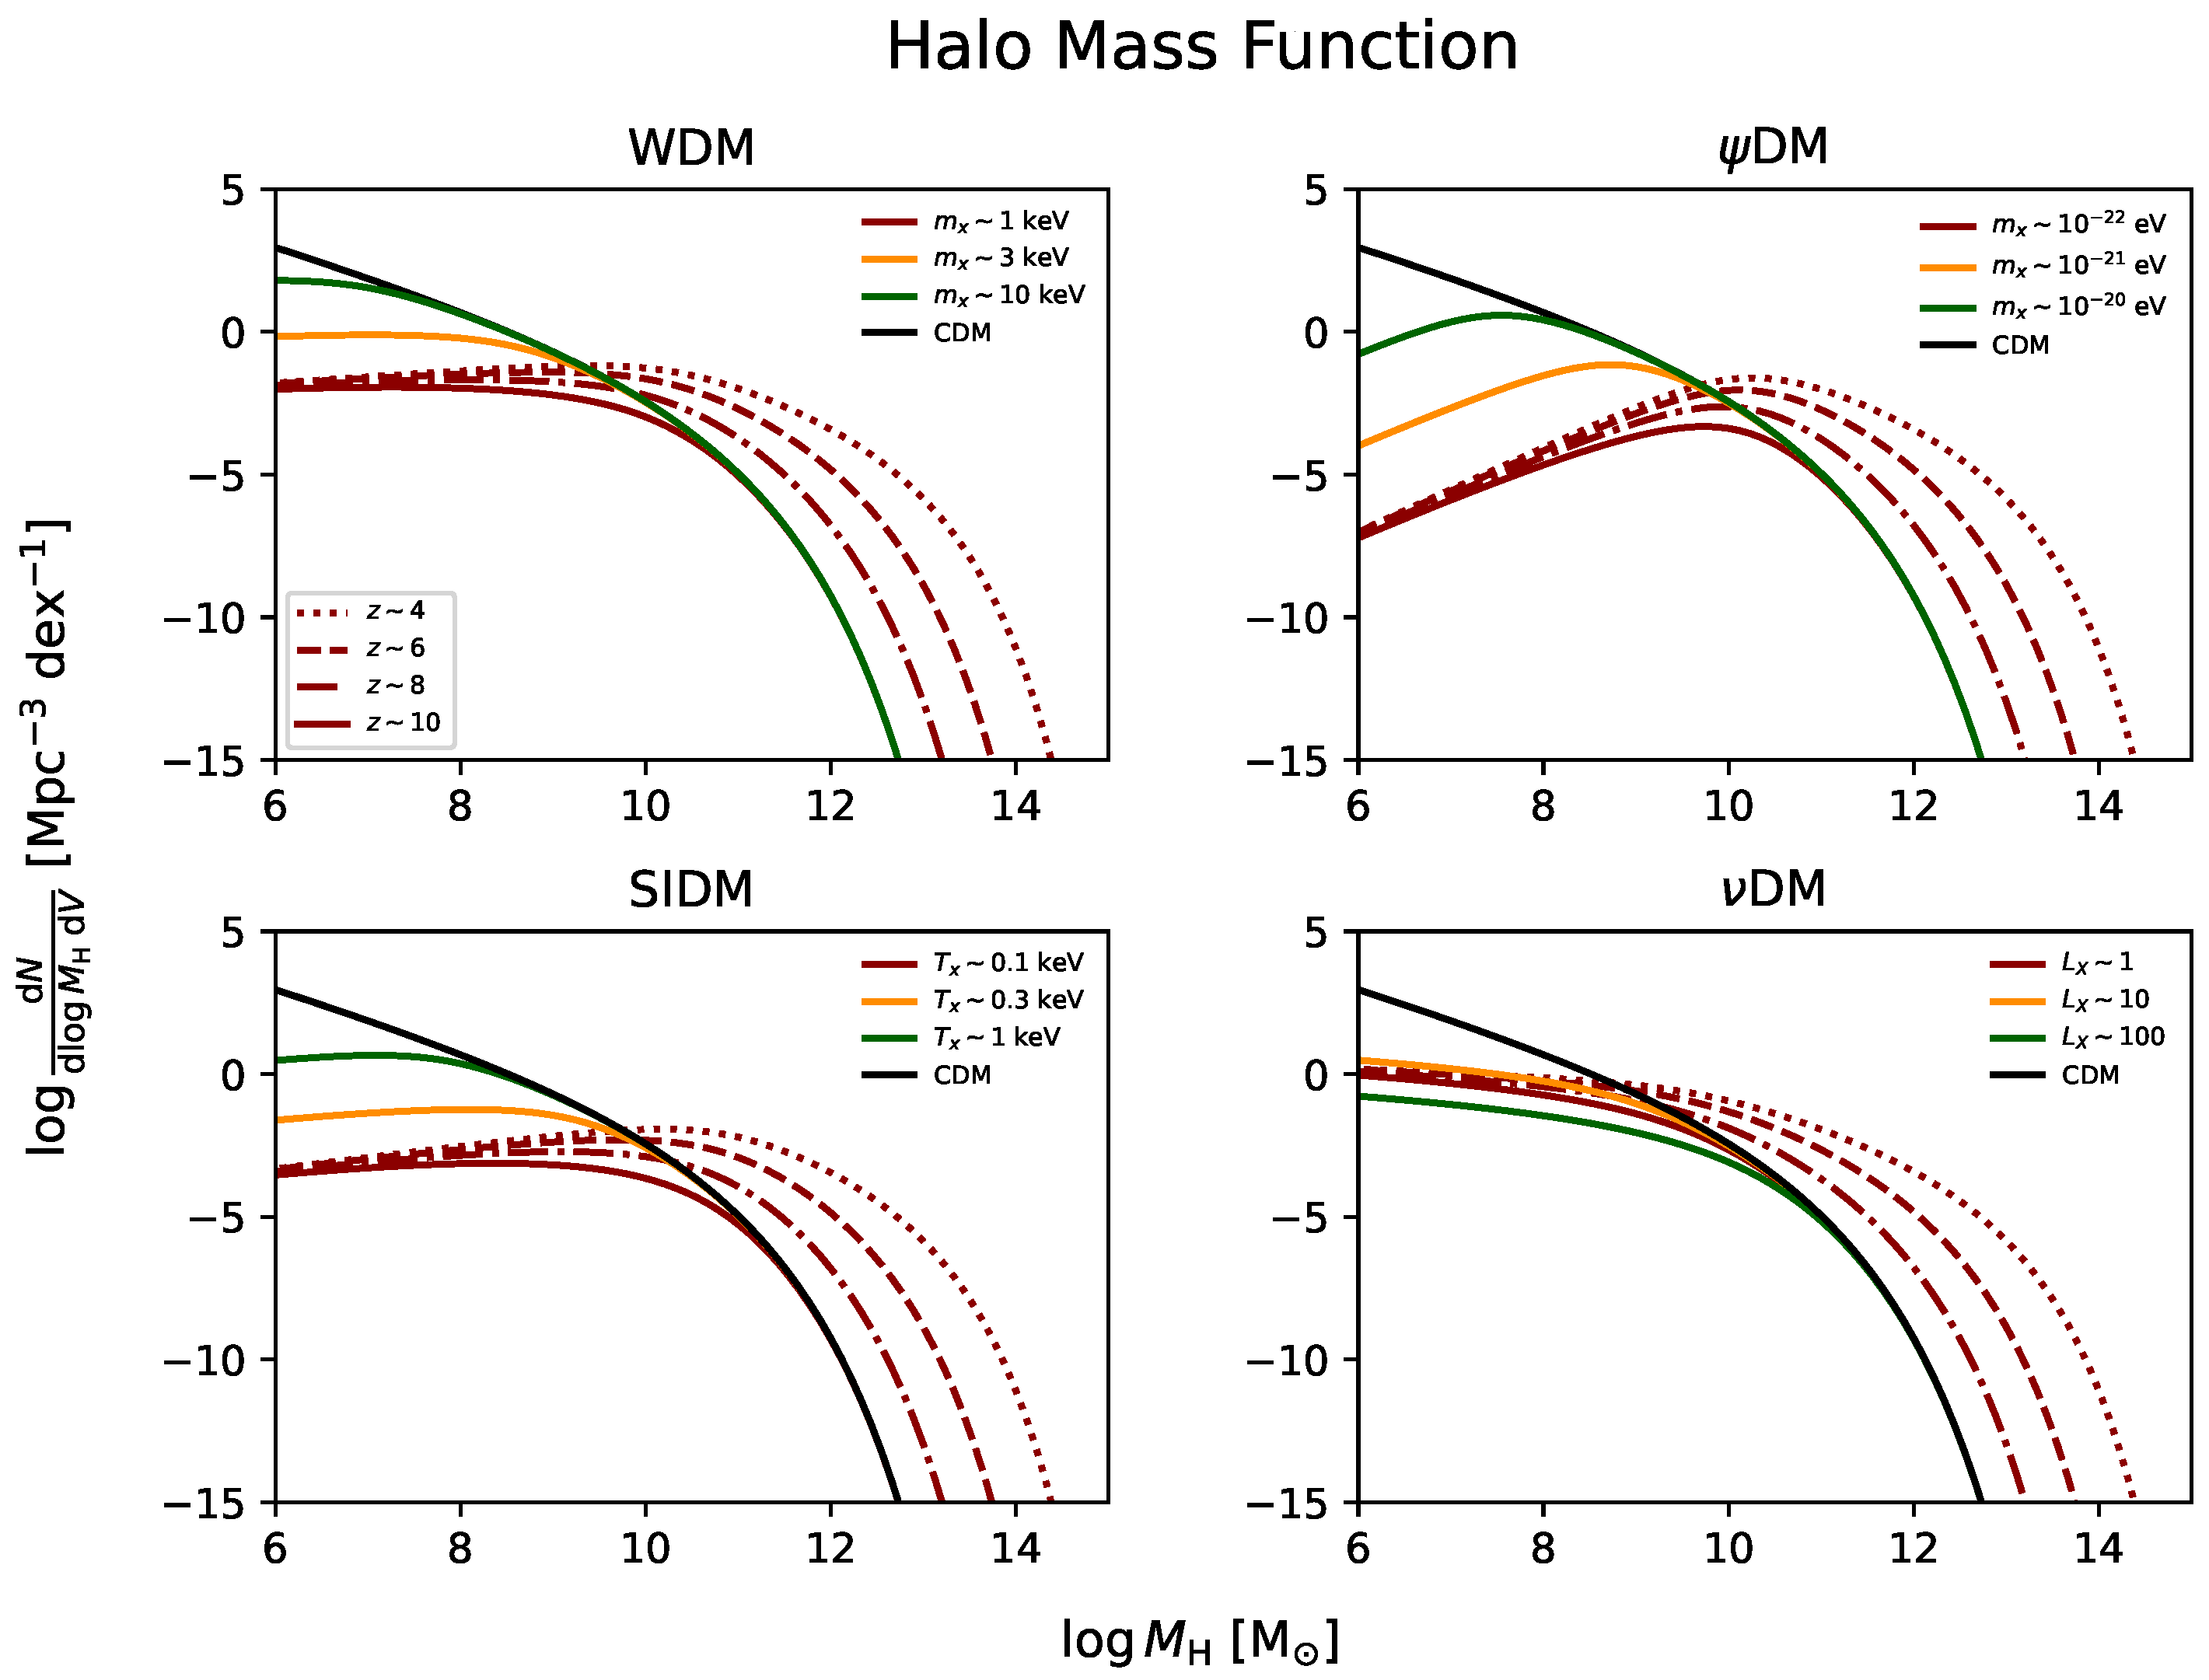
In Figure 2, we illustrate the halo mass functions in the different DM scenarios, to highlight the dependence on redshift and the particle property. For example, focusing on WDM, it is seen that at a given redshift z 10 (solid lines with different colors) the halo mass function progressively flattens with respect to that in standard CDM (black line); the deviation occurs at smaller halo masses for higher WDM particle masses m X , so that the CDM behavior is recovered for m X . At a given particle mass, m X 1 keV (red lines with different line styles), the exponential cutoff of the mass function shifts to larger halo masses for decreasing redshift, reflecting the hierarchical clustering of halos. In the other DM scenarios, the behavior is similar, but the shape of the mass function past the low-mass end flattening can be appreciably different; e.g., in the ψ DM scenario the mass function is strongly suppressed for small masses and actually bends downward rather than flattening, implying a strong reduction or even an absence of low mass halos.
We are now left with an observed UV luminosity function that is required to be steep down to M UV lim for reproducing the reionization history, and at the same time a halo mass function that progressively flattens or even bends down for halo masses smaller than M H cut . This necessarily implies that the relationship between UV magnitude and halo masses must differ from the CDM case and depend on the DM scenario. Such a relationship may be derived via the standard abundance matching technique [109,110,111,112], i.e., matching the cumulative number densities in galaxies and halos according to the expression
M H + d M H d N X d M H d V ( M H , z | X ) = M UV d M UV d N d M UV d V ( M UV , z )
which implicitly defines a one-to-one monotonic relationship M H ( M UV , z | X ) ; here the quantity X stands for the specific property of the DM scenario that determines the behavior of the mass function for M H M H cut : particle mass m X for WDM and ψ DM, kinetic temperature T X for SIDM, and lepton asymmetry L X for ν DM. In Figure 3, we show the outcome of this procedure in the different DM scenarios, highlighting its dependence on redshift and the particle property. Focusing on WDM as a representative case, it is seen that at a given redshift z 10 (solid lines with different colors) the M H ( M UV | X = m X ) relation progressively steepens with respect to the standard CDM case (black line), and more for smaller m X ; at the other end, the relation becomes indistinguishable from that in CDM for particle masses m X some keVs. At a given particle mass m X 1 keV (red lines with different line styles), the relation M H ( M UV , z | m X ) barely depends on redshift, at least in the range z 4 –10 relevant to this work, because the cosmic evolution of the UV luminosity function and the halo mass function mirror each other (see discussion by [70]). In the other DM scenarios, the behavior of the M H ( M UV , z | X ) relation is similar but its shape for small halo masses is appreciably different; e.g., in the ψ DM scenario, the relation is substantially steeper, reflecting the paucity of small halos in the mass function (see above)
In all panels of Figure 3, the grey shaded area illustrates the region where the galaxy formation is thought to become inefficient because of various processes [76,78,113,114]: molecular cooling may be hindered and atomic cooling may be limited given the low metallicities expected at high redshift; SN feedback can easily quench star formation in low-mass halos; star formation may be photo-suppressed by the intense diffuse UV background; the formation of massive stars at low metallicities may originate additional radiative feedback processes; etc. This inefficiency in galaxy formation is thought to occur for halo masses smaller than a critical value M H GF a few 10 8 M possibly dependent on redshift, albeit with some uncertainties due to detailed modeling of the above processes. Remarkably, it has also been pointed out that such a threshold can alleviate the missing satellite problem, because the number density of small mass halos where galaxy formation can take place becomes closer to the number of visible satellites in the Milky Way [17,53].
We conservatively adopt a threshold M H GF 10 8 M that is typically associated to photo-suppression of galaxy formation due to the UV background [78]; other choices will be explored in Section 3. We can now introduce the self-consistency galaxy formation constraint
M H ( M UV lim , z | X ) M H GF
i.e., the limiting UV magnitude down to which the UV luminosity function is steeply increasing must correspond, in the given DM scenario, to the halo mass M H GF (see also Section 2.1); in other words, for halo masses M H M H GF , galaxy formation is hindered, and this will imply that at magnitudes fainter than M UV lim the UV luminosity function will no rise any longer. We allow for a 0.25 dex dispersion around Equation (8); this quantitatively includes both the scatter in the abundance matching relation M H ( M UV lim , z | X ) associated to the uncertainty in the UV luminosity functions determination (see also [109]), and the theoretical uncertainty in the threshold halo mass M H GF for galaxy formation (see [76,78]).
Note that the abundance matching procedure in Equation (7) automatically guarantees to have, at any given redshift, the same number of halos hosting galaxies and of galaxies producing ionizing photons; in other words, the cumulative number of halos obtained integrating the halo mass function down to M H GF is approximately equal to the cumulative number of galaxies obtained by integrating the UV luminosity function down to M UV lim . Other investigations in the literature (e.g., [49,55,57,58]) have adopted conditions less restricting than Equation (7), for example by requiring just to have a larger number of halos hosting galaxies than of galaxies contributing to cosmic reionization.

2.3. Bayesian Analysis

The descriptions provided in the previous sections highlight that three basic parameters enter our framework: the escape fraction f esc of ionizing photons from primordial galaxies, the limiting UV magnitude M UV lim down to which the UV luminosity function is steeply increasing, and a quantity X specific to the DM scenario. To estimate such parameters, we adopted a Bayesian MCMC framework, numerically implemented via the Python package emcee[115]. We used a standard Gaussian likelihood L ( θ ) i χ i 2 ( θ ) / 2 where θ = { f esc , M UV lim , m X } is the vector of parameters, and the summation is over different observables; for the latter, the corresponding χ i 2 = j [ M ( z j , θ ) D ( z j ) ] 2 / σ D 2 ( z j ) is obtained by comparing our empirical model expectations M ( z j , θ ) to the data D ( z j ) with their uncertainties σ D 2 ( z j ) , summing over the different redshifts z j of the datapoints (when applicable).
Our overall data sample is constituted by (see summary in Table 2): robust observational measurements at z 4 of the ionizing photon rate [116,117]; constraints on the volume filling factor of ionized hydrogen provided by various astrophysical probes, including Lyman- α emitters and Lyman-break galaxies luminosity functions, Lyman- α forest dark pixels, and QSO damping wings [118,119,120,121,122,123,124,125]; latest constraints on the electron scattering optical depth provided by the observations of the cosmic microwave background from the Planck [13] mission. We also include the galaxy formation constraint provided by a χ GF 2 j [ M H ( M UV lim , z j | X ) M H GF ] 2 / σ GF 2 , where we take z j = { 4 , 6 , 8 , 10 } as reference redshifts (to avoid extrapolation at redshifts where the UV luminosity functions are not well constrained) and σ GF 0.25 dex as the typical uncertainty in the galaxy formation constraint.
We adopt flat priors π ( θ ) on the parameters within the ranges f esc [ 0 , 1 ] , M UV lim [ 20 , 8 ] , and X [ 0 , 15 ] . Note that the latter is the same for any DM scenario; it refers to different units depending on the meaning of X; e.g., in the WDM scenario, X represents the DM particle mass m X in units of keVs. We then sample the posterior distribution P ( θ ) L ( θ ) π ( θ ) by running emcee with 10 5 steps and 300 walkers; each walker is initialized with a random position uniformly sampled from the (flat) priors. After checking the auto-correlation time, we remove the first 20 % of the flattened chain to ensure the burn-in; the typical acceptance fractions of the various runs are in the range 30–40%. Convergence of the chains and decently shaped posteriors are attained in a reasonable computational time, around 90–120 min on a laptop with an Intel i7-8565U CPU running the MCMC algorithm parallelized over 8 cores.

3. Results and Discussion

In this section, we report and discuss our results for different DM scenarios, according to the Bayesian procedure presented in Section 2.3. As a preliminary step, we analyze the data without taking into account the galaxy formation constraint from abundance matching. The result is shown by the grey contours/lines in Figure 4 (left panel). The marginalized constraint on the escape fraction and the limiting UV magnitude read f esc 0.16 0.01 + 0.03 and M UV lim 15.6 2.0 + 1.7 . As expected these are rather loose, since there is a clear degeneracy between these two quantities: the data on reionization history can be reproduced in principle by assuming a smaller f esc , i.e., decreasing the number of ionizing photons escaping from each galaxy, while increasing the limiting UV magnitude M UV lim , i.e., enhancing the number of galaxies that populate the faint end of the luminosity function and, hence, contribute to the ionizing background.
Once the galaxy formation constraint M H ( M UV lim , z | X ) = M H GF from abundance matching is included in the statistical analysis, the result becomes sensitive to the DM scenario. We illustrate the outcome for the standard CDM by the magenta contours/lines in Figure 4 (right panel). In this case, the DM particle is so cold (≳GeV) that independently of its precise value the threshold halo mass for galaxy formation M H GF corresponds uniquely to a faint M UV lim and correspondingly to a quite low f esc , see the solid black line in Figure 3. The marginalized constraints for CDM turns out to be f esc 0.051 0.005 + 0.005 and M UV lim 11.4 0.1 + 0.1 .
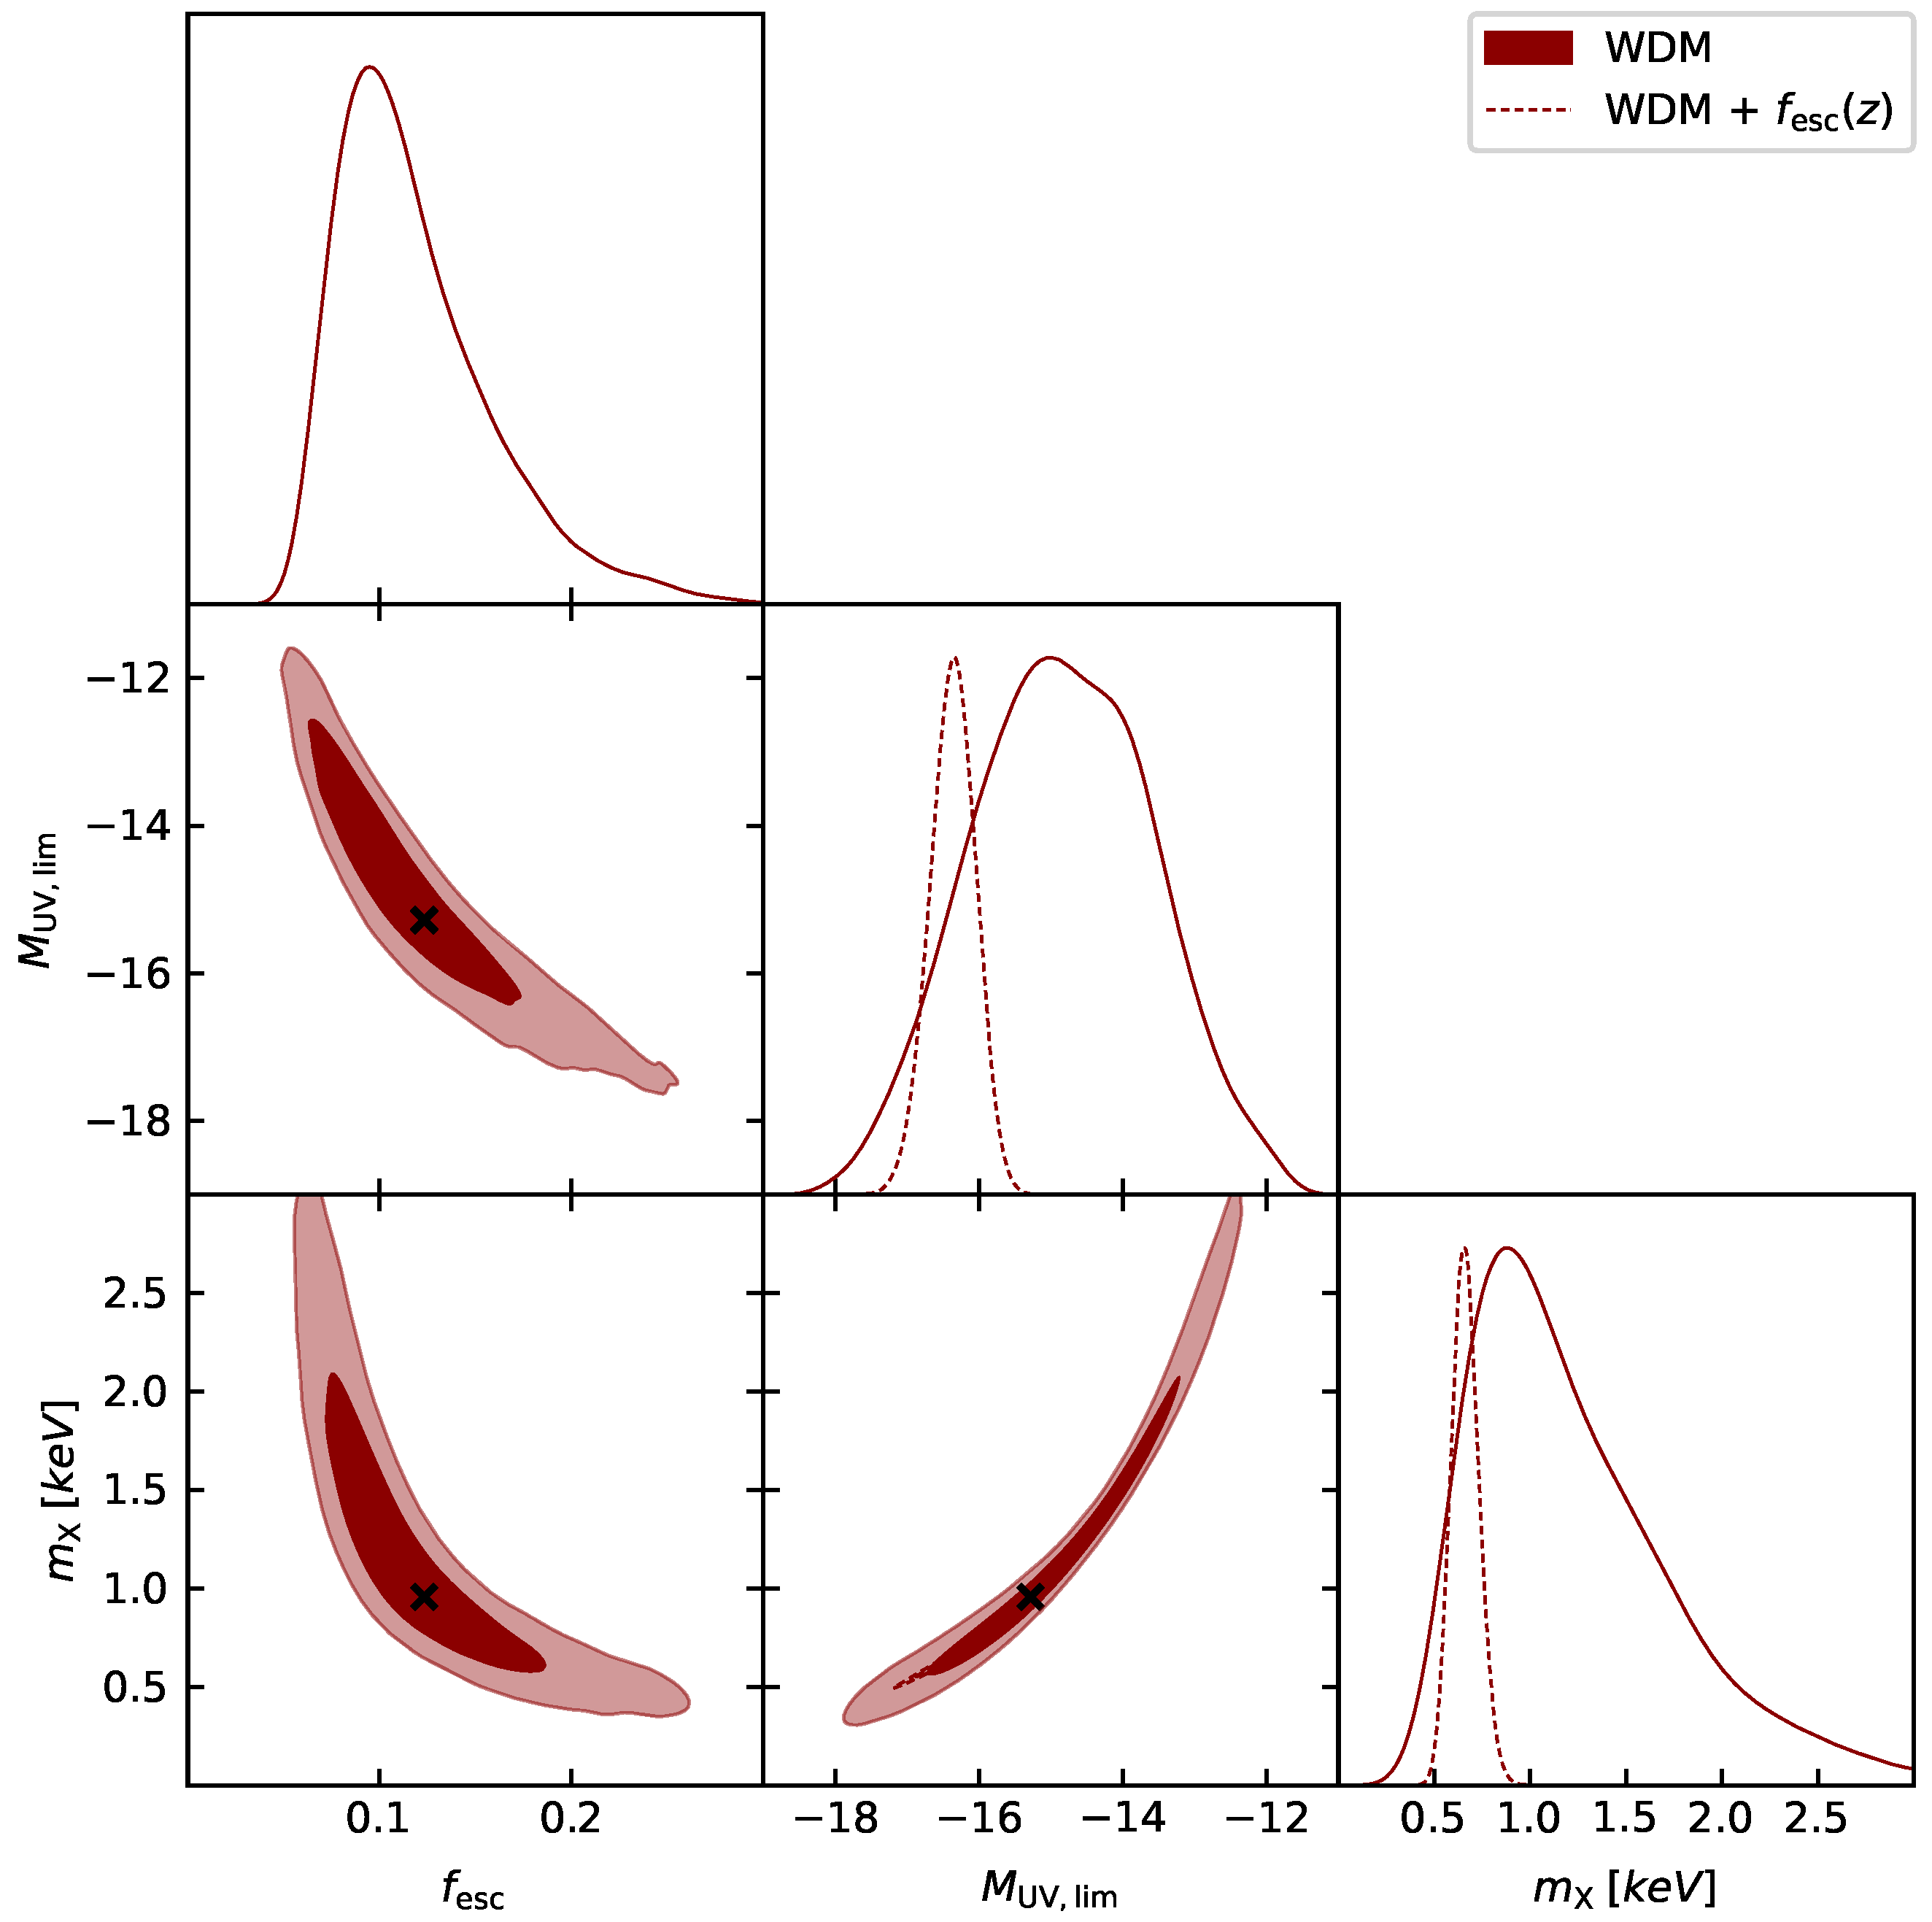
In the other DM scenarios, the situation is drastically different, because the galaxy formation constraint from abundance matching depends crucially on the DM astroparticle property X. The results for WDM are illustrated by the red lines/contours in Figure 5. For such a case, it is seen from Figure 3 that the critical halo mass for galaxy formation M H GF corresponds to a UV-limiting magnitude M UV lim 15 , appreciably brighter with respect to CDM for particle masses m X keV, while it converges to the CDM value 11.5 for m X some keVs. However, the MCMC algorithm, informed by the data on cosmic reionization, disfavor solutions with high values of m X that will correspond to very faint limiting UV magnitude and small escape fraction, with respect to values of m X 1 keV, which will instead maximize the likelihood in the subspace of the astrophysical parameters f esc and M UV lim (see black crosses in the posterior contours). In all, for WDM, we find the marginalized constraints to read f esc 0.12 0.05 + 0.02 , M UV lim 14.8 1.2 + 1.2 and m X 1.3 0.7 + 0.3 keV.
The added value of our estimate for m X appears evident when considered in comparison and/or combination with independent data from, e.g., the Lyman-alpha forest [29,46], high-redshift galaxy counts [49,50], integrated 21cm emission [58,59,60], and Milky Way satellite counts [66,68], as illustrated in Figure 6. These classic probes provide lower bounds m X 2–3 keVs at 2 σ , which are only marginally consistent with the tail of our posterior distribution. Note also that other numerical studies have shown that, to obtain the observed kpc cores of dwarf galaxies, a thermal relic mass as low as m X 0.1 keV may be needed [126], which is certainly excluded by our analysis and by the other probes listed above. In all, the tensions among all these independent constraints tend to lower the case for the keV-scale thermal WDM as a viable alternative to CDM.
In Figure 5, we also illustrate the results (dashed lines) when the escape fraction is set to the redshift-dependent value f esc ( z ) min [ 6.9 × 10 5 ( 1 + z ) 3.97 , 0.18 ] , which increases from ≈0.05 in the local Universe up to ≈0.2 at high redshift. This parameterization is based on the radiative transfer simulations by [91], which have been gauged to reproduce the evolution of the overall ionizing photon rate with cosmic time. At the redshifts relevant for reionization f esc , 0.2 appreciably exceeds the value obtained in the run with free f esc , a smaller number of galaxies is needed to meet the reionization constraints. As a consequence, we estimate a brighter value of M UV lim 16.4 0.3 + 0.3 and correspondingly a smaller m X 0.66 0.08 + 0.07 keV.
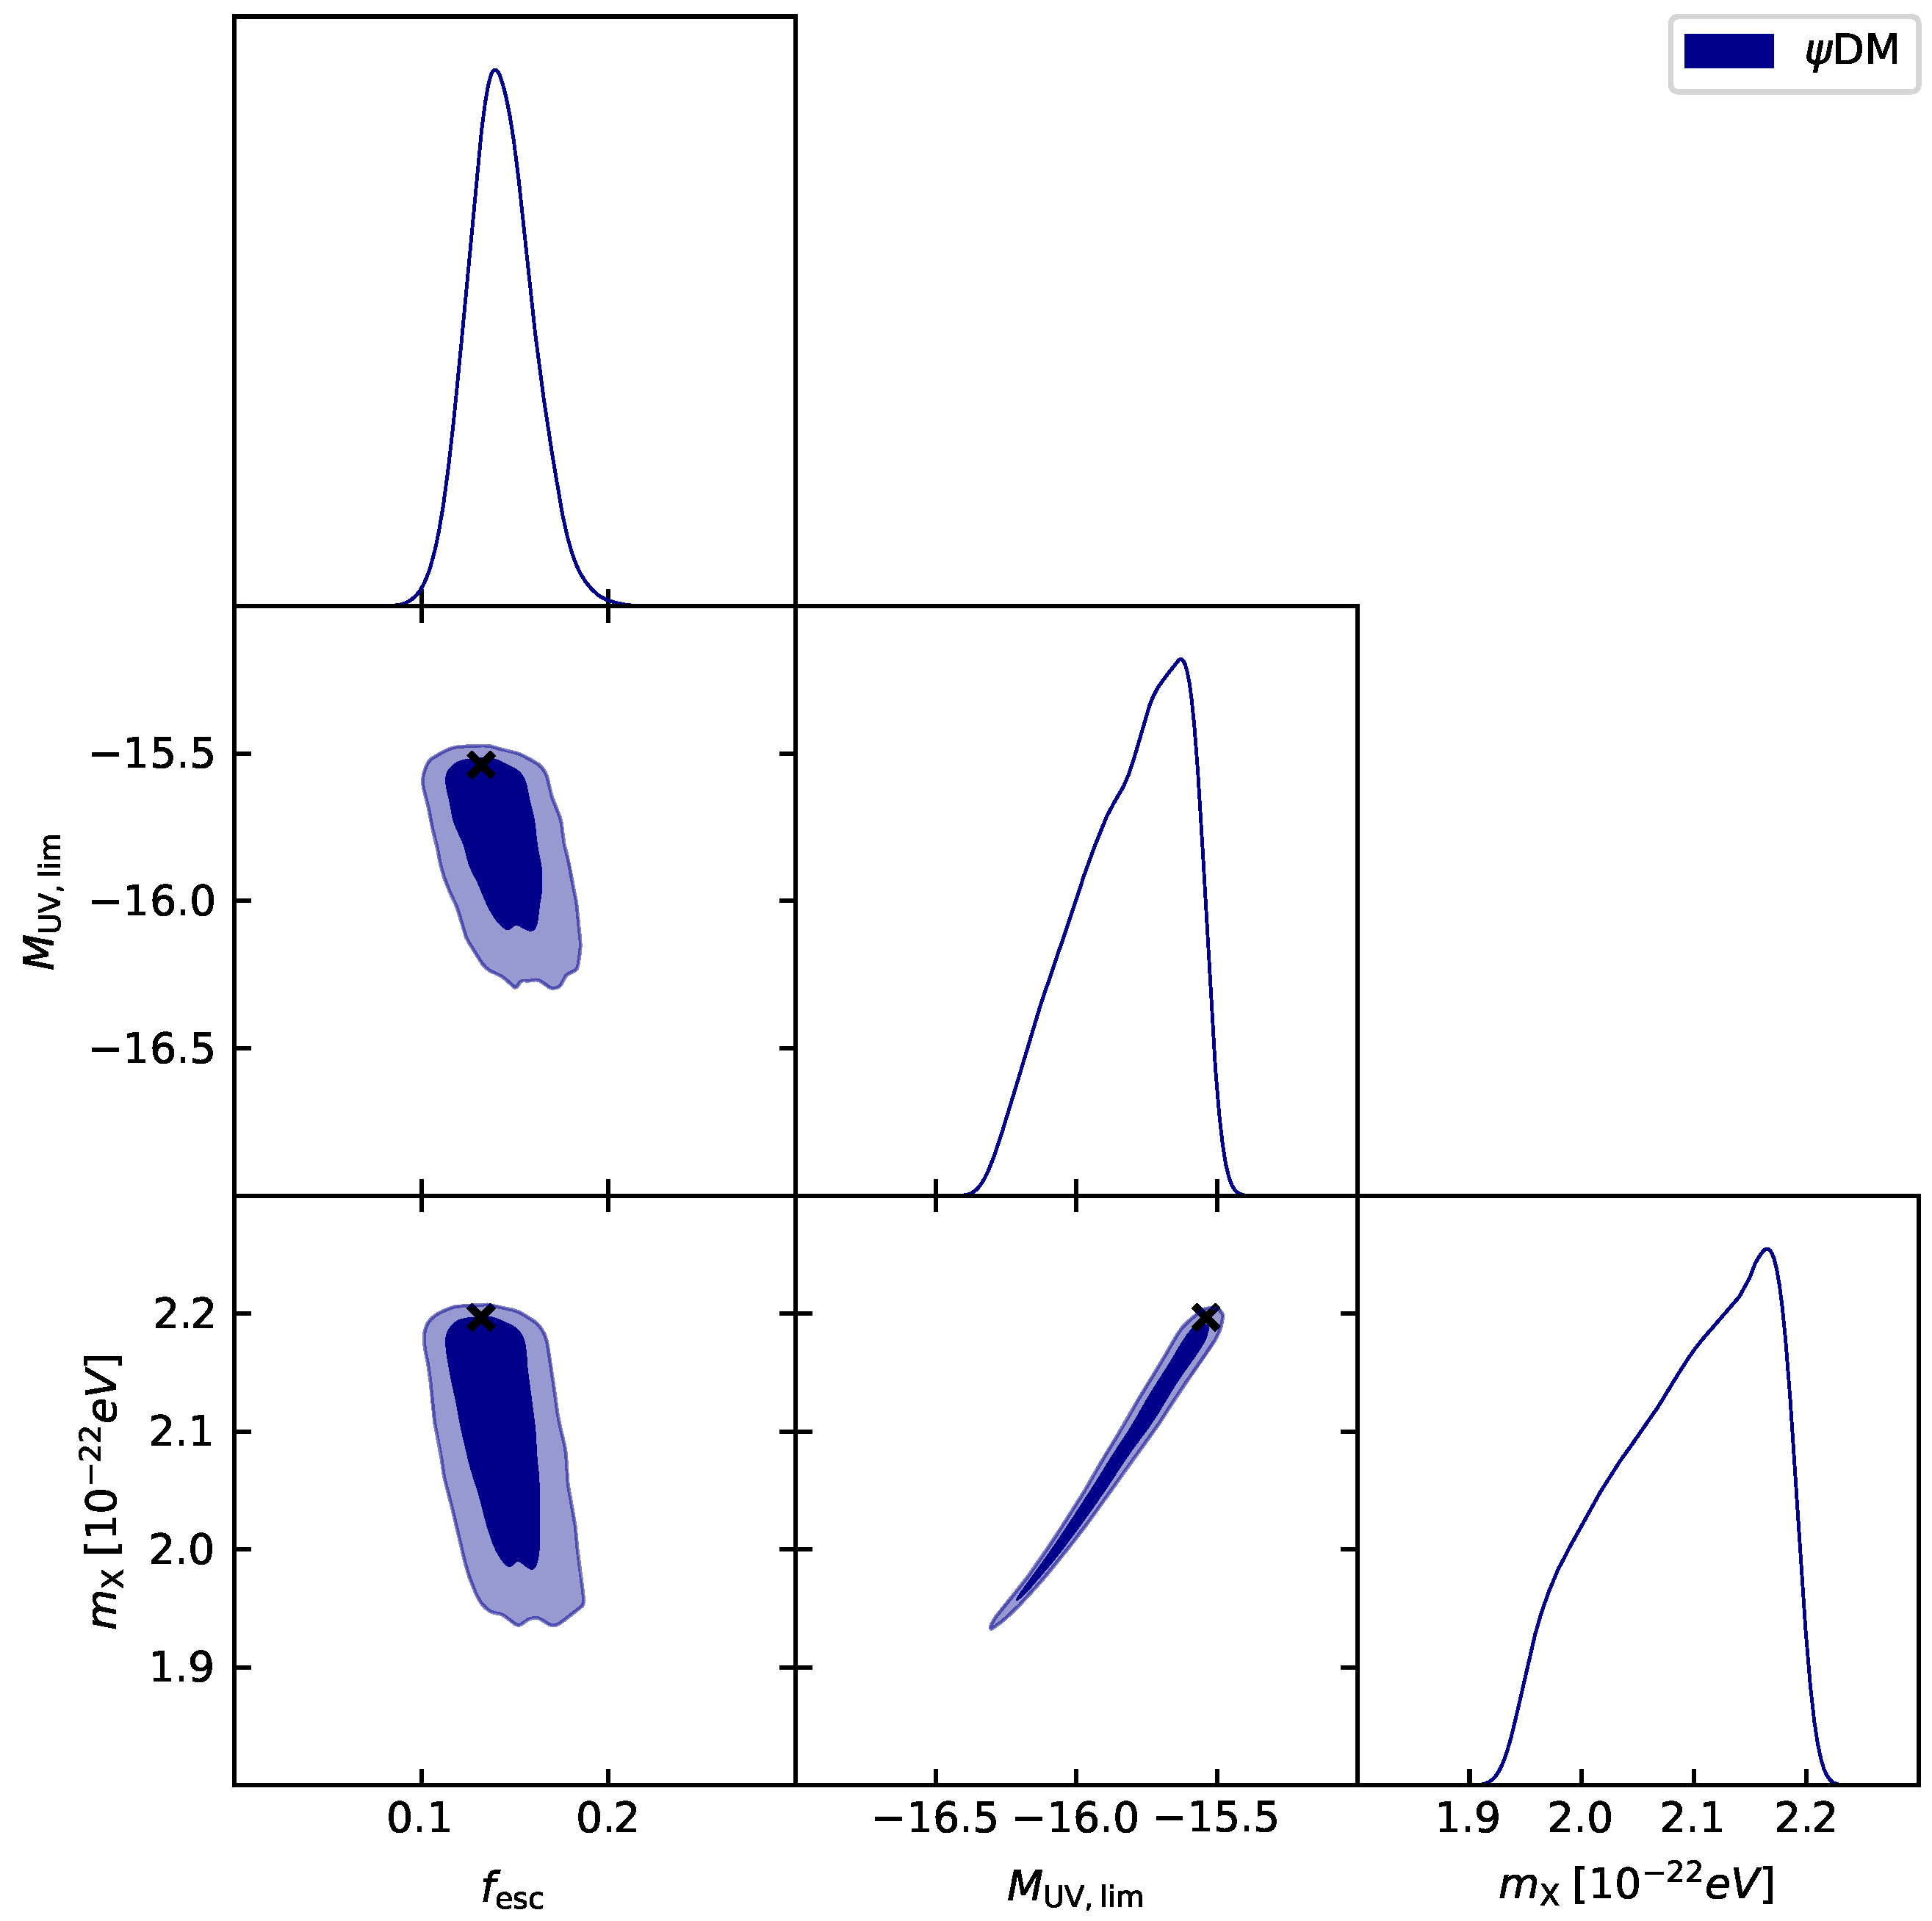
The situation in other DM scenarios is somewhat similar to WDM. The main difference resides in the behavior of the halo mass function (at small masses), which induces a different shape of the relationship between M H and M UV , and in turn, this affects the galaxy formation constraint. In the ψ DM case, whose results are illustrated in Figure 7, the M H ( M UV , z | m X ) relation is quite steep since the halo mass function bends down for small masses. This implies that the galaxy formation constraint is tight, because a small variation in the particle mass m X may induce M H GF to correspond to appreciably different M UV lim . As a consequence, the marginalized distribution of m X is extremely narrow. Our posterior estimates for ψ DM are found to be f esc 0.14 0.02 + 0.02 , M UV lim 15.8 0.1 + 0.3 and m X 2.09 0.05 + 0.09 × 10 22 eV. The latter value is appreciably smaller than independent constraints present in the literature (see Figure 6), which are somewhat in tension among themselves, from high-redshift galaxy counts [41,45], ultra-faint dwarfs [127], and Ly α forest [47]. Note also that galaxy scaling relations highlight the difficulties of ψ DM in solving the small-scale problems of CDM [131]. Currently the evidence for ψ DM as a viable alternative to CDM is marginal and should be reconsidered in light of future data.
In the SIDM scenario, whose results are shown in Figure 8, the abundance matching relation M H ( M UV lim , z | T X ) changes quite abruptly for small values of the temperature T X at kinetic decoupling. In particular, temperatures T X 0.2 keV correspond to limiting UV magnitudes brighter than 17 , which are excluded by the present data on the UV luminosity function that steeply goes down to such values; this is why the posterior of T X is somewhat truncated toward low values. The marginalized estimates for SIDM are f esc 0.12 0.05 + 0.02 , M UV lim 14.8 1.4 + 1.1 and T X 0.24 0.13 + 0.04 keV. As shown in Figure 6, the latter value is consistent within 3 σ with that from Ly α forest [46], satellite counts [35] and dwarf galaxies [33].
In the ν DM scenario with a particle mass m X 7 keVs, whose results are shown in Figure 9, the derived constraints are less sharp. This is because, as it can be seen from Figure 3, the M H ( M UV , z | L X ) relation from abundance matching changes only slightly for different lepton asymmetries L X , implying a quite broad posterior on such parameter. Specifically, for ν DM, we find marginalized estimates amounting to f esc 0.068 0.008 + 0.008 , M UV lim 12.7 0.4 + 0.2 and L X 10.7 1.4 + 1.4 . These constraints for 7 keV ν DM are consistent with those present in the literature (see Figure 6), satellite counts in the Milky Way [130], gravitational lensing observations [128], X-ray non-detections [129], and Ly α measurements [46], which concurrently place the lepton asymmetry in the range of L X 8 –12.
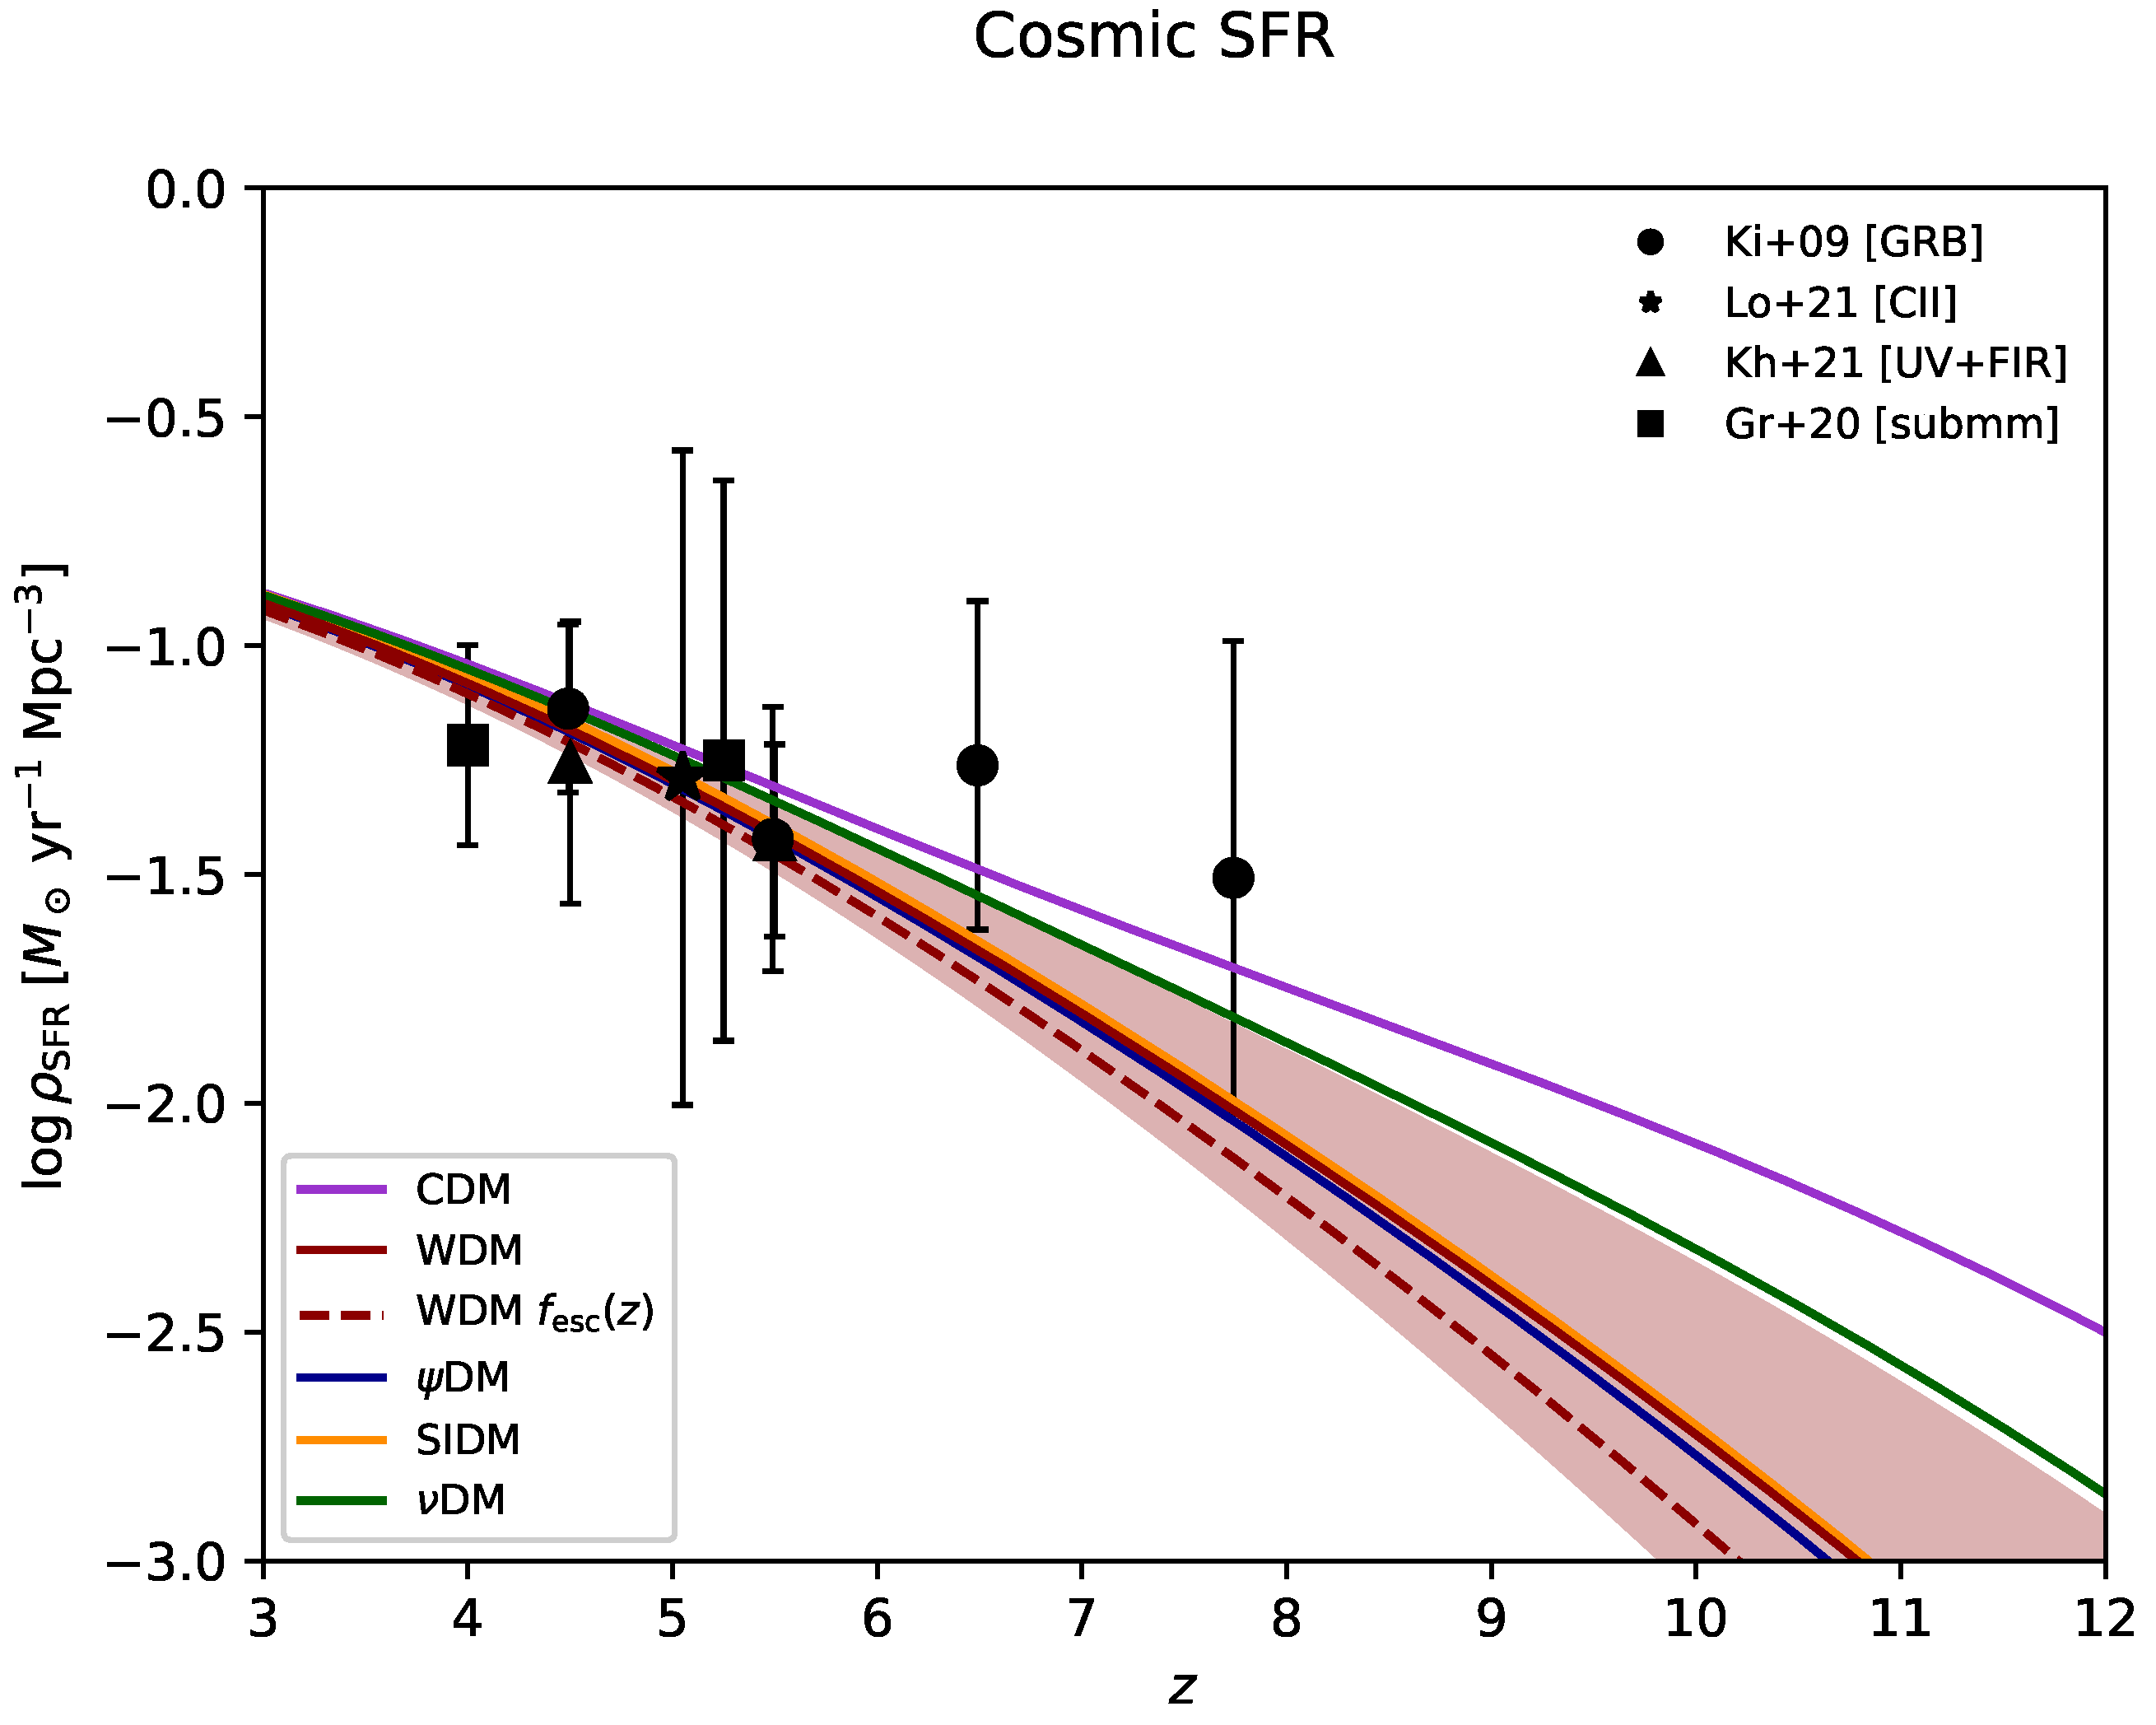
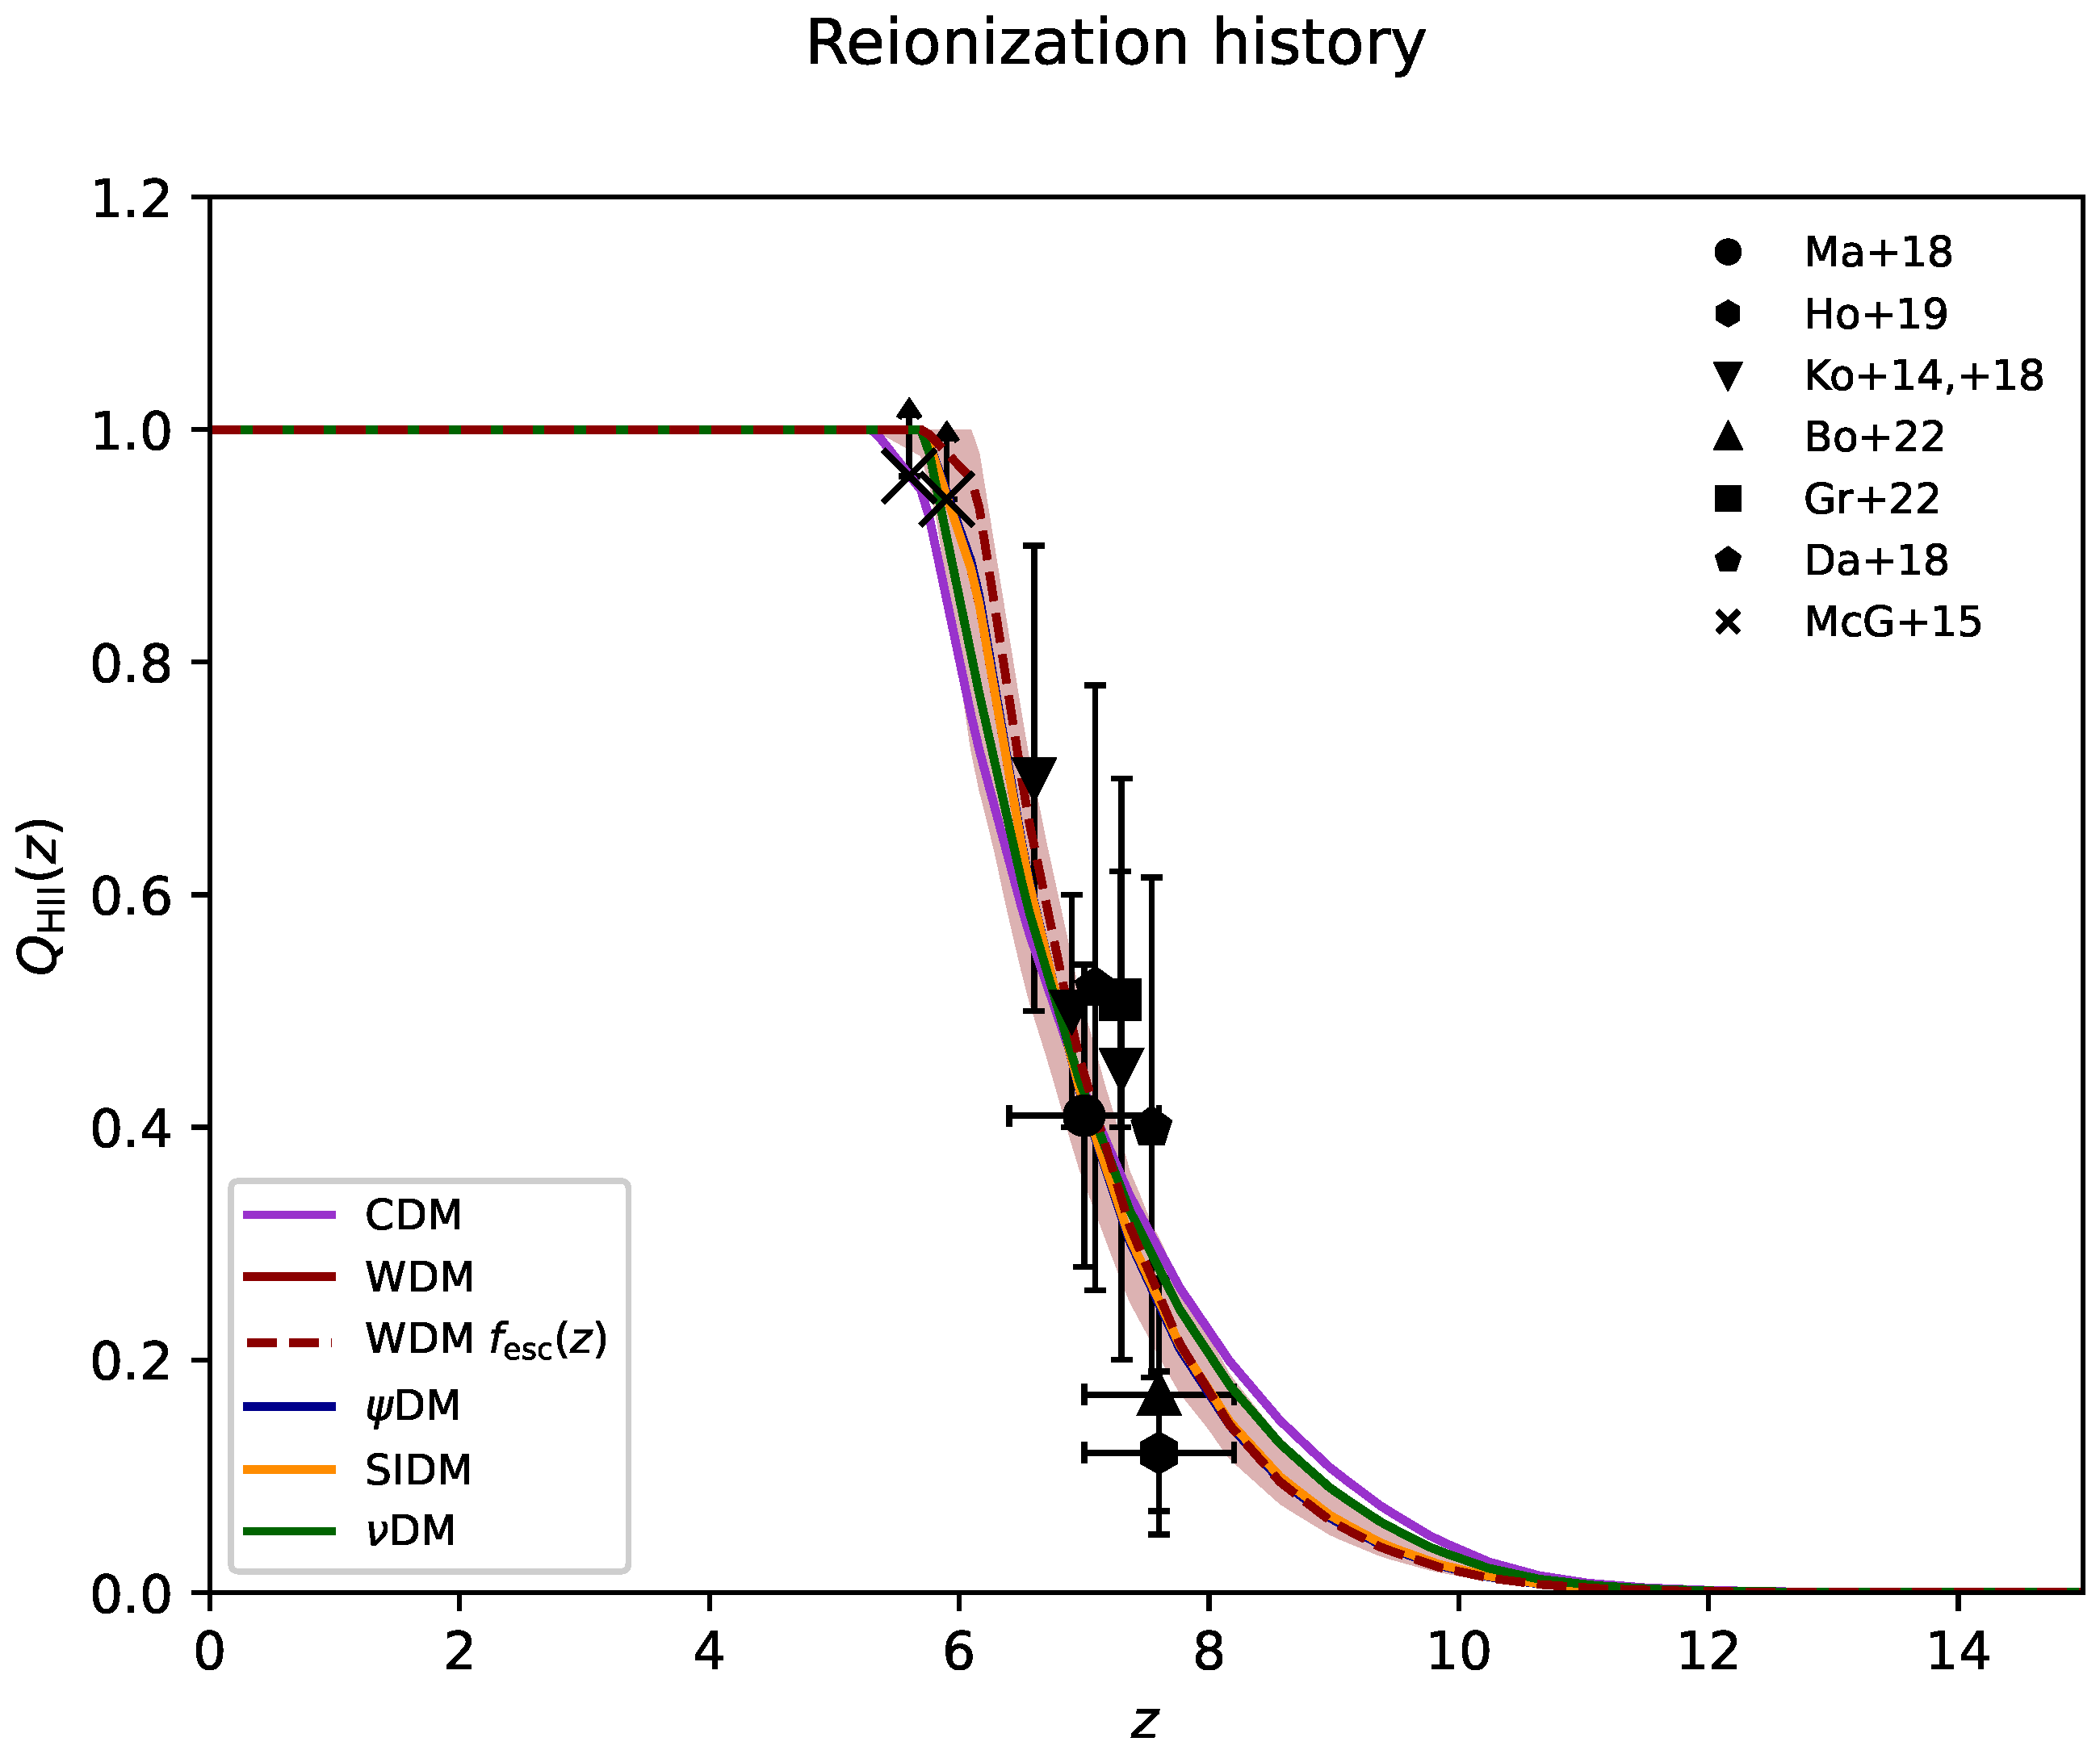
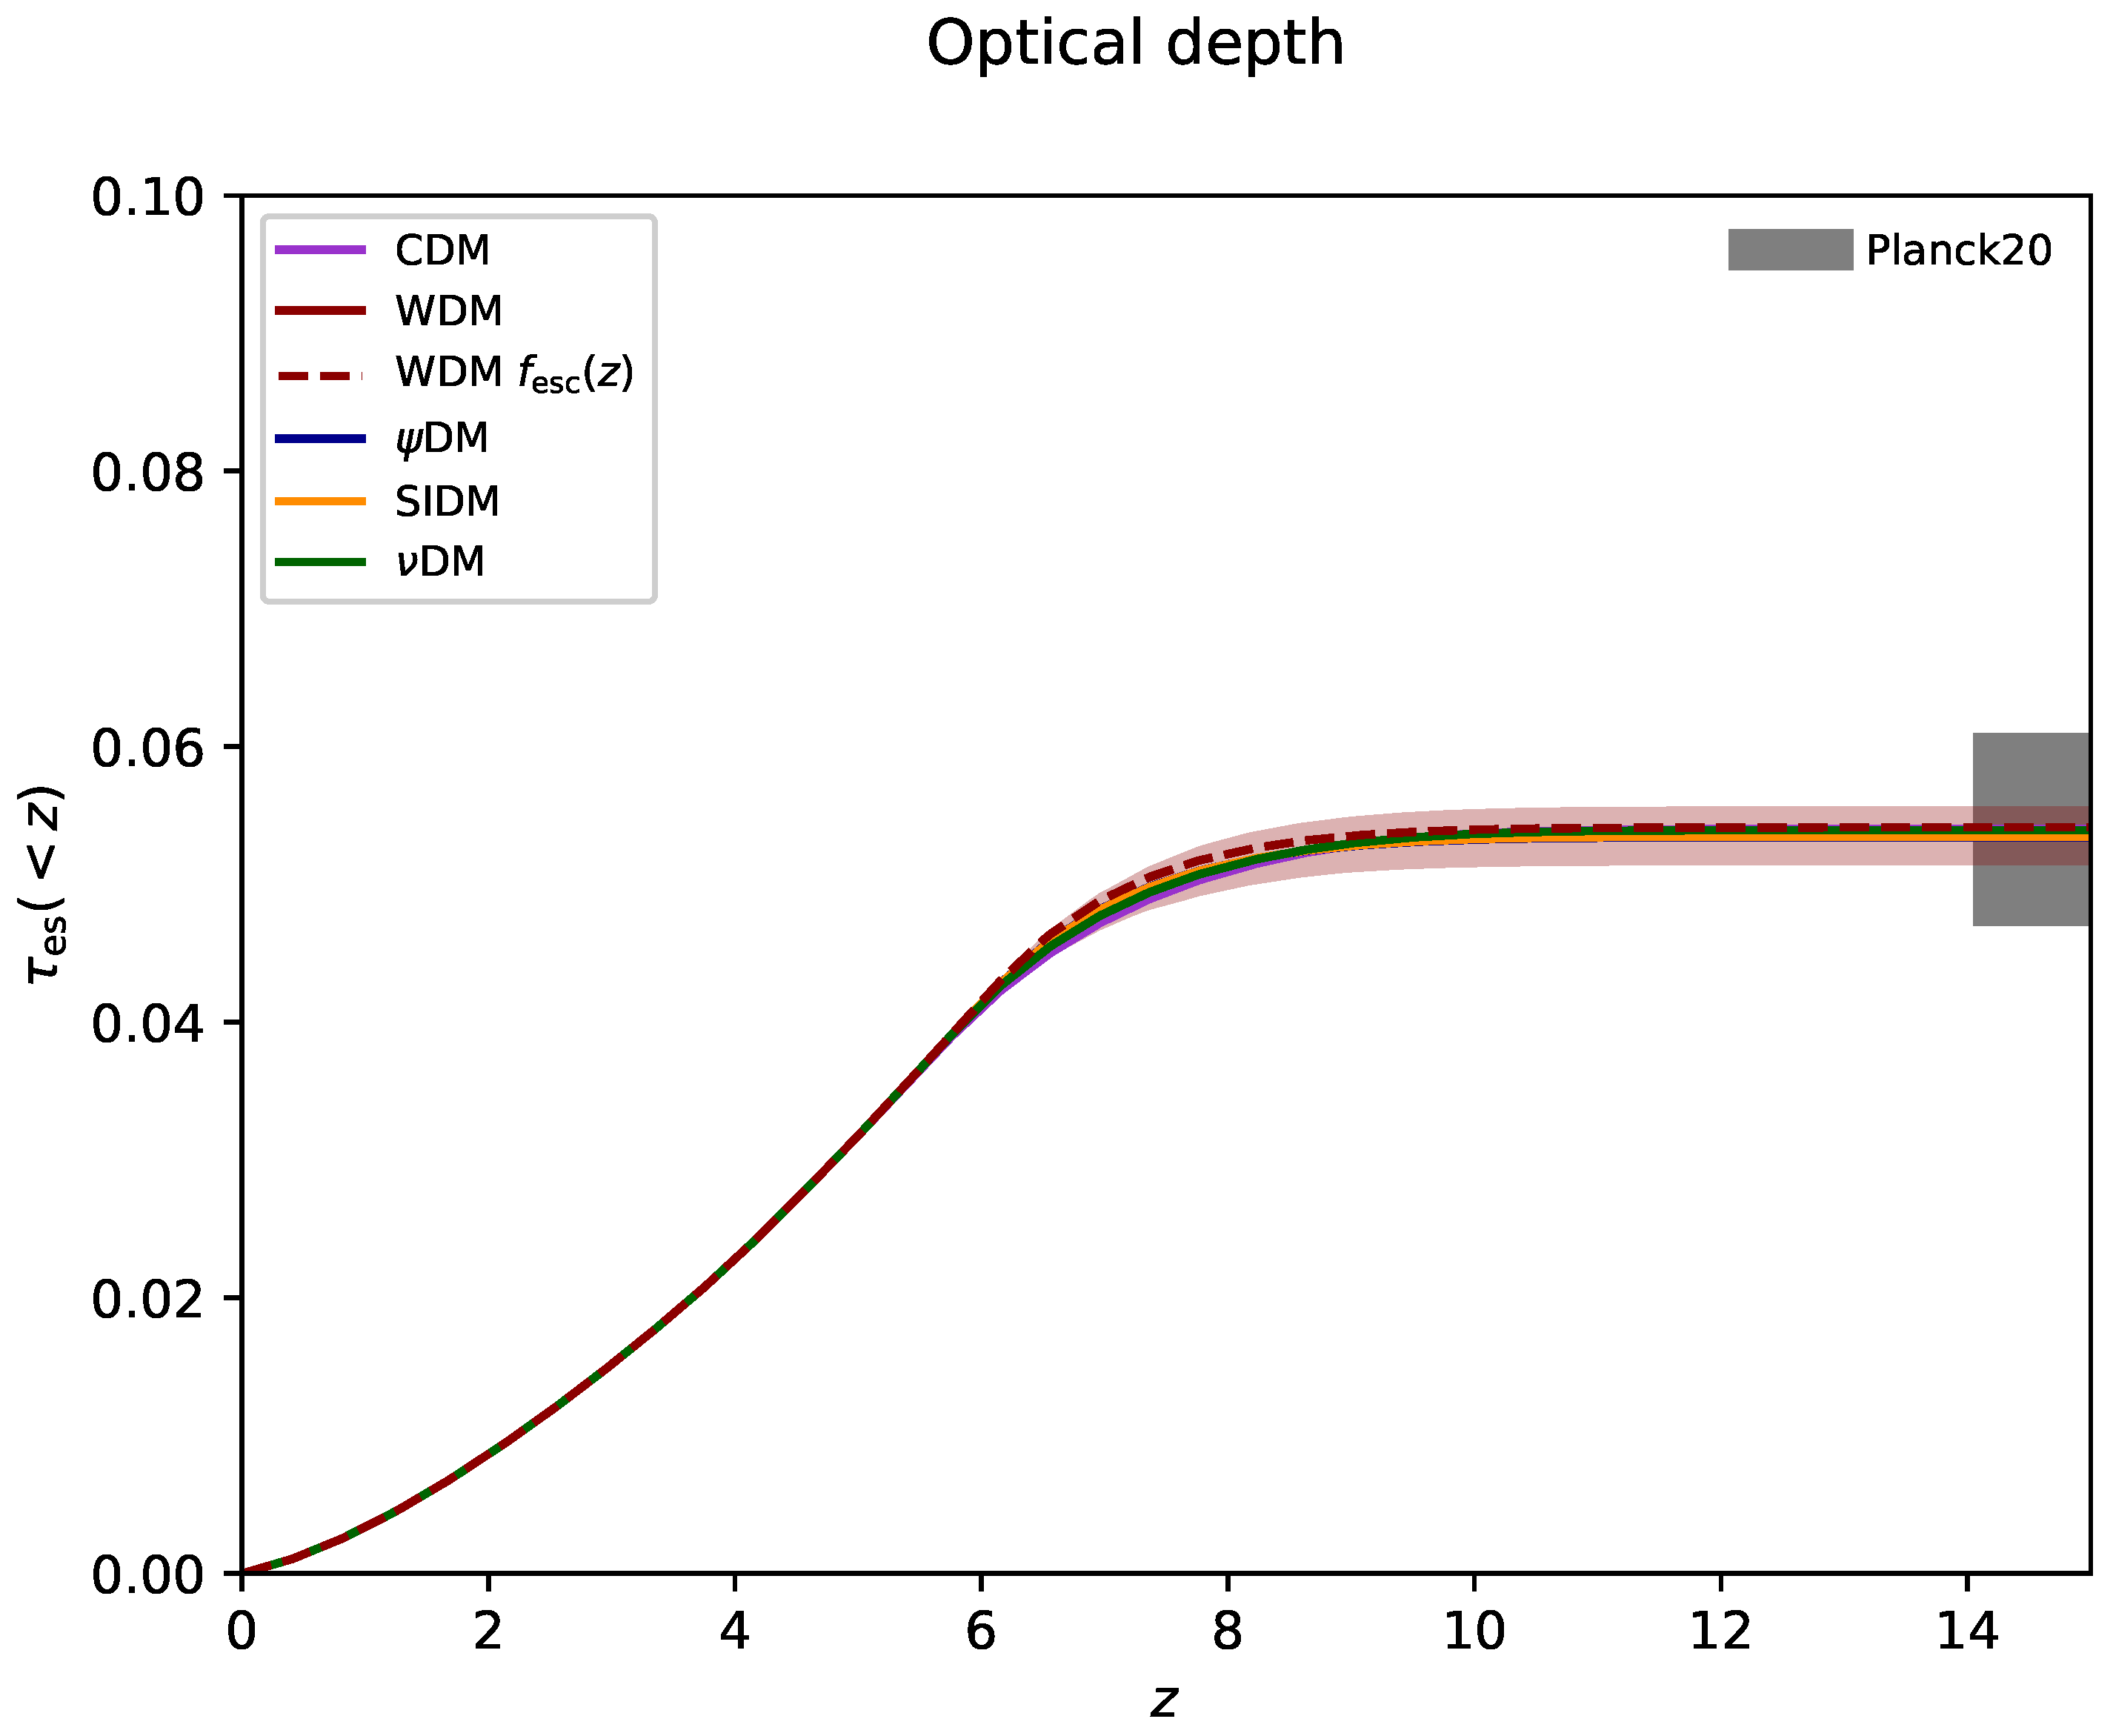
The marginalized posterior estimates in the different DM scenarios are summarized in Table 3. Moreover, we show in Figure 10, Figure 11, Figure 12 and Figure 13 the behavior of our best-fit models on various observables, which include the cosmic SFR density, the ionizing photon rate (the contribution of AGNs, illustrated in the inset, is shown to be minor for z 6 and subdominant at lower redshift), the volume filling factor of ionized hydrogen and the electron scattering optical depth. Note that the cosmic SFR rate density has not been exploited in building up the likelihood in Section 2.3 and thus it has not been fitted upon. In fact, our best-fit models refer to the cosmic SFR rate density when the UV luminosity function is integrated down to a magnitude M UV lim , which may be appreciably fainter than the values corresponding to the observational determinations (e.g., the ones based on current UV data refer to a limit M UV 17 ). Nevertheless, it is remarkable that our best-fit models turn out to be consistent with the available observational constraints on the cosmic SFR density from GRBs by [132], CII by [133], UV+FIR by [134], and (sub)mm by [135], at least for z 8 . On the other hand, we stress that the predictions on the cosmic SFR density for the non-standard DM scenarios tend to significantly deviate with respect to that of CDM as soon as the redshift increases much beyond z 8 . Therefore, upcoming precision determinations of the cosmic SFR at z 10 , as recently attempted with early JWST data by [136], could provide relevant additional constraints on the DM scenario.
As for the reionization observables N ˙ ion , Q HII and τ es , it is worth stressing that all our best-fit models perform comparably well in reproducing the available data. This is also highlighted by the 2 σ credible interval from sampling the posterior distribution, which is shown only in the WDM case for clarity (red shaded area). In terms of projection on these observables, the different DM scenarios are consistent with each other, approximately within 2 σ , while they differ appreciably from the standard CDM case. In the same vein, we can also attempt a model comparison via the Bayes information criterion [137] defined as BIC 2 ln L max + N par ln N data in terms of the maximum likelihood estimate L max , of the number of parameters N par , and the number of data points N data . The BIC comes from approximating the Bayes factor, which gives the posterior odds of one model against another, presuming that the models are equally favored a priori. Note that what matters is the relative value of the BIC among different models; in particular, a difference of around ten or more indicates evidence in favor of the model with the smaller value. The values of the BIC (for the different DM scenarios) are reported in Table 3. Taken at face value, the BIC suggests evidence in favor of the scenarios alternative to CDM, though it is risky to recognize a preference among them.
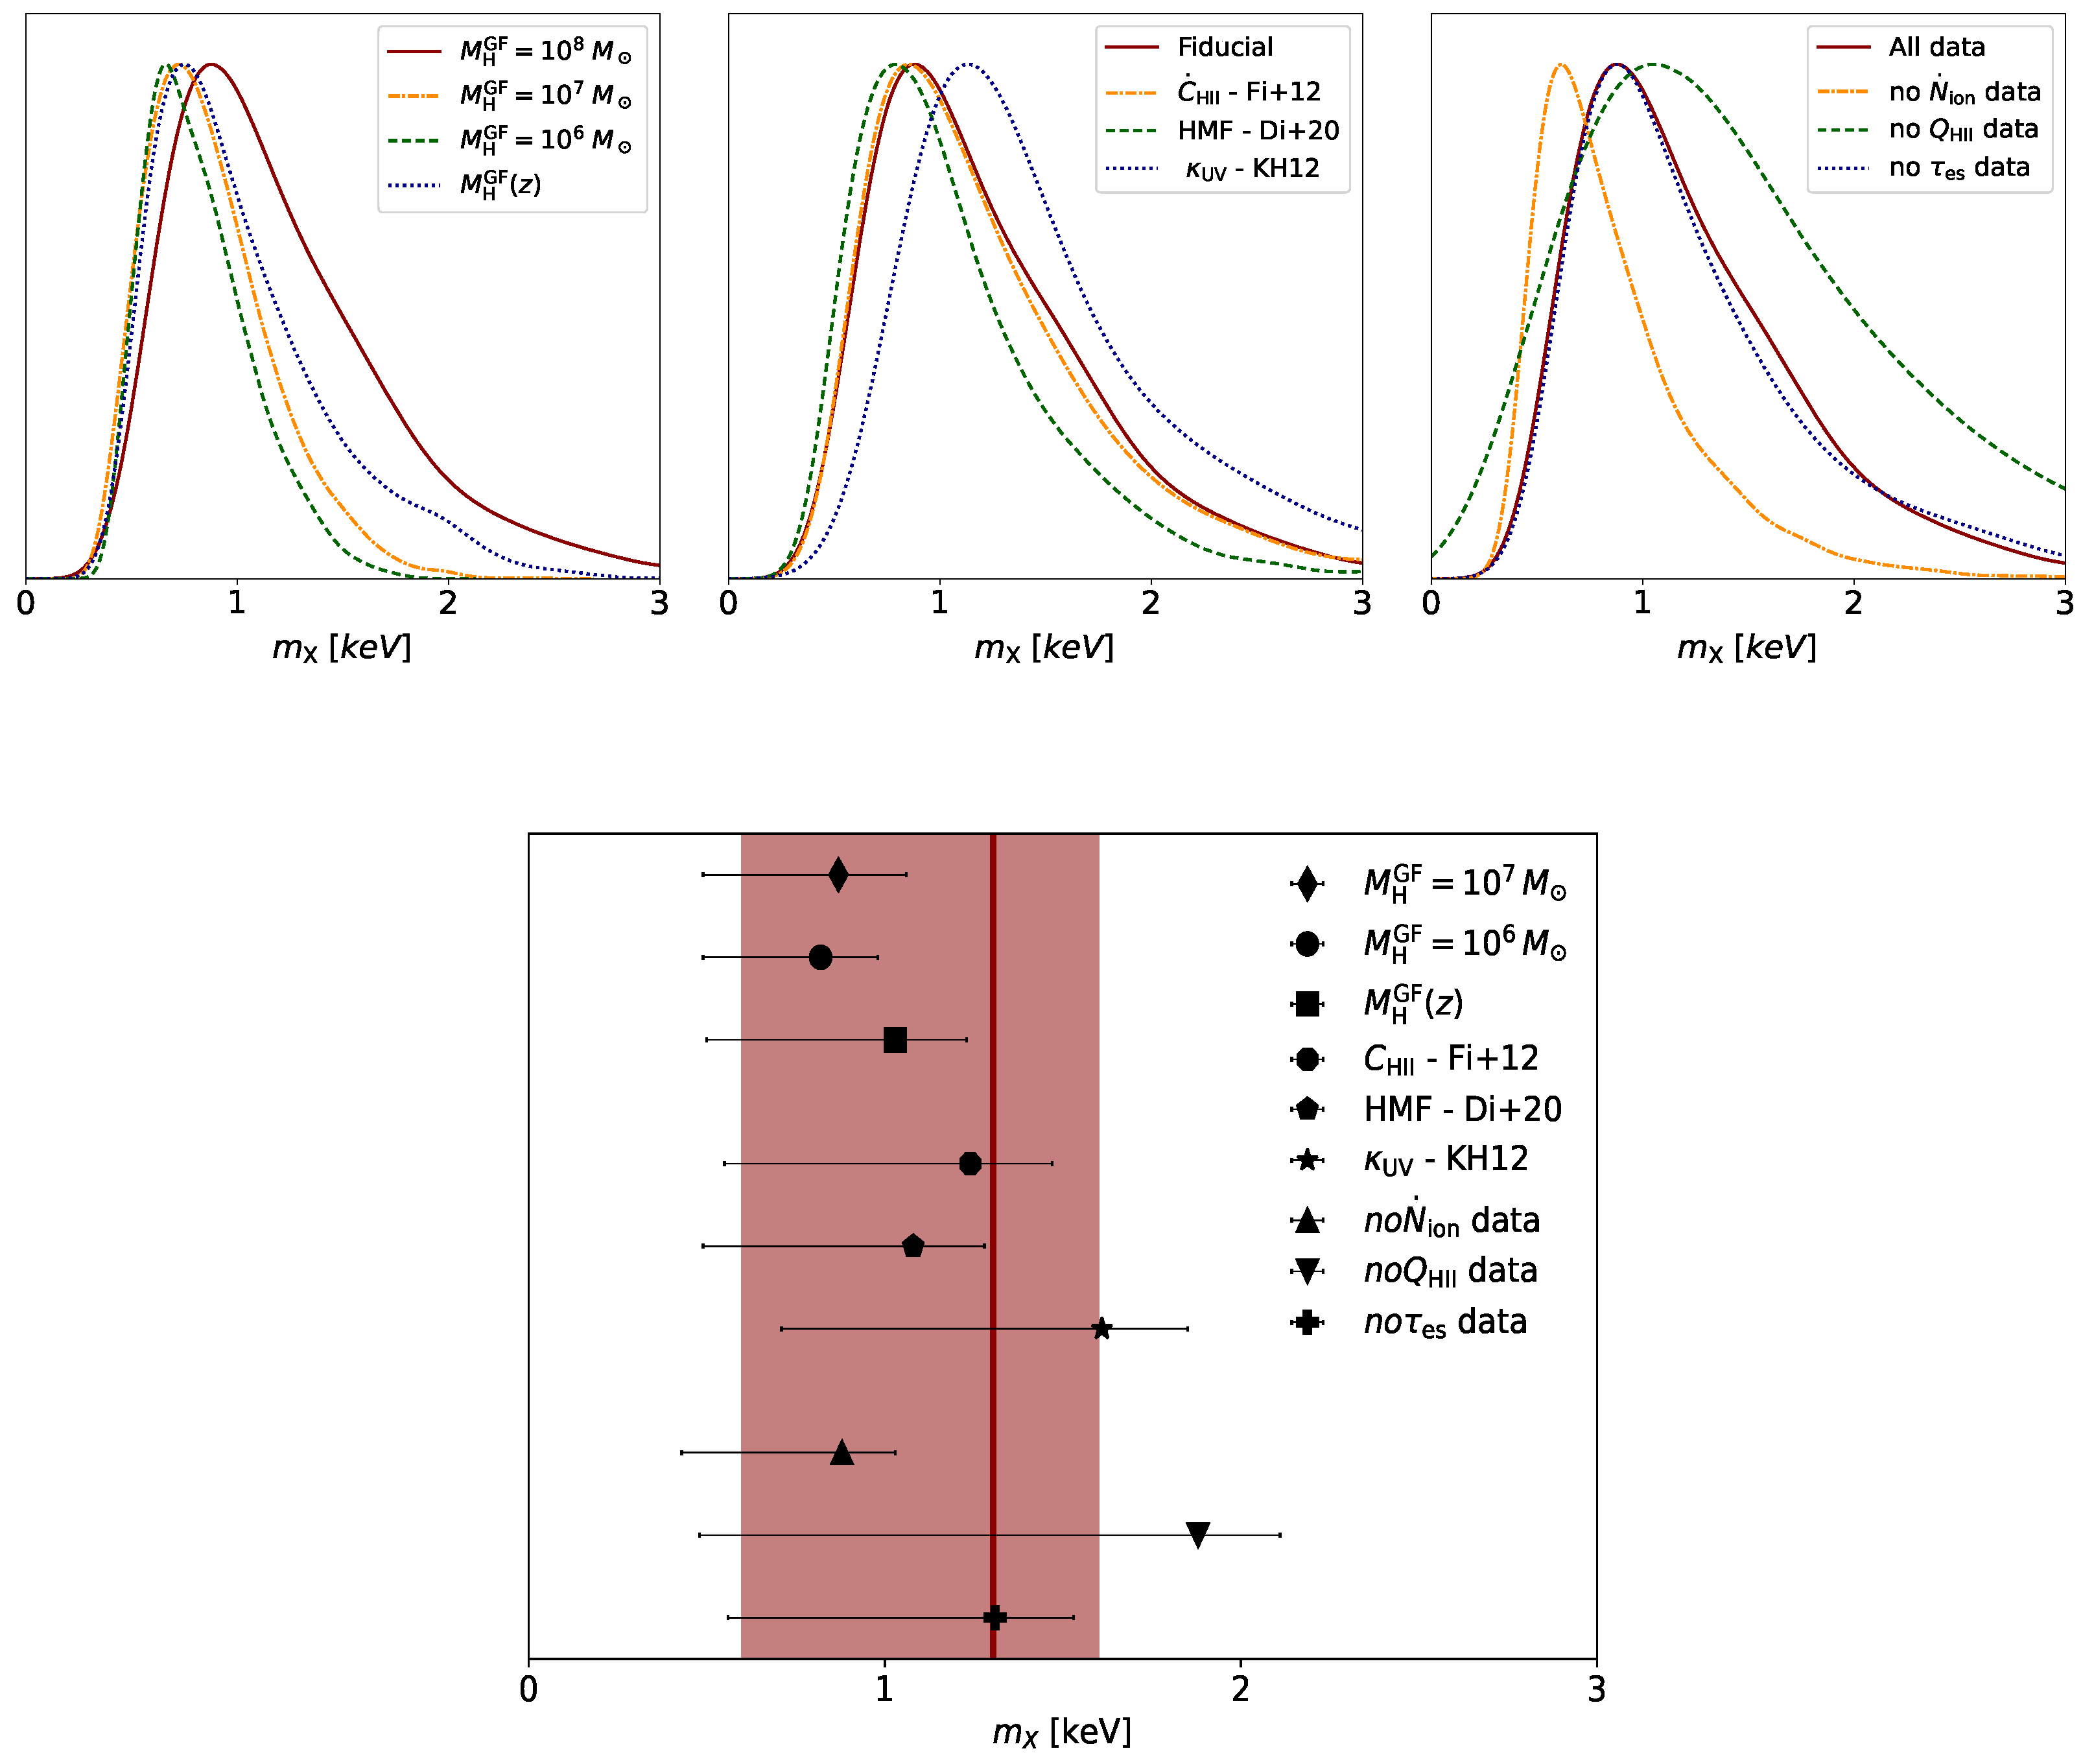
Finally, to test the robustness of our astroparticle posterior estimates, we vary some of the assumptions made in our fiducial setup above, focusing on the WDM scenario for definiteness; the impact on the marginalized distribution of the DM particles’ mass m X is shown in Figure 14. In the top left panel, we change the threshold halo mass M H GF of galaxy formation; instead of our fiducial value 10 8 M (red solid), we try with 10 7 M (dot–dashed yellow), 10 6 M (dashed green), and with the redshift-dependent atomic cooling limit log M H GF ( z ) [ M ] 8.41 0.092 × ( z 4 ) + 0.0023 × ( z 4 ) 2 (dotted blue; see [78,138]). Such smaller values of M H GF could be possibly associated with star formation in mini halos, although typically this occurs at redshifts z 15 20 higher than those considered here when setting the galaxy formation constraint. The net effect of a smaller M H GF is to narrow somewhat the high-mass tail of the marginalized distribution and to shift its maximum toward slightly smaller values; the overall constraints on m X are not appreciably altered, since it can be seen from Figure 3 that for m X keV the magnitude values corresponding to a given halo mass are very similar in the range M H 10 6 8 M .
In the top middle panel of Figure 14, we explore the variations of other auxiliary quantities: clumping factor C HII entering the recombination timescale in Equation (4); CDM halo mass function entering in Equation (6); parameter κ UV determining the relation between UV luminosity and SFR (see Section 2.1). It is beyond the scope of the paper to investigate all of the possible variations of these quantities in a systematic way, so we just focus on other choices often exploited in the literature. Specifically, with respect to our fiducial cases (red solid) we try the following: instead of the clumping factor2 by [103,104], we used that by [140] (dot–dashed yellow); instead of the halo mass function from [106], we used that by [141] (dashed green); instead of our fiducial value, we used that by [74] for solar metallicity (dotted blue). Overall, the constraints on m X are not substantially affected by these variations.
In the top right panel of Figure 14, we check the dependence of our results on the set of data used to construct the likelihood in Section 2.3 and Table 2; in particular, with respect to our fiducial case (solid red) we remove one-by-one the constraints from the cosmic ionization rate N ˙ ion (dot–dashed yellow), from the evolution of the ionized fraction Q HII (dashed green) and from the optical depth τ es (dotted blue). Not surprisingly, the most stringent constraints on m X come from the data on the redshift evolution of Q HII , in absence of which the marginalized distribution would considerably widen. The data on Q HII tend to prefer slightly lower values of m X , while those on N ˙ ion tend to prefer slightly higher values; interestingly, the combinations of these datasets produce a marginalized distribution consistent with the constraints from the latest measurements of the optical depth τ es .
In the bottom panel of Figure 14, we present a summary plot showing the mean and the 1 σ dispersion of the posterior distributions from the top panels (as labeled in the legend). It is seen that the outcome of our fiducial setup (illustrated by the red vertical line and shaded area) is quite robust against all the different variations in the parameters and assumptions considered above.

4. Summary and Outlook

In this work, we derived astroparticle constraints for different dark matter scenarios alternative to standard cold dark matter (CDM): thermal relic warm dark matter, WDM; fuzzy dark matter, ψ DM; self-interacting dark matter, SIDM; sterile neutrino dark matter, ν DM. For this purpose, we relied on three main ingredients: updated determinations of the high-redshift UV luminosity functions for primordial galaxies out to redshift z 10 ; redshift-dependent halo mass functions in the above DM scenarios, as provided by state-of-the art numerical simulations; robust constraints on the reionization history of the Universe from recent astrophysical and cosmological datasets.
We built up an empirical model of cosmic reionization (see Section 2.1) characterized by two basic parameters: the escape fraction f esc of ionizing photons from primordial galaxies, and the limiting UV magnitude M UV lim down to which the extrapolated UV luminosity functions were steeply increasing. We performed standard abundance matching of the UV luminosity function and the halo mass function (see Section 2.2), obtaining a relationship between UV luminosity and halo mass whose shape depended on an astroparticle quantity X specific to each DM scenario. We exploited such a relation to introduce in the analysis a constraint from primordial galaxy formation, in terms of the threshold halo mass M H GF above which primordial galaxies could efficiently form stars. We performed Bayesian inference on the three parameters f esc , M UV lim , and X via an MCMC technique (see Section 2.3 and Figure 4, Figure 5, Figure 6, Figure 7, Figure 8 and Figure 9).
The marginalized posterior estimates are discussed in Section 3, and summarized in Table 3. As for the astroparticle property X, we found: WDM particle mass m X 1.3 0.7 + 0.3 keV, ψ DM particle mass m X 2.09 0.05 + 0.09 × 10 22 eV, SIDM temperature at kinetic decoupling T X 0.24 0.13 + 0.04 keV, and lepton asymmetry L X 10.7 1.4 + 1.4 for a sterile neutrino of mass m X 7 keV. A comparison with literature constraints from independent observations (see Figure 6) seems to challenge thermal WDM and ψ DM as viable alternatives to CDM, while there is more room for SIDM and ν DM. As for the astrophysical parameters, the values of the escape fraction f esc were found to vary from 0.05 to 0.15 , and those of the UV limiting magnitude ranged from 12 to 16 , depending on the DM scenario (see Table 3). We performed a model comparison among the different DM scenarios, both in terms of projection of our best-fit models on the reionization observables (see Figure 10, Figure 11, Figure 12 and Figure 13), and in terms of the Bayesian inference criterion; the latter indicates evidence in favor of non-CDM scenarios, though it is risky to identify a clear preference among them.
Finally, we investigated the robustness of the estimates on the astroparticle property X against educated variations of uncertain astrophysical quantities (e.g., clumping factor, halo mass function, UV luminosity to SFR conversion factor), of the galaxy formation threshold M H GF , and of the datasets exploited to construct the likelihood in our Bayesian analysis (see Figure 14).
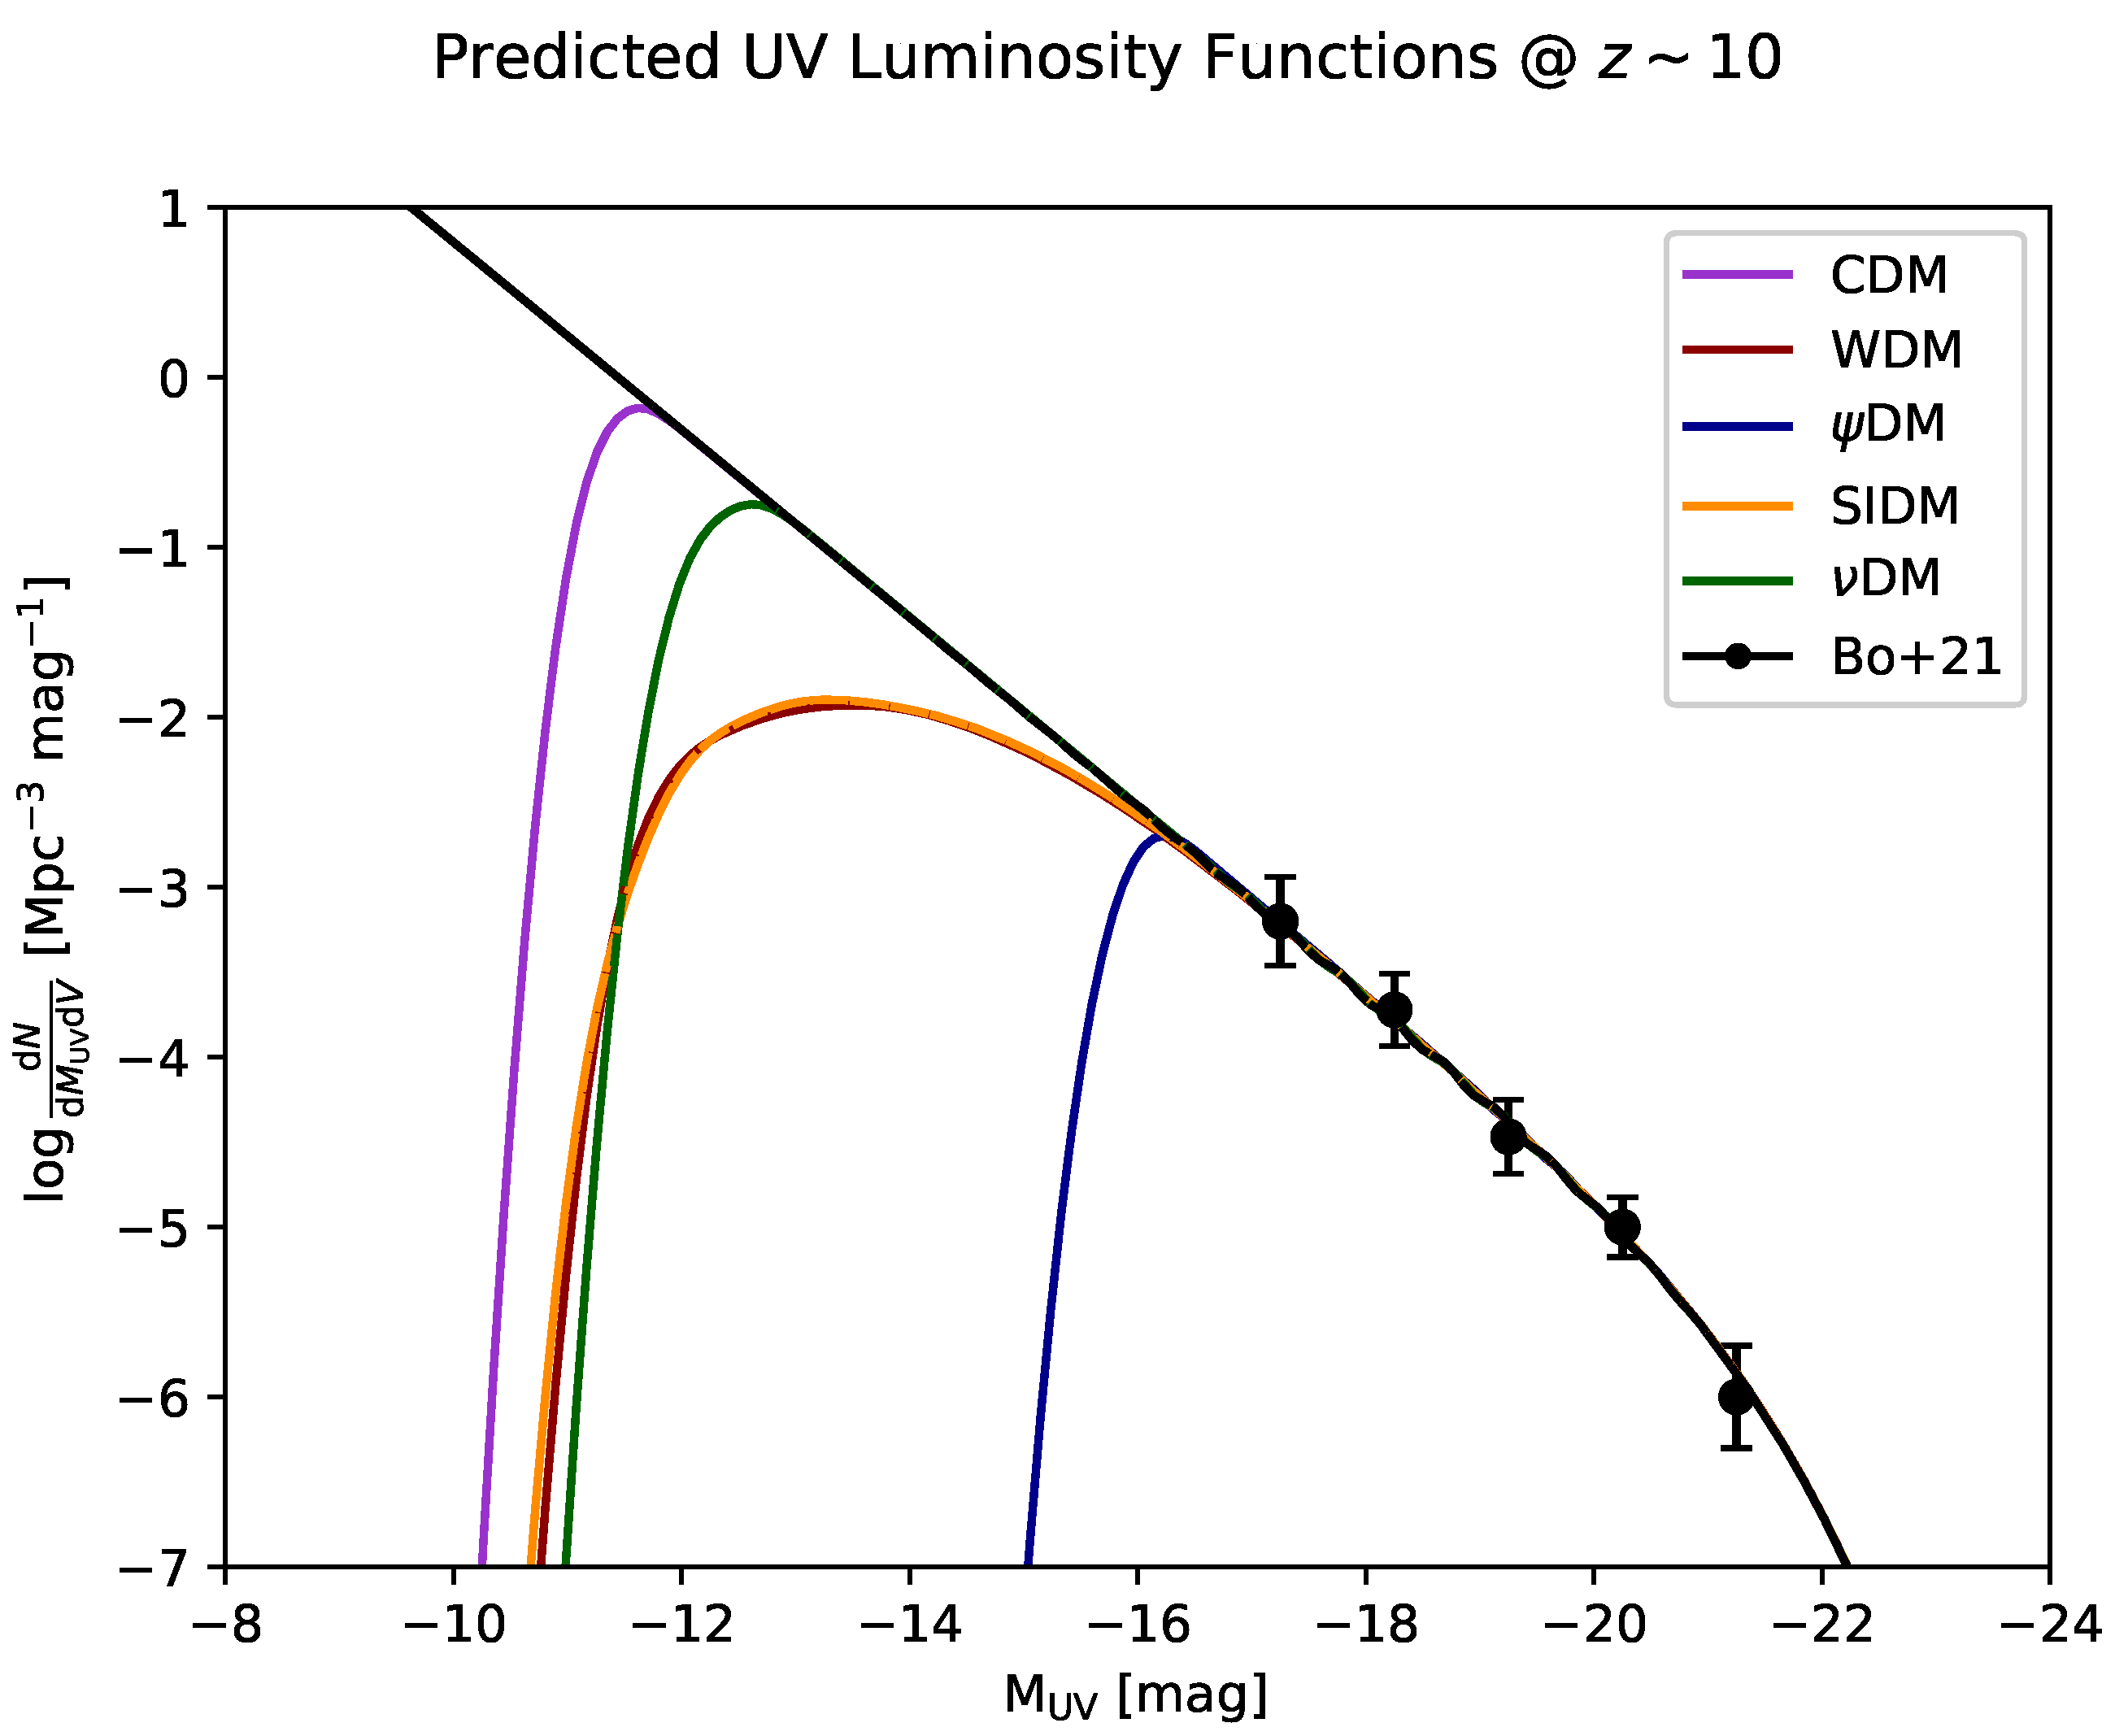
From a future perspective, it is worth highlighting the impacts of the different DM scenarios on the ultra-faint end of the UV luminosity function at high redshift (see also [55,142]). We can make specific predictions by reconstructing the luminosity function from the halo mass function via
d N d M UV d V = d X P ( X ) M H GF d M H d N X d M H d V δ D M UV M UV ( M H , z | X ) ;
where δ D [ · ] is a Dirac delta function centered on the inverse abundance matching relationship M UV ( M H , z | X ) , M H GF is the halo mass above which galaxy formation can take place, and P ( X ) is the marginalized posterior distribution of the astroparticle property X specific to each DM scenario. The outcome of this computation at z 10 is illustrated in Figure 15. We expect the luminosity function at the ultra-faint end to deviate from the steep behavior extrapolated from the currently observed magnitude range M UV 17 . The limiting magnitude at which the deviation occurs could be seen, and the shape of the luminosity function around that value crucially depends on the adopted DM scenario. Future observations conducted by the James Webb Space Telescope [48,143,144,145,146,147], possibly eased by gravitational lensing effects, could extend the observable magnitude range down to M UV 13 or fainter, thus providing valuable information on astroparticle physics and the astrophysics of primordial galaxy formation.

Author Contributions

Conceptualization: A.L. and L.D.; methodology: A.L. and T.R.; validation: A.L., L.B., N.K., F.S., C.B. and L.D.; writing: A.L. All authors have read and agreed to the published version of the manuscript.

Funding

A.L. acknowledges funding from the EU H2020-MSCA-ITN-2019 project 860744 BiD4BESt: Big Data applications for black hole Evolution STudies and from the PRIN MIUR 2017 prot. 20173ML3WW, Opening the ALMA window on the cosmic evolution of gas, stars, and supermassive black holes.

Institutional Review Board Statement

Not applicable.

Informed Consent Statement

Not applicable.

Data Availability Statement

Not applicable.

Acknowledgments

We thank the two anonymous referees for the constructive comments. We acknowledge G. Gandolfi and P. Salucci for the stimulating discussions.

Conflicts of Interest

The authors declare no conflict of interest.

Notes

1
Free-streaming is the process through which small-scale perturbations can be erased if particles with residual thermal velocities diffuse out of them before collapse.
2
Note that the clumping factor may actually depend on cosmology itself; in particular, as shown by [44], based on the model by [139], for a WDM scenario in the relevant redshift range z 6 , the clumping factor tends to be slightly lower than our fiducial case by [103]. We checked that adopting such a cosmology-dependent clumping factor has a minor impact on the m X posterior.

References

  1. Meurer, G.R.; Heckman, T.M.; Calzetti, D. Shedding Light on Dark Matter at Colliders. Int. J. Mod. Phys. 2013, 28, 1330052. [Google Scholar]
  2. Kahlhoefer, F. Review of LHC dark matter searches. Int. J. Mod. Phys. 2017, 32, 1730006. [Google Scholar] [CrossRef]
  3. Argyropoulos, S.; Brandt, O.; Haisch, U. Collider Searches for Dark Matter through the Higgs Lens. Symmetry 2021, 13, 2406. [Google Scholar] [CrossRef]
  4. Aprile, E. et al. [XENON Collaboration] Dark Matter Search Results from a One Ton-Year Exposure of xenon1t. Phys. Rev. Lett. 2018, 121, 111302. [Google Scholar] [CrossRef]
  5. Bernabei, R.; Belli, P.; Caracciolo, V.; Cerulli, R.; Merlo, V.; Cappella, F.; D’Angelo, A.; Incicchitti, A.; di Marco, A.; Dai, C.J.; et al. DAMA/LIBRA-phase2 results and implications on several dark matter scenarios. Int. J. Mod. Phys. 2020, 35, 2044023. [Google Scholar] [CrossRef]
  6. Ackermann, M. et al. [The Fermi LAT Collaboration] Limits on dark matter annihilation signals from the Fermi LAT 4-year measurements of the isotropic gamma-ray background. J. Cosmol. Astropart. Phys. 2015, 2015, 008. [Google Scholar] [CrossRef]
  7. Ackermann, M. et al. [The Fermi LAT Collaboration] The Fermi Galactic Center GeV Excess and Implications for Dark Matter. Astrophys. J. 2017, 840, 43. [Google Scholar] [CrossRef]
  8. Albert, A. et al. [The Fermi-LAT and DES Collaborations] Searching for Dark Matter Annihilation in Recently Discovered Milky Way Satellites with Fermi-LAT. Astrophys. J. 2017, 834, 110. [Google Scholar] [CrossRef]
  9. Zornoza, J. Review on Indirect Dark Matter Searches with Neutrino Telescopes. Universe 2021, 7, 415. [Google Scholar] [CrossRef]
  10. Bertone, G.; Hooper, D. History of dark matter. Rev. Mod. Phys. 2018, 90, 045002. [Google Scholar] [CrossRef]
  11. Frenk, C.S.; White, S.D.M. Dark matter and cosmic structure. Ann. Phys. 2012, 524, 507–534. [Google Scholar] [CrossRef] [Green Version]
  12. Lapi, A.; Danese, L. A Stochastic Theory of the Hierarchical Clustering. I. Halo Mass Function. Astrophys. J. 2020, 903, 117. [Google Scholar] [CrossRef]
  13. Aghanim, M. et al. [Planck Collaboration] Planck 2018 results. VI. Cosmological parameters. Astron. Astrophys. 2020, 641, A6. [Google Scholar] [CrossRef]
  14. Navarro, J.F.; Frenk, C.S.; White, S.D.M. A Universal Density Profile from Hierarchical Clustering. Astrophys. J. 1997, 490, 493. [Google Scholar] [CrossRef]
  15. de Blok, W.J.G.; Walter, F.; Brinks, E.; Trachternach, C.; Oh, S.-H.; Kennicutt, R.C., Jr. High-Resolution Rotation Curves and Galaxy Mass Models from THINGS. Astron. J. 2008, 136, 2648. [Google Scholar] [CrossRef]
  16. Boylan-Kolchin, M.; Bullock, J.S.; Kaplinghat, M. The Milky Way’s bright satellites as an apparent failure of LambdaCDM. Mon. Not. R. Astron. Soc. 2012, 422, 1203–1218. [Google Scholar] [CrossRef]
  17. Bullock, J.S.; Boylan-Kolchin, M. Small-Scale Challenges to the ΛCDM Paradigm. Annu. Rev. Astron. Astrophys. 2017, 55, 343–387. [Google Scholar] [CrossRef]
  18. Gentile, G.; Famaey, B.; Zhao, H.; Salucci, P. Universality of galactic surface densities within one dark halo scale-length. Nature 2009, 461, 627–628. [Google Scholar] [CrossRef]
  19. McGaugh, S.S.; Lelli, F.; Schombert, J.M. Radial Acceleration Relation in Rotationally Supported Galaxies. Phys. Rev. Lett. 2016, 117, 201101. [Google Scholar] [CrossRef]
  20. El-Zant, A.; Shlosman, I.; Hoffman, Y. Dark Halos: The flattening of the density cusp by dynamical friction. Astrophys. J. 2001, 560, 636. [Google Scholar] [CrossRef]
  21. Tonini, C.; Lapi, A.; Salucci, P. Angular Momentum Transfer in Dark Matter Halos: Erasing the Cusp. Astrophys. J. 2006, 649, 591. [Google Scholar] [CrossRef] [Green Version]
  22. Pontzen, A.; Governato, F. Cold dark matter heats up. Nature 2014, 506, 171–178. [Google Scholar] [CrossRef] [PubMed]
  23. Peirani, S.; Dubois, Y.; Volonteri, M.; Devriendt, J.; Bundy, K.; Silk, J.; Pichon, C.; Kaviraj, S.; Gavazzi, R.; Habouzit, M. Density profile of dark matter haloes and galaxies in the HORIZON-AGN simulation: The impact of AGN feedback. Mon. Not. R. Astron. Soc. 2017, 472, 2153–2169. [Google Scholar] [CrossRef]
  24. Freundlich, J.; Jiang, F.; Dekel, A.; Cornuault, N.; Ginzburg, O.; Koskas, R.; Lapiner, S.; Dutton, A.; Maccio, A.V. A model for core formation in dark matter haloes and ultra-diffuse galaxies by outflow episodes. Mon. Not. R. Astron. Soc. 2020, 491, 4523–4542. [Google Scholar] [CrossRef]
  25. Bertone, G.; Hooper, D.; Silk, J. Particle dark matter: Evidence, candidates and constraints. Phys. Rev. 2004, 405, 279–390. [Google Scholar] [CrossRef]
  26. Feng, J.L. Dark Matter Candidates from Particle Physics and Methods of Detection. Annu. Rev. Astron. Astrophys. 2010, 48, 495–545. [Google Scholar] [CrossRef]
  27. Salucci, P.; Esposito, G.; Lambiase, G.; Battista, E.; Benetti, M.; Bini, D.; Boco, L.; Sharma, G.; Bozza, V.; Buoninfante, L.; et al. Einstein, Planck and Vera Rubin: Relevant encounters between the Cosmological and the Quantum Worlds. Front. Phys. 2021, 8, 603190. [Google Scholar] [CrossRef]
  28. Bode, P.; Ostriker, J.P.; Turok, N. Halo Formation in Warm Dark Matter Models. Astrophys. J. 2001, 556, 93. [Google Scholar] [CrossRef]
  29. Viel, M.; Becker, G.; Bolton, J.S.; Haehnelt, M.G. Warm dark matter as a solution to the small scale crisis: New constraints from high redshift Lyman-alpha forest data. Phys. Rev. 2013, 88, 043502. [Google Scholar] [CrossRef]
  30. Lovell, M.R.; Frenk, C.S.; Eke, V.R.; Jenkins, A.; Gao, L.; Theuns, T. The properties of warm dark matter haloes. Mon. Not. R. Astron. Soc. 2014, 439, 300–317. [Google Scholar] [CrossRef]
  31. Hu, W.; Barkana, R.; Gruzinov, A. Fuzzy Cold Dark Matter: The Wave Properties of Ultralight Particles. Phys. Rev. Lett. 2000, 85, 1158. [Google Scholar] [CrossRef] [PubMed] [Green Version]
  32. Hui, L.; Ostriker, J.P.; Tremaine, S.; Witten, E. Ultralight scalars as cosmological dark matter. Phys. Rev. D 2017, 95, 043541. [Google Scholar] [CrossRef]
  33. Vogelsberger, M.; Zavala, J.; Cyr-Racine, F.-Y.; Pfrommer, C.; Bringmann, T.; Sigurdson, K. ETHOS—An effective theory of structure formation: Dark matter physics as a possible explanation of the small-scale CDM problems. Mon. Not. R. Astron. Soc. 2016, 460, 1399–1416. [Google Scholar] [CrossRef]
  34. Tulin, S.; Yu, H.-B. Dark Matter Self-interactions and Small Scale Structure. Phys. Rep. 2018, 730, 1–57. [Google Scholar] [CrossRef]
  35. Huo, R.; Kaplinghat, M.; Pan, Z.; Yu, H.-B. Signatures of self-interacting dark matter in the matter power spectrum and the CMB. Phys. Lett. B 2018, 783, 76–81. [Google Scholar] [CrossRef]
  36. Seljak, U.; Makarov, A.; McDonald, P.; Trac, H. Can Sterile Neutrinos Be the Dark Matter? Phys. Rev. Lett. 2006, 97, 191303. [Google Scholar] [CrossRef]
  37. Kusenko, A. Sterile neutrinos: The dark side of the light fermions. Phys. Rev. 2009, 481, 1–28. [Google Scholar] [CrossRef]
  38. Adhikari, R.; Agostini, M.; Ky, N.A.; Araki, T.; Archidiacono, M.; Bahr, M.; Baur, J.; Behrens, J.; Bezrukov, F.; Bhupal Dev, P.S.; et al. A White Paper on keV sterile neutrino Dark Matter. J. Cosmol. Astropart. Phys. 2017, 1, 025. [Google Scholar] [CrossRef]
  39. Schneider, A.; Smith, R.E.; Reed, D. Halo mass function and the free streaming scale. Mon. Not. R. Astron. Soc. 2013, 433, 1573–1587. [Google Scholar] [CrossRef]
  40. Dayal, P.; Mesinger, A.; Pacucci, F. Early Galaxy Formation in Warm Dark Matter Cosmologies. Astrophys. J. 2015, 806, 67. [Google Scholar] [CrossRef]
  41. Schive, H.-Y.; Chiueh, T.; Broadhurst, T.; Huang, K.-W. Contrasting Galaxy Formation from Quantum Wave Dark Matter, ψDM, with ΛCDM, using Planck and Hubble Data. Astrophys. J. 2016, 818, 89. [Google Scholar] [CrossRef] [Green Version]
  42. Menci, N.; Grazian, A.; Lamastra, A.; Calura, F.; Castellano, M.; Santini, P. Galaxy Formation in Sterile Neutrino Dark Matter Models. Astrophys. J. 2018, 854, 1. [Google Scholar] [CrossRef]
  43. Lovell, M.R. Toward a General Parameterization of the Warm Dark Matter Halo Mass Function. Astrophys. J. 2020, 847, 147. [Google Scholar] [CrossRef]
  44. Romanello, M.; Menci, N.; Castellano, M. The Epoch of Reionization in Warm Dark Matter Scenarios. Universe 2021, 7, 365. [Google Scholar] [CrossRef]
  45. Kulkarni, M.; Ostriker, J.P. What is the halo mass function in a fuzzy dark matter cosmology? Mon. Not. R. Astron. Soc. 2022, 510, 1425–1430. [Google Scholar] [CrossRef]
  46. Irsic, V. New constraints on the free-streaming of warm dark matter from intermediate and small scale Lyman-α forest data. Phys. Rev. 2017, 96, 023522. [Google Scholar]
  47. Irsic, V. First Constraints on Fuzzy Dark Matter from Lyman-α Forest Data and Hydrodynamical Simulations. Phys. Rev. Lett. 2017, 119, 031302. [Google Scholar] [CrossRef]
  48. Pacucci, F.; Mesinger, A.; Haiman, Z. Focusing on Warm Dark Matter with Lensed High-redshift Galaxies. Mon. Not. R. Astron. Soc. 2013, 435, L53. [Google Scholar] [CrossRef]
  49. Menci, N.; Grazian, A.; Castellano, M.; Sanchez, N.G. A Stringent Limit on the Warm Dark Matter Particle Masses from the Abundance of z=6 Galaxies in the Hubble Frontier Fields. Astrophys. J. 2016, 825, L1. [Google Scholar] [CrossRef]
  50. Shirasaki, M.; Ishiyama, T.; Ando, S. Virial Halo Mass Function in the Planck Cosmology. Astrophys. J. 2021, 922, 89. [Google Scholar] [CrossRef]
  51. Sabti, N.; Munoz, J.B.; Blas, D. New Roads to the Small-scale Universe: Measurements of the Clustering of Matter with the High-redshift UV Galaxy Luminosity Function. Astrophys. J. 2022, 928, L20. [Google Scholar] [CrossRef]
  52. De Souza, R.S.; Mesinger, A.; Ferrara, A.; Haiman, Z.; Perna, R.; Yoshida, N. Constraints on Warm Dark Matter models from high-redshift long gamma-ray bursts. Mon. Not. R. Astron. Soc. 2012, 432, 3218–3227. [Google Scholar] [CrossRef] [Green Version]
  53. Lapi, A.; Mancuso, C.; Celotti, A.; Danese, L. Galaxy Evolution at High Redshift: Obscured Star Formation, GRB Rates, Cosmic Reionization, and Missing Satellites. Astrophys. J. 2017, 835, 37. [Google Scholar] [CrossRef]
  54. Barkana, R.; Haiman, Z.; Ostriker, J.P. Constraints on Warm Dark Matter from Cosmological Reionization. Astrophys. J. 2001, 558, 482. [Google Scholar] [CrossRef]
  55. Lapi, A.; Danese, L. Cold or warm? Constraining dark matter with primeval galaxies and cosmic reionization after Planck. J. Cosmol. Astropart. Phys. 2015, 2015, 003. [Google Scholar] [CrossRef]
  56. Dayal, P.; Choudhury, T.R.; Bromm, V.; Pacucci, F. Reionization and Galaxy Formation in Warm Dark Matter Cosmologies. Astrophys. J. 2017, 836, 16. [Google Scholar] [CrossRef]
  57. Carucci, I.P.; Corasaniti, P. Cosmic Reionization History and Dark Matter Scenarios. Phys. Rev. D 2019, 99, 023518. [Google Scholar] [CrossRef]
  58. Carucci, I.P.; Villaescusa-Navarro, F.; Viel, M.; Lapi, A. Warm dark matter signatures on the 21cm power spectrum: Intensity mapping forecasts for SKA. J. Cosmol. Astropart. Phys. 2015, 2015, 047. [Google Scholar] [CrossRef]
  59. Boyarsky, A.; Drewes, M.; Lasserre, T.; Mertens, S.; Ruchayskiy, O. Sterile neutrino Dark Matter. Prog. Part. Nucl. Phys. 2019, 104, 1–45. [Google Scholar] [CrossRef]
  60. Chatterjee, A.; Dayal, P.; Choudhury, T.R.; Hutter, A. Ruling out 3 keV warm dark matter using 21 cm EDGES data. Mon. Not. R. Astron. Soc. 2019, 487, 3560–3567. [Google Scholar] [CrossRef]
  61. Rudakovskyi, A.; Savchenko, D.; Tsizh, M. Can EDGES observation favour any dark matter model? Mon. Not. R. Astron. Soc. 2020, 497, 3393–3399. [Google Scholar]
  62. Bringmann, T.; Kahlhoefer, F.; Schmidt-Hoberg, K.; Walia, P. Strong Constraints on Self-Interacting Dark Matter with Light Mediators. Phys. Rev. Lett. 2017, 118, 141802. [Google Scholar] [CrossRef]
  63. Grand, R.J.J.; White, S.D.M. Dark matter annihilation and the Galactic Centre Excess. Mon. Not. R. Astron. Soc. 2022, 511, L55. [Google Scholar] [CrossRef]
  64. Weisz, D.R.; Johnson, B.D.; Conroy, C. The Very Faint End of the UV Luminosity Function over Cosmic Time: Constraints from the Local Group Fossil Record. Astrophys. J. 2014, 794, L3. [Google Scholar] [CrossRef]
  65. Weisz, D.R.; Boylan-Kolchin, M. Local Group ultra-faint dwarf galaxies in the reionization era. Mon. Not. R. Astron. Soc. 2017, 469, L83–L88. [Google Scholar] [CrossRef]
  66. Kennedy, R.; Frenk, C.; Cole, S.; Benson, A. Constraining the warm dark matter particle mass with Milky Way satellites. Mon. Not. R. Astron. Soc. 2014, 442, 2487–2495. [Google Scholar] [CrossRef]
  67. Nadler, E.O.; Birrer, S.; Gilman, D.; Wechsler, R.H.; Du, X.; Benson, A.; Nierenberg, A.M.; Treu, T. Dark Matter Constraints from a Unified Analysis of Strong Gravitational Lenses and Milky Way Satellite Galaxies. Astrophys. J. 2021, 917, 7. [Google Scholar] [CrossRef]
  68. Newton, O.; Leo, M.; Cautun, M.; Jenkins, A.; Frenk, C.S.; Lovell, M.R.; Helly, J.C.; Benson, A.J.; Cole, S. Constraints on the properties of warm dark matter using the satellite galaxies of the Milky Way. J. Cosmol. Astropart. Phys. 2021, 2021, 062. [Google Scholar] [CrossRef]
  69. Chabrier, G. Galactic Stellar and Substellar Initial Mass Function. Publ. Astron. Soc. Pacific 2003, 115, 763. [Google Scholar] [CrossRef]
  70. Bouwens, R.J.; Oesch, P.A.; Stefanon, M.; Illingworth, G.; Labbé, I.; Reddy, N.; Atek, H.; Montes, M.; Naidu, R.; Nanayakkara, T.; et al. New Determinations of the UV Luminosity Functions from z∼9 to 2 Show a Remarkable Consistency with Halo Growth and a Constant Star Formation Efficiency. Astron. J. 2021, 162, 47. [Google Scholar] [CrossRef]
  71. Oesch, P.A.; Bouwens, R.J.; Illingworth, G.D.; Labbé, I.; Stefanon, M. The Dearth of z∼10 Galaxies in All HST Legacy Fields—The Rapid Evolution of the Galaxy Population in the First 500 Myr. Astrophys. J. 2018, 855, 105. [Google Scholar] [CrossRef]
  72. Meurer, G.R.; Heckman, T.M.; Calzetti, D. Dust Absorption and the Ultraviolet Luminosity Density at z∼3 as Calibrated by Local Starburst Galaxies. Astrophys. J. 1999, 521, 64. [Google Scholar] [CrossRef]
  73. Bouwens, R.J.; Illingworth, G.D.; Oesch, P.A. UV-continuum slopes of >4000 z∼4-8 galaxies from the HUDF/XDF, HUDF09, ERS, CANDELS-South, and CANDELS-North fields. Astrophys. J. 2014, 793, 115. [Google Scholar] [CrossRef] [Green Version]
  74. Kennicutt, R.C.; Evans, N.J. Star Formation in the Milky Way and Nearby Galaxies. Annu. Rev. Astron. Astrophys. 2012, 50, 531–608. [Google Scholar] [CrossRef]
  75. Madau, P.; Dickinson, M. Cosmic Star-Formation History. Annu. Rev. Astron. Astrophys. 2014, 52, 415. [Google Scholar] [CrossRef]
  76. Cai, Z.; Lapi, A.; Bressan, A.; De Zotti, G.; Negrello, M.; Danese, L. A Physical Model for the Evolving Ultraviolet Luminosity Function of High Redshift Galaxies and their Contribution to the Cosmic Reionization. Astrophys. J. 2014, 785, 65. [Google Scholar] [CrossRef]
  77. Robertson, B.E.; Ellis, R.S.; Furlanetto, S.R.; Dunlop, J.S. Cosmic reionization and early star-forming galaxies: A joint analysis of new constraints from Planck and Hubble Space Telescope. Astrophys. J. 2015, 802, L19. [Google Scholar] [CrossRef]
  78. Finkelstein, S.L.; D’Aloisio, A.; Paardekooper, J.-P.; Ryan, R., Jr.; Behroozi, P.; Finlator, K.; Livermore, R.; Upton Sanderbeck, P.R.; Dalla Vecchia, C.; Khochfar, S. Conditions for Reionizing the Universe with a Low Galaxy Ionizing Photon Escape Fraction. Astrophys. J. 2019, 879, 36. [Google Scholar] [CrossRef]
  79. Bose, S.; Deason, A.J.; Frenk, C.S. The Imprint of Cosmic Reionization on the Luminosity Function of Galaxies. Astrophys. J. 2018, 863, 123. [Google Scholar] [CrossRef]
  80. Munoz, J.B.; Qin, Y.; Mesinger, A.; Murray, S.G.; Greig, B.; Mason, C. The impact of the first galaxies on cosmic dawn and reionization. Mon. Not. R. Astron. Soc. 2022, 511, 3657–3681. [Google Scholar] [CrossRef]
  81. Mao, J.; Lapi, A.; Granato, G.L.; de Zotti, G.; Danese, L. The Role of the Dust in Primeval Galaxies: A Simple Physical Model for Lyman Break Galaxies and Ly-α Emitters. Astrophys. J. 2007, 667, 655. [Google Scholar] [CrossRef]
  82. Rutkowski, M.J.; Scarlata, C.; Haardt, F.; Siana, B.; Henry, A.; Rafelski, M.; Hayes, M.; Salvato, M.; Pahl, A.J.; Mehta, V.; et al. Lyman Continuum Escape Fraction of Star-forming Dwarf Galaxies at z∼1. Astrophys. J. 2016, 819, 81. [Google Scholar] [CrossRef]
  83. Paardekooper, J.-P.; Khochfar, S.; Dalla Vecchia, C. The First Billion Years project: The escape fraction of ionizing photons in the epoch of reionization. Mon. Not. R. Astron. Soc. 2015, 451, 2544. [Google Scholar] [CrossRef] [Green Version]
  84. Vanzella, E.; Nonino, M.; Cupani, G.; Castellano, M.; Sani, E.; Mignoli, M.; Calura, F.; Meneghetti, M.; Gilli, R.; Comastri, A.; et al. Direct Lyman continuum and Lyα escape observed at redshift 4. Mon. Not. R. Astron. Soc. 2018, 476, L15–L19. [Google Scholar] [CrossRef]
  85. Alavi, A.; Colbert, J.; Teplitz, H.I.; Siana, B.; Scarlata, C.; Rutkowski, M.; Mehta, V.; Henry, A.; Dai, Y.S.; Haardt, F.; et al. Lyman Continuum Escape Fraction from Low-mass Starbursts at z=1.3. Astrophys. J. 2020, 904, 59. [Google Scholar] [CrossRef]
  86. Smith, B.M.; Windhorst, R.A.; Cohen, S.H.; Koekemoer, A.M.; Jansen, R.A.; White, C.; Borthakur, S.; Hathi, N.; Jiang, L.; Rutkowski, M.; et al. The Lyman Continuum Escape Fraction of Galaxies and AGN in the GOODS Fields. Astrophys. J. 2020, 897, 41. [Google Scholar] [CrossRef]
  87. Izotov, Y.I.; Worseck, G.; Schaerer, D.; Guseva, N.G.; Chisholm, J.; Thuan, T.X.; Fricke, K.J.; Verhamme, A. Lyman continuum leakage from low-mass galaxies with M<108M. Mon. Not. R. Astron. Soc. 2021, 503, 1734–1752. [Google Scholar]
  88. Pahl, A.J.; Shapley, A.; Steidel, C.C.; Chen, Y.; Reddy, N.A. An uncontaminated measurement of the escaping Lyman continuum at z∼3. Mon. Not. R. Astron. Soc. 2021, 505, 2447–2467. [Google Scholar] [CrossRef]
  89. Atek, H.; Furtak, L.J.; Oesch, P.; van Dokkum, P.; Reddy, N.; Contini, T.; Illingworth, G.; Wilkins, S. The star formation burstiness and ionizing efficiency of low-mass galaxies. Mon. Not. R. Astron. Soc. 2022, 511, 4464–4479. [Google Scholar] [CrossRef]
  90. Naidu, R.P.; Matthee, J.; Oesch, P.A.; Conroy, C.; Sobral, D.; Pezzulli, G.; Hayes, M.; Erb, D.; Amorín, R.; Gronke, M.; et al. The synchrony of production and escape: Half the bright Lyα emitters at z≈2 have Lyman continuum escape fractions ≈50%. Mon. Not. R. Astron. Soc. 2022, 510, 4582–4607. [Google Scholar] [CrossRef]
  91. Puchwein, E.; Haardt, F.; Haehnelt, M.G.; Madau, P. Consistent modelling of the meta-galactic UV background and the thermal/ionization history of the intergalactic medium. Mon. Not. R. Astron. Soc. 2019, 485, 47–68. [Google Scholar] [CrossRef]
  92. Shen, X.; Hopkins, P.F.; Faucher-Giguère, C.-A.; Alexander, D.M.; Richards, G.T.; Ross, N.P.; Hickox, R.C. The bolometric quasar luminosity function at z=0–7. Mon. Not. R. Astron. Soc. 2020, 495, 3252–3275. [Google Scholar] [CrossRef]
  93. Shankar, F.; Mathur, S. On the Faint End of the High-Redshift Active Galactic Nucleus Luminosity Function. Astrophys. J. 2007, 660, 1051. [Google Scholar] [CrossRef]
  94. Giallongo, E.; Grazian, A.; Fiore, F.; Fontana, A.; Pentericci, L.; Vanzella, E.; Dickinson, M.; Kocevski, D.; Castellano, M.; Cristiani, S.; et al. Faint AGNs at z>4 in the CANDELS GOODS-S field: Looking for contributors to the reionization of the Universe. Astron. Astrophys. 2015, 578, A83. [Google Scholar] [CrossRef] [Green Version]
  95. Ricci, F.; Marchesi, S.; Shankar, F.; La Franca, F.; Civano, F. Constraining the UV emissivity of AGN throughout cosmic time via X-ray surveys. Mon. Not. R. Astron. Soc. 2017, 465, 1915–1925. [Google Scholar] [CrossRef]
  96. Giallongo, E.; Grazian, A.; Fiore, F.; Kodra, D.; Urrutia, T.; Castellano, M.; Cristiani, S.; Dickinson, M.; Fontana, A.; Menci, N.; et al. Space Densities and Emissivities of Active Galactic Nuclei at z>4. Astrophys. J. 2019, 884, 19. [Google Scholar] [CrossRef]
  97. Kulkarni, G.; Worseck, G.; Hennawi, J.F. Evolution of the AGN UV luminosity function from redshift 7.5. Mon. Not. R. Astron. Soc. 2019, 488, 1035–1065. [Google Scholar] [CrossRef]
  98. Ananna, T.T.; Urry, C.M.; Treister, E.; Hickox, R.C.; Shankar, F.; Ricci, C.; Cappelluti, N.; Marchesi, S.; Turner, T.J. Accretion History of AGNs. III. Radiative Efficiency and AGN Contribution to Reionization. Astrophys. J. 2020, 903, 85. [Google Scholar] [CrossRef]
  99. Grazian, A.; Giallongo, E.; Boutsia, K.; Cristiani, S.; Vanzella, E.; Scarlata, C.; Santini, P.; Pentericci, L.; Merlin, E.; Menci, N.; et al. The contribution of faint AGNs to the ionizing background at z>4. Astron. Astrophys. 2018, 613, A44. [Google Scholar] [CrossRef]
  100. Romano, M. Lyman continuum escape fraction and mean free path of hydrogen ionizing photons for bright z∼4 QSOs from SDSS DR14. Astron. Astrophys. 2019, 632, A45. [Google Scholar] [CrossRef]
  101. Madau, P.; Haardt, F.; Rees, M.J. Radiative transfer in a clumpy Universe. III. The nature of cosmological ionizing sources. Astrophys. J. 1999, 514, 648. [Google Scholar] [CrossRef]
  102. Loeb, A.; Barkana, R. The Reionization of the Universe by the First Stars and Quasars. Annu. Rev. Astron. Astrophys. 2001, 39, 19–66. [Google Scholar] [CrossRef]
  103. Pawlik, A.H.; Schaye, J.; van Scherpenzeel, E. Keeping the Universe ionized: Photoheating and the clumping factor of the high-redshift intergalactic medium. Mon. Not. R. Astron. Soc. 2009, 394, 1812–1824. [Google Scholar] [CrossRef]
  104. Haardt, F.; Madau, P. Radiative Transfer in a Clumpy Universe. IV. New Synthesis Models of the Cosmic UV/X-Ray Background. Astrophys. J. 2012, 746, 125. [Google Scholar] [CrossRef] [Green Version]
  105. Diemer, B. COLOSSUS: A Python Toolkit for Cosmology, Large-scale Structure, and Dark Matter Halos. Astrophys. J. Suppl. Ser. 2018, 239, 35. [Google Scholar] [CrossRef]
  106. Tinker, J.; Kravtsov, A.V.; Klypin, A.; Abazajian, K.; Warren, M.; Yepes, G.; Gottlober, S.; Holz, D.E. Toward a Halo Mass Function for Precision Cosmology: The Limits of Universality. Astrophys. J. 2008, 688, 709. [Google Scholar] [CrossRef]
  107. Schneider, A.; Smith, R.E.; Maccio, A.; Moore, B. Non-linear evolution of cosmological structures in warm dark matter models. Mon. Not. R. Astron. Soc. 2012, 424, 684–698. [Google Scholar] [CrossRef]
  108. Bulbul, E.; Markevitch, M.; Foster, A.; Smith, R.K.; Loewenstein, M.; Randall, S.W. Detection of an Unidentified Emission Line in the Stacked X-Ray Spectrum of Galaxy Clusters. Astrophys. J. 2014, 789, 13. [Google Scholar] [CrossRef]
  109. Aversa, R.; Lapi, A.; De Zotti, G.; Danese, L. Black Hole and Galaxy Coevolution from Continuity Equation and Abundance Matching. Astrophys. J. 2015, 810, 74. [Google Scholar] [CrossRef]
  110. Moster, B.P.; Naab, T.; White, S.D.M. EMERGE—An empirical model for the formation of galaxies since z∼10. Mon. Not. R. Astron. Soc. 2018, 477, 1822. [Google Scholar] [CrossRef]
  111. Cristofari, P.; Ostriker, J.P. Abundance matching for low-mass galaxies in the CDM and FDM models. Mon. Not. R. Astron. Soc. 2019, 482, 4364–4371. [Google Scholar] [CrossRef]
  112. Behroozi, P.; Wechsler, R.H.; Hearin, A.P.; Conroy, C. UNIVERSEMACHINE: The correlation between galaxy growth and dark matter halo assembly from z=0–10. Mon. Not. R. Astron. Soc. 2020, 488, 3143–3194. [Google Scholar] [CrossRef]
  113. Efstathiou, G. Suppressing the formation of dwarf galaxies via photoionization. Mon. Not. R. Astron. Soc. 1992, 256, 43P–47P. [Google Scholar] [CrossRef]
  114. Sobacchi, E.; Mesinger, A. How does radiative feedback from an ultraviolet background impact reionization? Mon. Not. R. Astron. Soc. 2013, 432, 3340. [Google Scholar] [CrossRef]
  115. Foreman-Mackey, D.; Hogg, D.W.; Lang, D.; Goodman, J. emcee: The MCMC Hammer. Publ. Astron. Soc. Pac. 2013, 125, 306. [Google Scholar] [CrossRef]
  116. Becker, G.D.; Bolton, J.S. New measurements of the ionizing ultraviolet background over 2<z<5 and implications for hydrogen reionization. Mon. Not. R. Astron. Soc. 2013, 436, 1023–1039. [Google Scholar]
  117. Becker, G.D.; D’Aloisio, A.; Christenson, H.M.; Zhu, Y.; Worseck, G.; Bolton, J.S. The mean free path of ionizing photons at 5<z<6: Evidence for rapid evolution near reionization. Mon. Not. R. Astron. Soc. 2021, 508, 1853–1869. [Google Scholar]
  118. Konno, A.; Ouchi, M.; Ono, Y.; Shimasaku, K.; Shibuya, T.; Furusawa, H.; Nakajima, K.; Naito, Y.; Momose, R.; Yuma, S.; et al. Accelerated Evolution of the Lyα Luminosity Function at z≳7 Revealed by the Subaru Ultra-deep Survey for Lyα Emitters at z=7.3. Astrophys. J. 2014, 797, 16. [Google Scholar] [CrossRef]
  119. McGreer, I.D.; Mesinger, A.; D’Odorico, V. Model-independent evidence in favour of an end to reionization by z≈6. Mon. Not. R. Astron. Soc. 2015, 447, 499–505. [Google Scholar] [CrossRef]
  120. Davies, F.B.; Hennawi, J.F.; Banados, E.; Lukic, Z.; Decarli, R.; Fan, X.; Farina, E.P.; Mazzucchelli, C.; Rix, H.-W.; Venemans, B.P.; et al. Quantitative Constraints on the Reionization History from the IGM Damping Wing Signature in Two Quasars at z>7. Astrophys. J. 2018, 864, 142. [Google Scholar] [CrossRef]
  121. Mason, C.A.; Treu, T.; Dijkstra, M.; Mesinger, A.; Trenti, M.; Pentericci, L.; de Barros, S.; Vanzella, E. The Universe Is Reionizing at z∼7: Bayesian Inference of the IGM Neutral Fraction Using Lyα Emission from Galaxies. Astrophys. J. 2018, 856, 2. [Google Scholar] [CrossRef]
  122. Konno, A.; Ouchi, M.; Shibuya, T.; Ono, Y.; Shimasaku, K.; Taniguchi, Y.; Nagao, T.; Kobayashi, M.A.R.; Kajisawa, M.; Kashikawa, N.; et al. SILVERRUSH. IV. Lyα luminosity functions at z=5.7 and 6.6 studied with ∼1300 Lyα emitters on the 14–21 deg2 sky. Publ. Astron. Soc. Jpn. 2018, 70, S16. [Google Scholar]
  123. Hoag, A.; Bradac, M.; Huang, K.; Mason, C.; Treu, T.; Schmidt, K.B.; Trenti, M.; Strait, V.; Lemaux, B.C.; Finney, E.Q.; et al. Constraining the Neutral Fraction of Hydrogen in the IGM at Redshift 7.5. Astrophys. J. 2019, 878, 12. [Google Scholar] [CrossRef]
  124. Bolan, P.; Lemaux, B.C.; Mason, C.; Bradac, M.; Treu, T.; Strait, V.; Pelliccia, D.; Pentericci, L.; Malkan, M. Inferring the IGM Neutral Fraction at z∼6-8 with Low-Luminosity Lyman Break Galaxies. arXiv 2021, arXiv:2111.14912. [Google Scholar]
  125. Greig, B.; Mesinger, A.; Davies, F.B.; Wang, F.; Yang, J.; Hennawi, J.F. IGM damping wing constraints on reionisation from covariance reconstruction of two z≳7 QSOs. Mon. Not. R. Astron. Soc. 2022, 512, 5390. [Google Scholar] [CrossRef]
  126. Maccio, A.; Paduroiu, S.; Anderhalden, D.; Schneider, A.; Moore, B. Cores in warm dark matter haloes: A Catch 22 problem. Mon. Not. R. Astron. Soc. 2012, 424, 1105–1112. [Google Scholar] [CrossRef]
  127. Calabrese, E.; Spergel, D. Ultra-light dark matter in ultra-faint dwarf galaxies. Mon. Not. R. Astron. Soc. 2016, 460, 4397–4402. [Google Scholar] [CrossRef]
  128. Vegetti, S.; Despali, G.; Lovell, M.R.; Enzi, W. Constraining sterile neutrino cosmologies with strong gravitational lensing observations at redshift z∼0.2. Mon. Not. R. Astron. Soc. 2018, 481, 3661. [Google Scholar] [CrossRef]
  129. Horiuchi, S.; Humphrey, P.J.; Onorbe, J.; Abazajian, K.N.; Kaplinghat, M.; Garrison-Kimmel, S. Sterile neutrino dark matter bounds from galaxies of the Local Group. Phys. Rev. D 2014, 89, 025017. [Google Scholar] [CrossRef]
  130. Lovell, M.R.; Bose, S.; Boyarsky, A.; Cole, S.; Frenk, C.S.; Gonzalez-Perez, V.; Kennedy, R.; Ruchayskiy, O.; Smith, A. Satellite galaxies in semi-analytic models of galaxy formation with sterile neutrino dark matter. Mon. Not. R. Astron. Soc. 2016, 461, 60–72. [Google Scholar] [CrossRef]
  131. Burkert, A. Fuzzy Dark Matter and Dark Matter Halo Cores. Astrophys. J. 2020, 904, 161. [Google Scholar] [CrossRef]
  132. Kistler, M.D.; Yuksel, H.; Beacom, J.F.; Hopkins, A.M.; Wyithe, J.S.B. The Star Formation Rate in the Reionization Era as Indicated by Gamma-Ray Bursts. Astrophys. J. 2009, 705, L104. [Google Scholar] [CrossRef]
  133. Loiacono, F.; Decarli, R.; Gruppioni, C.; Talia, M.; Cimatti, A.; Zamorani, G.; Pozzi, F.; Yan, L.; Lemaux, B.C.; Riechers, D.A.; et al. The ALPINE-ALMA [C II] survey. Luminosity function of serendipitous [C II] line emitters at z∼5. Astron. Astrophys. 2021, 646, A76. [Google Scholar] [CrossRef]
  134. Khusanova, Y.; Bethermin, M.; Le Fevre, O.; Capak, P.; Faisst, A.L.; Schaerer, D.; Silverman, J.D.; Cassata, P.; Yan, L.; Ginolfi, M.; et al. The ALPINE-ALMA [CII] survey. Obscured star formation rate density and main sequence of star-forming galaxies at z>4. Astron. Astrophys. 2021, 649, A152. [Google Scholar] [CrossRef]
  135. Gruppioni, C.; Bethermin, M.; Loiacono, F.; Le Fevre, O.; Capak, P.; Cassata, P.; Faisst, A.L.; Schaerer, D.; Silverman, J.; Yan, L.; et al. The ALPINE-ALMA [CII] survey. The nature, luminosity function, and star formation history of dusty galaxies up to z≈6. Astron. Astrophys. 2020, 643, A8. [Google Scholar] [CrossRef]
  136. Harikane, Y.; Ouchi, M.; Oguri, M.; Ono, Y.; Nakajima, K.; Isobe, Y.; Umeda, H.; Mawatari, K.; Zhang, Y. A Comprehensive Study on Galaxies at z∼9–17 Found in the Early JWST Data: UV Luminosity Functions and Cosmic Star-Formation History at the Pre-Reionization Epocht. arXiv 2022, arXiv:2208.01612. [Google Scholar]
  137. Liddle, A.R. How many cosmological parameters? Mon. Not. R. Astron. Soc. 2004, 351, L49–L53. [Google Scholar] [CrossRef]
  138. Barkana, R.; Loeb, A. in the beginning: The first sources of light and the reionization of the universe. Phys. Rev. 2001, 349, 125–238. [Google Scholar] [CrossRef]
  139. Trombetti, T.; Burigana, C. Semi-analytical description of clumping factor and cosmic microwave background free-free distortions from reionization. Mon. Not. R. Astron. Soc. 2014, 437, 2507–2520. [Google Scholar] [CrossRef] [Green Version]
  140. Finlator, K.; Oh, S.P.; Ozel, F.; Dave, R. Gas clumping in self-consistent reionization models. Mon. Not. R. Astron. Soc. 2012, 427, 2464–2479. [Google Scholar] [CrossRef]
  141. Diemer, B. Universal at Last? The Splashback Mass Function of Dark Matter Halos. Astrophys. J. 2020, 903, 87. [Google Scholar] [CrossRef]
  142. Alavi, A.; Siana, B.; Richard, J.; Rafelski, M.; Jauzac, M.; Limousin, M.; Freeman, W.R.; Scarlata, C.; Robertson, B.; Stark, D.P.; et al. The Evolution of the Faint End of the UV Luminosity Function during the Peak Epoch of Star Formation (1<z<3). Astrophys. J. 2016, 832, 56. [Google Scholar]
  143. Gardner, J.P.; Mather, J.C.; Clampin, M.; Doyon, R.; Greenhouse, M.A.; Hammel, H.B.; Hutchings, J.B.; Jakobsen, P.; Lilly, S.J.; Long, K.S.; et al. The James Webb Space Telescope. Space Sci. Rev. 2006, 123, 485–606. [Google Scholar] [CrossRef]
  144. Atek, H.; Richard, J.; Kneib, J.-P.; Schaerer, D. The extreme faint end of the UV luminosity function at z∼6 through gravitational telescopes: A comprehensive assessment of strong lensing uncertainties. Mon. Not. R. Astron. Soc. 2018, 479, 5184–5195. [Google Scholar] [CrossRef]
  145. Park, J.; Gillet, N.; Mesinger, A.; Greig, B. Properties of reionization-era galaxies from JWST luminosity functions and 21-cm interferometry. Mon. Not. R. Astron. Soc. 2020, 491, 3891–3899. [Google Scholar] [CrossRef]
  146. Labbe, I.; Bezanson, R.; Atek, H.; Brammer, G.; Coe, D.; Dayal, P.; Feldmann, R.; Forster Schreiber, N.M.; Franx, M.; Geha, M.C.; et al. UNCOVER: Ultra-deep NIRCam and NIRSpec Observations Before the Epoch of Reionization. JWST Propos. Cycle 2021, 1, 2561. [Google Scholar]
  147. Robertson, B.E. Galaxy Formation and Reionization: Key Unknowns and Expected Breakthroughs by the James Webb Space Telescope. arXiv 2021, arXiv:2110.13160. [Google Scholar] [CrossRef]
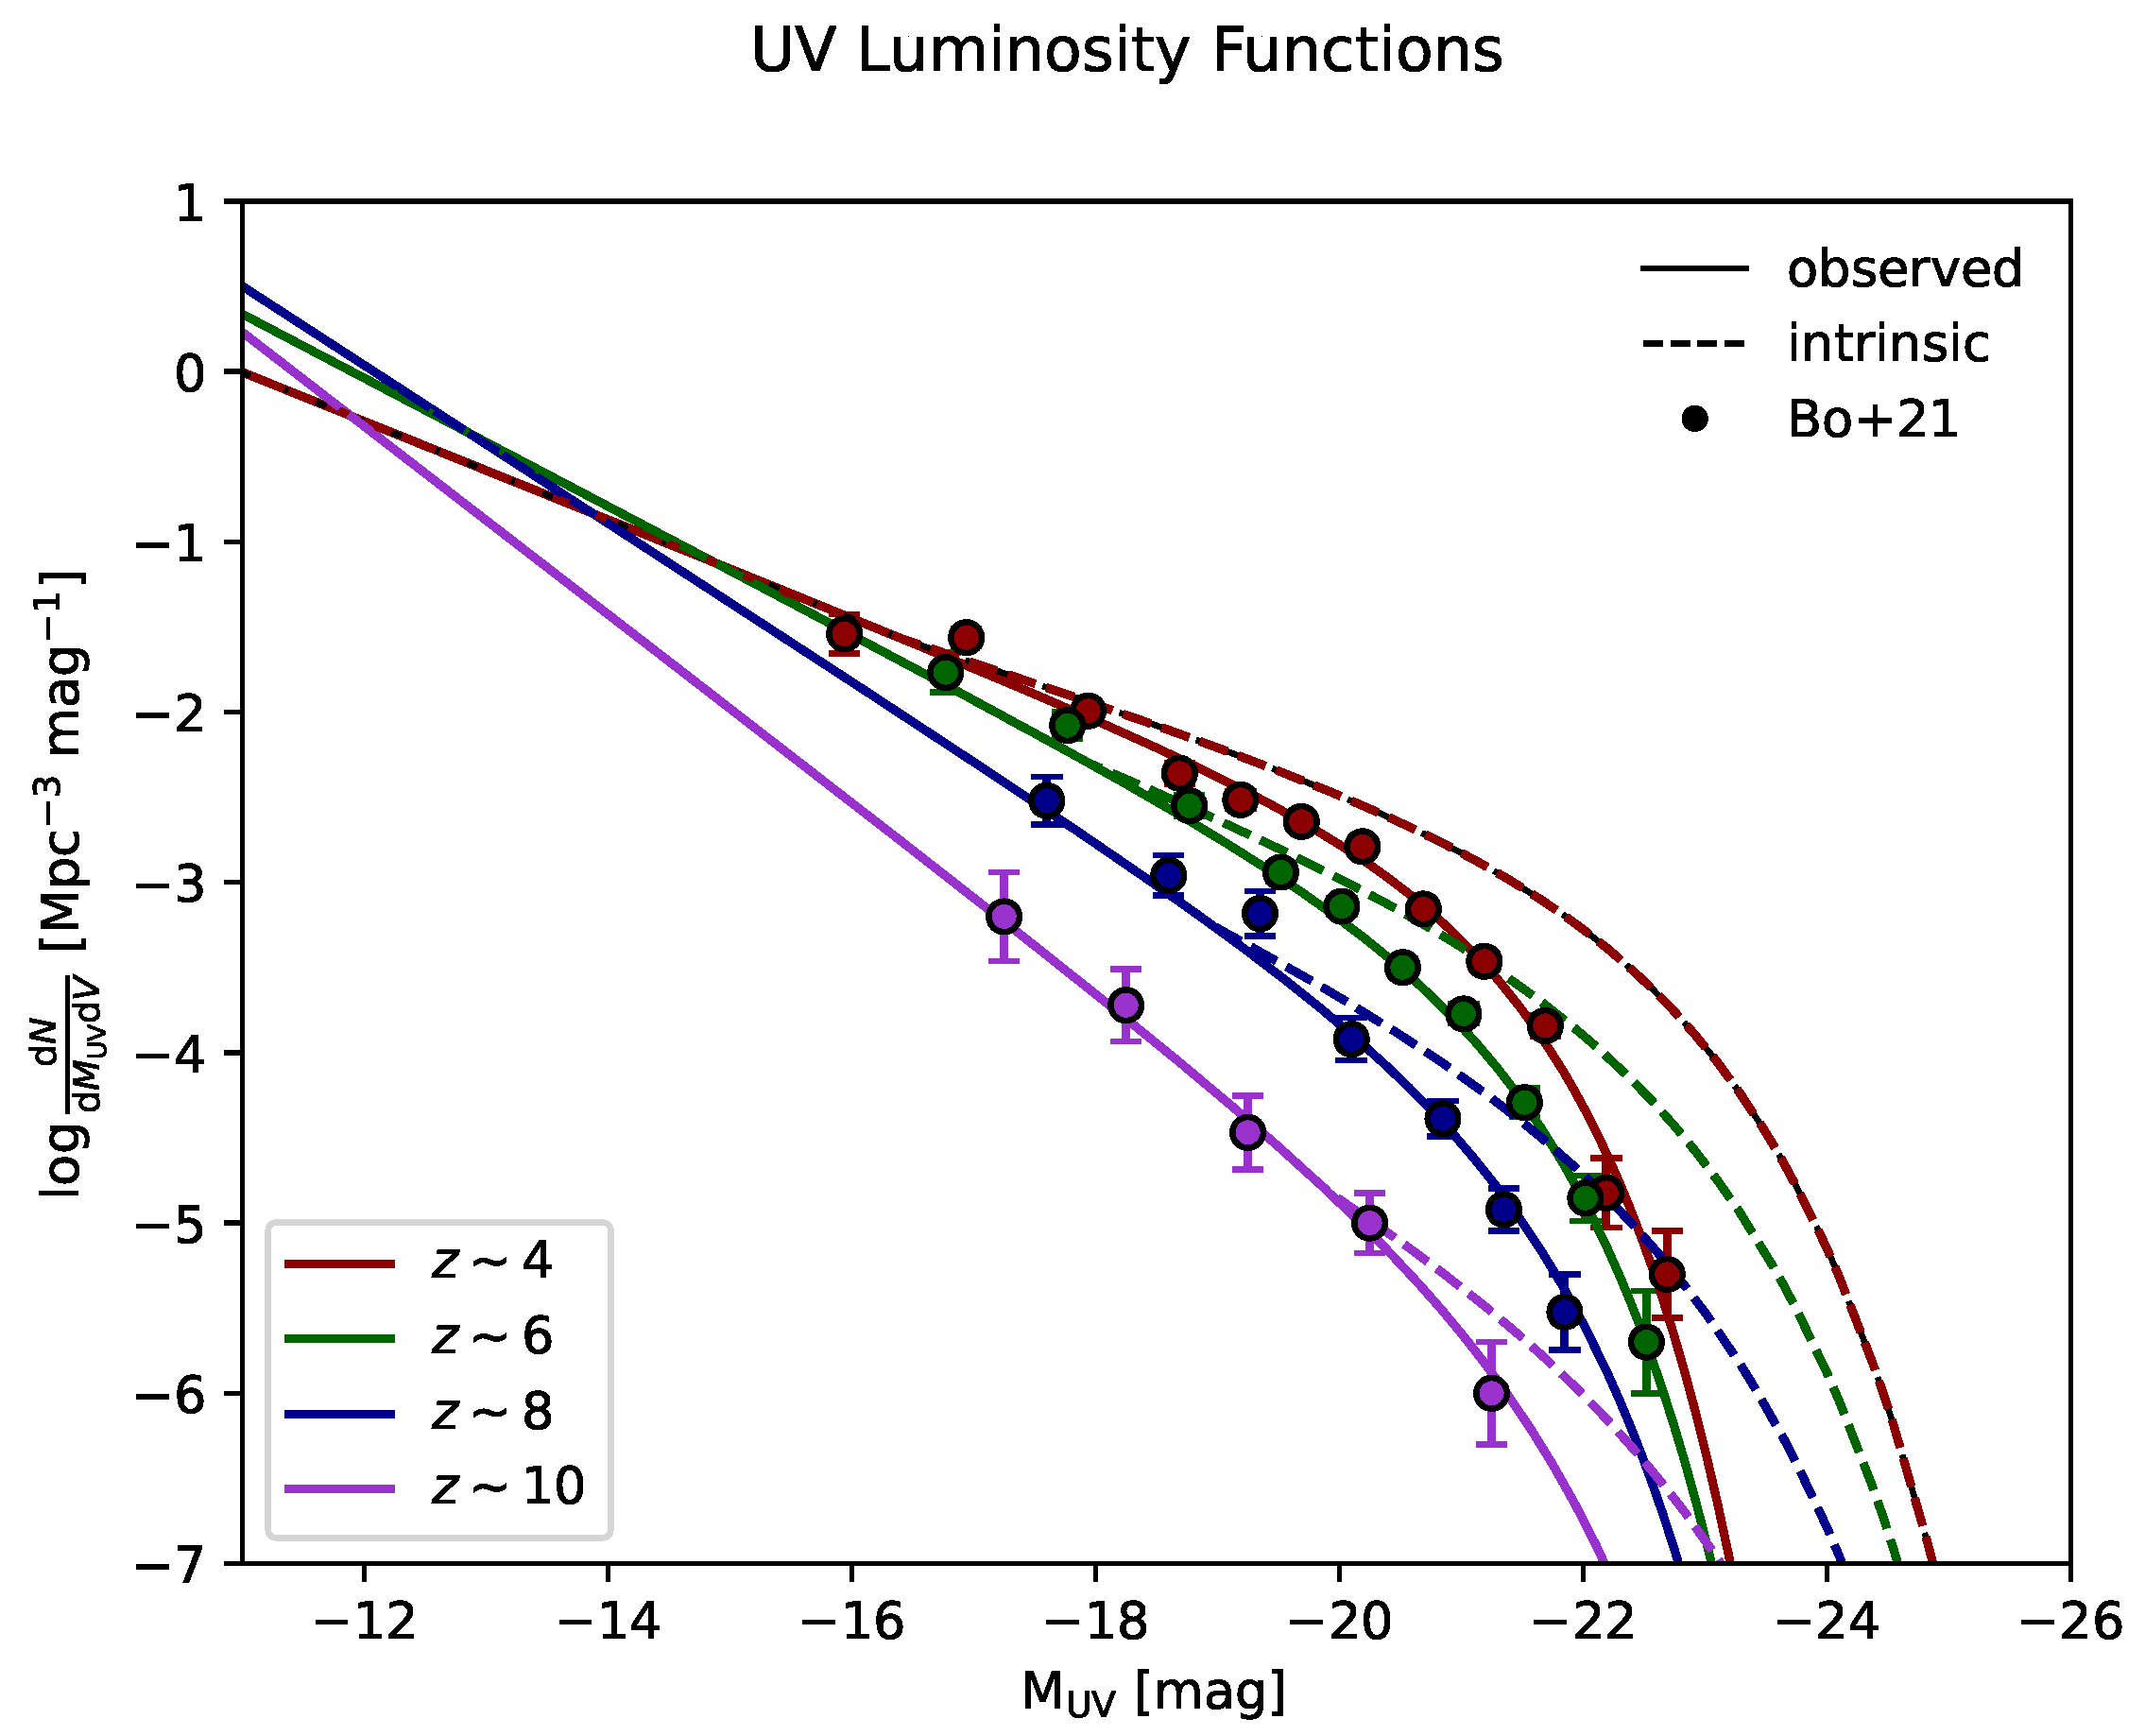
Figure 1. The UV luminosity functions at redshifts z 4 (red), 6 (green), 8 (blue), and 10 (purple). Data points (circles) and fits are from [70,71]. Solid lines illustrate the observed luminosity functions, while dashed lines illustrate the intrinsic ones, after correction for dust extinction via the UV continuum slope according to the procedure by [73].
Universe 08 00476 g001
Figure 2. The halo mass function in different DM scenarios. Different line styles illustrate the evolution with redshift (only plotted for one value of the astroparticle property), as reported in the legend. Different colors illustrate the change in the mass function at z 10 as a function of the astroparticle property, as detailed in the legend; for reference, the black line refers to the standard CDM.
Universe 08 00476 g002
Figure 3. Relationship between the halo mass M H and the UV magnitude M UV , derived from the abundance matching of the observed UV luminosity function and the halo mass function (see text for details) in different DM scenarios. Different line styles illustrate the evolution with redshift (only plotted for one value of the astroparticle property), as reported in the legend. Different colors illustrate the change in the mass function at z 10 when varying the astroparticle property, as detailed in the legend; for reference, the black line refers to the standard CDM. In all panels, the grey shaded area marks the region below the threshold halo mass M H GF where primordial galaxy formation becomes inefficient (see Section 2.2).
Universe 08 00476 g003
Figure 4. MCMC posterior distributions in the standard CDM scenario for the escape fraction f esc of ionizing photons and the limiting UV magnitude M UV , lim . In the left panel (grey contours/lines), the galaxy formation constraint derived via abundance matching is not included in the likelihood (see Section 2.3), while in the right panel (magenta contours/lines), this is taken into account. The contours show 68 % and 95 % confidence intervals, the black cross shows the maximum likelihood position, and the marginalized distributions are in arbitrary units (normalized to 1 at their maximum value).
Universe 08 00476 g004
Figure 5. MCMC posterior distributions in the WDM scenario (red contours/lines), for the escape fraction f esc of ionizing photons, the limiting UV magnitude M UV , lim , and the DM particle’s mass m X . The dashed lines refer to a run where the escape fraction has been set to the redshift dependent values from the radiative transfer simulations by [91]. The contours show 68 % and 95 % confidence intervals, the black cross shows the maximum likelihood position, and the marginalized distributions are in arbitrary units (normalized to 1 at their maximum value).
Universe 08 00476 g005
Figure 6. Summary of the astroparticle constraints in different DM scenarios. The colored shaded areas illustrate the constraints from this work for confidence intervals of 2 σ , 3 σ , and 5 σ (from darker to lighter shades). The black points show the literature constraints from independent observations: for WDM (top left panel) from [46] (diamond), [50] (circle) and [68] (square); for ψ DM (top right panel) from [47] (diamond and circle) and [127] (inverted triangle); for SIDM (bottom left panel) from [46] (diamond), [33] (inverted triangle) and [35] (square); for ν DM (bottom right panel) from [128] (grey shaded area), [46] (diamond), [129] (triangle) and [130] (square).
Universe 08 00476 g006
Figure 7. MCMC posterior distributions in the ψ DM scenario (blue contours/lines), for the escape fraction f esc of ionizing photons, the limiting UV magnitude M UV , lim , and particle mass m X . The contours show 68 % and 95 % confidence intervals, the black cross shows the maximum likelihood position, and the marginalized distributions are in arbitrary units (normalized to 1 at their maximum value).
Universe 08 00476 g007
Figure 8. MCMC posterior distributions in the SIDM scenario (orange contours/lines), for the escape fraction f esc of ionizing photons, the limiting UV magnitude M UV , lim , and visible sector temperature T X at kinetic decoupling. The contours show 68 % and 95 % confidence intervals, the black cross shows the maximum likelihood position, and the marginalized distributions are in arbitrary units (normalized to 1 at their maximum value).
Universe 08 00476 g008
Figure 9. MCMC posterior distributions in the ν DM scenario (sterile neutrino DM with a mass of 7 keV), for the escape fraction f esc of ionizing photons, the limiting UV magnitude M UV , lim , and the lepton asymmetry parameter L X . The contours show 68 % and 95 % confidence intervals, the black cross shows the maximum likelihood position, and the marginalized distributions are in arbitrary units (normalized to 1 at their maximum value).
Universe 08 00476 g009
Figure 10. The cosmic SFR density as a function of redshift. Data are from GRBs (circles; see [132]), CII (stars; see [133]), UV+FIR (triangles; see [134]), and (sub)mm (squares; see [135]). Lines illustrate the best fits from the MCMC analysis in various DM scenarios: CDM (purple solid), WDM (red solid), WDM with a redshift-dependent f esc ( z ) (red dashed), ψ DM (blue solid), SIDM (orange solid) and ν DM (green solid). The typical 2 σ credible interval from sampling the posterior distribution is shown, for clarity, only in the WDM scenario, as a red shaded area. Note that the cosmic SFR density has not been fitted upon, since the related measurements have not been exploited in constructing the likelihood of our Bayesian analysis.
Universe 08 00476 g010
Figure 11. The ionizing photon rate as a function of redshift. Data are from [116] (circles) and [117] (squares). Lines as in Figure 10. The inset illustrates the contribution of AGNs (see Equation (3)) to the total ionizing photon rate as a function of redshift, in the various DM scenarios.
Universe 08 00476 g011
Figure 12. The reionization history of the Universe, in terms of the volume filling fraction Q HII of ionized hydrogen as a function of redshift z. Data are from [121] (circle), [123] (hexagon), [118,122] (inverted triangle), [124] (triangle), [125] (squares), [120] (pentagon), and [119] (crossed). Lines as in Figure 10.
Universe 08 00476 g012
Figure 13. The optical depth to electron scattering τ es ( < z ) as a function of redshift z. Data are from [13] (shaded area). Lines as in Figure 10.
Universe 08 00476 g013
Figure 14. Top panels: dependence of the posterior distributions (normalized to 1 at their maximum value) for the DM particle’s mass m X in the WDM scenario on a few assumptions adopted in this work; in all top panels the fiducial case is illustrated as a red solid line. Top left panel: effects of changing the threshold halo mass M H GF of galaxy formation from our fiducial value 10 8 M to 10 7 M (dot–dashed yellow), to 10 6 M (dashed green), and to the redshift-dependent atomic cooling limit M H GF ( z ) (dotted blue). Top middle panel: effects of changing the clumping factor C HII from our fiducial expression by [103] to that by [140] (dashed yellow), the CDM halo mass function from our fiducial determination by [106] to that by [141] (dashed green), and the UV luminosity to SFR conversion factor κ UV from our fiducial value by [76] to the value by [74] (dotted blue). Top right panel: effects of removing from the likelihood the dataset relative to the cosmic ionization rate N ˙ ion (dot–dashed yellow), to the evolution of the ionized fraction Q HII (dashed green) and the optical depth τ es (dotted blue). Bottom panel: summary plot showing the mean and the 1 σ dispersion of the posterior distributions presented in the top panels, as indicated in the legend; for reference, the outcome in our fiducial setup is illustrated by the red vertical line and shaded area.
Universe 08 00476 g014
Figure 15. Predicted ultra-faint end of the UV luminosity function at z 10 in different DM scenarios: CDM (magenta), WDM (red), ψ DM (green), SIDM (orange), and ν DM (green). Data for M UV 17 by [70,71] are also illustrated for reference (black circles).
Universe 08 00476 g015
Table 1. Parameters describing the ratio of the halo mass function for different DM scenarios relative to the standard CDM in terms of the expression [ 1 + ( α M H cut / M H ) β ] γ , where M H is the halo mass and M H cut is a characteristic cutoff scale, see Section 2.2 for details. The values of the parameters ( α , β , γ ) , extracted from fits to the outcomes of numerical simulations in the considered DM scenarios, are taken from the literature studies referenced in the last column.
Scenario α β γ Ref.
WDM 1.0 1.0 1.16 [107]
ψ DM 1.0 1.1 2.2 [41]
SIDM 1.0 1.0 1.34 [35]
ν DM 2.3 0.8 1[43]
Table 2. Overview of the data considered in the Bayesian analysis of this work, referring to the ionizing photon rate N ˙ ion , volume filling fraction Q HII of ionized hydrogen, and optical depth τ es for electron scattering.
Observable [units]RedshiftsValuesErrorsRef.
log N ˙ ion [ s 1 Mpc 3 ]
{ 4.0 , 4.8 } { 50.86 , 50.99 } { 0.39 , 0.39 } [116]
{ 5.1 } { 51.00 } { 0.15 } [117]
Q HII
{ 7.0 } { 0.41 } { 0.13 } [121]
{ 7.6 } { 0.12 } { 0.07 } [123]
{ 6.6 , 6.9 , 7.3 } { 0.30 , 0.50 , 0.55 } { 0.20 , 0.10 , 0.25 } [118,122]
{ 7.6 } { 0.83 } { 0.10 } [124]
{ 7.3 } { 0.49 } { 0.11 } [125]
{ 7.1 , 7.5 } { 0.48 , 0.60 } { 0.26 , 0.22 } [120]
{ 5.6 , 5.9 } { 0.04 , 0.06 } ( up . lim . ) { 0.05 , 0.05 } [119]
τ es
{ } { 0.054 } { 0.007 } [13]
Table 3. Marginalized posterior estimates of the parameters from the MCMC analysis for the different DM scenarios considered in the main text. Specifically, f esc is the escape fraction, M UV lim is the limiting UV magnitude, and the astroparticle quantity X in the third column stands for: m X is in units of keV for WDM scenario, m X in units of 10 22 eV for the ψ DM scenario, T X in units of keV for the SIDM scenario, and L X for the ν DM scenario. Mean and 1 σ confidence limits are reported. The last column refers to the value of the Bayes information criterion (BIC) for model comparison, see Section 3.
Scenario f esc M UV , lim XBIC
w/o GF 0.16 0.01 + 0.03 15.6 2.0 + 1.7
CDM 0.051 0.005 + 0.005 11.4 0.1 + 0.1 53.8
WDM 0.12 0.05 + 0.02 14.8 1.2 + 1.2 1.3 0.7 + 0.3 36.7
WDM f esc ( z ) 16.4 0.3 + 0.3 0.66 0.08 + 0.07
ψ DM 0.14 0.02 + 0.02 15.8 0.1 + 0.3 2.09 0.05 + 0.09 37.1
SIDM 0.12 0.05 + 0.02 14.8 1.4 + 1.1 0.24 0.13 + 0.04 36.9
ν DM 0.068 0.008 + 0.008 12.7 0.4 + 0.2 10.7 1.4 + 1.4 39.6
Publisher’s Note: MDPI stays neutral with regard to jurisdictional claims in published maps and institutional affiliations.