1. Introduction
Thunderstorm ground enhancement (TGE, [
1,
2]), observed mostly in high mountain areas by a variety of particle detectors, is a large impulsive enhancement of electrons and gamma rays (rarely also neutrons [
3,
4]), lasting from tens of seconds to tens of minutes, sometimes exceeding the cosmic ray background hundreds of times [
5]. These enhancements imply that very specific conditions of the atmospheric electric field are established, leading to the acceleration and multiplication of electrons [
6]. The essence of these conditions is the emergence of an electrical dipole, which accelerates electrons in the direction of the ground and simultaneously decelerates positrons and muons [
7]. Another dipole, operated in the upper part of the thundercloud, accelerates electrons in the direction of the open space. A few bremsstrahlung gamma rays emitted by these electrons are occasionally registered by the orbiting gamma ray observatories, called terrestrial gamma flashes (TGFs, [
8]). The operation of both accelerators is triggered by the atmospheric electric field if the field exceeds the critical value, which equals 2.84 kV/cm × n, where n is the density of air with respect to that at sea level [
9,
10,
11,
12]. Abundant at each height in the atmosphere, secondary electrons from small and large extensive air showers (EASs) serve as seeds for the relativistic runaway electron avalanches (RREAs) [
13,
14,
15]. Additionally, the large EAS cores hitting the particle detectors can initiate millisecond duration bursts (“inverse TGFs” [
16]). Both TGEs and TGFs are precursors of lightning flashes [
17,
18], helping to understand how lightning originates in the terrestrial atmosphere. The largest atmospheric electric field strength, measured in balloon flights [
19], is much lower than needed for the conventional breakdown (≈20 kV/cm, [
20]). The possible scenarios of the RREA process, which initiates large TGEs are discussed in [
21]. Comparison of measured TGEs and simulations with GEANT4 [
22] and CORSIKA [
23] codes allow one to outline the plausible vertical profile of the electric field necessary for starting a runaway process.
Research in the past two decades has identified a surprising variety of “Transient Luminous Events” (TLEs) in the upper atmosphere and ionosphere, which accompany thunderstorms. Following the trend to look for the possible optical counterparts of thunderstorms, we establish on Aragats 24/7 monitoring of the skies by panoramic cameras as part of the multisensory research in high-energy atmospheric physics in attempts to find TLEs now in the lower atmosphere. In recent years, we registered a wide range of light structures, like large blobs in the center of the field of view (FoV) of the camera, near-vertical luminous filaments, narrow jets reaching the ground, and multiple small blobs covering almost the entire FoV of the panoramic camera. The predominant color of the light glows is blue-violet. To understand a new optical phenomenon in the lower atmosphere, we correlate the optical observations with measured electric field structures and particle fluxes. We perform detailed measurements of TGEs and disturbances of the near-surface electric field (NSEF) simultaneously with registering light glows. The sky monitoring system allows for the storage of numerous 1 min time series, which demonstrated appearing lightning flashes, light glows, birds, and precipitations.
We discovered that the optical flashes were not isolated events, but happened during active thunderstorms on the periphery of the strong lightning activity, usually accompanied by TGEs and special types of disturbances of NSEF. Peripheral storm regions do not produce lightning flashes, and instead, produce enigmatic light glows.
Measurements of TGEs at the periphery of the thunderstorm also provide clues to understanding the horizontal extension of the electric field, which supports RREA development in large areas. The size of the particle-emitting region in a thundercloud remains not well researched. Measurements with multiple dosimeters installed at nuclear power plants in a coastal area of the Japanese sea made it possible to follow the source of the gamma ray flux moving with an ambient wind flow [
24]. At Nor Amberd Research Station, located on slopes of the Mt. Aragats at 2000 m height, the size of the particle emitting region was estimated using the muon stopping effect [
25,
26]. In both studies, the size of emitting regions is estimated to be about 1 km. However, in the recent radar-based gamma glow (TGE) study along the coast of the Japanese sea, it was observed that all TGEs were accompanied by the graupel fall, indicating the low location of the lower positively charged region [
27]. A strong radar echo due to the high reflectivity of hydrometeors indicates that the vertical and horizontal extent of the strong accelerating electric field was larger than 2 km. In another observation of the gamma glow in Japan, the flux enhancements were initiated and terminated exactly at the same time at a distance of 1.35 km [
28]. Thus, the size of the particle emitting region was previously highly underestimated.
We use facilities of the Aragats research station operated by cosmic ray division (CRD) of the Yerevan Physics Institute, i.e., networks of particle detectors, near-surface electric field (NSEF) sensors, lightning locators, and panoramic cameras, to relate the light glows to the special conditions of the electrified atmosphere, and to estimate the size of the particle emitting region using a large collection of TGEs registered on Aragats during last decade.
The structure of the paper is as follows. In the second section, we present networks of particle detectors and electric field sensors and explain data acquisition and time synchronization issues. In the third section, we provide the map of the thunderstorm development by the coordinates of lightning flashes, examples of the light glows, count rates of STAND1 particle detectors, their correlations plots, and TGE particle energy spectra. The relations between the light glows and disturbances of the NSEF are portrayed and discussed. Weather conditions and the method of cloud base height estimation are presented, and we also portray the charge structure of the lower dipole accelerating the electrons downward in direction of Earth’s surface. We also portray the picture of the location of lightning sensors, electric field sensors, and panoramic cameras to help readers achieve a full understanding of the experiment installations. The fourth section is devoted to the correlation analysis of particle fluxes, light glows, and NSEF structures measured by different detectors and sensors. In conclusion, we present the summary figures outlining the peculiarities of the NSEF disturbances and the distribution of the distances to lightning flashes measured during the air glows. Comparisons with the analogical parameters of the TGE events not accompanied with glows are discussed.
2. Instrumentation
In
Figure 1 we demonstrate the location of the two main networks used in this study. In
Figure 1a we depict the Google map with located EFM 100 electric mills produced by the BOLTEK firm, widely used in atmospheric physics research. The EFM 100 sensors are operational at distances not larger than 33 km, with a response time of the instrument of ≈100 ms. EFM-100 electric mills measure NSEF with a frequency of 20 Hz and send measurements via WIFI to online computers, and then to the CRD’s MySQL database. Usually, we use 1s averaged time series of the NSEF for the multivariate visualization and correlation analysis. We locate electric field sensors on masts due to deep snow in the winter months. The mast heights on which the electric field sensors are located vary from 3 to 13 m above the ground. The EFM 100 sensor also estimates the distance to the lightning flash within 33 km from the sensor with an accuracy of ≈1.5 km. The comparisons with WWLLN estimates of the distance to lightning from the station indicate a good agreement within the accuracies of both lightning location systems [
29].
In
Figure 1b we portray the network of STAND1 particle detectors placed in the vertices of a triangle sides of which are equal to 133 m, 226 m, and 240 m. The “STAND1” detector is comprised of three layers of 1 cm thick, 1 m
2 sensitive-area scintillators stacked vertically and one 3 cm thick plastic scintillator of the same type stands apart. The light from the scintillator is reradiated into the long-wavelength region of the spectrum by the spectrum-shifter fibers and passed to the photomultiplier (PMT, FEU 115 M). The maximum luminescence is emitted at the 420 nm wavelength, with a luminescence time of about 2.3 ns [
30]. The STAND1 detector is tuned by changing the high voltage applied to the PMT and by setting the thresholds for the shaper-discriminator. The discrimination level is chosen to guarantee both high efficiency of signal detection and maximal suppression of photomultiplier noise.
From simulations and from calibration experiments we estimate the efficiency of the STAND1 scintillators for charged particles as ≈95%. The energy thresholds of the upper, middle, and lower scintillators are 1, 5, and 8 MeV, respectively. The probability of registering a gamma ray by the upper, middle, and lower layers of the STAND1 detector are ≈2%, ≈2.5%, and ≈2.8%, respectively. Because of the very fast attenuation of TGE electrons in the atmosphere, the gamma ray flux usually is larger than the TGE electron flux 10–100 times, dependent on the height of the critical field above the ground. Using the energy spectrum of the TGE gamma rays and electrons recovered by the precise scintillation and NaI spectrometers, we reliably estimate the number of electrons and gamma rays registered in each of the 3 layers (see details in [
31]).
The fast synchronized data acquisition (FSDAQ) provides registration of particle fluxes, and the near-surface electric field disturbances, harmonized with an accuracy of a millisecond. National Instrument’s MyRio board (see
Figure 2, [
32]) includes eight analog inputs, four analog outputs, thirty-two digital I/O lines, FPGA, and a dual-core ARM Cortex-A9 processor, and GPS. With reconfigurable FPGA technology, we perform high-speed signal processing, high-speed control, inline signal processing, and custom timing and triggering. Eight digital inputs of three MyRio boards are used for feeding signals from the STAND1 network (four channels for each board, see
Figure 2) and EFM 100 electric mill (by WiFi). Each of the three MyRio boards generates an output signal containing the 50 ms count rates registered by four scintillators, near-surface electric field value, and a GPS timestamp of the trigger signal. In this manner, the count rates and NSEF strengths measured by STAND1 and EFM 100 networks are synchronized on a millisecond time scale. The MyRio pulse-counting system can provide registration of very short time series (down to 1 ms) that enables the investigation of the dynamic of TGE development and its relation to the lightning initiation (50 ms time series are stored currently in the database). ADEI data analysis platform allows multivariate visualization and correlation analysis of the all-time series collected during 10 years of STAND1 network operation [
33].
The structure of the atmosphere during TGE events was modeled using a numerical mesoscale model: the Weather Research and Forecasting Model [Advanced Research WRF (WRF-ARW), v. 4.1.2] [
34]. The strategy of two nested domains is applied, with the center at the observation point (40.4715°, 44.1815°). The outer domain has dimensions of 2700 × 1800 km
2 (the discretization step was 3 km), the inner domain with dimensions of 90 × 90 km
2 (the discretization step is 1 km) covers the Aragats research station. The vertical coordinate in the inner domain has an irregular grid of 41 levels, the discretization changing from 50 m near the ground to 600 m at the height of 20 km. The WRF model includes various parameterizations describing physical processes on a sub-grid scale. The set of parameterizations providing the most reliable modeling for clouds producing TGE observed at the Aragats Station is based on the recommendations for fine meshes (MP_PHYSICS = 8, RA_LW_PHYSICS = 4, RA_SW_PHYSICS = 4, RADT = 10, SF_SFCLAY_PHYSICS = 1, SF_SURFACE_PHYSICS = 2, BL_PBL_PHYSICS = 2) and a verification procedure using the results of near-surface measurement, and satellite data [
35].
3. Thundercloud Extension, Electric Field Strength and Particle Fluxes
The thundercloud coverage of Armenia, and particularly its presence above Aragats research station was estimated by the map of lightning locations with Boltek’s storm tracker (lightning detection system [
36]), powered by software from Astrogenics. Storm tracker defines four types of lightning discharges in radii up to 480 km around the location of its antenna: CG− (cloud-to-ground negative, lowering negative charge from the cloud to the ground), CG+ (cloud-to-ground positive, lowering positive charge to the ground), IC+ (normal polarity intracloud, lowering positive charge to the ground) and IC− (inverted polarity intracloud, lowering negative charge from the cloud to the ground).
By the examining time slices of the lightning activity, we determined from which direction the storm was coming, and, finally, by putting them on the map of all lightning occurrences we can observe that the storm’s active zone missed the station (
Figure 3).
In
Figure 3, by mapping all flashes of a large storm coming from the southwest we demonstrate that the storm didn’t approach the Aragats station on 22 May, and, therefore, TGE was not terminated by the lightning flash as usual, and continued for 18 min, as we can see in
Figure 4e.
In
Figure 4e we portray a 1s time series of three modules of the STAND1 network (upper 1 cm thick scintillators). The correlations between the MAKET-SKL detectors (
Figure 4a, distance 88 m, correlation coefficient +0.81) are the same as the correlation between the MAKET-GAMMA detectors (
Figure 4c, distance 240 m, correlation coefficient +0.82). There is no significant shift in the times of the maximum flux measured by detectors, as is indicated in
Figure 4e. Delayed correlation plots (
Figure 4b,d) are obtained by shifting time series one relative to another by 1 to 200 s. If there is a significant delay in particle arrivals, the maximum correlation will be shifted, and not peaked around the 0 value (within a few seconds). Thus, all 3 detectors demonstrate coherent time series of TGE count rates.
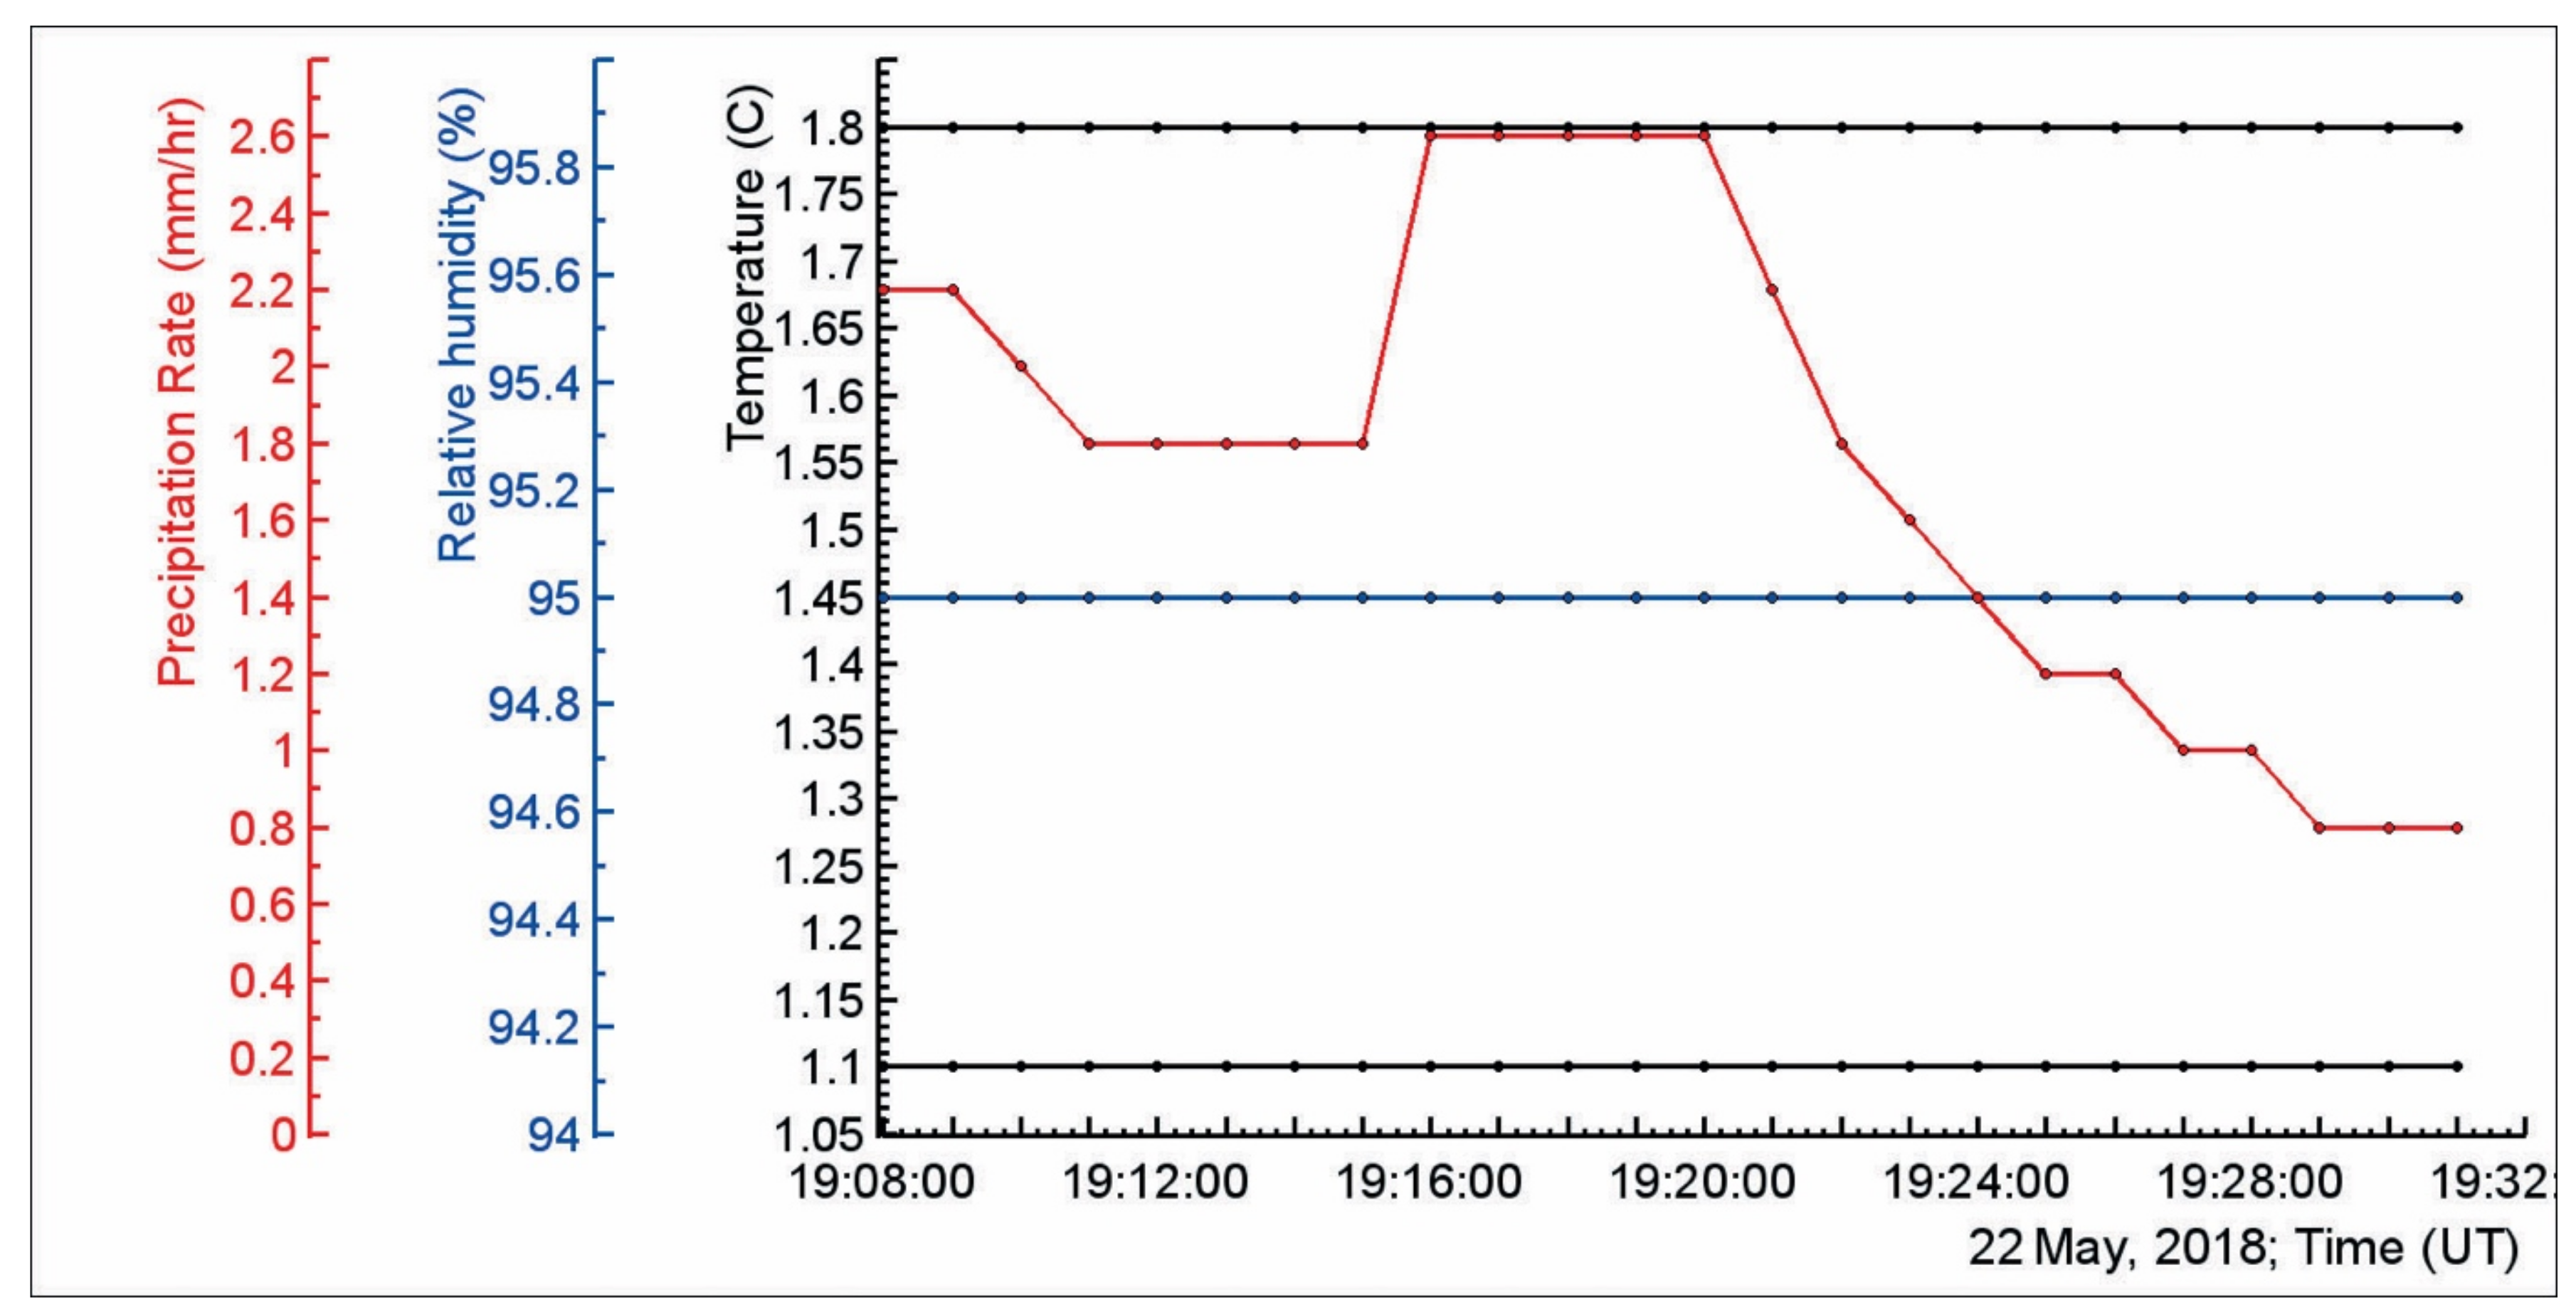
In
Figure 5 we demonstrate the meteorological conditions observed during the TGE event. The outside temperature was 1.8 °C, and relative humidity was stable during TGE (95%); the cloud base was as low as 87.5 m for inset a), nearest lightning flash—on 10 km from the detectors, (see inset b). Cloud base height was estimated by calculating the spread between the air temperature and dew point according to the well-known approximate equation (see cloud base calculator [
37]):
As we can observe in
Figure 5, despite the rainfall, the outside temperature and dew point were constant during TGE, thus, the height of the cloud base also was constant ≈at 90 m.
In
Figure 6 we demonstrate the 1s time series of the NSEF, measured by the electric mill located on the roof of the MAKET experimental hall. NSEF was in the deep negative domain during TGE, with three outbursts of the NSEF with an amplitude of ≈10 kV/m occurring over 4 min (19:19–19:23), coinciding with TGE maximum flux (see
Figure 4e). The time of the outburst occurrence coincides with the largest energies of the differential energy spectra registered by the network of NaI spectrometers at each minute of TGE (15–45 MeV), see
Figure 7.
In the upper panel, we show the shots of the ALL SKY CAM panoramic camera, with intense violet lights that occurred during TGE. The light glows coincide with the NSEF outbursts and with the maximum of the TGE particle flux. The ALL SKY CAM model produced by Moonglow Technologies is a circular fisheye system providing 190° hemispherical field of view (FoV). The image sensor is a Color 1/3” Sony Super HAD CCD II with an effective pixel number across FoV is 546 × 457, with automatic exposure time (from 10−5 to 4 s).
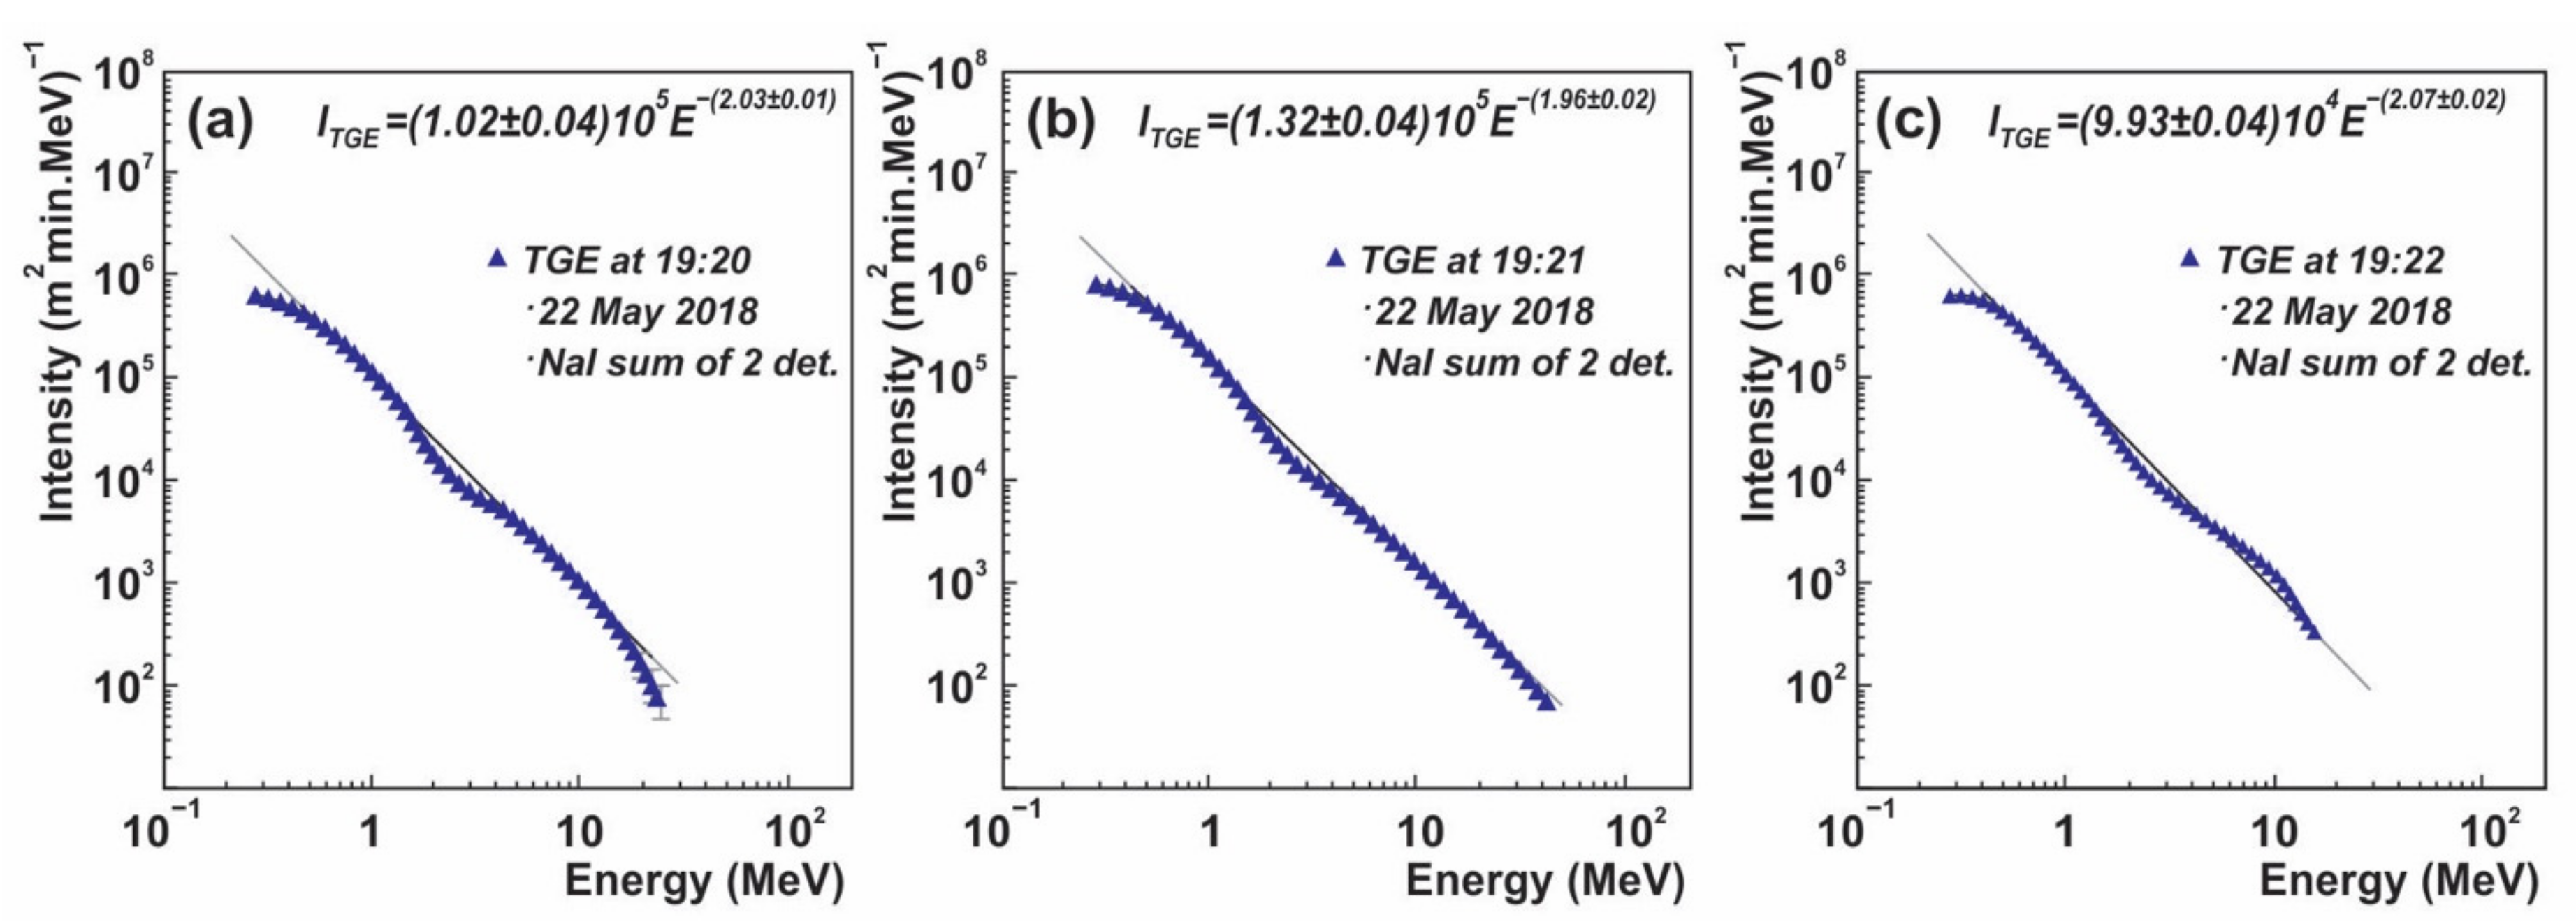
In
Figure 7 we demonstrate the differential energy spectra measured by the NaI spectrometers during minutes of the maximum flux. Seven NaI spectrometers are located under the roof of the MAKET experimental hall (0.7 mm of the iron tilts) and are monitoring the particle flux 24/7 [
38]. Large sizes (12 × 12 × 24 cm) and low energy thresholds allow measurements of the energy spectra from 0.3 MeV up to 60 MeV. At the lower energies (less than 2 MeV) we can observe the contribution of the gamma radiation of
220Radon progenies lifted to the atmosphere by NSEF [
39]. The energy spectra above 3 MeV are due to TGE particles from the RREA avalanche reaching earth’s surface. The maximum energy of the TGE particles, reaching 40 MeV, was measured at 19:19–19:21 (
Figure 7b), in the middle of the disturbances of the NSEF, and when most of the light glows occurred (upper panel of
Figure 6). Note that glows in the upper panel of
Figure 6 coincide with the “outbursts” of NSEF, which lower the net negative charge above the ground. Thus, after each rearrangement of charge structure, the NSEF is impulsively enhanced and then returns to the previous value. This occurs three times.
In
Figure 8 we portray light glows registered during the maximum of TGE flux only (there are much other light glows before and after TGE as well, posted in the Mendeley dataset [
40]). It is possible that the large particle fluxes and strong electric fields initiate discharges on high metallic masts around the Aragats station. However, we do not observe in
Figure 8 any discharge on these structures (surrounded by red ovals).
The panoramic camera is located on the mast above the roof of MAKET experimental hall (8 m height above the ground), thus only the highest masts enter the camera’s field of view (FoV). The lights located at the edge of the FoV are connected to the earth’s surface, however, there are many shots appearing in the center of FoV. The glows appeared in different locations in FoV, thus, the discharges appeared randomly in large regions of the sky below the clouds. In
Figure 9, we portrayed the camera location on the roof of MAKET building and nearby metallic constructions, which can be sources of possible corona discharges. However, after installing additional cameras at 120 m from the first one, we see that the same glow (shifted from each other according to different FoV of cameras) appears in all three cameras, proving, that it is not a local corona discharge, but the sky glow. Additionally, we installed a “spy” camera observing the vicinity of the panoramic camera and it did not observe any corona discharge.
In the following pictures, we portray another very similar storm that occurred 3 days later; in the Mendeley dataset [
40] we post exhaustive information on more than 10 similar storms accompanied with light glows; the summary histograms will be displayed in the discussion section.
We can observe in
Figure 10 that a rather compact thunderstorm that occurred on 25 May 2018 approached from the southwest. The storm on 22 May, did not approach the Aragats station, and TGE continued for 14 min, as we can observe in
Figure 11a,c. Thus, there was an offset of the storm active zone from the Aragats station, as we can observe in
Figure 3 and
Figure 10. However, although the active lightning zone was rather far from the station, the electric field strength in the atmosphere was above the critical value of the runaway process, and an electron accelerator operates in the atmosphere for a few tens of minutes.
In
Figure 11a we present 1 s time series of three units of STAND1 network (stand-alone 3 cm thick scintillators, see
Figure 2); all three count rates of STAND1 network precisely correlate.
It is interesting to see in
Figure 11b that both the graupel (specks on the glass of the panoramic camera) and light glows occurred at the maximum of the TGE flux. The specific specks that appeared on the panoramic shots are connected with graupel fall, as we demonstrate in [
25], see
Figure 11 and
Figure 12. In
Figure 11c we portray a 1 min time series of the 3 cm thick scintillators belonging to the STAND3 detector (four stacked scintillators located in the SKL hall) along with disturbances of NSEF and remote lightning occurrences.
In
Figure 12 we demonstrate WRF modeling for the structure of the cloud revealing the snow (
Figure 12b) and graupel (
Figure 12a) clusters. The observed graupel fall and the lower cluster, which assumingly forms LPCR evidenced the emergence of the lower dipole that accelerated electrons in the direction of Earth’s surface. On 25 May, the density of the graupel cluster was relatively high; the graupel hydrometeors were located very low above the station. We assume that the modeled graupel cluster formed an LPCR, with which the snow cluster (the main-negative layer—MN) forms a lower dipole accelerating electrons in the direction of the earth’s surface. As we can observe in
Figure 12, both clusters were in the same z-coordinates just above the station at the minutes of the maximum TGE flux and at the seconds when the light glows appear. Although the dipole MN-LPCR possibly plays a role in enhancing the electric field strength, the charge of the graupel cluster was quite small (because the NSEF is deep negative), thus, we see that the predominant impact is caused by the negatively charged snow cluster. The graupel cluster is much closer to the surface than the upper snow cluster (about 10 times closer, which leads to a 100 times higher field for the same charge), and still, it does not create a field comparable with the field of the upper cluster. Therefore, we assume that the density of the graupel cluster is much smaller than the density of the snow cluster.
In
Figure 13 we portray the 1s time series of the NSEF, measured by MAKET electric mill. During TGE, the NSEF was in the negative domain. In the upper panel, we portray the shots of the panoramic camera that continuously monitors the skies above the research station. The graupel fall indicates that a strong electric field can be extended below cloud base due to the falling positively charged graupels that oversee the electric field production. In contrast with the previous storm, which occurred on 22 May, the light glows are not so bright (see
Figure 6), but considerably blurry. The height of the glows that are observed by panoramic cameras located on the ground is restricted by the cloud base height that scattered and absorbed the optical emissions. We surmise that lights are observed via a cloud that on 25 May was extremely low (25–60 m); on 22 May cloud base height was estimated to be ≈90 m, and lights were very bright, thus, we can estimate very roughly the height of the light glows to be 100 m.
4. Correlation Analysis of the Light Glows, NSEF Disturbances, and Particle Fluxes
In this section, we will present the correlations of the light glows and NSEF in more detail to understand their possible origin. In
Figure 14 we present the entire duration of a strong storm that occurred on 22 May 2018. The storm lasted nearly 4 h, with multiple lightning flashes, and it passed aside from Aragats station (see
Figure 3), however, initiated eight TGEs, two of which were significantly large (two largest peaks in
Figure 14). All 8 TGEs occurred when NSEF was in a deep negative domain approaching −20 kV/m. In previous sections, we used only one NSEF sensor located on the roof of the MAKET experimental hall, but in this section, we will use data from all four electric field sensors to clarify the local effects of the charge rearrangements during TGE by using the delayed correlation techniques.
In
Figure 15 we portray the disturbances of NSEF measured by all four sensors of the network. We can see periodic and symmetric changes in the NSEF during the TGE. Three of the sensors located nearby on the highland demonstrate coherent peaks whose maximums coincide with an accuracy of a few seconds. The remote sensor located ≈300 m apart and ≈10 m lower in a valley exhibits two large peaks ahead of the other three and did not register the third peak.
In
Figure 16 we present a detailed comparison of measurements made by two nearby electric field sensors, one on the MAKET experimental hall roof (black), and on the standing alone 13 m high mast (blue). In the upper panel, we portray the scatter plot and delayed correlations plot presenting the precise coherence of both measurements (the bias of delayed correlation is near zero). In frames (c) and (d) we portray light glows, and in frame
Figure 16g we outline the times of light glows with lines of different colors. Thus, we can relate the periodic changes of the NSEF with the appearance of light glows in the FoV of the panoramic camera. The difference in amplitudes of NSEF changes may be explained by the different locations of sensors. The sensor on the 13 m high mast is possibly not sensitive enough to the charge rearrangement aloft, compared to the sensor located 2 m above the metallic roof of the MAKET building.
In
Figure 17 we portray the results of the correlation analysis of two remote NSEF sensors. From the delayed correlation plot we can observe the delay of the maximum correlation between electric field disturbances measured by the GAMMA EFM 100 located in a valley, and the same type device located on the roof of MAKET experimental hall. The correlation coefficient reaches a value of ≈0.7 when the time series of MAKET device is shifted by ≈30 s (see inset). The amplitude of field disturbances is also larger for GAMMA EFM. Thus, we can conclude that field rearrangement first influences the GAMMA sensor, and on the other 3 only after ≈30 s.
The symmetric smooth shapes of analyzed NSEF disturbances are very different from the disturbances that originated from nearby lightning flashes. The nearby lightning discharges initiate the NSEF abrupt changes with the rise time of several hundreds of milliseconds and a long tail of tens of seconds. Highly symmetric and many-seconds-long periodic structures cannot be related to any of the lightning discharge. The disturbances portrayed in
Figure 17 are not an exclusive case; in
Figure 18 we present another symmetric structure registered during a significant TGE that occurred a few minutes before the analyzed one. Again, the time of the peak “outburst” measured by the GAMMA sensor is the same 30 s ahead of the MAKET sensor. However, the time amplitudes of both are equal.
5. Discussion and Conclusions
In our previous papers, we mentioned that TGEs are precursors of lightning flashes [
17]. Recently we placed a collection of 165 TGEs in the Mendeley datasets, all terminated by lightning flashes [
41]. From this collection, supplied with links to explanatory materials, one can observe that the nearby flashes (distances less than 3 km) terminate the TGE just at the beginning of the rising phase; the middle-distance flashes (3–8 km) terminate at the maximum or on the TGE decaying phase.
Two TGEs described in this paper are very different from TGEs terminated by lightning flashes. Centers of the storm lightning activity were >10 km away from the detectors, and lightning flashes do not catastrophically lower the potential difference and do not abruptly terminate RREAs in the thunderous atmosphere above the particle detectors. Thus, particle fluxes continued for 14 and 18 min and are accompanied by light glows during the maximum flux of TGE. These considerably weak electrical discharges, that cause disturbances of the NSEF, do not trigger the Aragats system of electromagnetic pulse detection, which is triggered only by strong nearby lightning flashes. Lightning-active zones miss the station for both TGEs as is observed in the lightning location and WRF maps (
Figure 3 and
Figure 10), and nearby lightning flashes occurred at distances of >10 km, do not terminate TGEs. The particle flux was stable at a ≈300 m scale, as we can observe from precisely correlated particle flux enhancements measured by remote detectors (see
Figure 4 and
Figure 11). It indicates that the intracloud electric field that originates particle fluxes was stable on the minutes time scale. Thus, if the storm is just above particle detectors, nearby lightning flashes terminate RREA after a few minutes [
42]. When the storm active zone is far from particle detectors (>10 km), the TGE extends for tens of minutes and smoothly terminates when conditions of the atmospheric electric field fail to support RREA. In
Figure 19a, we portray the distribution of distances to lightning flashes abruptly terminated by the lightning flash. In
Figure 19b we portray the same distribution for long-lasting TGEs, accompanied by light glows (a collection of these TGEs is posted in [
40]). It is apparent that these distributions are belonging to distinct classes; only the second class (corresponding to the distribution presented in
Figure 19b) mostly supports the origination of light glows.
Thus, the electron acceleration occurred in both cases and RREA particles covered large areas below thunderclouds. Therefore, the RREA can be unleashed in a very large spatial domain around the active lightning zone many kilometers apart.
Observed light glows are not local corona discharges on the camera mast, but a discharge in the atmosphere above the Aragats station, influencing all electric sensors. These discharges do not initiate lightning flash, only local disturbances of the NSEF and light glows in the sky above the station. The delay correlation analysis demonstrates that the network of NSEF sensors registers a slightly different field disturbance due to the different orographic locations of the sensors.
During the most of glow events, the NSEF was in the deep negative domain, only 3 from 14 were in the positive domain, see
Figure 20. The origin of light glows is under discussion; the possible explanations are intense fluxes of TGE electrons [
43,
44], ball lightning [
45,
46], St. Elmo’s fires, and geomagnetic disturbances [
47]. However, after examining luminous TGE events, along with lightning location maps and NSEF time series, we surmise that an electrical discharge much weaker than a lightning flash could only partially neutralize the charge above, and hence, only partially lower the corresponding potential difference, allowing the electron accelerator to operate and send particle fluxes in the direction of Earth’s surface. Simultaneously, these types of discharges initiate light glows in the thunderous atmosphere.
Terrestrial gamma-ray flashes (TGFs) comprise very few high-energy photons from RREAs unleashed in the upper dipole, and occasionally reaching orbiting gamma observatories. They are associated with severe thunderstorms in the equatorial regions, however, due to the large distance from the source to spectrometers, located on the satellites, different scenarios of relative time-sequence of TGF and lightning are reported. Recently, the Atmosphere-Space Interactions Monitor (ASIM) consisting of X- and gamma-ray detectors, optical photometers, and cameras clarified the temporal relation between TGFs and lightning discharges. The authors of [
18] conclude that TGFs precede lightning flashes. Thus, ASIM measurements evidenced that possibly lightning flashes do not originate MeV gamma rays, as was indicated already for TGEs [
17]. Thus, now we have additional evidence of the analogical origin of TGEs and TGFs.
Additionally, ASIM photometers register an optical signal preceding the optical pulse associated with the lightning by a few milliseconds. A 300 km distance from photometers to thunderclouds does not allow to obtain a detailed time series of shots, however, the optical light registration during TGFs demonstrates the universality of the RREA process for both avalanches in the upper (TGF) and lower (TGE) dipoles in the thunderous atmosphere.


 ,
, 