Review

Ultra Long Period Cepheids: Observation and Theory

The Italian National Institute for Astrophysics (INAF)-Osservatorio astronomico di Capodimonte, Vicolo Moiariello 16, 80131 Napoli, Italy
Universe 2022, 8(6), 335; https://doi.org/10.3390/universe8060335
Submission received: 21 April 2022 / Revised: 13 June 2022 / Accepted: 15 June 2022 / Published: 18 June 2022
(This article belongs to the Special Issue Recent Advances in Pulsating Stars)

Abstract

:
Ultra Long Period Cepheids are becoming a very interesting and important topic thanks to the contribution that they can give to understanding the current tension existing between the early-universe and local Hubble constant measurements. These bright pulsating variables are observable up to cosmological distances (larger than 100 Mpc) allowing us, in principle, to measure the Hubble constant without the need for secondary indicators, thus reducing the possible systematic errors in the calibration of the extragalactic distance scale. The Ultra Long Period Cepheids also represent a useful tool for obtaining information on the star formation history of the host galaxy and a challenge for the evolutionary and pulsational models, particularly in the very metal poor regime. In this paper, the largest known ULP sample, consisting of 72 objects, including 10 new candidates, is analyzed to give an observational and theoretical overview of their role as distance indicators and of their evolutionary properties.

1. Introduction

One of the most debated topics in recent years, is related to the tension between the Hubble constant (H 0 ) measured in the early universe, as mainly based on the cosmic microwave background, and the one inferred from the extragalactic distance scale calibration in the local universe. The local H 0 determination is largely based on stellar standard candles, such as classical Cepheids (CC), the tip of the Red Giant Branch and RR Lyrae. These are adopted as primary distance indicators to calibrate the secondary ones (e.g., Type Ia supernovae and Tully–Fisher relation) that can be used at cosmologically relevant distances, where the motion of galaxies is only due to the uniform expansion of the Universe (the so-called Hubble flow). On this basis, any systematic error affecting the distance ladder reflects the H 0 determination (see, for example [1,2,3,4]).
In recent years, great theoretical and observational efforts have been made to further reduce the uncertainties on the calibration of the period–luminosity relation (PL) of the CCs that is the most used and reliable primary distance indicator (see, for example [1,4,5,6,7], and references therein), but systematic errors still remain, propagating on secondary indicators (see, for example [2,8], and the references therein) and contributing to the final H 0 error budget.
In this context, it would be very important to have the possibility of a primary distance indicator directly observable at a cosmological distance that is at least as reliable as CCs.
Bird et al. [9] analyzed pulsating variables in some nearby forming galaxies (namely, Magellanic Clouds, NGC 55, NGC 300, and NGC 6822), pointing out the existence of a small number of variable stars with periods ranging from 80 to 210 days and light curves and pulsation properties similar to the CCs but at higher luminosities and masses. In particular, they seemed to be the extension at higher luminosities and longer period of the PL and period–Wesenheit (PW) relations (see Figures 2, 4 and 5 in [9]), albeit obeying a V I PW relation flatter than the short period CCs one. These pulsating stars, called Ultra Long Period Cepheids (ULPs) by Bird et al. [9], are characterized by a mean visual magnitude of about −7 mag. Thus, they promise to have a great potential to be used as standard candles in galaxies at distances up to 100 Mpc and even far beyond, with the next generation space and ground telescopes such as the James Webb Space Telescope and the European Extremely Large Telescope.
In addition, the ULPs, being pulsating stars, with the typical relations connecting their intrinsic properties to the characteristics of the oscillation, can be also very useful as stellar population tracers and, in turn, to obtain the constraint on the star formation history of their host galaxies. Particularly interesting is the case of the ULPs in the blue compact galaxy IZw18, characterized by a very low metallicity ( Z = 0.0004 ) that also represents a challenge for evolutionary and pulsational models.
Unfortunately, the number of known ULPs is very small due to the very long period that is required to observe on extended time baselines in order to cover more than one pulsation cycle. In this paper, a review of the more recent results about the ULP properties is presented. Section 2 describes the sample of ULPs adopted. Their properties as distance indicators and connected to their evolutionary phase, as compared with the CC ones, are analyzed in Section 3 and Section 4 and tested against evolutionary and pulsational models in Section 5. In Section 6, a discussion on the results and future perspectives close the paper.

2. Literature Samples

After the first work by Bird et al. [9], Fiorentino et al. [6,10] analyzed a sample of 37 ULPs, also including the 2 M81 candidates by Gerke et al. [11] and those identified in the Cepheid samples of the galaxies NGC 1309, NGC 3021, NGC 3370, NGC 4536, NGC 5584, NGC 4038 and NGC 4258 observed by Riess et al. [5] within the SH0ES project (“Supernovae and H0 for the Equation of State” to observe Cepheid variables in galaxies hosting SNe Ia). This sample covered a very large metallicity range with 12 + log ( O / H ) varying from ∼7.2 to 9.2 dex, and Fiorentino et al. [6,10] did not confirm a flat behavior for the V I PW relation, finding a relation similar to that of the LMC CCs without a significant dependence on metallicity, in agreement with the theoretical pulsational model prediction for the V I CC PW [12,13], but with a dispersion larger than expected. This unexpected spread could be intrinsic but also due to the inhomogeneity of the sample (with magnitudes, color excesses and metallicities taken from different sources), to the poor light curve sampling of some ULPs, and/or to a wrong classification as ULP. A very peculiar case was represented by the 2 IZw18 ULPs, characterized by very long periods, namely 125 and 130 d. Indeed, the host galaxy is a very metal poor blue compact dwarf galaxy with Z = 0.0004 , and the most updated evolutionary and pulsation models do not predict the existence of such a type of extremely long period pulsators within the Classical Cepheid instability strip [14,15] (see Section 5 for details).
In the framework of the SH0ES project [5], the number of the observed galaxies hosting CC samples was further enlarged to a total number of 14, finding a total of 40 ULPs. The CC samples were analyzed by Riess et al. [16] and Hoffmann et al. [17], performing a new procedure to identify and characterize the properties of the variable stars and a new and homogeneous photometric calibration. This procedure, applied to the Riess et al. [5] data, provided different periods for all the 19 candidate ULPs included in the Fiorentino et al. [10] sample and confirmed only 16 pulsators as ULPs.
Three other candidate ULPs were identified in the M31 galaxy using the Palomar Transient Factory (PTF) by Ngeow et al. [18] and Taneva et al. [19]. Two of these candidates were identified by Ngeow et al. [18], namely 8-0326 and 8-1498, with periods of 74.427 ± 0.120 d and 83.181 ± 0.178 d, respectively. They were both classified as ULPs, even if the first had a period shorter than 80 d, and used to derive the M31 distance as a test of their reliability as standard candles (hereinafter M31_N ULPs). The third candidate, namely H42, identified by Taneva et al. [19], has a period of 177.32 d (hereinafter M31_T ULP).
Musella et al. [20] collected all the above mentioned ULPs to compare their properties in the color–magnitude diagram (CMD) and PW plane with the CC ones. Their sample included 63 objects, with a metallicity 12 + log ( O / H ) ranging from ∼7.2 to 9.2 dex and they found W V I = 2.15 log P 4.89 with σ = 0.38 , also in this case not confirming the flat slope by Bird et al. [9]. Musella et al. [20] analyzed also the possible effects due to the adoption of a not photometrically homogeneous sample, and, adopting only the SH0ES sample, they obtained a Wesenheit relation ( W V I = 2.89 log P 3.42 with σ = 0.36 ) that in the ULP period range differs less than 0.05 mag from that for the LMC CCs [21]. Both the results obtained for the Wesenheit relation and for the location of the ULPs in the CMD seem to confirm the ULPs as an extension at higher mass and luminosity of CCs, even showing a larger spread. They point out the necessity to have a larger sample with an accurate and homogeneous photometry together with their theoretical instability strip (extend the pulsational models up to 20 M ) to better understand the origin of the observed spread that could be due to crowding, blending, but could also be intrinsic.
A new search of possible ULPs not classified as ULPs, but present in CC samples was carried out. Ten new candidates were found: two ULPs in M33, Pellerin and Macri [22], five new ULPs in M31 Kodric et al. [23], one ULP in Yuan et al. [24] and one in Bentz et al. [25] (gP1, rP1 and iP1 ULP mean magnitudes obtained by Kodric et al. [23] and WFC3 magnitudes by Yuan et al. [24] and Bentz et al. [25] were converted in the Johnson V and I magnitudes adopting transformation by Tonry et al. [26] and Harris [27], respectively). In particular, the five new ULPs in M31 were identified in the framework of the Pandromeda survey [23], with a minimum period of 79.35 d. In the Kodric et al. [23] sample are also included the bf two M31 variables by Ngeow et al. [18], but 8-1498 (with period longer than 80 days) is listed as unclassified. For this reason, for this variable, we adopt only the photometry by Ngeow et al. [18] based on a specific photometric follow up. On the other hand, variable 8-0326 is present with a slightly longer period, but taking into account that in the Kodric et al. [23] catalog there are other two variables with period of about 75–76 d and that, generally, only variables with period longer than 80 days are classified as ULPs, in the following, 8-0326 is excluded from the analysis.
The final list of the 72 collected ULPs is reported in Table 1 together with information on the host galaxy, period, V and I magnitudes, Wesenheit in the V and I bands ( W V I = I 1.55 ( V I ) ), distance modulus, color excess (of the host galaxy), 12 + log ( O / H ) metallicity (abbreviated as O / H in the table) and the corresponding computed Z ( [ O / H ] = log ( O / H ) log ( O / H ) with log ( O / H ) = 3.10 . Assuming [ O / H ] = [ F e / H ] , we derive [ O / H ] = log Z log Z that implies Z = 10 [ O / H ] + log Z , with Z = 0.02 ).
The references for magnitudes, distance moduli and metallicities for the Bird sample are reported in Fiorentino et al. [10] and for the M81 and M33 ULPs are in Gerke et al. [11] and Pellerin and Macri [22], respectively. The V and I for the M31_N ULP are taken by Ngeow et al. [18]. For the M31_T ULP by Taneva et al. [19], we do not have the I mean magnitude, but only the B, V and R mean magnitudes, and for this reason, it was separately discussed in Musella et al. [20]. In this work, also the I mean magnitude is derived by adopting the well-defined relation between R and ( V + I ) / 2 based on the Landolt standards used to calibrate the Johnson–Kron–Cousins photometric system [28,29,30]. (The adopted relation has an r m s = 0.04 , and it is valid for the whole range of magnitudes and colors covered by Landolt’s stars. Applying this relationship to mean magnitude instead of single phase points can result in an error of a very few hundredths of magnitude.) The Andromeda distance modulus adopted is that by de Grijs and Bono [31]. The metal abundances of the all M31 ULPs are obtained from their position [19,23,32], taking into account the metallicity gradient of this galaxy derived in the framework of the PHAT survey [33]. Distances for NGC 4151 and NGC 6814 are those derived by Yuan et al. [24] and Bentz et al. [25], respectively. For NGC 4151, in the literature, there is no reliable metallicity determination, whereas NGC 6814 has approximately a solar average abundance [34]. For the SH0ES sample, the V and I magnitudes tabulated are those computed by Musella et al. [20] from the F555W and F814W magnitudes by Hoffmann et al. [17] and the adopted distance moduli and individual metal abundances are the same as those adopted by Riess et al. [16] and Hoffmann et al. [17].
Generally there are no estimates for the specific reddening suffered by the ULPs, and the color excesses in Table 1 are those obtained for the host galaxy adopting the Galactic dust reddening maps by Schlafly and Finkbeiner [35]. An exception is represented by H42, whose color excess was specifically obtained by Taneva et al. [19] as E ( B V ) = 0.57 ± 0.05 mag, much higher than the tabulated value by Schlafly and Finkbeiner [35] for M31.
To test the reliability of the ULPs as standard candles also in comparison with CCs, Musella et al. [20] analyzed the properties of these long period pulsators using the reddening free Wesenheit relation in the V an I bands, W V I , adopting as reference CC samples those of the Large Magellanic Cloud (LMC) and of NGC 4258, which are the two most used anchor galaxies for the extragalactic distance scale. LMC has the great advance of hosting a large number of known CCs with high-precision photometry by the Optical Gravitational Lensing Experiment [21] and having several distance estimates obtained through different and independent methods. On the other hand, due to the large number of galaxies observed with the Hubble Space Telescope (HST), with a chemical composition very different from the LMC one, it was claimed the need for an anchor galaxy observed on the same HST photometric system and with a similar metallicity. NGC 4258 was the ideal target. This galaxy has the additional advantage of having an independent geometrical water maser high-precision distance modulus.
Figure 1 and the upper panel of Figure 2 show the V I PW plane of the ULPs in Table 1. In Figure 1, the ULP V I PW is compared with those of the CC sample of NGC 4258 ((slope = 3.38 ± 0.02 mag for P > 10 d obtained with a global fit), see [16,17], for details) in the upper panels and of LMC OGLE CC ([21], slope = 3.314 ± 0.008 ) in the bottom panel. In the lower panel of Figure 2 the residuals between the ULP observational Wesenheit ( W V I ) and the LMC OGLE CC ( W L M C ) one are shown, pointing out a very good consistency, even if with a significant spread. In particular, the V I PW of the ULPs has a spread much larger than the LMC OGLE CC, but very similar to that of the NGC 4258 CC sample. As pointed out by Fiorentino et al. [6,10] and Musella et al. [20], this spread can be due to several causes. Probably, the most important one is the blending effect (being CCs observed in dense environments) that represents the major error source in the calibration of the extragalactic distance scale and becomes more and more significant as the distance of the observed galaxies increases ([7], and references therein). Other possible causes are the adoption of different sources for the individual reddening and distance values, the assumption of a fixed extinction law (as recently pointed out also by [36]) and a possible dependence on the metallicity.
Recently, Mortsell et al. [36] and Perivolaropoulos and Skara [37], using Cepheid data by Riess et al. [16], analyzed the effects on the calibration of the extragalactic distance scale when neglecting the differences in the properties of Cepheids belonging to different environments. In particular, Mortsell et al. [36] discussed the adoption of a fixed universal color-luminosity relation to correct the Cepheid magnitudes, and Perivolaropoulos and Skara [37] analyzed the possible dependence of the color coefficient of the Wesenheit relation (based on the adopted extinction law) on the properties and the distance modulus of the host galaxy. Due to the small number of ULPs we have in each galaxy, we cannot perform such a statistical analysis. In any case, to search for possible evident dependencies, in Figure 3, the differences W V I W L M C are also plotted as a function of the host galaxy distance modulus (upper panel) and metallicity (lower panel), respectively. A qualitative analysis of these plots does not seem to indicate any clear trend, even considering sub-samples, including only the ULPs belonging to the same galaxy.

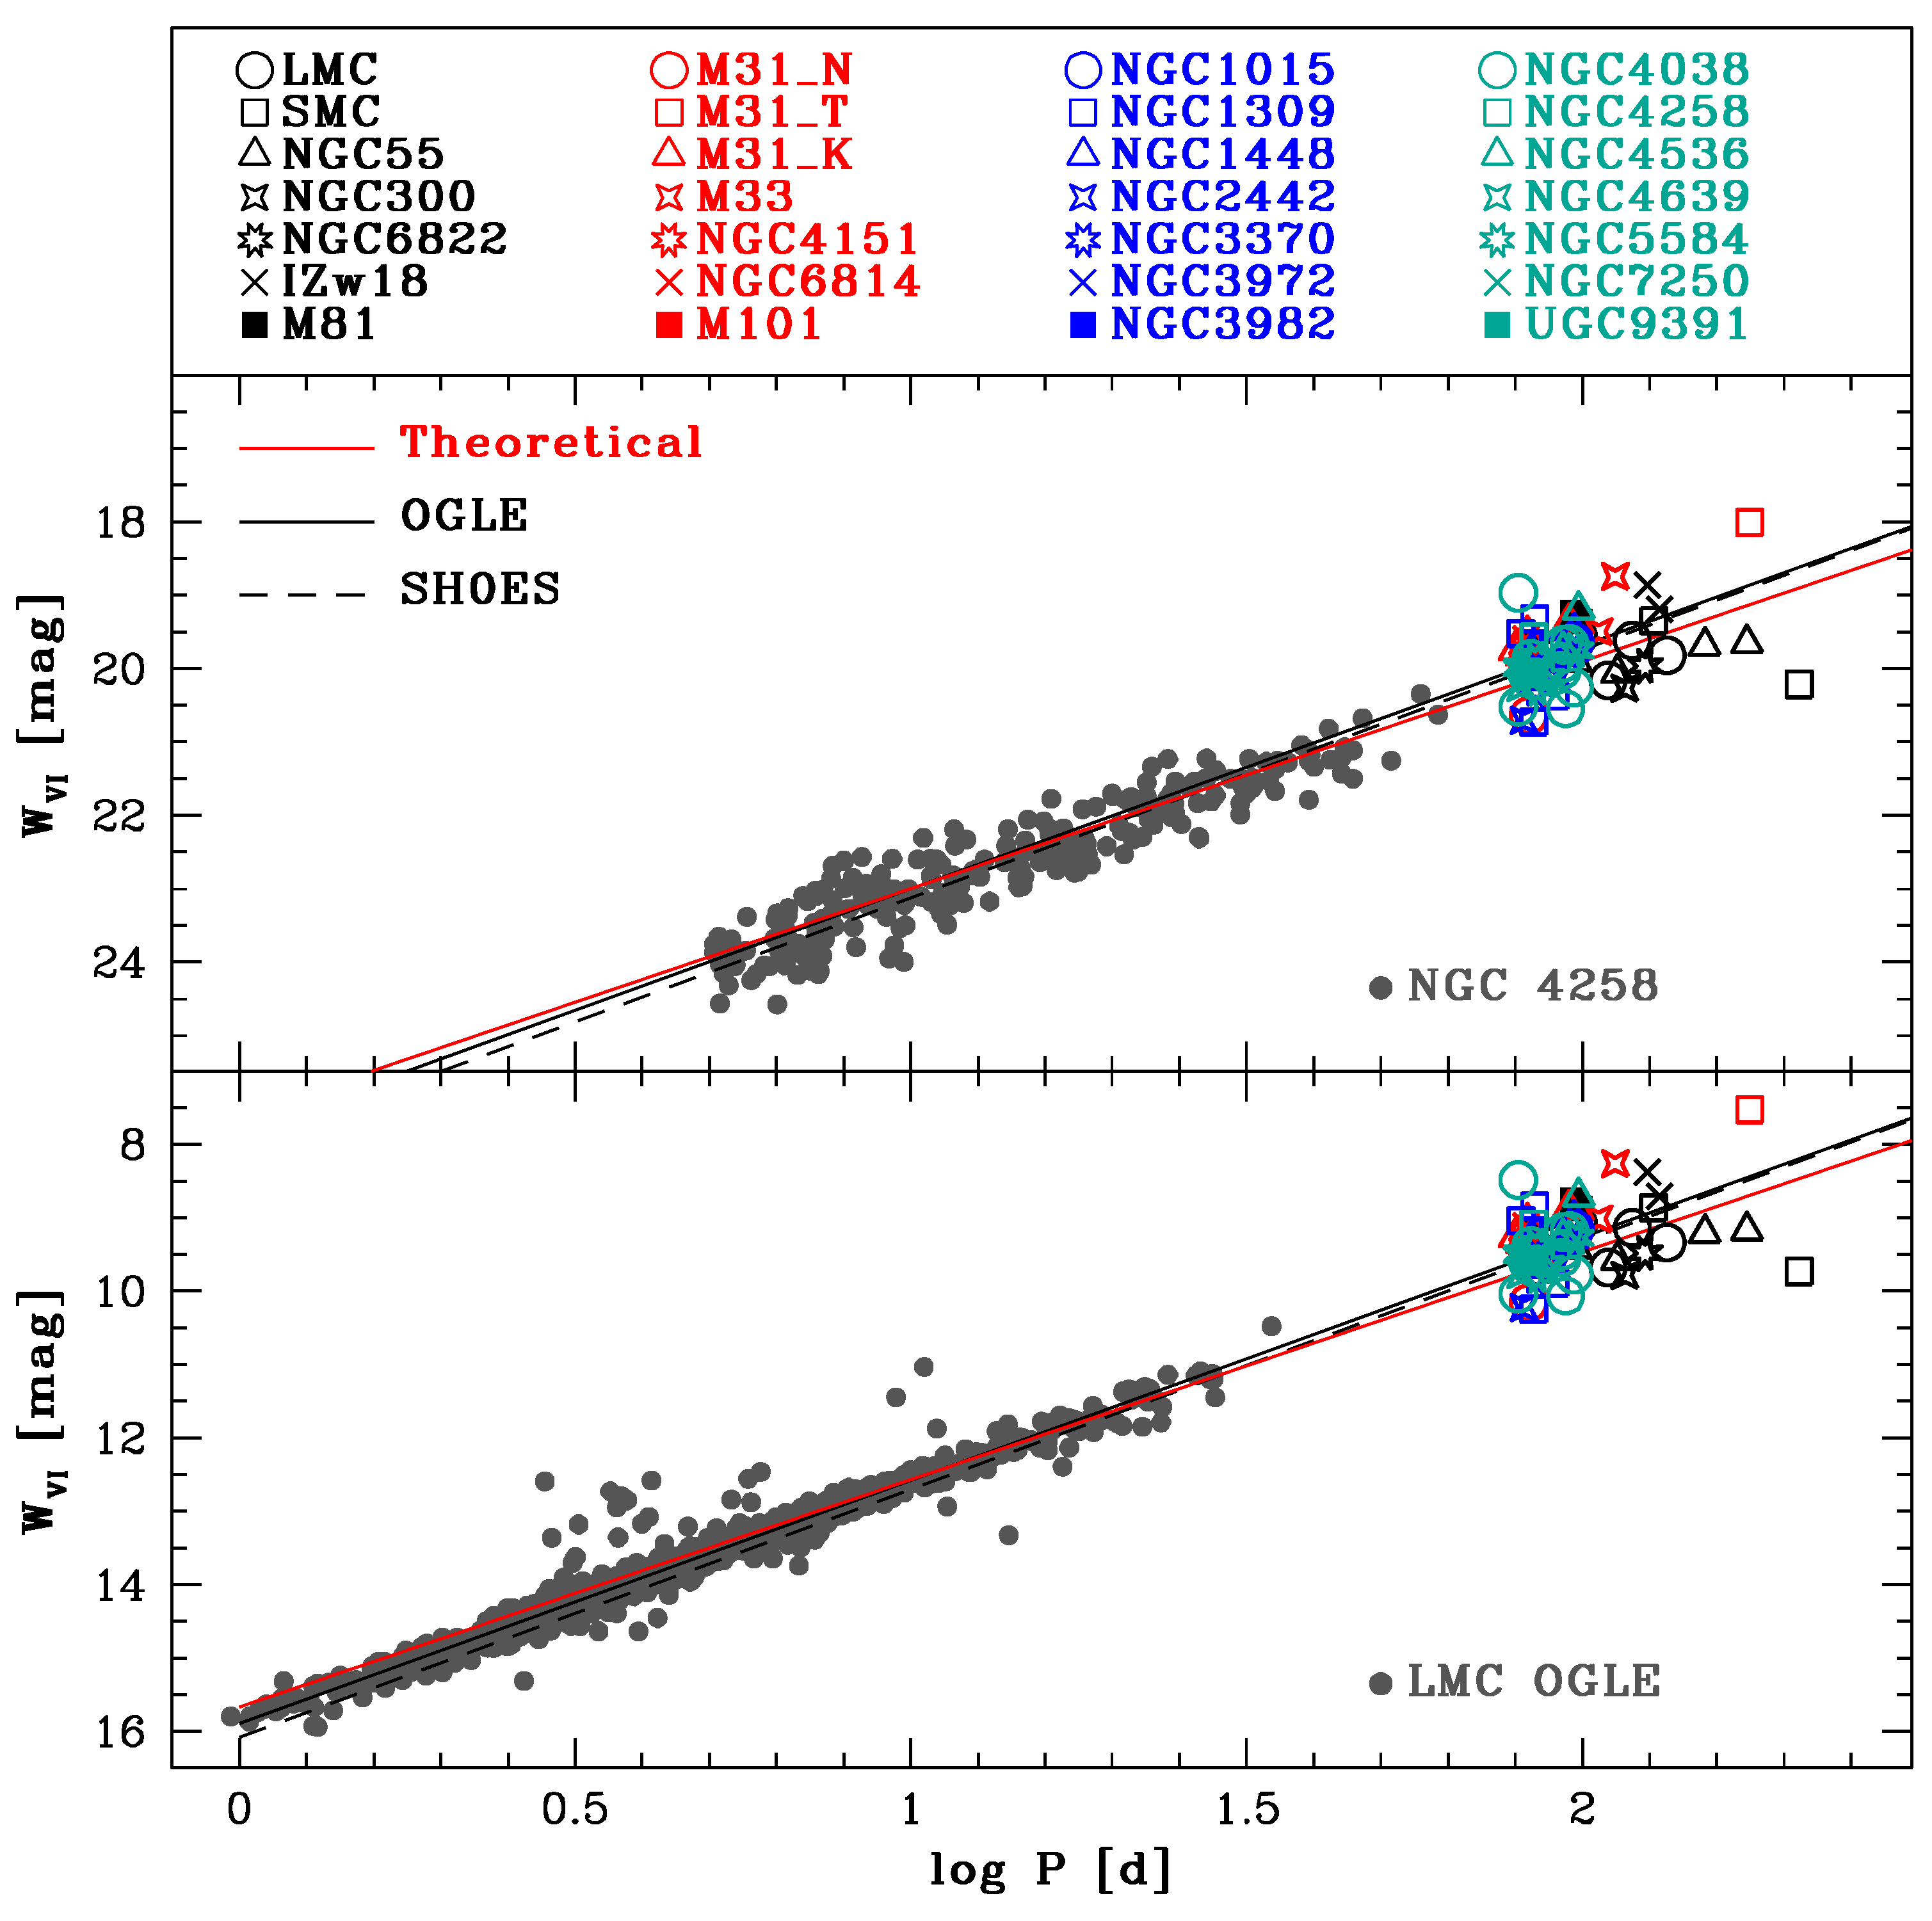
3. ULPs as Distance Indicators

A linear fit of the Wesenheit function versus the period, taking into account all the ULPs in Table 1, provides W V I = 1.84 ( ± 0.58 ) log P 5.42 ( ± 1.15 ) with σ = 0.42 (red dashed line in the upper panel of Figure 2), very different from the fit obtained by Musella et al. [20] ( W V I = 0.93 ( ± 0.58 ) log P 7.28 ( ± 1.15 ) with σ = 0.38 ). This difference is mainly due to the inclusion of the M31 ULP H42 in the total sample. Indeed, excluding this star from the fit, we obtain a slope of 1.08 ± 0.58 and a zero point of 7.01 ± 1.14 , in very good agreement with the results by Musella et al. [20]. This star, as said above, seems to have a peculiar behavior. In any case, this result confirms the hypothesis by Musella et al. [20] that the range log P > 2.15 is too poorly sampled, and this can determine a false trend for the Wesenheit relation. The relation for ULPs with log P 2.15 is W V I = 2.50 log P 4.23 with σ = 0.38 (slightly different, but within the errors, from that obtained by Musella et al. [20] with a smaller sample) and, taking into account only the SH0Es sample, W V I = 2.89 log P 3.42 with an intrinsic dispersion σ = 0.36 (red and blue solid lines in the upper panel of Figure 2, respectively). As pointed out in Musella et al. [20], the use of an homogeneous sample, such as the SH0ES one, allows us to exclude possible systematic errors due to different photometric systems and/or analysis methods. Nevertheless, the SH0ES sample shows a large dispersion too, thus confirming the blending effect as the most important uncertainty source. The obtained Wesenheit relations for the ULPs with log P 2.15 and for the SH0ES sample (very different from the almost flat slope of 0.05 by Bird et al. [9], dashed black line in the upper panel of Figure 2), in the range covered by the adopted ULPs, are very similar to each other and to the LMC OGLE CC relation [21].
A global fit, including both the ULPs and the LMC OGLE CCs, obtained a slope of 3.31 ± 0.01 ( σ = 0.15 mag), perfectly in agreement with the slope 3.314 ± 0.008 by Soszyński et al. [21]. This holds for both adopting all the ULPs with log P 2.15 and including only the SH0ES sample. Due to the large number of CC in the OGLE sample (2455), the obtained fit has a very small error of 0.01 mag. This result supports the hypothesis that the ULPs are the extension at higher mass and luminosity of CCs. In addition, a comparison of the global fit slope with that obtained adopting only the SH0ES ULPs, supports the great reliability of the latter homogeneous sample.

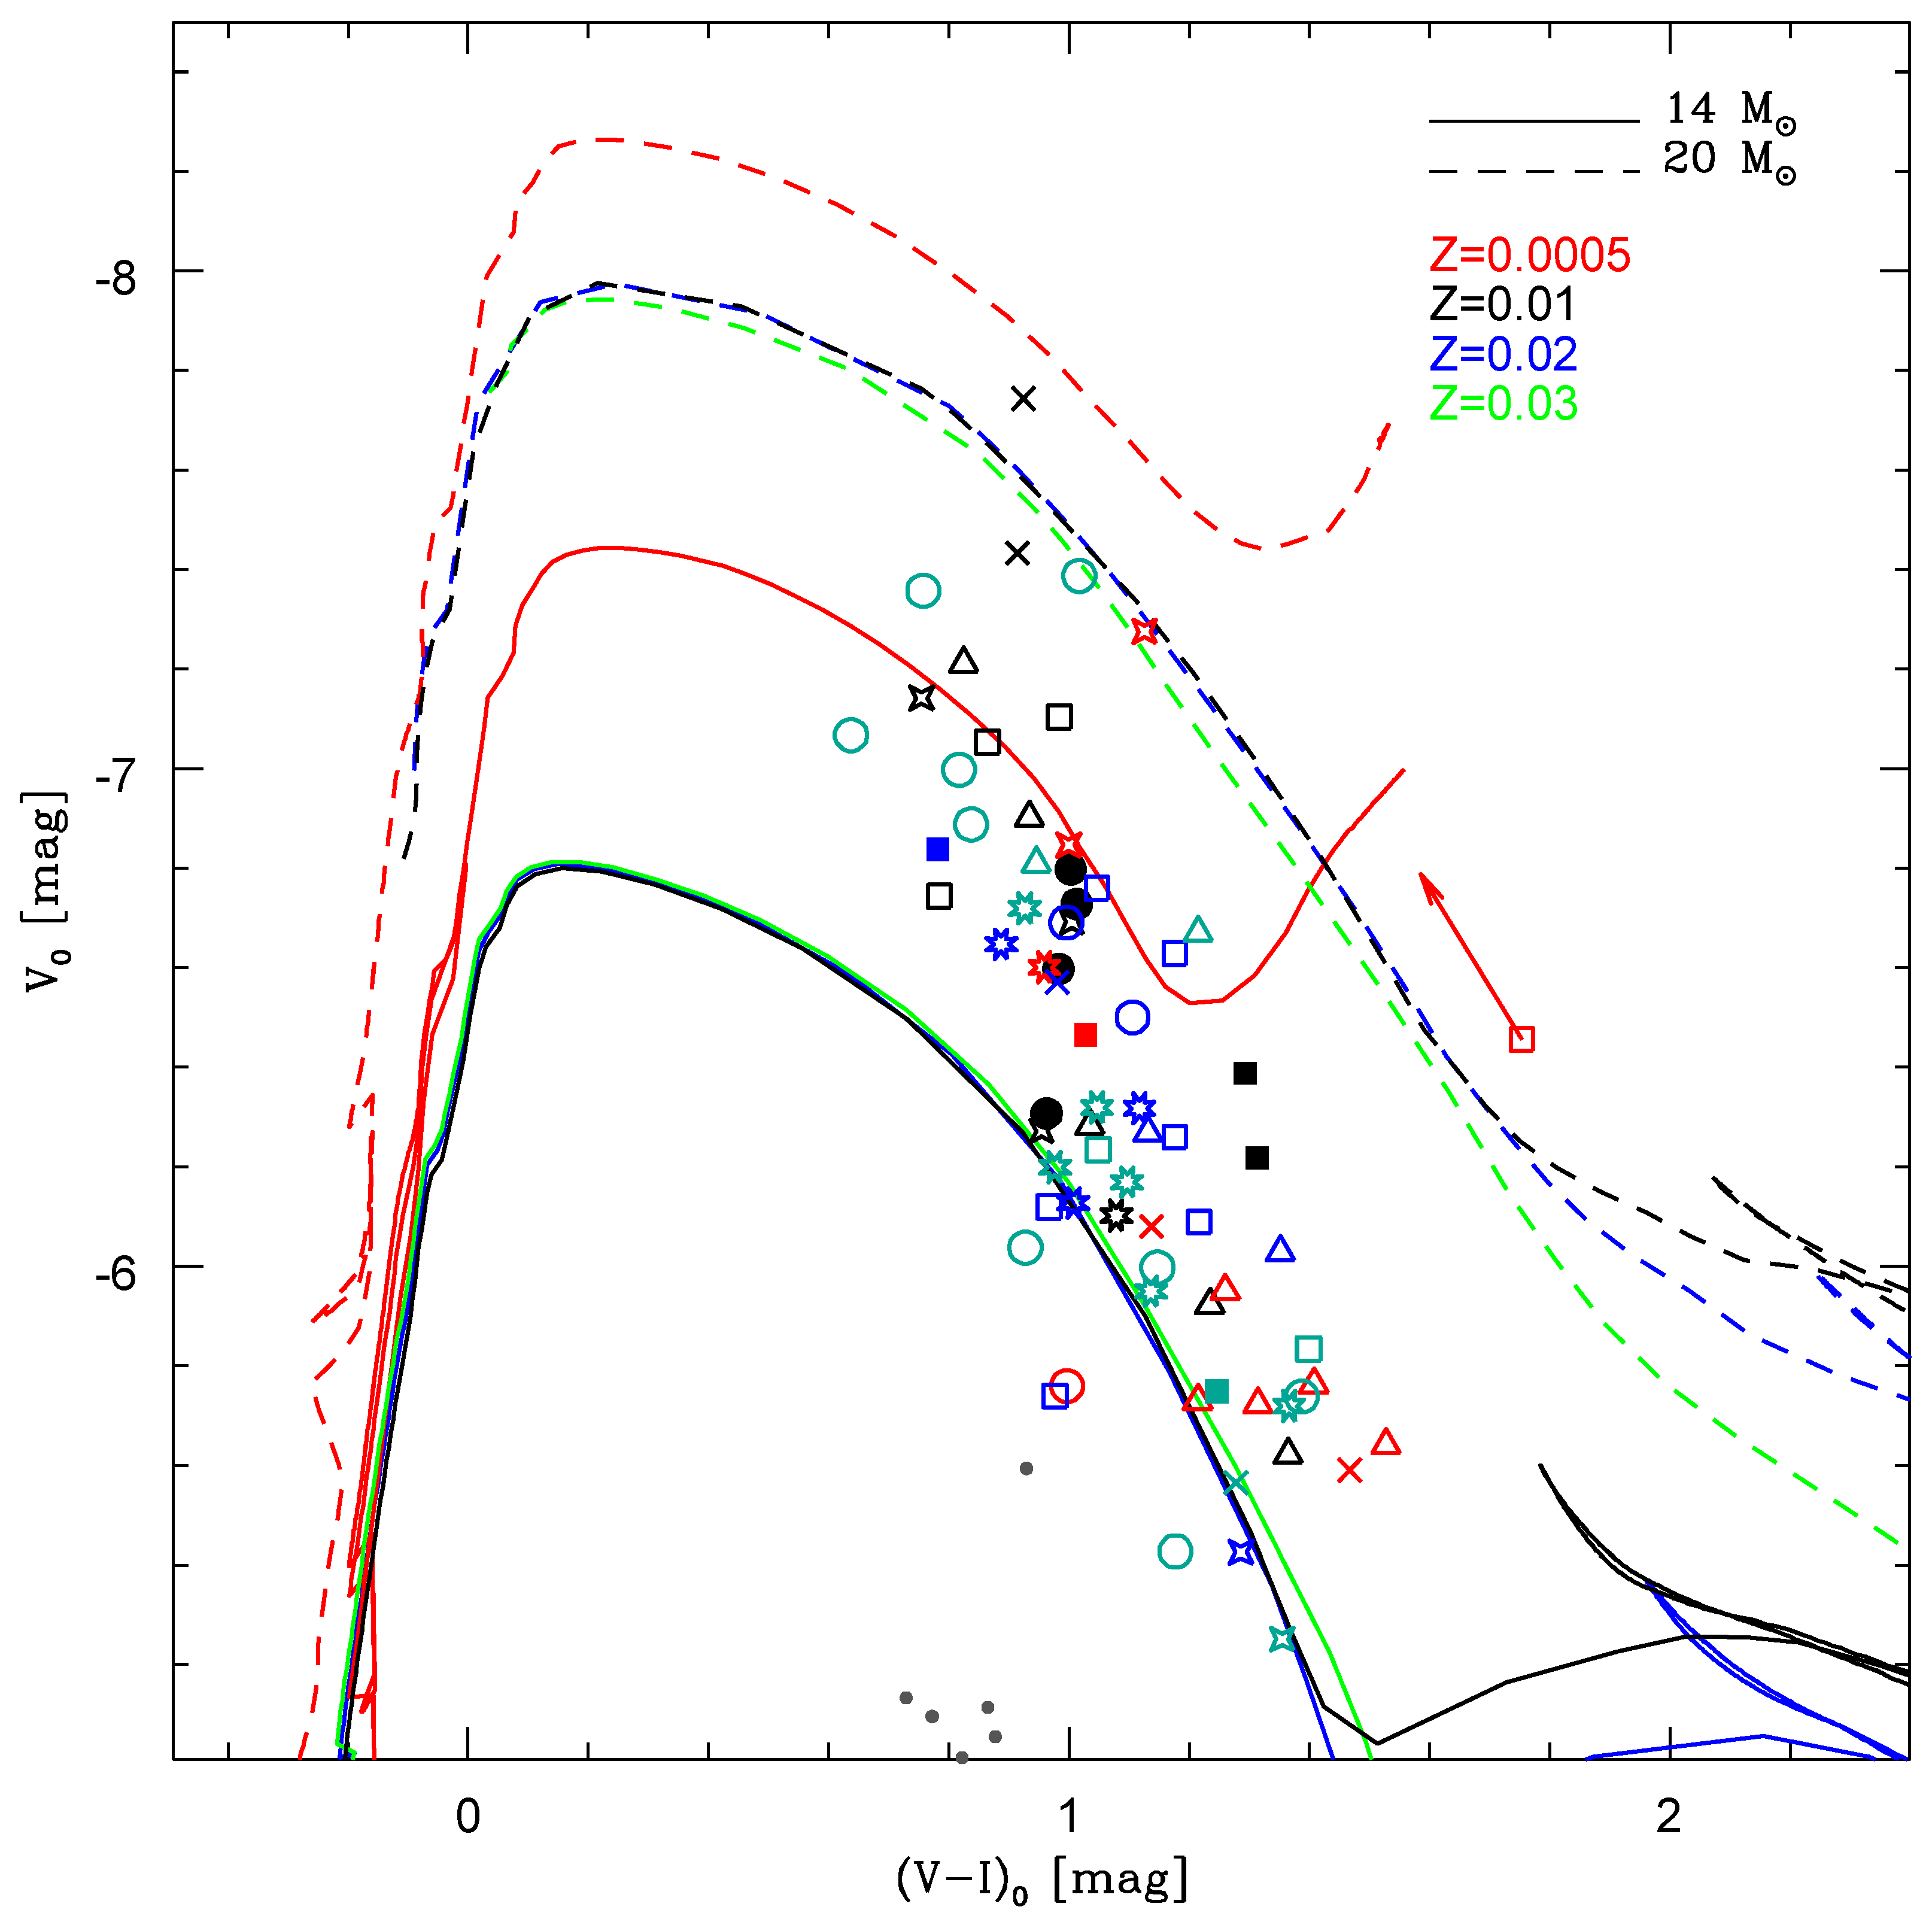
4. ULP Evolutionary Phase

In Figure 4, the position in the V 0 versus ( V I ) 0 color-magnitude diagram (CMD) of the ULPs in Table 1 (symbols as in Figure 1) is compared, in the left panel, with the CC LMC OGLE sample [21] (as in Figure 4 by [20]) and, in the right panel, with the NGC 4258 one [16,17]. The M31 ULP H42 is significantly redder than the rest of the sample. The red arrow in the figure indicates the position of this variable, adopting the specific color excess derived by Taneva et al. [19]. We notice that, even with this assumption, the position of H42 is anomalous. As pointed out by Musella et al. [20], in the CMD, ULPs seems to be the extension of the CCs at higher masses and luminosities (as found in the PW plane), but they appear to have a larger dispersion in color with respect to the LMC CC sample, with the brightest ULPs appearing to be bluer than expected. This trend is much less evident in the comparison with the NGC 4258 CC sample. In order to investigate if this color dispersion can represent an intrinsic property of the ULPs, Musella et al. [20] analyzed the dependence of log P , V 0 and ( V I ) 0 on metallicity in their Figure 5. The updated plots, with the 10 new ULPs included in this work are shown in Figure 5. Additionally, in this case, the red open square is the position of H42 using the M31 reddening, whereas the red arrow indicates the position of this ULP adopting the specific reddening obtained by Taneva et al. [19]. In any case, this peculiar variable shows an anomalous behavior for the dependence of log P and ( V I ) 0 on the metal abundance. As already pointed out by Musella et al. [20], the more metal-poor ULPs show longer periods and appear to be slightly bluer and brighter than the other ones, and this could partially justify the position in the CMD of some of the ULPs hosted in the SMC, NGC 55, NGC 300 and IZw18. However, no particular trend is shown if we take into account only the SH0ES ULPs that appear to cover a large range in colors and magnitudes. Due to its homogeneity, the SH0ES sample is more reliable than the others, but, unfortunately, it has a too narrow distribution in period and metallicity to obtain firm conclusions. It is also worth noting that, among the brightest ULPs, there are 5 NGC 4038 ULPs and that Lardo et al. [38] confirmed as solar the metallicity of this galaxy.

5. Comparison with Theoretical Models

A comparison with theoretical evolutionary and pulsational models can help to better understand and/or explain some behaviors.
In Figure 6 (as in Figure 6 in [20]), the location of all the ULPs is compared with the evolutionary tracks by Bressan et al. [39] (transformed to the Johnson filters through the web tool http://stev.oapd.inaf.it/YBC/index.html, accessed on 14 June 2022 [40]). In particular, we adopt as masses 14 (solid lines) and 20 M (dashed lines) that are the expected ULP mass range boundaries [9,10], and four Z values (0.005, 0.01, 0.02 and 0.03) representative of the metallicities in Table 1.
At these higher masses, unlike what happens for the CCs, the evolutionary models do not predict the blue loop crossing the instability strip. This finding represents a challenge for models. In this context, Bird et al. [9] hypothesized that the SMC ULP HV829 ( P = 84.4 d) was a “second crossing” Cepheid.
It is also worth noting that, taking into account the instability strip derived by recent and updated pulsational models by De Somma et al. [4], at these masses, the evolutionary times are much shorter than in CCs. In particular, the expected crossing times for a 14 and 20 M are about 2 and 1.2 Myr, respectively, and those for 6 and 11 M are 10 5 and 10 4 years, respectively; this implies that the probability to observe the ULPs is much lower than for the CCs.
In Figure 1, in addition to the observational Wesenheit relation, as in Musella et al. [20], it is also reported the theoretical metal-dependent Wesenheit relation W V I T = 2.67 3.1 log P + 0.08 log ( Z ) with a σ = 0.11 mag, derived by Fiorentino et al. [12] for Z = 0.01 (for this theoretical Wesenheit, the variation due to the assumption of a different metallicity in the range between 0.01 and 0.03 is not larger than 0.04 mag and hence negligible), to show that this relation is in very good agreement with the observational ones and that can be also adopted for the ULPs. The theoretical relation by Fiorentino et al. [12] was derived in the framework of a theoretical scenario based on the predictions of nonlinear convective pulsation models (see for example [12,15,41,42], and references therein) covering a large range of masses ( 3 M 13 M ) and chemical composition ( 0.0004 Z 0.04 and 0.25 Y 0.33 , refs [15,42,43], and references therein). The main peculiarity of these models is the possibility to predict all the pulsational observables of the variable stars, namely the period, the amplitude and the morphology of light curves and their dependence on the input parameters (see, for example [44,45], and references therein). On this basis, the model fitting of the observational light curve can allow us to derive individual distances, but also constrains the intrinsic stellar properties of the studied pulsating stars (see, for example [44,46,47], and references therein).
Marconi et al. [15] and Musella et al. [20] tried to apply this method to some ULPs with time-series data: the two IZw18 ULPs and the three M31 variables (8-0326 and 8-1498 and H42), respectively.
The two ULPs in IZw18 are the most metal poor of the sample and, as shown by Marconi et al. [15] and Fiorentino et al. [14], pulsational models do not predict the existence of such long period pulsators at these low metallicities (even if their light curve morphology is that typical of CCs). This model limitation prevented the application of the light curve fitting to these ULPs. According to Marconi et al. [15], these ULPs could represent a challenge for the most updated pulsational models, but additional data are needed in order to improve the accuracy of their periods and magnitudes and check their nature as ULPs. It is also worth noting that Fiorentino et al. [14] identified in IZw18 only three variable stars as possible CCs. One with a period of only 8.71 d and the 2 ULPs analyzed in this paper. They argued that the absence of CCs in the period range between 10 and 100 d, corresponding to a mass range from 6 to 20 M , could be just the signature of the lack of a star formation activity in the corresponding epochs [48]. This occurrence confirms the importance of variable stars and, in particular, of the ULPs as stellar population and star formation history tracers.
Analyzing the three M31 ULPs, Musella et al. [20] found that 8-1498 and H42 have a position in the CMD inconsistent with their measured period (even adopting for H42 its own color excess) and need, also in this case, additional observations to confirm their nature as ULPs. On the other hand, it was possible to apply the model fitting method to the variable 8-0326 (see [20], for details), simultaneously constraining the intrinsic stellar parameters and the individual distance modulus and absorption. The distance modulus obtained through this model fitting was found to be in agreement with that derived by the application of the V I Wesenheit but smaller than those obtained for M31 by de Grijs and Bono [31] and Wagner-Kaiser et al. [49]. In any case, we have to point out that, as already explained above, the variable 8-0326, having a period smaller than 80 d, cannot be properly considered as an ULP, but it has a long period CC.

6. Discussion

In this paper, a review of the ULP properties is presented to check their reliability as stellar standard candles and to understand if they represent the extension at higher mass and luminosity of the CCs, which are the most important distance indicators within the Local Group. Thanks to their high luminosity, the ULPs might allow us to reach the Hubble flow in one step, without using intermediate calibrators.
In particular, the ULP properties were analyzed in comparison with the CC ones in the PW plane and in the CMD and with the evolutionary and pulsational theoretical models.
The analyzed sample includes all the known variable classified by the authors as ULPs collected by Musella et al. [20] (only excluding the M31 variable 8-0326 classified as ULP by [18], but having a period smaller than 80 d) and 10 new candidates that in literature are not classified as ULPs, but as CCs. The total sample is composed by 72 objects observed in different galaxies and by different authors, including 18 ULPs collected by Bird et al. [9], 2 ULPs identified in M81 [11], 7 ULPs in M31 classified by [18], Taneva et al. [19] and Kodric et al. [23], 2 ULPs in M33 [22], 1 ULP in NGC 4151 Yuan et al. [24], 2 in NGC 6814 Bentz et al. [25] and 40 ULPs identified in 14 galaxies by Riess et al. [16] and Hoffmann et al. [17], in the framework of the SH0ES project [5]. This last sample is particularly important due to the homogeneity of the photometry and of the adopted analysis method. The metallicity 12 + log ( O / H ) range covered by all the collected ULPs is from ∼7.2 to 9.2 dex.
The ULP V I PW relation is compared with the CC ones in the two galaxies generally adopted as anchor of the extragalactic distance scale, namely LMC (OGLE, [21]) and NGC 4258 [16,17]. The results of this comparison show that the ULP and CC relations are very similar, even if the dispersion of the ULP PW is larger than the LMC and NGC 4258 ones. The observed spread does not appear to depend on the distance and metallicity of the host galaxy. It can be due to the use of different non-homogeneous samples, but also to a blending effect. Indeed, this dispersion is present also using the homogeneous SH0ES sample. On the other hand, the analysis shows that the use of an homogeneous sample gives a more robust and reliable result for the PW relation that, in the ULP period range, deviates at most by 0.05 mag from the LMC CC one, obtained by Soszyński et al. [21] (see blue and black lines in the upper panel of Figure 2).
The ULPs are located in the region of the CMD corresponding to the extension of the CC instability strip to higher luminosities, even if the ULPs show a distribution in color larger than CC ones, also taking into account only the photometrically homogeneous SH0ES sample. To understand if this large dispersion in the PW plane and in the CMD is intrinsic or due to some systematics, we need a larger and homogeneous sample of ULPs with a wide range in metallicity and, in the next future, an increase in the number of known ULPs is expected, thanks to the forthcoming Rubin-LSST survey (the 10-year Rubin Observatory Legacy Survey of Space and Time (LSST) of the southern sky will image billions of objects in six filters (ugrizy), collecting about 800 images of each location in the sky, providing data of unprecedented quality, fully covering the spatial and the temporal domains) [50] that will begin in the 2024.
Additionally, the comparison with evolutionary and pulsational models raises a number of questions. Indeed, the evolutionary models do not predict the blue loop typical of the CCs in the region occupied by the ULPs, and the pulsational models do not predict the existence of such long pulsators at such high masses and luminosities, particularly in the very low metallicity regime, as for the 2 IZw18 ULPs. These results, therefore, might also pose a challenge to the evolutionary and pulsational theories that need to interpret the observed behaviors, taking into account all the constraints imposed by these pulsators.

Funding

We acknowledge partial financial support from the INAF Main Stream SSH program, 1.05.01.86.28. This work has made use of the VizieR database, operated at CDS, Strasbourg, France.

Institutional Review Board Statement

Not applicable.

Informed Consent Statement

Not applicable.

Data Availability Statement

Not applicable.

Conflicts of Interest

The authors declare no conflict of interest.

References

  1. Freedman, W.L.; Madore, B.F.; Gibson, B.K.; Ferrarese, L.; Kelson, D.D.; Sakai, S.; Mould, J.R.; Kennicutt, R.C., Jr.; Ford, H.C.; Graham, J.A.; et al. Final Results from the Hubble Space Telescope Key Project to Measure the Hubble Constant. Astrophys. J. 2001, 553, 47–72. [Google Scholar] [CrossRef]
  2. Altavilla, G.; Fiorentino, G.; Marconi, M.; Musella, I.; Cappellaro, E.; Barbon, R.; Benetti, S.; Pastorello, A.; Riello, M.; Turatto, M.; et al. Cepheid calibration of Type Ia supernovae and the Hubble constant. Mon. Not. R. Astron. Soc. 2004, 349, 1344–1352. [Google Scholar] [CrossRef]
  3. Di Criscienzo, M.; Caputo, F.; Marconi, M.; Musella, I. RR Lyrae-based calibration of the Globular Cluster Luminosity Function. Mon. Not. R. Astron. Soc. 2006, 365, 1357–1366. [Google Scholar] [CrossRef] [Green Version]
  4. De Somma, G.; Marconi, M.; Molinaro, R.; Cignoni, M.; Musella, I.; Ripepi, V. An Extended Theoretical Scenario for Classical Cepheids. I. Modeling Galactic Cepheids in the Gaia Photometric System. Astrophys. J. Suppl. Ser. 2020, 247, 30. [Google Scholar] [CrossRef] [Green Version]
  5. Riess, A.G.; Macri, L.; Casertano, S.; Lampeitl, H.; Ferguson, H.C.; Filippenko, A.V.; Jha, S.W.; Li, W.; Chornock, R. A 3% Solution: Determination of the Hubble Constant with the Hubble Space Telescope and Wide Field Camera 3. Astrophys. J. 2011, 730, 119. [Google Scholar] [CrossRef] [Green Version]
  6. Fiorentino, G.; Annibali, F.; Clementini, G.; Ramos, R.C.; Marconi, M.; Musella, I.; Saha, A.; Tosi, M.; Aloisi, A.; van der Marel, R. Ultralong-period Cepheids: A possible primary distance indicator? In Advancing the Physics of Cosmic Distances; de Grijs, R., Ed.; IAU Symposium: Paris, France, 2013; Volume 289, pp. 282–286. [Google Scholar]
  7. Anderson, R.I.; Riess, A.G. On Cepheid Distance Scale Bias Due to Stellar Companions and Cluster Populations. Astrophys. J. 2018, 861, 36. [Google Scholar] [CrossRef]
  8. Verde, L.; Treu, T.; Riess, A.G. Tensions between the early and late Universe. Nat. Astron. 2019, 3, 891–895. [Google Scholar] [CrossRef]
  9. Bird, J.C.; Stanek, K.Z.; Prieto, J.L. Using Ultra Long Period Cepheids to Extend the Cosmic Distance Ladder to 100 Mpc and Beyond. Astrophys. J. 2009, 695, 874–882. [Google Scholar] [CrossRef] [Green Version]
  10. Fiorentino, G.; Clementini, G.; Marconi, M.; Musella, I.; Saha, A.; Tosi, M.; Contreras Ramos, R.; Annibali, F.; Aloisi, A.; van der Marel, R. Ultra long period Cepheids: A primary standard candle out to the Hubble flow. Astrophys. Space Sci. 2012, 341, 143–150. [Google Scholar] [CrossRef] [Green Version]
  11. Gerke, J.R.; Kochanek, C.S.; Prieto, J.L.; Stanek, K.Z.; Macri, L.M. A Study of Cepheids in M81 with the Large Binocular Telescope (Efficiently Calibrated with Hubble Space Telescope). Astrophys. J. 2011, 743, 176. [Google Scholar] [CrossRef] [Green Version]
  12. Fiorentino, G.; Marconi, M.; Musella, I.; Caputo, F. Classical Cepheid pulsation models. XI. Effects of convection and chemical composition on the period-luminosity and period-Wesenheit relations. Astron. Astrophys. 2007, 476, 863–879. [Google Scholar] [CrossRef] [Green Version]
  13. Bono, G.; Caputo, F.; Fiorentino, G.; Marconi, M.; Musella, I. Cepheids in External Galaxies. I. The Maser-Host Galaxy NGC 4258 and the Metallicity Dependence of Period-Luminosity and Period-Wesenheit Relations. Astrophys. J. 2008, 684, 102–117. [Google Scholar] [CrossRef] [Green Version]
  14. Fiorentino, G.; Contreras Ramos, R.; Clementini, G.; Marconi, M.; Musella, I.; Aloisi, A.; Annibali, F.; Saha, A.; Tosi, M.; van der Marel, R.P. Multi-Epoch Hubble Space Telescope Observations of IZw18: Characterization of Variable Stars at Ultra-Low Metallicities. Astrophys. J. 2010, 711, 808–817. [Google Scholar] [CrossRef] [Green Version]
  15. Marconi, M.; Musella, I.; Fiorentino, G.; Clementini, G.; Aloisi, A.; Annibali, F.; Contreras Ramos, R.; Saha, A.; Tosi, M.; van der Marel, R.P. Pulsation Models for Ultra-low (Z = 0.0004) Metallicity Classical Cepheids. Astrophys. J. 2010, 713, 615–625. [Google Scholar] [CrossRef] [Green Version]
  16. Riess, A.G.; Macri, L.M.; Hoffmann, S.L.; Scolnic, D.; Casertano, S.; Filippenko, A.V.; Tucker, B.E.; Reid, M.J.; Jones, D.O.; Silverman, J.M.; et al. A 2.4% Determination of the Local Value of the Hubble Constant. Astrophys. J. 2016, 826, 56. [Google Scholar] [CrossRef]
  17. Hoffmann, S.L.; Macri, L.M.; Riess, A.G.; Yuan, W.; Casertano, S.; Foley, R.J.; Filippenko, A.V.; Tucker, B.E.; Chornock, R.; Silverman, J.M.; et al. Optical Identification of Cepheids in 19 Host Galaxies of Type Ia Supernovae and NGC 4258 with the Hubble Space Telescope. Astrophys. J. 2016, 830, 10. [Google Scholar] [CrossRef] [Green Version]
  18. Ngeow, C.C.; Lee, C.H.; Yang, M.T.C.; Lin, C.S.; Hsiao, H.Y.; Cheng, Y.C.; Lin, Z.Y.; Lin, I.L.; Kanbur, S.M.; Ip, W.H. VI-Band Follow-Up Observations of Ultra-Long-Period Cepheid Candidates in M31. Astron. J. 2015, 149, 66. [Google Scholar] [CrossRef] [Green Version]
  19. Taneva, N.; Valcheva, A.; Petrov, G.P.; Nedialkov, P. Ultra long period Cepheid H 42 in M 31. Bulg. Astron. J. 2020, 33, 75. [Google Scholar]
  20. Musella, I.; Marconi, M.; Molinaro, R.; Fiorentino, G.; Ripepi, V.; De Somma, G.; Moretti, M.I. New insights into the use of Ultra Long Period Cepheids as cosmological standard candles. Mon. Not. R. Astron. Soc. 2021, 501, 866–874. [Google Scholar] [CrossRef]
  21. Soszyński, I.; Udalski, A.; Szymański, M.K.; Skowron, D.; Pietrzyński, G.; Poleski, R.; Pietrukowicz, P.; Skowron, J.; Mróz, P.; Kozłowski, S.; et al. The OGLE Collection of Variable Stars. Classical Cepheids in the Magellanic System. Acta Astron. 2015, 65, 297–312. [Google Scholar]
  22. Pellerin, A.; Macri, L.M. The M 33 Synoptic Stellar Survey. I. Cepheid Variables. Astrophys. J. Suppl. Ser. 2011, 193, 26. [Google Scholar] [CrossRef] [Green Version]
  23. Kodric, M.; Riffeser, A.; Hopp, U.; Goessl, C.; Seitz, S.; Bender, R.; Koppenhoefer, J.; Obermeier, C.; Snigula, J.; Lee, C.H.; et al. Cepheids in M31: The PAndromeda Cepheid Sample. Astron. J. 2018, 156, 130. [Google Scholar] [CrossRef]
  24. Yuan, W.; Fausnaugh, M.M.; Hoffmann, S.L.; Macri, L.M.; Peterson, B.M.; Riess, A.G.; Bentz, M.C.; Brown, J.S.; Bontà, E.D.; Davies, R.I.; et al. The Cepheid Distance to the Seyfert 1 Galaxy NGC 4151. Astrophys. J. 2020, 902, 26. [Google Scholar] [CrossRef]
  25. Bentz, M.C.; Ferrarese, L.; Onken, C.A.; Peterson, B.M.; Valluri, M. A Cepheid-based Distance to the Seyfert Galaxy NGC 6814. Astrophys. J. 2019, 885, 161. [Google Scholar] [CrossRef] [Green Version]
  26. Tonry, J.L.; Stubbs, C.W.; Lykke, K.R.; Doherty, P.; Shivvers, I.S.; Burgett, W.S.; Chambers, K.C.; Hodapp, K.W.; Kaiser, N.; Kudritzki, R.P.; et al. The Pan-STARRS1 Photometric System. Astrophys. J. 2012, 750, 99. [Google Scholar] [CrossRef] [Green Version]
  27. Harris, W.E. Transformation of HST WFC3/UVIS Filters to the Standard BVI System. Astrophys. J. 2018, 156, 296. [Google Scholar] [CrossRef]
  28. Landolt, A.U. UBVRI Photometric Standard Stars in the Magnitude Range 11.5 < V < 16.0 Around the Celestial Equator. Astrophys. J. 1992, 104, 340. [Google Scholar]
  29. Musella, I.; Di Criscienzo, M.; Marconi, M.; Raimondo, G.; Ripepi, V.; Cignoni, M.; Bono, G.; Brocato, E.; Dall’Ora, M.; Ferraro, I.; et al. The STREGA survey—II. Globular cluster Palomar 12. Mon. Not. R. Astron. Soc. 2018, 473, 3062–3071. [Google Scholar] [CrossRef] [Green Version]
  30. Musella, I.; Di Criscienzo, M.; Marconi, M.; Raimondo, G.; Ripepi, V.; Cignoni, M.; Bono, G.; Brocato, E.; Dall’Ora, M.; Ferraro, I.; et al. Erratum: The STREGA survey—II. Globular cluster Palomar 12. Mon. Not. R. Astron. Soc. 2021, 502, 3964. [Google Scholar] [CrossRef]
  31. de Grijs, R.; Bono, G. Clustering of Local Group Distances: Publication Bias or Correlated Measurements? II. M31 and Beyond. Astrophys. J. 2014, 148, 17. [Google Scholar] [CrossRef] [Green Version]
  32. Lee, C.H.; Ngeow, C.C.; Yang, M.T.C.; Ip, W.H.; Kwok-Hing Kong, A.; Laher, R.R.; Surace, J. Using the Palomar Transient Factory to Search for Ultra-Long-Period Cepheid Candidates in M31. arXiv 2013, arXiv:1309.5127. [Google Scholar]
  33. Gregersen, D.; Seth, A.C.; Williams, B.F.; Lang, D.; Dalcanton, J.J.; Girardi, L.; Skillman, E.D.; Bell, E.; Dolphin, A.E.; Fouesneau, M.; et al. Panchromatic Hubble Andromeda Treasury. XII. Mapping Stellar Metallicity Distributions in M31. Astrophys. J. 2015, 150, 189. [Google Scholar] [CrossRef]
  34. Ryder, S.D.; Fenner, Y.; Gibson, B.K. Stellar abundance gradients in galactic discs—I. Method and spectral line gradients. Mon. Not. R. Astron. Soc. 2005, 358, 1337–1351. [Google Scholar] [CrossRef] [Green Version]
  35. Schlafly, E.F.; Finkbeiner, D.P. Measuring Reddening with Sloan Digital Sky Survey Stellar Spectra and Recalibrating SFD. Astrophys. J. 2011, 737, 103. [Google Scholar] [CrossRef]
  36. Mortsell, E.; Goobar, A.; Johansson, J.; Dhawan, S. Sensitivity of the Hubble Constant Determination to Cepheid Calibration. arXiv 2021, arXiv:2105.11461. [Google Scholar]
  37. Perivolaropoulos, L.; Skara, F. Hubble tension or a transition of the Cepheid SnIa calibrator parameters? Phys. Rev. D 2021, 104, 123511. [Google Scholar] [CrossRef]
  38. Lardo, C.; Davies, B.; Kudritzki, R.P.; Gazak, J.Z.; Evans, C.J.; Patrick, L.R.; Bergemann, M.; Plez, B. Red Supergiants as Cosmic Abundance Probes: The First Direct Metallicity Determination of NGC 4038 in the Antennae. Astrophys. J. 2015, 812, 160. [Google Scholar] [CrossRef]
  39. Bressan, A.; Marigo, P.; Girardi, L.; Salasnich, B.; Dal Cero, C.; Rubele, S.; Nanni, A. PARSEC: Stellar tracks and isochrones with the PAdova and TRieste Stellar Evolution Code. Mon. Not. R. Astron. Soc. 2012, 427, 127–145. [Google Scholar] [CrossRef] [Green Version]
  40. Chen, Y.; Girardi, L.; Fu, X.; Bressan, A.; Aringer, B.; Dal Tio, P.; Pastorelli, G.; Marigo, P.; Costa, G.; Zhang, X. YBC: A stellar bolometric corrections database with variable extinction coefficients. Application to PARSEC isochrones. Astron. Astrophys. 2019, 632, A105. [Google Scholar] [CrossRef]
  41. Caputo, F.; Marconi, M.; Musella, I. Theoretical models for classical Cepheids. V. Multiwavelength relations. Astron. Astrophys. 2000, 354, 610–620. [Google Scholar]
  42. Marconi, M.; Musella, I.; Fiorentino, G. Cepheid Pulsation Models at Varying Metallicity and ΔY/ΔZ. Astrophys. J. 2005, 632, 590–610. [Google Scholar] [CrossRef] [Green Version]
  43. Fiorentino, G.; Caputo, F.; Marconi, M.; Musella, I. Theoretical Models for Classical Cepheids. VIII. Effects of Helium and Heavy-Element Abundance on the Cepheid Distance Scale. Astrophys. J. 2002, 576, 402–412. [Google Scholar] [CrossRef]
  44. Natale, G.; Marconi, M.; Bono, G. Theoretical Fits of the δ Cephei Light, Radius, and Radial Velocity Curves. Astrophys. J. Lett. 2008, 674, L93. [Google Scholar] [CrossRef]
  45. Marconi, M.; Molinaro, R.; Ripepi, V.; Cioni, M.R.L.; Clementini, G.; Moretti, M.I.; Ragosta, F.; de Grijs, R.; Groenewegen, M.A.T.; Ivanov, V.D. The VMC survey—XXIII. Model fitting of light and radial velocity curves of Small Magellanic Cloud classical Cepheids. Mon. Not. R. Astron. Soc. 2017, 466, 3206–3216. [Google Scholar] [CrossRef] [Green Version]
  46. Marconi, M.; Molinaro, R.; Ripepi, V.; Musella, I.; Brocato, E. Theoretical fit of Cepheid light a radial velocity curves in the Large Magellanic Cloud cluster NGC 1866. Mon. Not. R. Astron. Soc. 2013, 428, 2185–2197. [Google Scholar] [CrossRef] [Green Version]
  47. Ragosta, F.; Marconi, M.; Molinaro, R.; Ripepi, V.; Cioni, M.R.L.; Moretti, M.I.; Groenewegen, M.A.T.; Choudhury, S.; de Grijs, R.; van Loon, J.T.; et al. The VMC survey—XXXV. model fitting of LMC Cepheid light curves. Mon. Not. R. Astron. Soc. 2019, 490, 4975–4984. [Google Scholar] [CrossRef] [Green Version]
  48. Aloisi, A.; Clementini, G.; Tosi, M.; Annibali, F.; Contreras, R.; Fiorentino, G.; Mack, J.; Marconi, M.; Musella, I.; Saha, A.; et al. I Zw 18 Revisited with HST ACS and Cepheids: New Distance and Age. Astrophys. J. Lett. 2007, 667, L151–L154. [Google Scholar] [CrossRef] [Green Version]
  49. Wagner-Kaiser, R.; Sarajedini, A.; Dalcanton, J.J.; Williams, B.F.; Dolphin, A. Panchromatic Hubble Andromeda Treasury XIII: The Cepheid period-luminosity relation in M31. Mon. Not. R. Astron. Soc. 2015, 451, 724–738. [Google Scholar] [CrossRef] [Green Version]
  50. Ivezić, Ž.; Kahn, S.M.; Tyson, J.A.; Abel, B.; Acosta, E.; Allsman, R.; Alonso, D.; AlSayyad, Y.; Anderson, S.F.; Andrew, J.; et al. LSST: From Science Drivers to Reference Design and Anticipated Data Products. Astrophys. J. 2019, 873, 111. [Google Scholar] [CrossRef]
Figure 1. W V I of the ULPs in Table 1 compared with NGC 4258 (grey dots in the upper panel; [16,17]) and LMC OGLE (grey dots in the bottom panel; [21]) CC samples, respectively. The black dashed line and the black solid in the bottom one represent the V I Wesenheit obtained by the SH0ES project [16] and by Soszyński et al. [21] for the LMC OGLE CC sample, respectively. The red line represents the theoretical metal dependent W V I T for the CCs obtained by Fiorentino et al. [12], adopting Z = 0.01 (see Section 5 for details). The symbols adopted for the ULPs are labeled in the figure.
Universe 08 00335 g001
Figure 2. Upper panel: V I Wesenheit of the ULPs in Table 1 placed at the LMC distance. The black solid and dashed lines are the W V I relations by OGLE [21] and Bird et al. [9], respectively. The dashed and solid red lines and the blue line are the relations obtained by using all the ULPs, those with l o g P < 2.15 and only the SH0ES sample, respectively (see text for details). Lower panel: The differences between the observational Wesenheit of the ULPs, W V I , and that obtained adopting the OGLE relation [21], W L M C , are plotted as a function of the l o g P . In both panels, the adopted symbols for the ULPs are the same as in Figure 1.
Universe 08 00335 g002
Figure 3. The differences between the observational Wesenheit of the ULPs, W V I , and that obtained adopting the OGLE relation [21], W L M C , are plotted as a function of the host galaxy distance modulus (upper panel) and metallicity (lower panel), respectively. The adopted symbols for the ULPs are the same as in Figure 1.
Universe 08 00335 g003aUniverse 08 00335 g003b
Figure 4. CMD V 0 versus ( V I ) 0 for the ULPs in Table 1 compared on the left panel with the LMC OGLE CCs (grey dots) and on the right with the NGC 4258 ones (grey dots). The symbols for the ULPs are the same as those adopted in Figure 1. The red arrow indicates the position of H42 adopting the specific color excess derived by Taneva et al. [19] instead of the M31 one by Schlafly and Finkbeiner [35] reported in Table 1 (see text for details).
Universe 08 00335 g004
Figure 5. Dependence on the metal abundance of period (upper panel), absolute color (middle panel) and magnitude (bottom panel) of the ULPs in Table 1. The adopted symbols for the ULPs are the same in Figure 1, whereas the red arrow is explained in Figure 4.
Universe 08 00335 g005
Figure 6. CMD V 0 versus ( V I ) 0 for our ULP sample (the symbols for the ULPs are the same as adopted in Figure 1, whereas the red arrow is explained in Figure 4). The stellar tracks for 14 (solid line) and 20 (dashed line) M and for different metallicities ranging between Z = 0.0005 and 0.03 are plotted (see labels in figure).
Universe 08 00335 g006
Table 1. List of all known candidate ULPs.
GalaxyPeriodVI W VI μ 0 E ( B V ) O / H Z
(d)(mag)(mag)(mag)(mag)(mag)(dex)
Bird Sample
LMC118.711.9910.879.1318.500.078.396∼0.008
LMC109.212.4111.349.6818.500.078.396∼0.008
LMC98.611.9210.819.0918.500.078.396∼0.008
LMC133.612.1211.039.3418.500.078.396∼0.008
SMC210.412.2811.4510.1618.930.037.982∼0.002
SMC127.511.9210.899.2918.930.037.982∼0.002
SMC84.411.9711.069.6518.930.037.982∼0.002
NGC55175.919.2518.4117.1126.430.018.053∼0.003
NGC55152.119.5618.6117.1426.430.018.053∼0.003
NGC55112.720.1819.1317.5026.430.018.053∼0.003
NGC5597.720.5419.2917.3526.430.018.053∼0.003
NGC5585.120.8419.4617.3226.430.018.053∼0.003
NGC300115.820.1319.1617.6626.370.018.255∼0.004
NGC30089.119.7118.6917.1126.370.018.255∼0.004
NGC30083.019.2618.4917.3026.370.018.255∼0.004
NGC6822123.917.8616.4614.2923.310.218.114∼0.003
IZw18130.323.9623.0021.5131.30.037.211∼0.0004
IZw18125.023.6522.6821.1831.30.037.211∼0.0004
M81 ULPs
M8196.821.5220.1217.9527.690.078.77∼0.013
M8198.9821.6920.2718.0727.690.078.77∼0.013
M31_N ULP
M3183.1818.8617.7816.1224.460.059.03∼0.02
M31_T ULP
M31177.3218.1616.3313.4924.460.058.81∼0.01
M31_K ULPs
M3179.3518.791.39815.2224.460.058.84∼0.01
M3181.3519.081.48315.3024.460.059.09∼0.02
M3182.7419.071.59115.0124.460.058.98∼0.02
M3188.4519.011.35215.5624.460.059.05∼0.02
M3195.37719.131.68114.8424.460.058.97∼0.02
M33 ULPs
M33105.80018.2551.16815.2824.760.118.396∼0.008
M33111.97517.8261.29414.5324.760.118.396∼0.008
NGC 4151 ULP
NGC415182.60824.6191.07221.8930.990.074
NGC6814 ULPs
NGC681483.5725.831.2522.6431.680.0748.98∼0.02
NGC681482.4726.321.5822.2931.680.0748.98∼0.02
SH0ES sample
M10181.5222.7021.6620.0529.140.0089.1500.028
NGC101587.3325.9024.8623.2532.500.0298.7040.010
NGC101597.4926.0924.9423.1632.500.0299.0330.022
NGC130980.8925.8724.7723.0632.520.0359.1150.026
NGC130984.5426.8925.8624.2632.520.0358.8850.015
NGC130984.8926.0024.7722.8632.520.0359.0070.020
NGC130990.5926.5425.2723.3032.520.0358.7810.012
NGC130990.7126.3725.1423.2332.520.0358.8380.014
NGC130990.9126.5125.4923.9132.520.0359.0610.023
NGC144893.3525.0823.9322.1531.310.0128.8520.014
NGC144897.2025.3223.9521.8331.310.0128.8490.014
NGC244281.8427.9026.0723.2331.510.1799.0760.024
NGC244291.5726.6425.0822.6631.510.1798.8780.015
NGC337084.9226.0324.9823.3532.070.0289.0290.021
NGC337088.1625.5124.5823.1432.070.0288.7560.011
NGC337096.1025.8424.6822.8832.070.0288.7980.013
NGC397285.6225.0624.0622.5131.590.0138.8780.015
NGC398283.3024.9424.1422.9031.740.0129.0740.024
NGC403880.2624.0322.9521.2831.290.0419.0460.022
NGC403880.2725.9924.7522.8331.290.0419.0650.023
NGC403883.7524.4223.5422.1831.290.0419.1050.025
NGC403893.0725.4224.2122.3331.290.0419.0550.023
NGC403893.3524.5323.6322.2431.290.0419.0100.020
NGC403893.5725.6824.2321.9831.290.0418.9370.017
NGC403894.4025.3824.3922.8631.290.0419.0260.021
NGC403895.6424.0623.2421.9731.290.0419.0710.024
NGC403897.1124.3523.6522.5731.290.0419.0940.025
NGC425883.2623.2022.1320.4729.390.0148.7430.011
NGC425884.6223.6022.1819.9829.390.0148.7700.012
NGC453693.6224.1523.1821.6830.910.0168.9050.016
NGC453698.7724.2923.0521.1330.910.0168.8870.015
NGC463981.0126.3524.9622.8131.530.0239.0550.023
NGC558481.2025.7324.5822.8031.790.0358.9500.018
NGC558481.3625.5824.4822.7731.790.0358.7430.011
NGC558485.1125.1824.2022.6831.790.0358.8360.014
NGC558485.7125.7024.6723.0731.790.0358.8910.016
NGC558488.5125.9524.7622.9231.790.0358.8040.013
NGC558497.7526.1824.7622.5631.790.0358.8110.013
NGC725083.1025.9624.6722.6731.500.1368.6050.008
UGC939182.9927.2025.9423.9932.920.0098.9460.018
Publisher’s Note: MDPI stays neutral with regard to jurisdictional claims in published maps and institutional affiliations.

