Abstract
Since the Cosmic Dawn, massive stars have been playing a crucial role as the chemical recycling engines of galaxies that enable the birth of new stars and planetary systems, not only through the strong winds that they exhibit during their relatively short lifetimes, but also through their catastrophic endings as supernovae, and even with occasional posthumous kilonovae events resulting from binary neutron star mergers and neutron star/black hole mergers. Hence, understanding the structures of massive stars and their winds is key to understanding galactic ecosystems. One tool that has proven to be very powerful in constraining the structures of various types of stars is the study of physical phenomena causing observable stellar light variability. Among massive stars, the O-type star Puppis is considered the archetype of a hot, massive star and is almost always invoked in massive star studies. This article presents a highlight review of key results yielded by monitoring efforts of Pup across different wavelength ranges thus far.
1. Preamble
Massive stars are stars having enough matter to form a non-degenerate iron-nickel core at the end of their lives. Hence, massive stars are born with initial mass (M) of at least ∼8 M [1], and have spectral type O or early-B on the H-burning main sequence, although the spectral type and luminosity class will vary as the star evolves off the main sequence stage. At the end of their lives, most massive stars implode internally (and simultaneously explode externally) to leave behind neutron stars for M 8–20 M and black holes for M 20–130 M and possibly above about 250 M [2,3,4]. For M 130–250 M, the pre-supernova star is so luminous that gamma-ray photons in their cores have enough energy to spontaneously create electron-positron pairs that lead to a highly unstable configuration that produces a conflagration supernova, i.e., total dispersal of the entire star via a thermonuclear runaway, resulting in no remnant at all [5].
The initial mass function describes the relative numbers of stars of different mass that are born in a gravitationally collapsing cloud of gas and dust, and it is approximated by a power law (similar to the turbulence spectrum of the preceding cloudlets that formed the stars) strongly favouring lower masses. Therefore, massive stars are very rare: for every 10 M star there are hundreds of Sun-like stars. However, much more than making up for this low number, an individual massive star outshines its low-mass solar-type cousin by up to a factor of a million. The arms of spiral galaxies are therefore dominated by the light from individual, and clusters of, massive and hence very luminous stars.
However, not for long: after only a few million years, massive stars, that have “lived hard” also “die young”, literally “burning” themselves out quickly as astronomical timescales go. As star formation eventually peters out in any region, this leaves only the lower light level of many more lower-mass stars (with much longer nuclear lifetimes) to shine on for billions of years, each faintly glowing together, as in a globular star-cluster or an elliptical galaxy, where significant star formation has all but ceased long ago. Consequently, while the mass of ordinary matter in the Universe is mostly locked up in low-mass stars, the brilliance of regions of sustained or sporadic star formation, as in most spiral and irregular galaxies, is dominated by the light of massive stellar “queens that radiate in the night”.
The high luminosity of massive stars, especially those of hot O-type stars on the main sequence and their descendants with masses above ∼20 M, adds to yet another of their extreme characteristics, namely the presence of very strong winds of matter accelerated away from the underlying star by radiation pressure. For O-type stars this occurs mostly on ultraviolet (UV) spectral lines especially of iron with the particles making up the wind leaving the stellar photosphere at v km s and being accelerated up to a terminal speed v 2000–3000 km s. A main sequence star of 100 M has a net mass-loss rate that is a billion times greater than that of the Sun, only increasing as it evolves to larger radii, where surface gravity holding back the escaping material, weakens. Thus, massive stars not only have the greatest luminosities among stars but are also the main source of ecological change in the Universe, providing the lion’s share of heavy elements, be it from normal evolution with strong winds, or from core collapse supernovae, or from neutron star/black hole mergers and binary neutron star mergers, all of which come from massive stars.
These massive queens are also among the hottest stars, not only in their cores, but also at their surfaces, since like all stars, they spend most of their lives (about 90%) on the main sequence where they “burn” (i.e., fuse nuclei giving off lots of energy) hydrogen, the most abundant element at 90% by number, into helium. Yet, despite this evolutionary enriching of the interstellar medium, most of the helium and hydrogen still in the Universe today was already formed previously by a similar but much more rapid and intense process of nucleosynthesis in the Big Bang. On the other hand, the majority of the heavier elements are mainly produced in the central nuclear furnaces of massive stars, during their explosions/disintegrations at the end of their lives, or in their afterlives through kilonovae events. After the main sequence H-burning phase, the most massive stars pass through a ten-times shorter He-burning phase as classical Wolf-Rayet stars, with at least ten times stronger winds and, thus, enormous hot spectral emission lines that betray their kind.
2. Enter Puppis
There are numerous regions in the sky where massive stars dominate and are seen visually. In the Milky Way, Orion is the closest example, with much richer regions near the Galactic center and in the Carina Nebula taking a lead role, although less obviously to the naked eye due to their greater distances. The largest collection of massive stars known in the Local Group of galaxies is depicted in Figure 1.
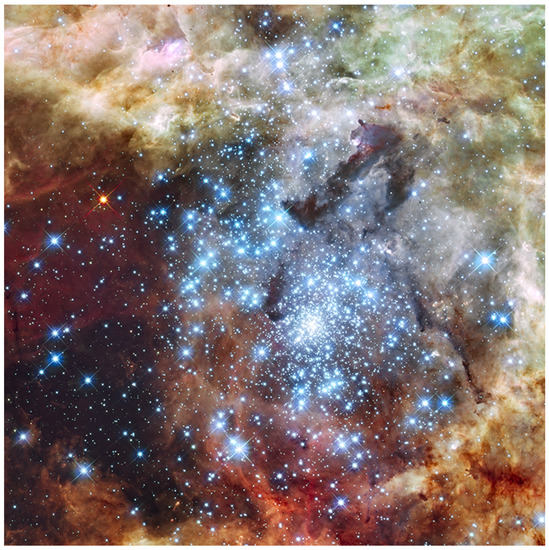
Figure 1.
The largest collection of massive stars known in the Local Group of galaxies, the dense cluster at the core of the giant 30 Dor nebula in the Large Magellanic Cloud (LMC). Some of the brightest stars here have masses exceeding 100 Mo. (Image credit: Space Telescope Science Institute; NASA; Hubble Space Telescope.)
Among individual bright stars in the sky, the hottest and brightest, both apparently and intrinsically, is the 2nd magnitude, O4If(n)p star Puppis, also known as Naos (Greek for “Ship”). At a declination of degrees, it is only visible from southern sites around the globe, best seen in January and adjacent months. Only 7 degrees further south of Pup lies a multiple system that contains the sky’s brightest Wolf-Rayet star, 2nd magnitude Velorum, aka Regor. Pup and Vel form a bright blue-white pair in the southern Milky Way (Figure 2).
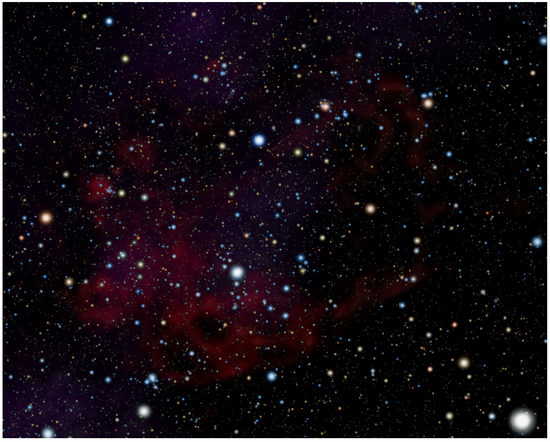
Figure 2.
The Gum Nebula with the bright blue-white stars Pup (upper center) and Vel (lower center). Image credit: Roberto Mura.
Pup is a very hot single supergiant star with a mass of 56 M, recently revised dramatically downwards to potentially be only 25 M due to a new closer distance derived with revised HIPPARCOS (HIgh Precision PARallax COllecting Satellite) astrometry [6]. Pup is so bright that the Gaia mission is not able to provide reliable astrometry for the star as of the 3rd Gaia data release, making the HIPPARCOS measurements the most accurate astrometric measurements available thus far for Pup. The resulting revised mass would make Pup an anomaly compared to other similar supergiants, for which “standard” calibrations [7] give a mass of 58 M for an O4I star, although such “standard” calibrations indicate that any given single star could be uncertain by to up to 35%–50% in its spectrum-based mass. With an effective surface temperature of ∼40,000 K (as for O4I stars in general [7]), Pup is both a runaway (space velocity of ∼60 km s) and a rapid rotator ( km s). The latter characteristic is imprinted in its spectral type and makes it belong to the Onfp class of O-type stars [8] that exhibit a broad, centrally reversed HeII emission line profile resulting from fast rotation and the so-called “resonance zone effect” [9,10].
The fast rotation and runaway status of Pup are intimately connected within the context of its plausible formation scenarios. One of such scenarios suggests that Pup might have been the original secondary star in a binary in which the original more massive primary evolved faster and exploded as a supernova, leading via reduced binding gravity to separation of the two stars at relatively high speeds in opposite directions [11]. The original primary, now an isolated neutron star or more likely a black hole, has never been identified. Pup would then be the original secondary, spun up by Roche lobe overflow from the rapidly evolving primary just before it went supernova. Alternatively, Pup could have been spun-up as the product of the merger of at least two massive stars, then gravitationally ejected during dynamical interactions within the Vela R2 R-association [12,13].
Being very bright and isolated in the southern sky, Pup has long served as a reference calibrator for O-type stars. However, now as we find more peculiarities, as happens for essentially all stars whenever we look at them more closely, one wonders about its true value as a standard star.
3. Key to Understanding Pup: Variability
The first intensive monitoring effort conducted on Pup occurred in the mid-seventies and was geared towards investigating the variability of its H wind emission line, leading to the detection of a periodicity of d [14]. This single periodicity was claimed to be associated with stellar rotation along with a speculated global magnetic field that could force trapped hot gas to rotate at the same rate above the star and be observable in H-alpha (see also Section 4).
Then from 1978 to 1996, the International Ultraviolet Explorer (IUE) satellite produced a boon in hot-star spectroscopy, including for Pup. This culminated with a dedicated two-week “Mega” IUE program in 1995 using all the joint time of the collaborating space agencies, to intensely observe three key luminous hot stars in alternate succession: J Pup (B0.5Ib), Pup (O4If(n)p), and EZ CMa (WN4b). The end goal was to properly probe the quasi-periodic behaviour of their winds. From that joint effort, the presence of discrete absorption components (DACs) on the blue side of P Cygni spectral lines in the UV for Pup was confirmed and their characteristics were much better quantified [15]. Such DACs are now known to be universal in O-star winds, and are best interpreted as the spectroscopic signatures of the presence of large-scale spiral-like structures called Corotating Interaction Regions (CIRs). Some theories then suggested that such large scale wind structures might be triggered by stellar surface perturbations such as bright corotating surface spots [16]—see Figure 3. In Pup, the IUE Mega data exhibited two periodicities in its DACs: (1) inter-DAC spacing of h and (2) a second longer period of d, suspected then to confirm the previously found rotation period of d. Then, an independent examination of the three years of optical photometry obtained for Pup by the astrometric satellite HIPPARCOS yielded a period of d [17], which may represent the first harmonic of the 5.1–5.2 d period. Meanwhile, optical spectroscopic monitoring efforts found periods of h and h [18]. The former was claimed to be non-radial pulsations, while the latter coincides with the DAC recurrence time previously found in UV resonance lines.
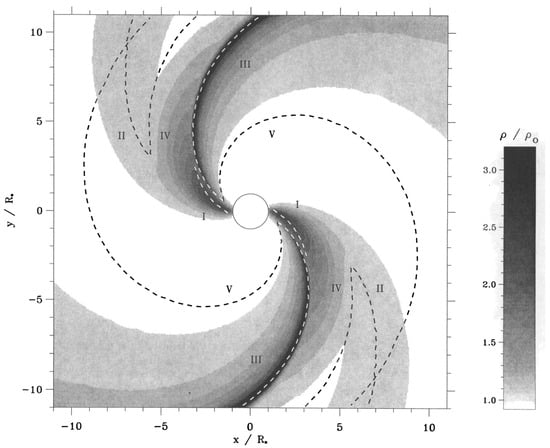
Figure 3.
Hydrodynamical simulation showing the density distribution in the equatorial plane of CIRs in the wind of a massive hot star like Pup [16]. The CIRs are driven by two arbitrarily assumed diametrically opposite corotating bright spots on the stellar surface. The Roman numerals and dashed curves highlight different regions [16]. ©AAS. Reproduced with permission.
Another significant discovery was achieved in the late-nineties: the presence of random clumps in an O-star wind—that of Pup—was revealed for the first time during the last Reticon detector observing-run at the coudé focus of the Canada-France-Hawaii Telescope (CFHT) -m telescope in 1995 [19]. The clumps were seen as emission-line subpeaks superposed on the HeII optical wind line (Figure 4), interpreted as small-scale wind inhomogeneities propagating radially outward in all parts of the wind. The trajectories of the clumps were found to be entirely compatible with the wind-expansion -law, , that had been proposed for all hot-star winds, with exponent close to unity. This discovery was essentially a follow-up to a similar study made on the > stronger winds of Wolf-Rayet stars [20], where the clumps were much more readily seen in repeated spectra with a signal-to-noise ratio of ∼200, although the star itself is hidden by the thick wind. In the case of Pup, the weakness of even the strongest optical emission lines requires a signal-to-noise ratio of about 1000. Characterizing clumping in hot star winds is crucial as it has been found that unclumped hot star wind models lead to overestimates of the mass-loss rates by a factor of two to ten [21], which in turn translate into significant uncertainties in the evolutionary tracks of massive stars. Furthermore, for O-type stars, the morphology of clumps affects the morphology of their emission line profiles in the X-ray domain, with radially compressed, pancake-like clumps explaining the observed symmetric X-ray emission line profiles better than spherical clumps [22].
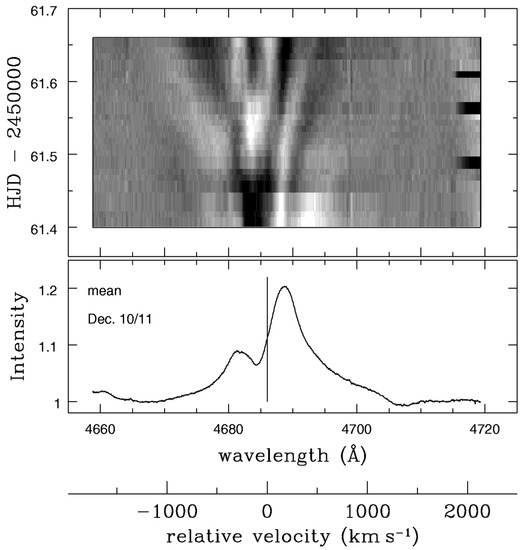
Figure 4.
Top: Dynamic difference spectrum of the first direct discovery of clumping in the wind of an O-type star, here for Pup [19]. Bottom: Corresponding mean spectrum of the HeII emission line with P Cygni profile, arising in the wind of Pup for the same night. This observation was obtained in 1995 at the coudé focus of the m Canada-France-Hawaii Telescope. Another similar observation was made two nights later. ©AAS. Reproduced with permission.
4. Finally, and Most Recently
The pace picks up in the new millennium. First, the Solar Mass Ejection Imager (SMEI) on board the Coriolis satellite delivered a mean optical light curve in one filter for Pup during 2003–2006, that led to a new periodicity of d [23]. The monoperiodic signal was tentatively attributed to pulsation.
Then, following the successful launch of the joint Canadian/Austrian/Polish constellation of five operational nanosatellites—the BRIght Target Explorer (BRITE) mission—we organized a coordinated optical monitoring campaign on Pup, spanning about months in 2014–2015. The idea was to use BRITE to probe light variations coming from the surface of Pup, and simultaneously monitoring the behaviour of the inner part of its wind by intensively monitoring its HeII wind emission line from multiple southern ground-based sites involving both amateurs observatories and professional facilities [24]. The -d periodicity was detected in the two distinct filters (blue and red) from different BRITE satellites, although the shape of the phased light curve had changed from one slightly asymmetric peak with SMEI to two, more distinct peaks separated by about in phase (Figure 5). The -d periodicity was also detected in the variations of the HeII wind emission line. The behaviour revealed by the 2014–2015 observing campaign indicated that this -d periodicity is unlikely the signature of pulsations, but rather the result of rotational modulation arising from localized corotating features at the surface of the star. More importantly, the correlation observed between the light curve variations and the variations in the wind indicated for the first time that bright surface spots induce CIRs in the wind of Pup (see Figure 6 for a cartoon of Pup’s major CIRs along with a mottled stellar surface).
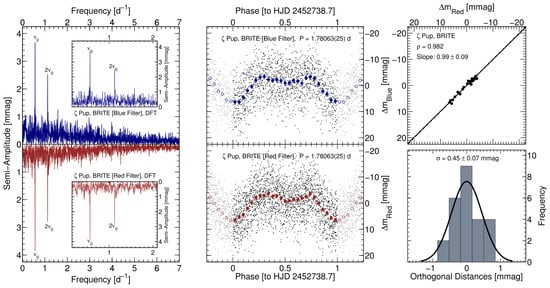
Figure 5.
Analysis of the 2014–2015 BRITE light curves of Pup in two optical filters (Figure 5 in Ramiaramanantsoa et al. 2018 [24]). Left panels: Discrete Fourier Transforms of the blue and red (upside down for convenience) light curves, showing the only two frequencies detected: the fundamental one (at , corresponding to d) and its first harmonic (at ), a result of the two peaks in the light curves. Central panels: The phased light curves with the original data along with binned data. Right panels: Upper: The binned data plotted for one against the other filter, showing their identical nature (both filters are too far to the red from the Planck peak emission to be sensitive to temperature differences). Lower: Dispersion perpendicular to the straight-line in the above plot, showing that it is mostly instrumental due to Poisson noise, thus in line with the identical nature of the variations in the blue and red optical filters. The same result occurs for the unbinned data.
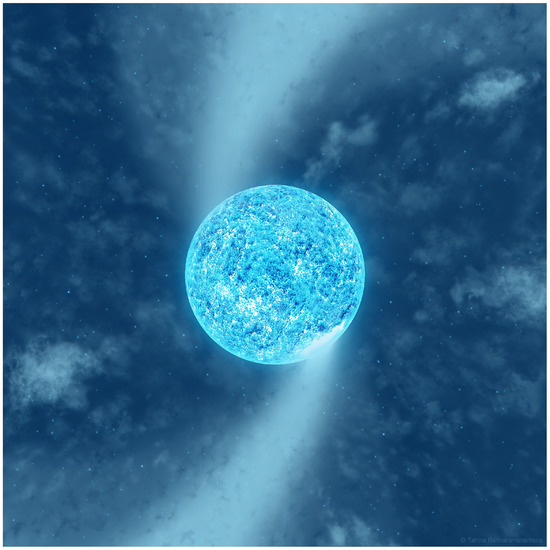
Figure 6.
Artist’s drawing of Pup with two large surface bright spots triggering CIRs in its wind (the potential flattening of the star due to its rapid rotation is not depicted). Image credit: Tahina Ramiaramanantsoa.
Although the bright spots are semi-permanent, they might have changed in periodicity on a decade time-scale (Figure 7, compiling data from various studies [15,23,24,25,26]), which is a new twist as to their origin. One speculation for this is that these spots might wander slowly in mean latitude due to differential rotation, going from inter-CIR period of 15 h in 1989 to 19 h in 1995 and remaining constant at h (i.e., half the d period) since about 2000. For comparison the Sun’s rotation varies from a period of d at the equator to almost 38 d at the poles, i.e., with similar ratio as in Pup, allowing for the fact that we may not have yet seen the full range in Pup. It is also not yet clear in which direction the period changes in Pup, i.e., increasing or decreasing from equator to pole. Either could be possible. A more definitive explanation of Pup’s differential rotation—if this is the correct interpretation—will have to await further constraining data and modeling. Spot modeling via numerical inversion of the 2014–2015 BRITE light curve [24] indicated that, while the d period is relatively stable over half a year, there are at least two detectable bright spots at any given time, which change slowly by small amounts in relative intensity and position on timescales of weeks. If d does in fact represent the equatorial rotation period, then combined with the spectral line broadening km s an equatorial radius R, one finds the equatorial rotation speed to be close to 500 km s, i.e., about 80% of break-up, with an inclination of degrees. Some of these numbers become less extreme for the closer distance from the HIPPARCOS analysis. Nevertheless, a high rotation speed is in line with its runaway status and history as noted above.
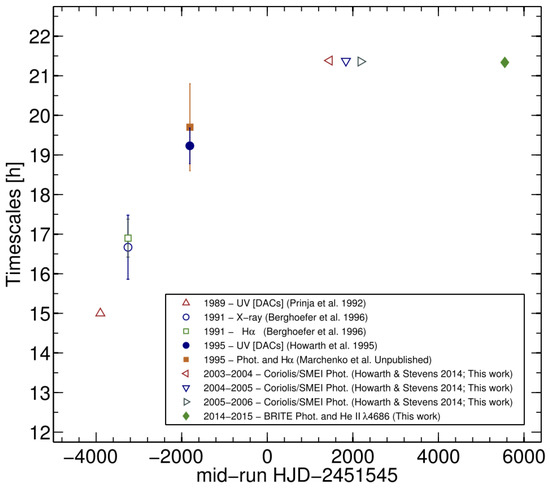
Figure 7.
Periodicities potentially related to CIRs in Pup as a function of time, based on observations in various modes (Figure 19 in Ramiaramanantsoa et al. 2018 [24]).
In 2018, a multi-wavelength variability study that compiled X-ray data from the XMM-Newton and Swift satellites along with optical monitoring with the Coriolis and BRITE satellites found no obvious correlation between the observations taken in these two wavelength regimes [27]. However, the X-ray observations were sparsely sampled. It then became clearer that there was a need for a longer, more intensive, contemporaneous multi-wavelength monitoring. Hence, in 2018–2019, we co-organized a joint multi-wavelength observing campaign on Pup with precision optical photometric monitoring during a contiguous 5-month run with BRITE, in conjunction with the already planned Chandra X-ray observing campaign (PI Wayne Waldron) for a total of just under ten days spread unevenly over 14 months. This proved to be extremely useful. The d periodicity was present in both the optical and the X-ray observations [28]. This may point to the origin of at least some of the X-rays to be the shocks associated with the CIRs and modulated by rotation via absorption and eclipse effects. However, the peak-to-valley amplitude of the d modulation in X-rays was close to 6%, significantly greater than the 1% amplitude in the optical. Furthermore, although the d phased X-ray light curve showed similar-shaped “bumps” compared to the nearly simultaneous BRITE light curve, with the secondary bump in the X-ray observations being much less pronounced, there was a phase shift between the two domains (optical vs. X-ray). The phase shift amounted to in phase (clearly less than half a rotation) if the two maxima are matched up, or in phase if the stronger optical peak is made to coincide with the weaker X-ray peak and vice versa (Figure 8). Theoretically, there is a problem with the larger phase shift, since it would require CIR X-rays to be formed implausibly far out in the wind, given the predictable shape of the CIRs [16]. The shorter phase shift is supported by similar phase shifts observed earlier in optical emission lines (formed in the wind adjacent to the continuum arising below the wind in the photosphere), that also follow the d modulation [24]. However, then the question remains why the more intense X-ray light curve peak does not coincide with the more intense optical light curve peak. A conceivable reason may be that not all CIRs are created equal.
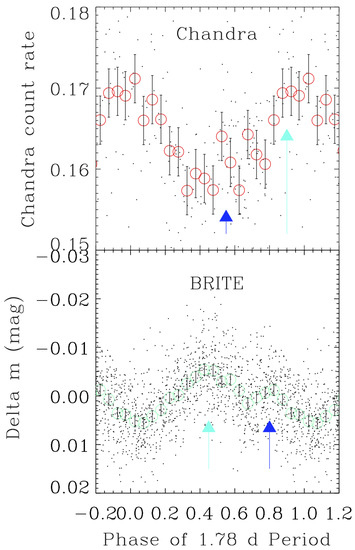
Figure 8.
Simultaneous light curves of Pup in X-rays (Chandra) and optical (BRITE), obtained in 2018–2019, phased according to the d ephemeris [28]. Cyan arrows denote a primary peak, blue arrows a secondary peak in each LC. Both the original data and bins with error bars are shown in each case. The peak-to-valley amplitudes are 6% and 1% in X-rays and optical, respectively. The scatter about the optical light curve is mostly intrinsic, while that for the X-ray light curve is mostly Poisson noise. ©AAS. Reproduced with permission.
Pup is not the only hot massive star now known to exhibit correlated multi-wavelength periodic variability. Other cases include Per [29], Cep [30] and Oph [31], all runaway O-type stars. However, Pup is probably the clearest case so far.
Interestingly, while there is no trace of any 5 d period in the BRITE or SMEI data, the Chandra data show a 5 d and 6 d period (although probably only one or the other is real, not both simultaneously) of amplitude only slightly less than that of the d modulation. Although there is currently no clear explanation for this, one of the most exotic speculations is that it is some kind of more or less stable body (dense gas, planet?) in a ∼5-d orbit around Pup, in agreement with the 5 d periodicity seen before in some observations. Unlike the slowly varying CIR period though, such an orbital period, if real, would be much more stable in time. There is a basic problem with this scenario, though: given Pup’s likely history as a runaway after a supernova explosion in a binary, the survivability of a close 5 d orbiting body during the explosion would be questionable.
Returning to the d period found by BRITE, it was a great help that different BRITE satellites each with either a blue or a red optical filter, revealed essentially identical light curves (Figure 6), with Fourier peaks at d and its first harmonic and nothing else of significance. Just as important, though, was that the phased light curves showed a level of completely stochastic variability at about the same 1% level peak-to-valley as the d modulation, not obvious in the SMEI or any previous precision photometry where it is not easy to separate intrinsic from instrumental noise. However, with BRITE this was possible and it became clear that these random variations in the photosphere were correlated with clumps in the adjacent wind [24], based on high-quality optical spectra of the HeII wind emission line obtained simultaneously with the BRITE photometry. With the advent of even higher-precision photometric monitoring from space, it is becoming obvious that virtually all massive hot stars show similar stochastic variability [32,33].
Curiously, one does see stochastic variability in Pup in the optical; why is this not also clearly seen in X-rays? Could it just be because the X-ray photon count-rate is not high enough to attain a significant level of certainty? On the ond hand, one expects to see X-rays globally from all parts of the wind caused by many individual independent shocks. On the other hand, it has been proposed that the number of shocks (and associated clumps) at any given time might be so great (>) that their relative variability (< in amplitude) is drowned in Poisson noise [34]. In X-rays, the only apparent way forward may be via future X-ray telescopes in space with larger collecting area leading to higher sensitivity to be able to detect any significant stochastic X-ray variability.
5. Origin of the Bright Surface Spots
As noted above, massive stars, that spend most of their lives with a hot surface, are dominated by their strong winds. These winds are pervaded by two types of sub-structures, both probably universal to all: large-scale spiral-shaped CIRs and small-scale stochastic clumping. Both may be keys to understanding the internal structure of their underlying stars, requiring some kind of perturbation coming from within and appearing as bright spots on the stellar surface, to trigger them: semi-permanent for the former and short-lasting (multi-hours) for the latter. Furthermore, the CIR footprints likely require a magnetic field to allow a longer lifetime. Such fields could be quite strong, but difficult to detect via Zeeman splitting [35], because of the extreme proximity and extreme difficulty in spatial resolution of the required N-S duality of spot pairs, like those on the Sun. However, how do these spots arise and what are they actually? While no one can say for sure at the moment, theoretical works suggest that, while the upper layers of hot massive stars are in radiative equilibrium compared to their convective interiors, a sub-surface convection zone could produce such bright spots [36,37]. Such a region is driven by a partial ionization zone of iron-element atoms at temperatures around 170,000 K compared to the 30–50 thousand degrees at the surface of O-type stars. The subsurface convection zone is able to sustain a dynamo action that generates a small-scale magnetic field, which may occasionally break through the surface and leave visible bright spots.
6. Conclusions
Pup has clearly played a pivotal role in recognizing that hot-star winds are universally pervaded by two kinds of unstable structures. However, how typical is Pup? Given its rapid rotation and runaway status, one could argue that these circumstances are special. However, one could also argue on the other hand that the rapid rotation simply enhances the effects we see, making them easier to manifest themselves and ultimately be understood. However, despite the recent rapid progress, we still cannot be sure. Furthermore, we do not know how X-rays are produced in the winds of hot luminous stars, although we do now know that systematic CIR spirals are the most likely place where periodically varying X-rays arise. As for the general constant background level of X-rays, we cannot be sure—although it does seem likely that the stochastic wind shocks needed to produce them are likely associated with clumps. Through perseverance we will eventually find the right scenario probably even well before it becomes possible to send a probe to the nearest massive star. It behooves us to understand these radiant queens of the Universe with the best means we have now at our disposal.
Author Contributions
Writing—original draft, T.R. and A.F.J.M. Both authors have contributed substantially to the work reported. All authors have read and agreed to the published version of the manuscript.
Funding
AFJM is grateful for financial support from the Natural Sciences and Engineering Research Council (NSERC) of Canada.
Data Availability Statement
All data presented in this article can be accessed in the corresponding references cited in the figure captions.
Conflicts of Interest
The authors declare no conflict of interest.
References
- Vanbeveren, D.; De Loore, C.; Van Rensbergen, W. Massive stars. Astron. Astrophys. Rev. 1998, 9, 63–152. [Google Scholar] [CrossRef]
- Smartt, S.J. Progenitors of Core-Collapse Supernovae. Annu. Rev. Astron. Astrophys. 2009, 47, 63–106. [Google Scholar] [CrossRef]
- Sukhbold, T.; Ertl, T.; Woosley, S.E.; Brown, J.M.; Janka, H.T. Core-collapse Supernovae from 9 to 120 Solar Masses Based on Neutrino-powered Explosions. Astrophys. J. 2016, 821, 38. [Google Scholar] [CrossRef]
- Chieffi, A.; Limongi, M. The Presupernova Core Mass-Radius Relation of Massive Stars: Understanding Its Formation and Evolution. Astrophys. J. 2020, 890, 43. [Google Scholar] [CrossRef]
- Fryer, C.L.; Woosley, S.E.; Heger, A. Pair-Instability Supernovae, Gravity Waves, and Gamma-Ray Transients. Astrophys. J. 2001, 550, 372–382. [Google Scholar] [CrossRef]
- Howarth, I.D.; van Leeuwen, F. The distance, rotation, and physical parameters of ζ Pup. Mon. Not. R. Astron. Soc. 2019, 484, 5350–5361. [Google Scholar]
- Martins, F.; Schaerer, D.; Hillier, D.J. A new calibration of stellar parameters of Galactic O stars. Astron. Astrophys. 2005, 436, 1049–1065. [Google Scholar] [CrossRef]
- Walborn, N.R.; Howarth, I.D.; Evans, C.J.; Crowther, P.A.; Moffat, A.F.J.; St-Louis, N.; Fariña, C.; Bosch, G.L.; Morrell, N.I.; Barbá, R.H.; et al. The Onfp Class in the Magellanic Clouds. Astron. J. 2010, 139, 1283–1294. [Google Scholar] [CrossRef]
- Petrenz, P.; Puls, J. Hα line formation in hot star winds: The influence of rotation. Astron. Astrophys. 1996, 312, 195–220. [Google Scholar]
- Hillier, D.J.; Bouret, J.C.; Lanz, T.; Busche, J.R. The influence of rotation on optical emission profiles of O stars. Mon. Not. R. Astron. Soc. 2012, 426, 1043–1049. [Google Scholar] [CrossRef]
- Vanbeveren, D.; van Rensbergen, W.; De Loore, C. The Brightest Binaries; Springer: Dordrecht, The Netherlands, 1998; Volume 232. [Google Scholar]
- Vanbeveren, D.; Belkus, H.; van Bever, J.; Mennekens, N. Stellar dynamics in young clusters: The formation of massive runaways and very massive runaway mergers. Astrophys. Space Sci. 2009, 324, 271–276. [Google Scholar] [CrossRef][Green Version]
- Vanbeveren, D. ζ Pup: The Merger of at Least Two Massive Stars? In Proceedings of the Scientific Meeting in Honor of Anthony F. J. Moffat, Saint-Michel-des-Saints, QC, Canada, 11–15 July 2011; Astronomical Society of the Pacific Conference Series. Drissen, L., Robert, C., St-Louis, N., Moffat, A.F.J., Eds.; Volume 465, p. 342. [Google Scholar]
- Moffat, A.F.J.; Michaud, G. ZET PUP: An O-type oblique rotator? Astrophys. J. 1981, 251, 133–138. [Google Scholar] [CrossRef]
- Howarth, I.D.; Prinja, R.K.; Massa, D. The IUE MEGA Campaign: The Rotationally Modulated Wind of zeta Puppis. Astrophys. J. Lett. 1995, 452, L65. [Google Scholar] [CrossRef]
- Cranmer, S.R.; Owocki, S.P. Hydrodynamical Simulations of Corotating Interaction Regions and Discrete Absorption Components in Rotating O-Star Winds. Astrophys. J. 1996, 462, 469. [Google Scholar] [CrossRef]
- Marchenko, S.V.; Moffat, A.F.J.; van der Hucht, K.A.; Seggewiss, W.; Schrijver, H.; Stenholm, B.; Lundstrom, I.; Setia Gunawan, D.Y.A.; Sutantyo, W.; van den Heuvel, E.P.J.; et al. Wolf-Rayet stars and O-star runaways with HIPPARCOS. II. Photometry. Astron. Astrophys. 1998, 331, 1022–1036. [Google Scholar]
- Reid, A.H.N.; Howarth, I.D. Optical time-series spectroscopy of the O4 supergiant ζ Puppis. Astron. Astrophys. 1996, 311, 616–630. [Google Scholar]
- Eversberg, T.; Lépine, S.; Moffat, A.F.J. Outmoving Clumps in the Wind of the Hot O Supergiant ζ Puppis. Astrophys. J. 1998, 494, 799–805. [Google Scholar] [CrossRef]
- Moffat, A.F.J.; Drissen, L.; Lamontagne, R.; Robert, C. Spectroscopic Evidence for Rapid Blob Ejection in Wolf-Rayet Stars. Astrophys. J. 1988, 334, 1038. [Google Scholar] [CrossRef]
- Puls, J.; Vink, J.S.; Najarro, F. Mass loss from hot massive stars. Astron. Astrophys. Rev. 2008, 16, 209–325. [Google Scholar] [CrossRef]
- Oskinova, L.M.; Feldmeier, A.; Hamann, W.R. High-resolution X-ray spectroscopy of bright O-type stars. Mon. Not. R. Astron. Soc. 2006, 372, 313–326. [Google Scholar] [CrossRef]
- Howarth, I.D.; Stevens, I.R. Time-series photometry of the O4 I(n)fp star ζ Puppis. Mon. Not. R. Astron. Soc. 2014, 445, 2878–2883. [Google Scholar] [CrossRef]
- Ramiaramanantsoa, T.; Moffat, A.F.J.; Harmon, R.; Ignace, R.; St-Louis, N.; Vanbeveren, D.; Shenar, T.; Pablo, H.; Richardson, N.D.; Howarth, I.D.; et al. BRITE-Constellation high-precision time-dependent photometry of the early O-type supergiant ζ Puppis unveils the photospheric drivers of its small- and large-scale wind structures. Mon. Not. R. Astron. Soc. 2018, 473, 5532–5569. [Google Scholar] [CrossRef]
- Prinja, R.K.; Balona, L.A.; Bolton, C.T.; Crowe, R.A.; Fieldus, M.S.; Fullerton, A.W.; Gies, D.R.; Howarth, I.D.; McDavid, D.; Reid, A.H.N. Time Series Observations of O Stars. I. IUE Observations of Variability in the Stellar Wind of zeta Puppis. Astrophys. J. 1992, 390, 266. [Google Scholar] [CrossRef]
- Berghoefer, T.W.; Baade, D.; Schmitt, J.H.M.M.; Kudritzki, R.P.; Puls, J.; Hillier, D.J.; Pauldrach, A.W.A. Correlated variability in the X-ray and Hα emission from the O4If supergiant ζ Puppis. Astron. Astrophys. 1996, 306, 899. [Google Scholar]
- Nazé, Y.; Ramiaramanantsoa, T.; Stevens, I.R.; Howarth, I.D.; Moffat, A.F.J. A detailed X-ray investigation of ζ Puppis. IV. Further characterization of the variability. Astron. Astrophys. 2018, 609, A81. [Google Scholar] [CrossRef]
- Nichols, J.S.; Nazé, Y.; Huenemoerder, D.P.; Moffat, A.F.J.; Miller, N.A.; Lauer, J.; Ignace, R.; Gayley, K.; Ramiaramanantsoa, T.; Oskinova, L.; et al. Correlated X-Ray and Optical Variability in the O-type Supergiant ζ Puppis. Astrophys. J. 2021, 906, 89. [Google Scholar] [CrossRef]
- Massa, D.; Oskinova, L.; Prinja, R.; Ignace, R. Coordinated UV and X-Ray Spectroscopic Observations of the O-type Giant ξ Per: The Connection between X-Rays and Large-scale Wind Structure. Astrophys. J. 2019, 873, 81. [Google Scholar] [CrossRef]
- Rauw, G.; Hervé, A.; Nazé, Y.; González-Pérez, J.N.; Hempelmann, A.; Mittag, M.; Schmitt, J.H.M.M.; Schröder, K.P.; Gosset, E.; Eenens, P.; et al. Simultaneous X-ray and optical spectroscopy of the Oef supergiant λ Cephei. Astron. Astrophys. 2015, 580, A59. [Google Scholar] [CrossRef]
- Oskinova, L.M.; Clarke, D.; Pollock, A.M.T. Rotationally modulated X-ray emission from the single O star ζ Ophiuchi. Astron. Astrophys. 2001, 378, L21–L24. [Google Scholar] [CrossRef][Green Version]
- Ramiaramanantsoa, T.; Ratnasingam, R.; Shenar, T.; Moffat, A.F.J.; Rogers, T.M.; Popowicz, A.; Kuschnig, R.; Pigulski, A.; Handler, G.; Wade, G.A.; et al. A BRITE view on the massive O-type supergiant V973 Scorpii: Hints towards internal gravity waves or sub-surface convection zones. Mon. Not. R. Astron. Soc. 2018, 480, 972–986. [Google Scholar] [CrossRef]
- Bowman, D.M.; Burssens, S.; Pedersen, M.G.; Johnston, C.; Aerts, C.; Buysschaert, B.; Michielsen, M.; Tkachenko, A.; Rogers, T.M.; Edelmann, P.V.F.; et al. Low-frequency gravity waves in blue supergiants revealed by high-precision space photometry. Nat. Astron. 2019, 3, 760–765. [Google Scholar] [CrossRef]
- Nazé, Y.; Oskinova, L.M.; Gosset, E. A Detailed X-Ray Investigation of ζ Puppis. II. The Variability on Short and Long Timescales. Astrophys. J. 2013, 763, 143. [Google Scholar] [CrossRef]
- Kochukhov, O.; Sudnik, N. Detectability of small-scale magnetic fields in early-type stars. Astron. Astrophys. 2013, 554, A93. [Google Scholar] [CrossRef]
- Cantiello, M.; Langer, N.; Brott, I.; de Koter, A.; Shore, S.N.; Vink, J.S.; Voegler, A.; Lennon, D.J.; Yoon, S.C. Sub-surface convection zones in hot massive stars and their observable consequences. Astron. Astrophys. 2009, 499, 279–290. [Google Scholar] [CrossRef]
- Cantiello, M.; Braithwaite, J. Magnetic spots on hot massive stars. Astron. Astrophys. 2011, 534, A140. [Google Scholar] [CrossRef]
Publisher’s Note: MDPI stays neutral with regard to jurisdictional claims in published maps and institutional affiliations. |
© 2022 by the authors. Licensee MDPI, Basel, Switzerland. This article is an open access article distributed under the terms and conditions of the Creative Commons Attribution (CC BY) license (https://creativecommons.org/licenses/by/4.0/).