Article

Statistical Analysis of Field-Aligned Alfvénic Turbulence and Intermittency in Fast Solar Wind

1
National Research Council—Institute of Atmospheric Pollution Research, C/o University of Calabria, 87036 Rende, Italy
2
National Institute for Astrophysics—Astrophysical Observatory of Torino, Via Osservatorio 20, 10025 Pino Torinese, Italy
3
Escuela Politécnica Nacional, Departamento de Física, Ladron de Guevera E11-253, Quito 170517, Ecuador
4
CNR—Istituto per la Scienza e Tecnologia dei Plasmi, Via Amendola 122/D, 70126 Bari, Italy
5
Center for Space Plasma and Aeronomic Research (CSPAR), University of Alabama in Huntsville, Huntsville, AL 35899, USA
6
Department of Space Science, University of Alabama in Huntsville, Huntsville, AL 35899, USA
7
National Institute for Astrophysics—Institute for Space Astrophysics and Planetology, Via del Fosso del Cavaliere 100, I-00133 Roma, Italy
*
Author to whom correspondence should be addressed.
Universe 2020, 6(8), 116; https://doi.org/10.3390/universe6080116
Submission received: 11 June 2020 / Revised: 28 July 2020 / Accepted: 30 July 2020 / Published: 9 August 2020

Abstract

:
The statistical properties of fast Alfvénic solar wind turbulence have been analyzed by means of empirical mode decomposition and the associated Hilbert spectral analysis. The stringent criteria employed for the data selection in the Wind spacecraft database, has made possible to sample multiple k field-aligned intervals of the three magnetic field components. The results suggest that the spectral anisotropy predicted by the critical balance theory is not observed in the selected database, whereas a Kolmogorov-like scaling ( E ( k ) k 5 / 3 ) and a weak or absent level of intermittency are robust characteristics of the Alfvénic slab component of solar wind turbulence.

1. Introduction

The solar wind (SW) is the most studied environment for plasma turbulence [1]. Among the most interesting features of space plasmas, the existence of a strong ambient magnetic field leads to turbulence anisotropy [2] related to the preferential energy transfer in a perpendicular direction with respect to the mean magnetic field, as theoretically predicted [3,4,5]. Observations show different forms of such anisotropy. For example, elongation or deformation of eddies in the mean magnetic field direction, called wavevector anisotropy, produces k > k ). On the other hand, different power levels in different directions relative to the local field, called power anisotropy, result in power spectra of different amplitude P ( k ) P ( k ) . Finally, different scaling in different directions, measured through the power spectrum slope β β (where β represents the power-law exponent), is usually called spectral index anisotropy [1,6].
In the phenomenology of Alfvénic turbulence, the ratio between the linear Alfvén timescale and the nonlinear decay timescale regulates the balance of the energy flux across scales, thus determining the strength of turbulence. The linear Alfvén timescale, defined as τ A / υ A , represents the typical propagation time of an Alfvén wave along a structure of size , υ A being the Alfvén speed. The nonlinear decay time τ n l / δ u ( ) represents the perpendicular eddy turnover time, where δ u ( ) is the fluctuation velocity across a structure of size . When ratio of these two quantities χ = τ A / τ n l δ u / υ A 1 , oppositely propagating Alfvén wave packets may interact multiple times before their energy is transferred to smaller scales [7,8]. On the contrary, for χ 1 Alfvénic fluctuations undergo multiple decays before they interact. Both conditions naturally evolve towards comparable nonlinear and Alfvén timescales ( χ 1 ), so that the nonlinear cascade occurs within one single interaction [3,9] (the reader is referred to Refs. [4,10] for more details on the MHD turbulence theory and on the evolution of the nonlinearity parameter χ ).
In this case, it is possible to show that the scaling relation between perpendicular and parallel wave vectors is k k 2 / 3 . Under this particular condition, usually called “critically balanced” state [4], wavevector anisotropy k k would appear at small scales, as resulting from the anisotropy of the spectral index: E ( k ) k 5 / 3 and E ( k ) k 2 . Therefore, the critical balance condition can be tested by measuring the spectral index at various angles from SW measurements, a complicated issue using typical single-spacecraft SW measurements. Wavelet analysis has been often used to study the local mean magnetic field and to collect information on fluctuations at a particular local angle θ V B between the local mean magnetic field and the flow direction. The resulting spectral slope was close to 5 / 3 when θ V B 90 and 2 when the angle is θ V B 0 , providing an evidence for the critical balance theory [11,12,13,14]. Multi-point measurement techniques provided similar results [6,15]. The observed spectral anisotropy is also compatible with the presence of discontinuities in the SW, as for example current sheets [2,16]. Removal of intermittent events from data was accompanied by flatter parallel spectra [17].
However, both local mean-field calculation and removal of intermittent events might result in systematic errors in the reconstruction of the parallel spectrum. The observation of local alignment between magnetic field and wind direction is indeed prevented by pervasive large-amplitude Alfvénic fluctuations. Thus, very long time series are required to build the parallel spectrum [13] using randomly distributed data points, possibly uncorrelated, and artificially introducing the discontinuities that might generate the spectral anisotropy.
In order to study the SW turbulence in a direction parallel to the mean background magnetic field, a novel approach was recently proposed. A search of continuous Alfvénic, fast SW intervals was performed, producing a database mostly populated by k fluctuations. This allows to avoid the possible introduction of discontinuities and inhomogeneities. The selected intervals were studied using the Hilbert spectral analysis, so to remove the possible influence of small-scale noise and large-scale structures from spectral and intermittency properties in the inertial range. Preliminary results showed that spectral anisotropy is incompatible with the critical balance scenario. This work represents a follow-up of the results presented in [18]. Here, an in-depth statistical study based on the Hilbert spectral analysis and a different resampling method have been conducted on a subset of the intervals presented in the previous work, showing the robustness of the observations. In particular, despite of the power anisotropy, present in all samples, the distribution of the spectral exponents obtained from the resampling (and their relative scaling exponents) is characterized by a mean value fully compatible with the classical Kolmogorov spectrum (within the 95 % of prediction interval), revealing the presence of short-range correlations.

2. Data Selection Criteria for k Magnetic Fluctuation

Alfvénic turbulence can be usually split in two components: a slab component, for fluctuations propagating along to background magnetic field B 0 , and a 2D component, whose magnetic fluctuations lie on a plane perpendicular to B 0 [19,20,21,22]. Therefore, wavevectors of the slab and 2D components are respectively parallel ( k ) and perpendicular ( k ) to the global mean magnetic field.
Testing the critical balance model in SW fluctuations requires a reliable estimate of the spectral exponents of the slab ( k ). However, sampling the SW in a purely parallel direction is rather challenging, in particular when Alfvénic turbulence is dominating. Indeed, even when the global mean background magnetic field is aligned to the sampling direction (which coincides with that of the bulk flow), the presence of high amplitude Alfvénic fluctuations can locally disrupt the alignment. As a result, the measured Alfvénic turbulence includes contributions from fluctuations along both k and k directions.
In this work, a systematic search of SW intervals that provide k sampling has been performed using over 12 years of SW magnetic field observations, recorded by the Wind spacecraft between 2005 and 2016, with sampling frequency of Δ ω 11 Hz. In order to be selected as a k sample, a SW interval must satisfy the following requirements:
  • Magnetic field and velocity must be aligned within 15 at all scales in the turbulent inertial range for the whole interval, i.e., both local and global mean magnetic field must be aligned with the bulk velocity;
  • The total duration cannot be less than 1 hour, with maximal percentage of missing data ≤20%;
  • The whole interval must be enclosed within a fast SW stream ( V 550 km s 1 );
  • It must have low magnetic compressibility ( C B 25 % ), measured in the inertial range at scale of 20 min, where C B is defined as the ratio between the variance of the magnetic field intensity fluctuations and the total variance of the fluctuations, C B = σ | B | 2 / i = x , y , z σ B i 2 [23];
  • The total pressure P m = 2 n k B T + B 2 / ( 8 π ) (with n, T, and B are, respectively, the proton number density, the temperature, and magnetic field intensity) must satisfy the condition P m < 0.05 nPa, in order to avoid discontinuities or shocks [24].
If all of these conditions are fulfilled, the selected sample guarantees k fluctuations, due to undisturbed Alfvénic fast SW turbulence. Indeed, local sampling of parallel fluctuations requires angles between B and V vectors tan 1 [ δ B / B ] 17 22 ( δ B / B 0.3 0.4 at the injection scales). The more stringent criterion adopted here ensures thus local sampling of purely k fluctuations.
All selected samples are immersed in trailing edges of high-speed streams, in the strong turbulence regime. Some relevant parameters relative to the selected intervals are collected in Table 1: SW speed V , total pressure P m , magnetic compressibility evaluated at the fluid scale 20 min C B , and the mean angle θ V B between the velocity and magnetic field vectors.
As customary, the link between the frequency space and the wavevector space is obtained by using the Taylor frozen hypothesis [1,27], which holds for all the intervals in this work. In Figure 1 are shown, as examples, the SW bulk velocity for sample 2005 / 01 / 03 , and 2007 / 09 / 03 . In all cases, the velocity is steady and with small fluctuations (with respecct to the bulk speed) during the whole interval. In the last panel of Figure 1 the power spectral density (in dimensional form) is shown for sample 2005 / 01 / 03 , in the wavevector space. A clear power law scaling k 5 / 3 is observed in a range of wavevector k [ 10 4 , 10 3 ] km 1 .
It should be pointed out that in the selected intervals foreshock particles from the Earth’s bow shock are unlikely but cannot be excluded [28,29]. However their possible role in the selected intervals is beyond the scope of this analysis, and it will be left out for a future work.

3. Empirical Mode Decomposition and Arbitrary Order Hilbert Spectra

In the Empirical Mode Decomposition (EMD) framework [30,31], the three components of the magnetic field B B x ( t ) , B y ( t ) , B z ( t ) can be decomposed each into a finite number n of oscillating basis functions, of increasing characteristic time scale τ , known as intrinsic mode functions (IMFs) X j ϕ j ( t ) , ψ j ( t ) , θ j ( t ) :
B i ( t ) = j = 1 n X i , j ( t ) + R i ( t ) ,
where i { B x , B y , B z } or { ϕ j , ψ j , θ j } . The residual R i (being R R ϕ ( t ) , R ψ ( t ) , R θ ( t ) ) in Equation (1) describes the mean trend. EMD is based on the local properties of the data [30], allowing to characterize non-stationary and nonlinear processes, and does not necessarily require a continuous time series, since it can be also applied to time series with non uniformly sampled data [32,33]. The decomposition process, called sifting process, consists principally of two stages: the local extrema of B i are identified and subsequently interpolated through cubic spline. Once interpolated, the envelopes of local maxima and local minima are defined; subsequently, the mean of the two envelope functions is subtracted from the original data. This difference is considered an IMF only if: (i) the number of local extrema and zero crossings does not differ by more than 1; (ii) at any point t i , the mean value of the extrema envelopes is zero. If the difference does not meet these criteria, the sifting procedure is repeated [30]. A general rule to stop the sifting is defined by a Cauchy-type convergence criterion, defining a standard deviation σ , evaluated from two consecutive steps of the algorithm. The iterative sifting stops when σ is smaller than a fixed threshold, usually σ t h r e s h 0.2 . An alternative method for stopping the sifting procedure is the so called 3-thresholds stoppage criterion, and was introduced in order to guarantee globally small fluctuations in the mean, while taking into account locally large amplitude variations [31]. In this work this second stoppage criterion has been adopted. The three threshold parameters used here are δ = 0.05 , ξ 1 = 0.05 , and ξ 2 = 10 ξ 1 , in accordance with their typical values [31]. An example of the IMFs ϕ j ( t ) for the component B 1 B x ( t ) and the associated residual R ϕ ( t ) extracted from sample 2005 / 01 / 03 , are shown in the left panel of Figure 2.
Note that mode j = 1 (not shown) contains the fastest timescale, in many cases associated with the experimental noise embedded in the data-set. Once the IMFs have been obtained, an Hilbert transform is applied on each mode:
X i , j ( t ) = 1 π P + X i , j ( t ) t t ,
where P represents the Cauchy principle value. This transformation allows to extract a time-dependent instantaneous frequency ω i , j ( t ) and a time-dependent amplitude modulation A i , j ( t ) , from the analytical signal Z = X i , j ( t ) + i X i , j ( t ) A i , j ( t ) e i Φ i , j ( t ) [34]. Central panel of Figure 2 shows the characteristic periods τ 2 , j (component B 2 ( t ) , in log-linear plot), evaluated as the average inverse instantaneous frequency of the j-th mode: τ 2 , j = ω 2 , j t 1 ( · t representing a temporal average) [30], where ω i , j = 2 π 1 d Φ i , j ( t ) / d t is the temporal variation of the instantaneous phase Φ i , j ( t ) [30]. Moreover, the Hilbert spectrum, defined as H ( ω , t ) = A 2 ( ω , t ) , provides energy information in the time-frequency domain [35].
When the EMD is applied on turbulent processes [36,37,38] or multifractal processes [39,40], it intrinsically acts as a dyadic filter bank [41,42,43,44], where each IMF captures a narrow band in frequency space, and their characteristic period τ j follows an exponential law of the form: τ j = α × γ j , where γ = 2 for an exact dyadic decomposition. The dashed line in the central panel of Figure 2 represents the least square fit of the exponential relation obtained for τ j , with γ = 1.97 ± 0.01 , showing very good agreement with the theoretical expectation. Moreover, the dyadic structure can be observed by analyzing the Fourier power spectral density (PSD) of the various IMFs, reported in Figure 2, right panel. The PSD of the data (black line) presents a power-law decay well reproduced by the superposition of the various IMFs Fourier spectra. The superposition behaves as a power-law of the form M ϕ ( ω ) Max [ ϕ ^ ( ω ) ] ω β [35,45,46], with the same spectral exponent as the original PSD (Figure 2 right panel). In the classical, self-similar Kolmogorov theory [47,48], the spectral exponent β is linked to the scaling exponent of the second-order structure function (SF) via the relation E ( ω ) ω β β 1 = ζ ( 2 ) .
A marginal integration performed on H ( ω , t ) provides the Hilbert marginal spectrum h ( ω ) = T 1 0 T H ( ω , t ) d t , defined as the energy density at frequency ω [30,49]. Moreover, from the Hilbert spectrum, a joint probability density function P ( ω , A ) can be extracted, using the instantaneous frequency ω i , j and the amplitude A i , j of the j-th IMF as: h ( ω ) = 0 P ( ω , A ) A 2 d A , which corresponds to a second-order statistical moment [35]. This procedure can be generalized to the arbitrary order q 0 by defining the instantaneous ω -dependent q-th-order statistical moments:
L q = 0 P ( ω , A ) A q d A .
The second-order moment h ( ω ) L 2 is the analogous of the Fourier spectral energy density, and can be interpreted as the energy associated to the frequency ω . It should be pointed out that the definition of frequency in h ( ω ) is different from the definition in the Fourier framework. The interpretation of the Hilbert marginal spectrum should thus be given with more caution [30,35,50].
Figure 3 (left panel) shows an example of the second order moment L 2 ( ω ) obtained for the different components B i of the magnetic field of sample 2005 / 01 / 03 . From the analysis, it is evident that the B x component is characterized by a lower power with respect to the two perpendicular components B y and B z . In Figure 3, the central panel shows the average isotropy ratio R ( ω ) = L 2 x ( ω ) / L 2 α ( ω ) (where α = z , y ), obtained by averaging on all frequencies enclosed in the inertial range ω [ 10 2 , 10 1 ] . For comparison, the theoretical value for homogeneous and isotropic turbulence R ( ω ) = 3 / 4 , obtained from the Kolmogorov’s second similarity hypothesis [51], is also indicated. in all cases, R ( ω ) is always different from 3 / 4 , indicating that the effects of the power anisotropy are always present despite of the short length of the samples. In addition, the the ratio x / z is always comparable with the ratio x / y , within the error. The PSD for sample 2005 / 01 / 03 ( B x component) is plotted in Figure 2, right panel. The slope β 2 of the Hilbert spectra L 2 ( ω ) is fully compatible with the Fourier PSD, and clear power-law scaling. The right panel of Figure 3 displays a comparison between the Fourier and Hilbert spectra with the standard second-order structure function, S 2 ( t ) , plotted against the inverse scale t 1 in order to match the frequency range. From the results, the agreement between the slope β 2 1.61 ± 0.10 and the exponent ζ ( 2 ) = 0.57 ± 0.02 is evident, and both are in good agreement with the theoretical result ζ ( 2 ) β 1 obtained from the classical Fourier PSD [48]. Similar values were found for all intervals selected for the analysis.

4. Statistical Analysis of HSA Slopes and Scaling Exponents for Alfvénic Turbulence

In order to construct a prediction interval for the various β q , a bootstrapping procedure has been adopted [52]. The bootstrap method is a general resampling procedure useful for the estimation of the distributions of statistics based on independent observations. The basic idea is that inference about a population can be modelled by resampling the data and performing inference from resampled data [52,53]. This allows to create multiple smaller data-sets (of equal size), by randomly extracting elements from the original data-set, calculating their statistic, and taking the average of the calculated statistics [54].
In order obtain a statistical distribution of the spectral slopes, two possibles approaches can be used. The first approach, known as residual resampling, consists of performing a least square fit on the original data, and the residuals are then resampled and added to the prediction of the original fit in order to obtain a new data-set, which will be fitted as a function the original frequency ω [52,55]. In the second approach, the original data L q ( ω ) and the corresponding frequencies ω are both resampled in order to construct the smaller subsets, and then least square fitted [56,57]. All those points have been selected in a range of frequency ω slightly larger than 1 decade in the inertial range. Both methods provided compatible results.
As a rule of thumb, for a simple statistical test the number N s a m p of random samples is usually chosen in the interval N s a m p [ 50 , 100 ] . Indeed, while N s a m p = 50 provides a relatively good standard error estimate [55], for N s a m p > 100 the improvement in the estimation of standard errors becomes negligible [58]. On the other hand, when evaluating confidence or prediction interval a higher number of replicas are required. Here values N s a m p [ 600 , 1000 ] have been selected, in accordance with recommended values [59].
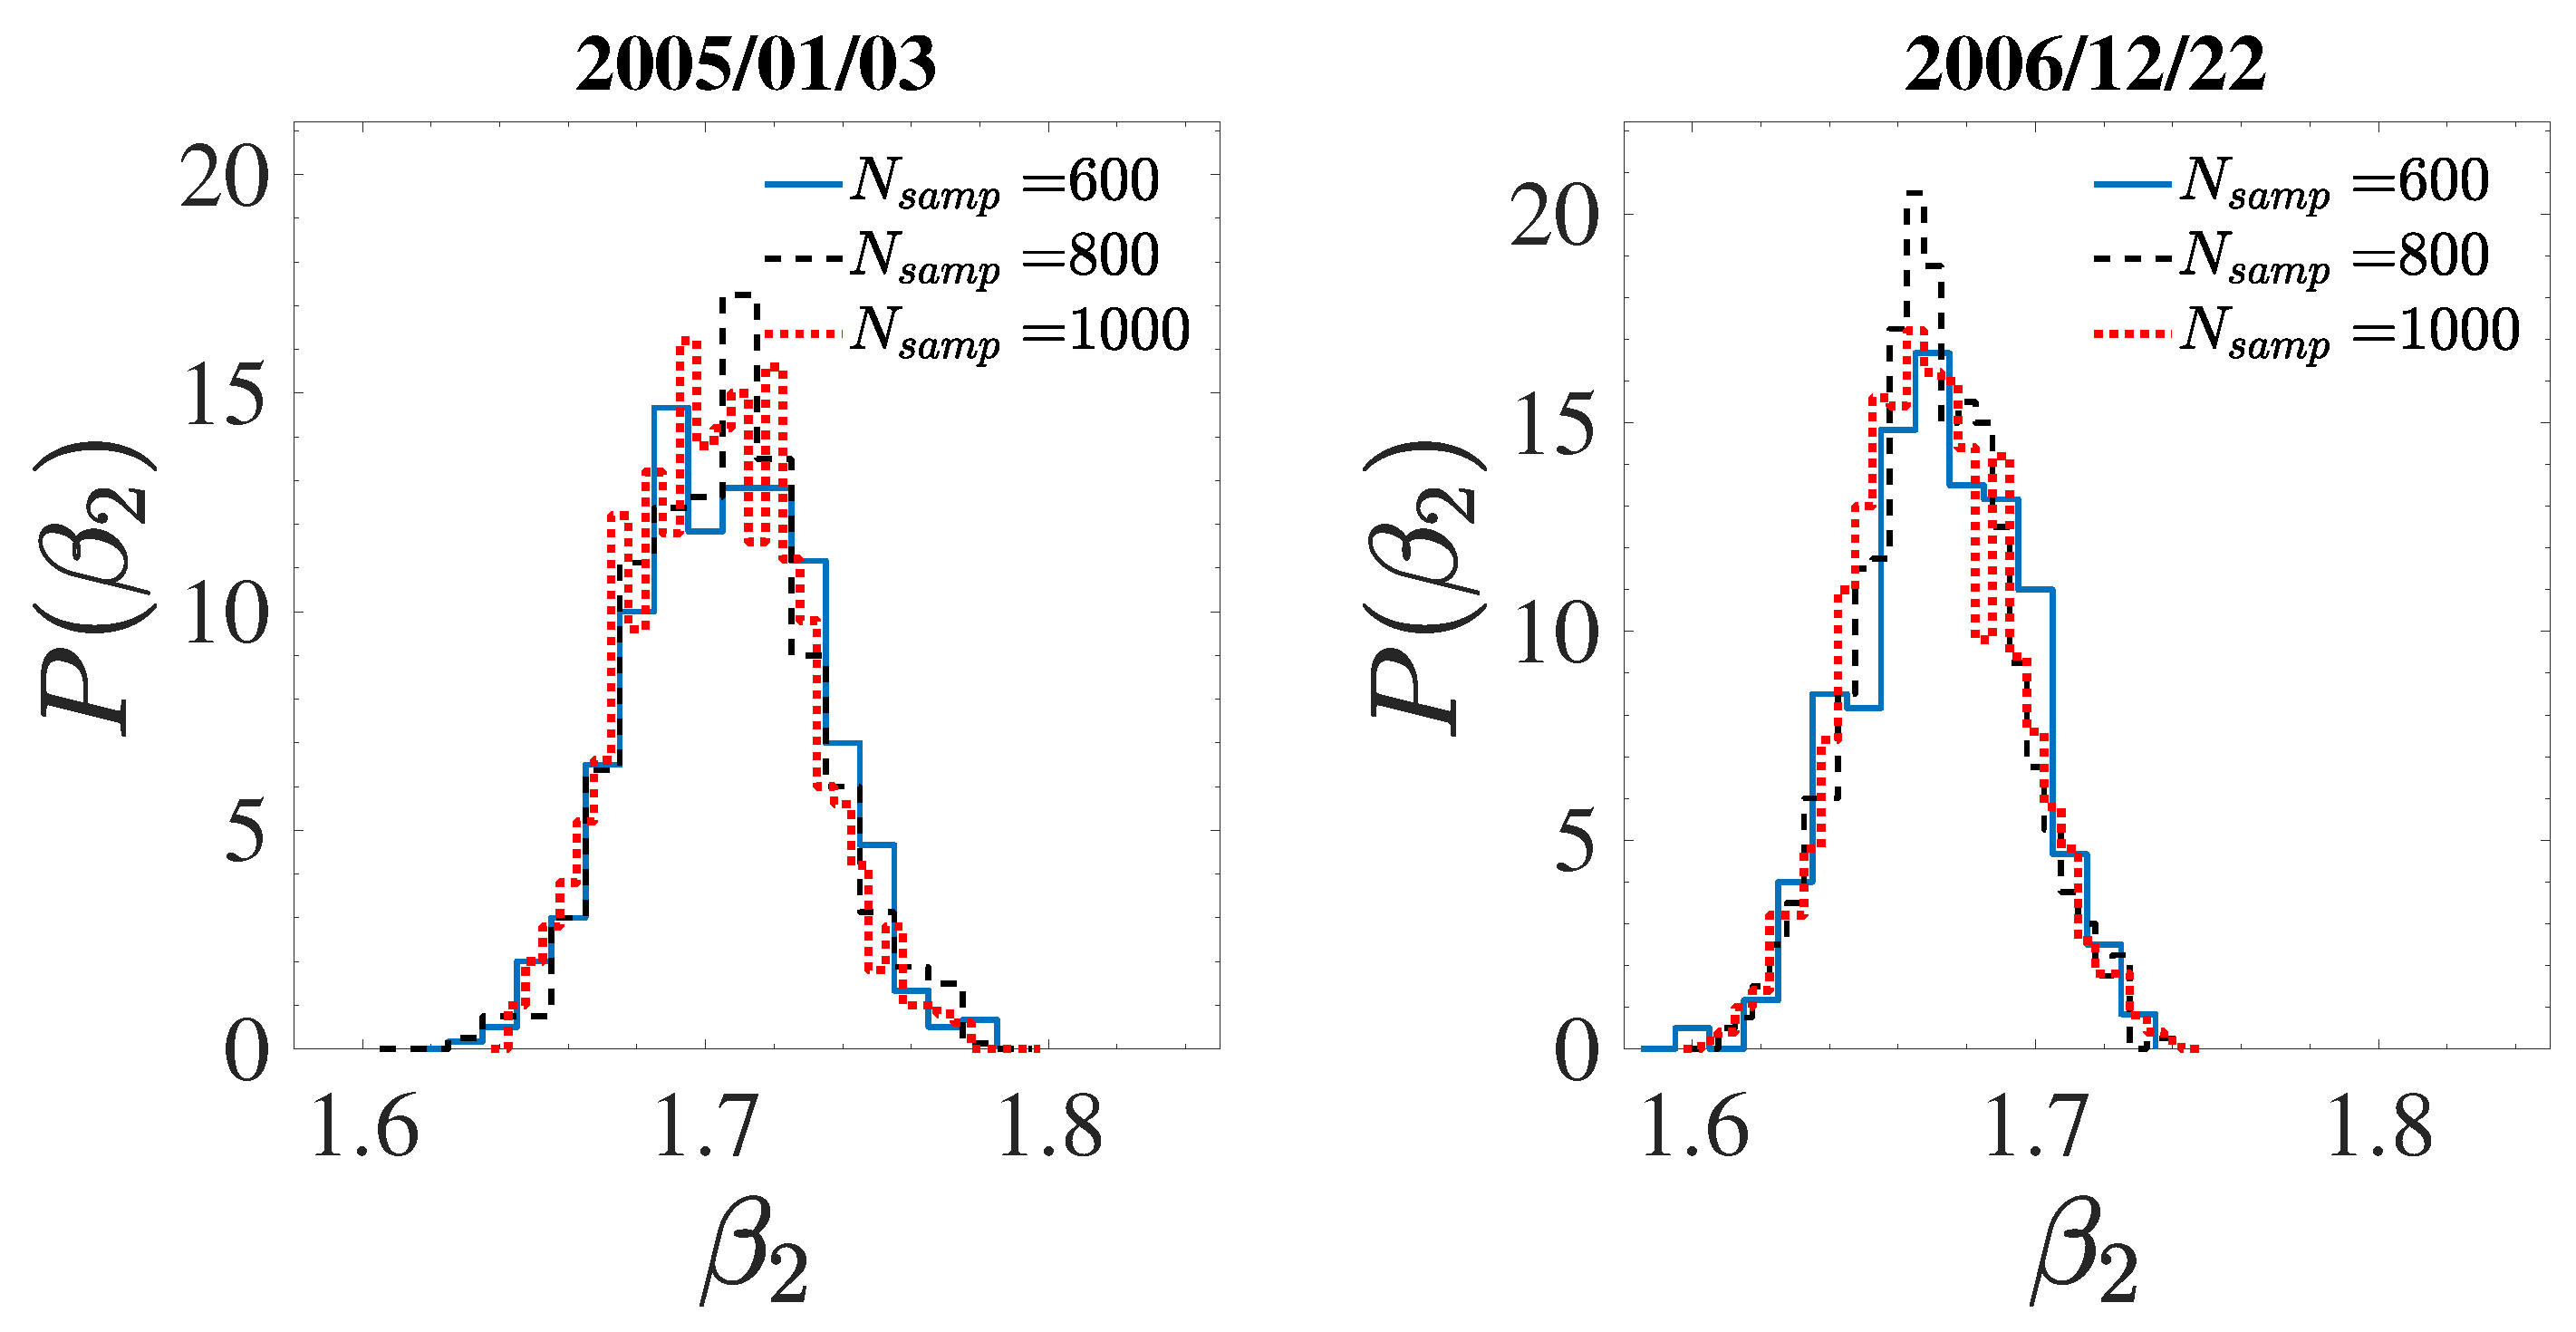
The resampling has been performed on all intervals, and for all orders q. The PDFs of slopes β 2 (component B z ( t ) ), constructed for different replica number N s a m p , are shown in Figure 4. It is evident that all the curves collapse on the same distribution, indicating good statistical convergence. Moreover, the distributions exhibits a peak at a value β 2 5 / 3 , consistently with previous results from six-minute intervals, with similar physical properties, reported in the literature [60].
Figure 5 presents the PDFs of the slopes β q obtained from the Hilbert spectra L q ( ω ) for the three B i components. The maximum order q m a x = 3 was selected using the approximate rule q m a x log N 1 . For each component B i , distributions have been built by bootstrapping the ensemble of all the intervals listed in Table 1. The bin width Δ was selected in accordance with the classical Freedman–Diaconis rule, Δ = 2 IQR [ β q ] n 1 / 3 , where IQR is the interquartile range of β q , and n the number of samples. Since no a priori assumption has been made on the distribution, this rule represents a suitable choice, as it is able to evidence the possible presence of heavy tails in the data.
From the results of the second order Hilbert spectra, a slope β 2 5 / 3 has been found, indicating that the parallel magnetic turbulence in fast, Alfvénic SW is characterized by the typical Kolmogorov spectrum. This was observed for all components B i [18,61]. Table 2 collects the slopes corresponding to various percentiles of the distribution of Figure 5, p 2 . 5 , p 50 , and p 97 . 5 , used to represent the 95 % of prediction interval. Values are given for the three orders q of the various components B i . As discussed before, a relation between the PSD index and the scaling exponent of the second order SF ζ ( 2 ) exists. Such relationship can be extended to any arbitrary order q, allowing to define a family of generalized scaling exponents ξ ( q ) through the generalized Hilbert spectra L q [36,37,46] as ξ ( q ) β q 1 . Thus, the set of exponents ξ ( q ) is the Hilbert analogue of the standard set of scaling exponents of the structure functions or, if necessary, of their Extended Self-Similarity equivalent [62,63].
Relation 3, therefore, represents an alternative method of extracting the spectral slope β and the SF scaling exponents, with the advantage of constraining the effects of noise and large-scale structures. The dependence of the scaling exponents on the order, and in particular its deviation from a linear relation, are useful for a quantitative estimate of the intermittency level [35,45,48].
The relation between ζ ( q ) and the Hurst exponent H is well known. In the classical Kolmogorov theory, the exponents are related to the qth-order moment of the fluctuations via the relation ζ ( q ) = q H , where the Hurst exponent describes the dynamical properties of the process: persistence (correlated fluctuations, long-term memory), or anti-persistence (anticorrelated fluctuations, short-term memory). The scaling exponent for q = 1 , therefore, coincides with the Hurst exponent itself, ζ ( 1 ) = H . By exploiting the above relation ξ ( q ) = β q 1 ζ ( q ) , it is possible to define the generalized scaling exponent as ξ ( q ) + 1 q H + 1 .
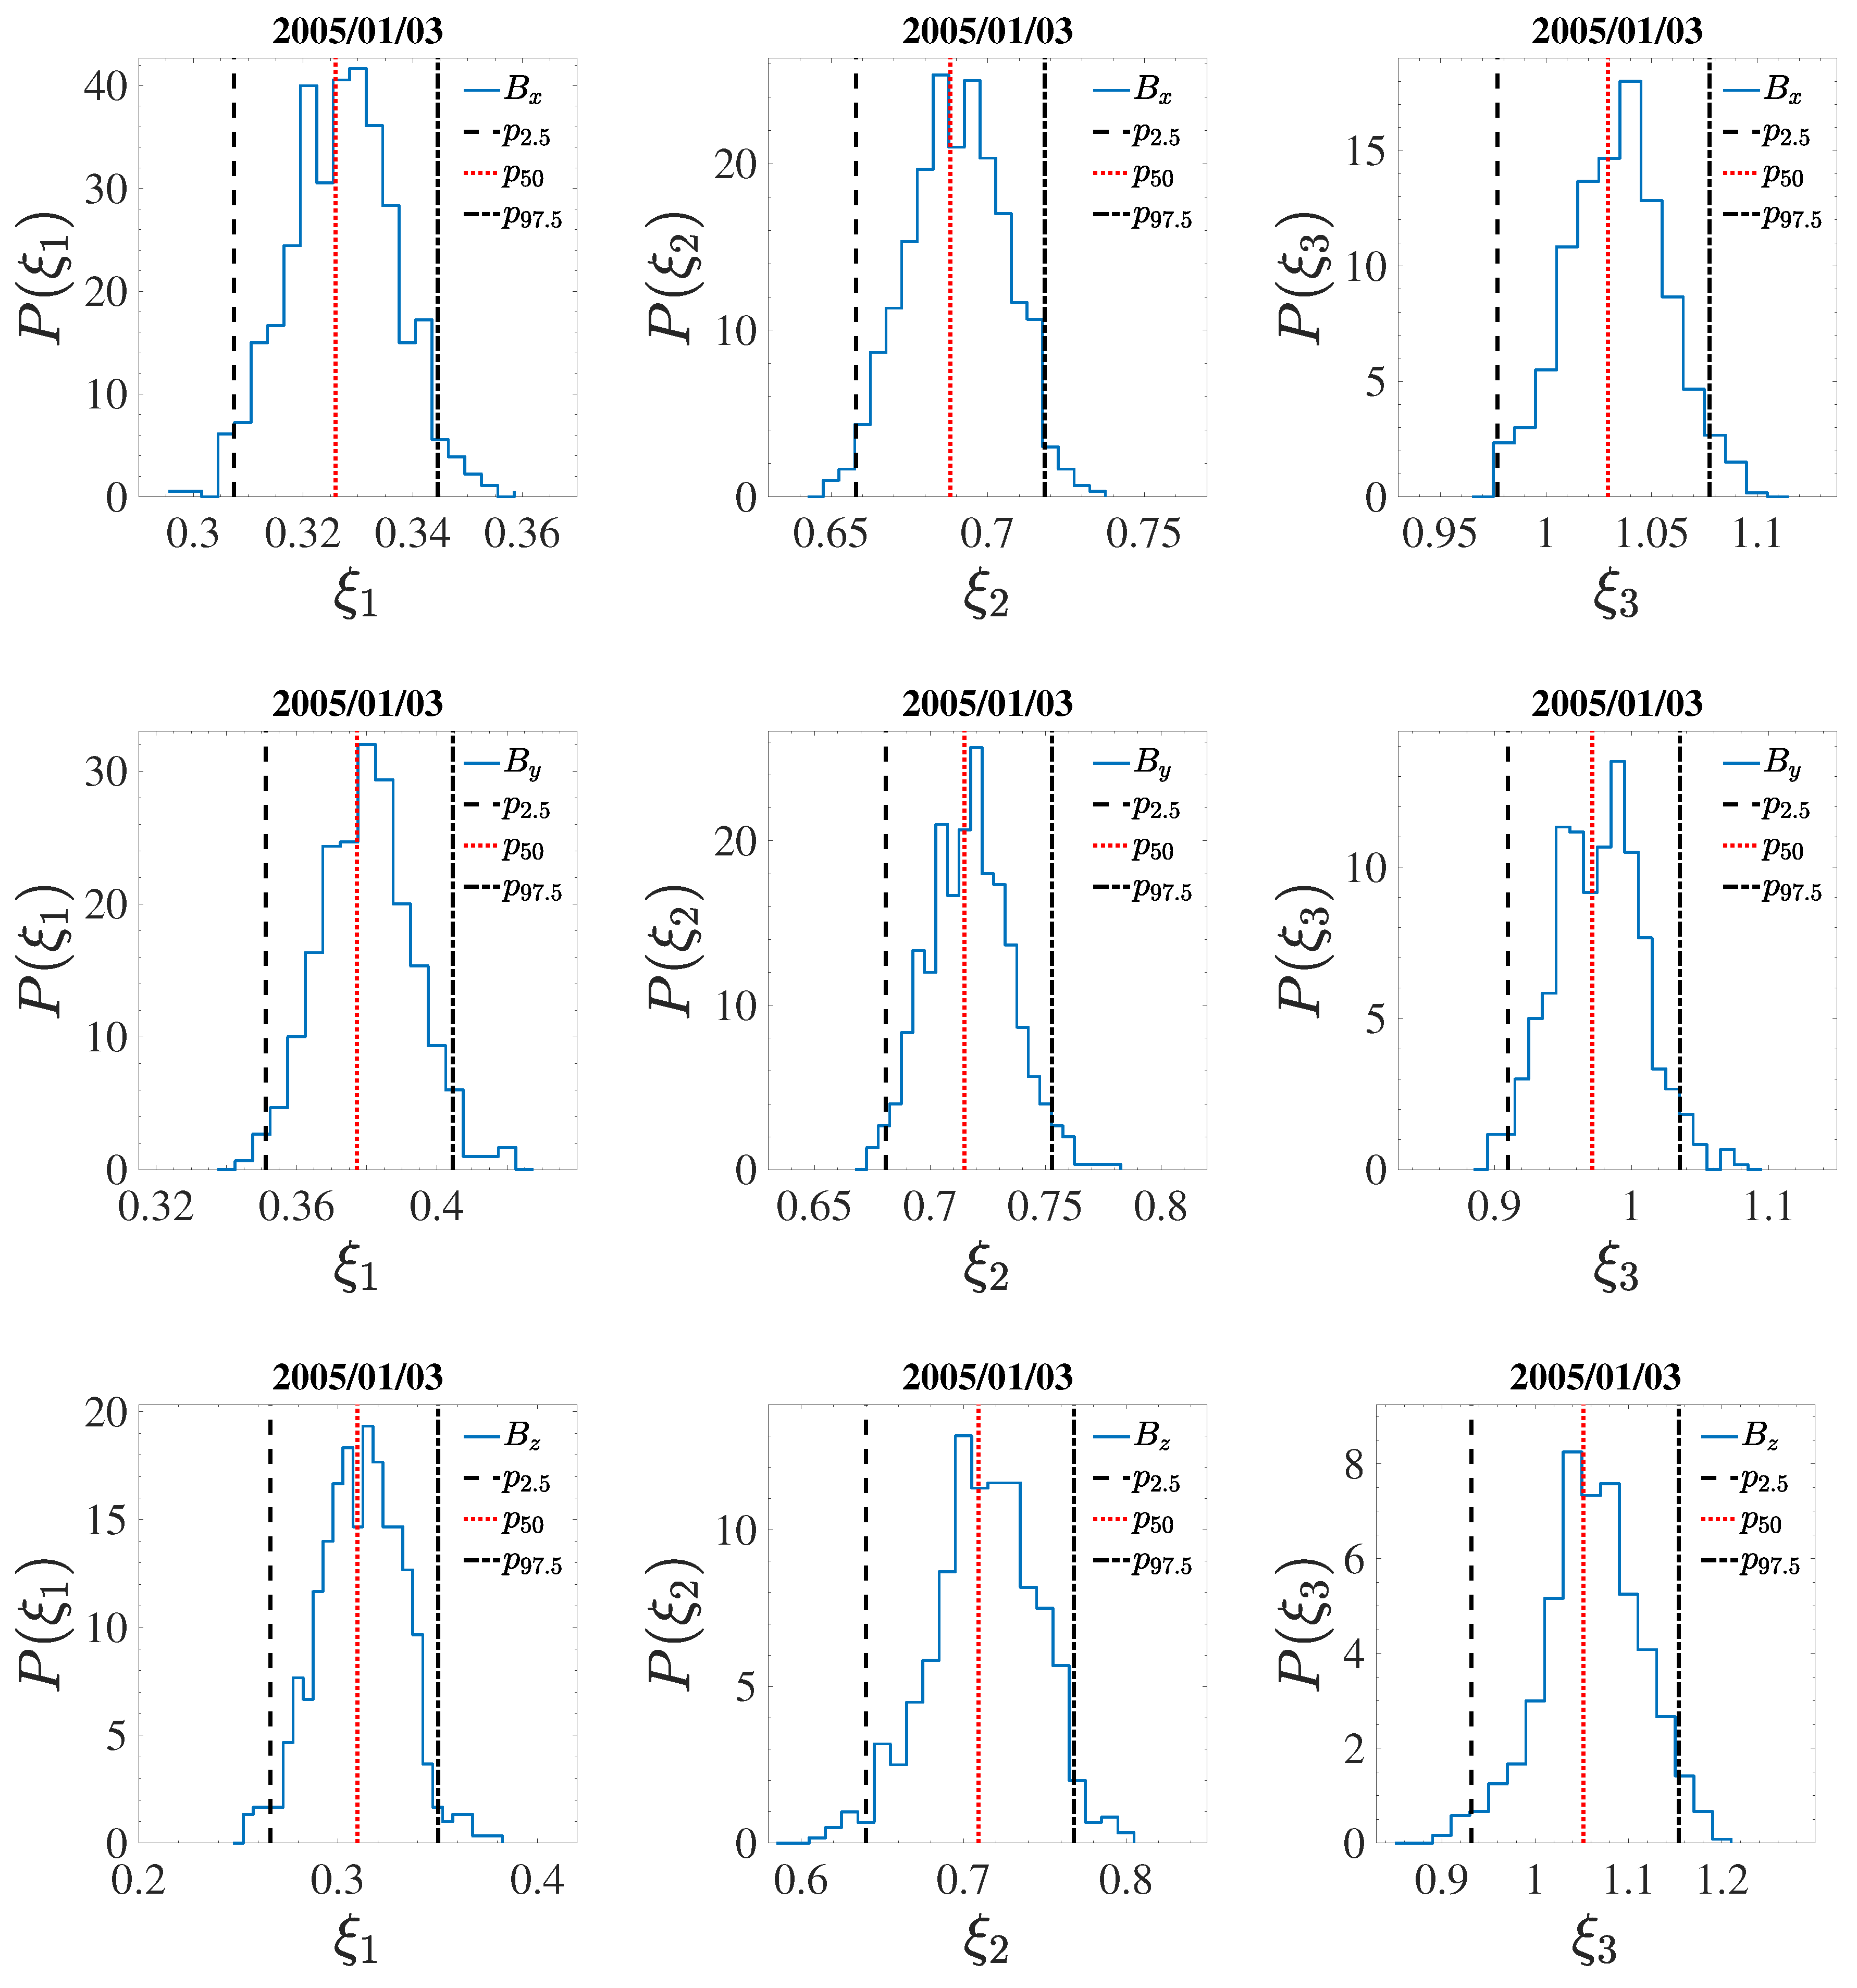
Examples of PDFs of ξ ( q ) , with the values associated to percentiles p 2 . 5 , p 50 , and p 97 . 5 indicated by vertical bars, are shown in Figure 6 for the sample dated 2005 / 01 / 03 , as obtained from the generalized Hilbert spectra.
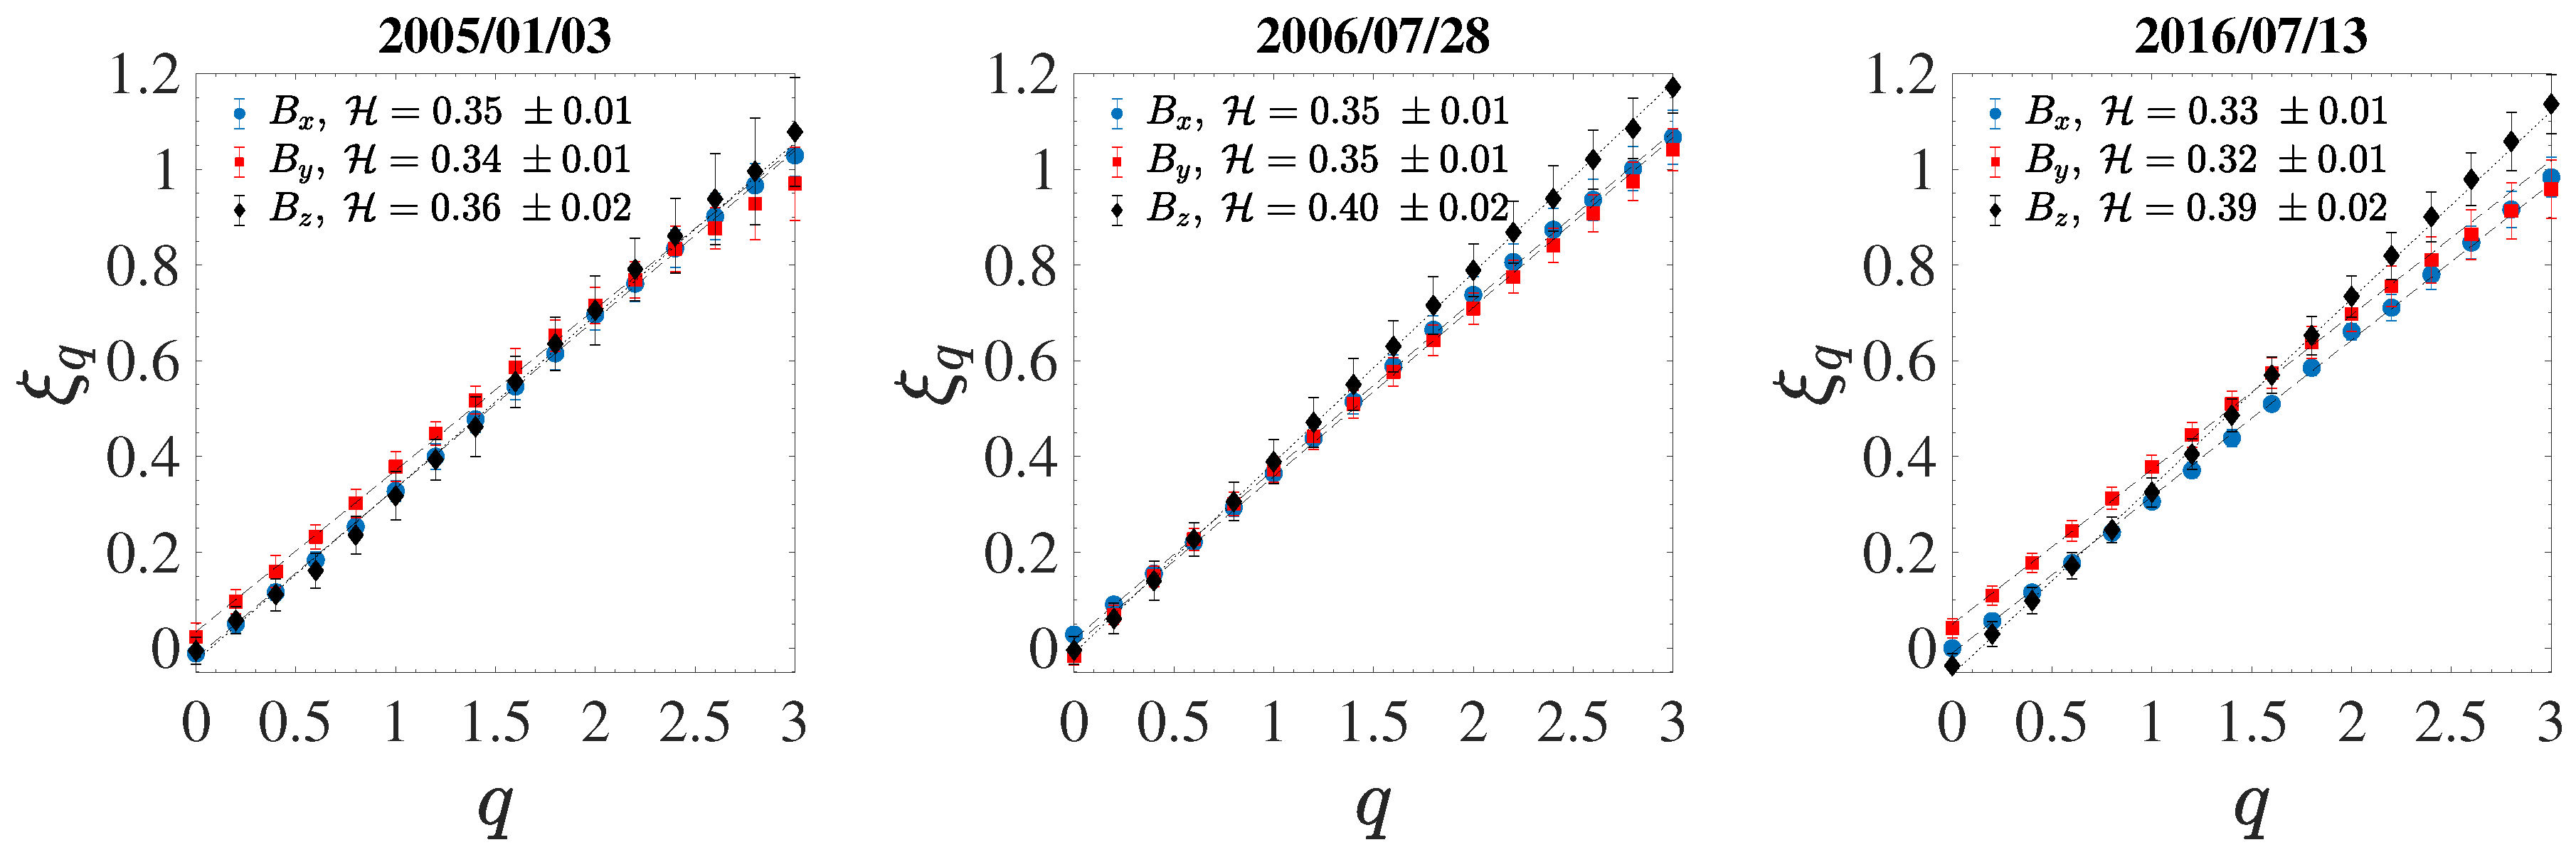
Finally, Figure 7 shows the order q dependence of the scaling exponents ξ ( q ) , estimated through the HSA in the inertial range, for the three magnetic components (color coded) and for three of the samples used here (the three different panels). Markers and error bars represent the median and the uncertainty of the ensemble, obtained as described above as the p 2 . 5 , p 50 , and p 97 . 5 percentiles of the distributions. The dashed lines represent linear dependency of the exponents on the order, expected for homogeneous, non-intermittent scaling of the fluctuations. The Hurst exponents H are thus computed through a simple least-square fit of the linear relation, and the resulting values are included in each panel. From the analysis of the scaling exponents ξ ( q ) , three different scenarios have emerged: (I) all the components of B ( t ) field have the same Hurst number H (Figure 7); (II) the three H are substantially different for the components of B ( t ) ; (III) two components are similar and the third is different. Despite the small differences observed in the various B i components, the Hurst exponent never reach the value for uncorrelated processes. For all samples the Hurst exponent present a value H < 0.5 (Figure 7), revealing (consistently) the presence of an anti-persistent dynamic (short-range correlations), compatible with the Kolmogorov scaling observed in the tradiational fluid turbulence. In some cases, a small deviation from the pure linear scaling is observed as the moment q increase, signature of the presence of a weak intermittentcy level. The Kolmogorov-like scaling k 5 / 3 (nearly self-similar) and a weak intermittency, could be characteristics features of the slab component ( k magnetic fluctuations) of the Alfvénic SW turbulence. Relatively weak levels of intremittency, or even its complete absence, have been observed in another experimental study, performed in the inverse cascade range of the two-dimensional turbulence, for an electromagnetically driven flow [64]. However, it should be pointed out that, contrary to what shown in Figure 3, in the 2D experiment no significant difference was found between parallel and perpendicular fluctuations [64].
Similar results have been reported also for others SW intervals [13,17] (in accordance with the selection criteria presented in this work). In particular it has been found that by removing the intermittency from the data, the PSD slope becomes close to k 5 / 3 losing the angle dependence between the local mean magnetic field and the flow direction.

5. Conclusions

In the attempt to describe the statistical properties of the k magnetic fluctuations of the fast Alfvénic solar wind, the EMD and the HSA have been applied to accurately selected Wind data intervals. By evaluating the generalized q-th order Hilbert spectra L q ( ω ) , the analogous of the scaling exponents of the structure functions have been evaluated from the data. In order to obtain a robust indication of the scaling properties of the various samples, a bootstrap resampling procedure have been applied in order to construct a prediction interval for the spectral slopes β q , and scaling exponents ξ ( q ) , measured via the Hilbert spectra L q , in the fast Alfvénic fast solar wind data. From the PDFs for the various slopes β 2 , estimated through the second order HSA analogous of the Fourier PSD, it has been found that β 2 x 1.65 , β 2 y 1.70 , and β 2 z 1.68 , which robustly indicate that the parallel magnetic spectrum in fast, Alfvénic solar wind are characterized by the classical Kolmogorov β = 5 / 3 spectral index. Moreover, the scaling exponents ξ ( q ) shows an almost linear dependence on the order q, and despite the small differences among the three components B i , the Hurst number H ξ ( 1 ) never reaches the threshold value for uncorrelated processes. In other words, H < 0.5 , revealing the anti-persistent behavior (short range correlations) of the k magnetic fluctuations. The relatively weak level of intermittency (or its absence) could also represents a key characteristics of k magnetic fluctuations. In light of this, since intermittency is a fundamental for the nonlinear turbulent cascade, it can be argued that the k turbulent properties could arise from a superposition of uncorrelated Alfvénic fluctuations, rather than from a fully developed nonlinear cascade. In this framework, the turbulent cascade could be activated among oppositely directed Alfvén modes, indicating that quasi uni-directional propagating Alfvén waves may produce a Kolmogorov-like turbulent spectrum [22].
The results presented in this work will be relevant to the Parker Solar Probe and Solar Orbiter missions, whose orbital characteristics are likely to sample solar wind intervals with the required characteristics to better confirm our observations and additionally study the radial evolution of such turbulence.

Author Contributions

Conceptualization, F.C., D.T.; Formal analysis, F.C., D.T.; Writing—original draft, F.C.; Writing—review & editing, F.C., D.T., L.S.-V., G.Z., L.Z., L.A., R.B. All authors have read and agreed to the published version of the manuscript.

Funding

F.C. was partially supported by the ERA-PLANET programme (www.era-planet.eu) (Contract.no. 689443) within the IGOSP project (www.igosp.eu).

Conflicts of Interest

The authors declare no conflict of interest.

References

  1. Bruno, R.; Carbone, V. The Solar Wind as a Turbulence Laboratory. Living Rev. Sol. Phys. 2013, 10, 2. [Google Scholar] [CrossRef] [Green Version]
  2. Horbury, T.; Wicks, R.; Chen, C. Anisotropy in Space Plasma Turbulence: Solar Wind Observations. Space. Sci. Rev. 2012, 172, 325. [Google Scholar] [CrossRef]
  3. Shebalin, J.V.; Matthaeus, W.H.; Montgomery, D. Anisotropy in MHD turbulence due to a mean magnetic field. J. Plasma Phys. 1983, 29, 525–547. [Google Scholar] [CrossRef] [Green Version]
  4. Goldreich, P.; Sridhar, S. Toward a theory of interstellar turbulence. II. Strong Alfvénic turbulence. Astrophys. J. 1995, 438, 763–775. [Google Scholar] [CrossRef]
  5. Boldyrev, S. Spectrum of Magnetohydrodynamic Turbulence. Phys. Rev. Lett. 2006, 96, 115002. [Google Scholar] [CrossRef] [Green Version]
  6. Chen, C.H.K.; Mallet, A.; Yousef, T.A.; Schekochihin, A.A.; Horbury, T.S. Anisotropy of Alfvénic turbulence in the solar wind and numerical simulations. Mon. Not. R. Astron. Soc. 2011, 415, 3219–3226. [Google Scholar] [CrossRef] [Green Version]
  7. Iroshnikov, P.S. Turbulence of a Conducting Fluid in a Strong Magnetic Field. Sov. Astron. 1964, 7, 566. [Google Scholar]
  8. Kraichnan, R.H. Inertial-Range Spectrum of Hydromagnetic Turbulence. Phys. Fluids 1965, 8, 1385–1387. [Google Scholar] [CrossRef] [Green Version]
  9. Montgomery, D.; Turner, L. Anisotropic magnetohydrodynamic turbulence in a strong external magnetic field. Phys. Fluids 1981, 24, 825–831. [Google Scholar] [CrossRef] [Green Version]
  10. Goldreich, P.; Sridhar, S. Toward a Theory of Interstellar Turbulence. I. Weak Alfvenic Turbulence Astrophys. J. 1994, 432, 612–621. [Google Scholar]
  11. Horbury, T.S.; Forman, M.; Oughton, S. Anisotropic Scaling of Magnetohydrodynamic Turbulence. Phys. Rev. Lett. 2008, 101, 175005. [Google Scholar] [CrossRef] [PubMed] [Green Version]
  12. Podesta, J.J. Dependence of Solar-Wind Power Spectra on the Direction of the Local Mean Magnetic Field. Astrophys. J. 2009, 698, 986–999. [Google Scholar] [CrossRef]
  13. Wicks, R.T.; Horbury, T.S.; Chen, C.H.K.; Schekochihin, A.A. Power and spectral index anisotropy of the entire inertial range of turbulence in the fast solar wind. Mon. Not. R. Astron. Soc. Lett. 2010, 407, L31–L35. [Google Scholar] [CrossRef] [Green Version]
  14. Forman, M.A.; Wicks, R.T.; Horbury, T.S. Detailed FIT of “Critical Balance” Theory to Solar Wind Turbulence Measurements. Astrophys. J. 2011, 733, 76. [Google Scholar] [CrossRef]
  15. Roberts, O.W.; Narita, Y.; Escoubet, C.P. Direct Measurement of Anisotropic and Asymmetric Wave Vector Spectrum in Ion-scale Solar Wind Turbulence. Astrophys. J. 2017, 851, L11. [Google Scholar] [CrossRef]
  16. Li, G.; Miao, B.; Hu, Q.; Qin, G. Effect of Current Sheets on the Solar Wind Magnetic Field Power Spectrum from the Ulysses Observation: From Kraichnan to Kolmogorov Scaling. Phys. Rev. Lett. 2011, 106, 125001. [Google Scholar] [CrossRef] [Green Version]
  17. Wang, X.; Tu, C.; He, J.; Marsch, E.; Wang, L. The Influence of Intermittency on the Spectral Anisotropy of Solar Wind Turbulence. Astrophys. J. 2014, 783, L9. [Google Scholar] [CrossRef]
  18. Telloni, D.; Carbone, F.; Bruno, R.; Sorriso-Valvo, L.; Zank, G.P.; Adhikari, L.; Hunana, P. No Evidence for Critical Balance in Field-aligned Alfvénic Solar Wind Turbulence. Astrophys. J. 2019, 887, 160. [Google Scholar] [CrossRef]
  19. Matthaeus, W.H.; Goldstein, M.L.; Roberts, D.A. Evidence for the presence of quasi-two-dimensional nearly incompressible fluctuations in the solar wind. J. Geophys. Res. Space Phys. 1990, 95, 20673–20683. [Google Scholar] [CrossRef]
  20. Zank, G.P.; Matthaeus, W.H. Waves and turbulence in the solar wind. J. Geophys. Res. Space Phys. 1992, 97, 17189–17194. [Google Scholar] [CrossRef]
  21. Dasso, S.; Milano, L.J.; Matthaeus, W.H.; Smith, C.W. Anisotropy in Fast and Slow Solar Wind Fluctuations. Astrophys. J. 2005, 635, L181–L184. [Google Scholar] [CrossRef]
  22. Zank, G.P.; Adhikari, L.; Hunana, P.; Shiota, D.; Bruno, R.; Telloni, D. Theory and Transport of Nearly Incompressible Magnetohydrodynamic Turbulence. Astrophys. J. 2017, 835, 147. [Google Scholar] [CrossRef]
  23. Bavassano, B.; Dobrowolny, M.; Fanfoni, G.; Mariani, F.; Ness, N.F. Statistical properties of MHD fluctuations associated with high-speed streams from Helios-2 observations. Sol. Phys. 1982, 78, 373–384. [Google Scholar] [CrossRef]
  24. Telloni, D.; Antonucci, E.; Bemporad, A.; Bianchi, T.; Bruno, R.; Fineschi, S.; Magli, E.; Nicolini, G.; Susino, R. Detection of Coronal Mass Ejections at L1 and Forecast of Their Geoeffectiveness. Astrophys. J. 2019, 885, 120. [Google Scholar] [CrossRef]
  25. Ogilvie, K.; Chornay, D.; Fritzenreiter, R.; Hunsaker, F.; Keller, J.; Lobell, J.; Miller, G.; Scudder, J.D.; Sittler, E.C.; Torbert, R.B.; et al. The WIND magnetic field investigation. Space Sci. Rev. 1995, 71, 55. [Google Scholar] [CrossRef]
  26. Lepping, R.P.; Acũna, M.H.; Burlaga, L.F.; Farrell, W.M.; Slavin, J.A.; Schatten, K.H.; Mariani, F.; Ness, N.F.; Neubauer, F.M.; Whang, Y.C.; et al. The WIND magnetic field investigation. Space Sci. Rev. 1995, 71, 207–229. [Google Scholar] [CrossRef]
  27. Treumann, R.A.; Baumjohann, W.; Narita, Y. On the applicability of Taylor’s hypothesis in streaming magnetohydrodynamic turbulence. Earth Planets Space 2019, 71, 41. [Google Scholar] [CrossRef]
  28. Mitchell, D.G.; Roelof, E.C.; Sanderson, T.R.; Reinhard, R.; Wenzel, K.-P. ISEE/IMP observations of simultaneous upstream ion events. J. Geophys. Res. Space Phys. 1983, 88, 5635–5644. [Google Scholar] [CrossRef]
  29. Haggerty, D.K.; Roelof, E.C.; Smith, C.W.; Ness, N.F.; Tokar, R.L.; Skoug, R.M. Interplanetary magnetic field connection to the L1 Lagrangian orbit during upstream energetic ion events. J. Geophys. Res. Space Phys. 2000, 105, 25123–25131. [Google Scholar] [CrossRef]
  30. Huang, N.E.; Shen, Z.; Long, S.R.; Wu, M.C.; Shih, H.H.; Zheng, Q.; Yen, N.C.; Tung, C.C.; Liu, H.H. The empirical mode decomposition and the Hilbert spectrum for nonlinear and non-stationary time series analysis. Proc. R. Soc. Lond. A Math. Eng. Sci. 1998, 454, 903–995. [Google Scholar] [CrossRef]
  31. Rilling, G.; Flandrin, P.; Goncalves, P. On empirical mode decomposition and its algorithms. In Proceedings of the IEEE-Eurasip Workshop on Nonlinear Signal and Image Processing NSIP-03, Grado, Italy, 8–11 June 2003. [Google Scholar]
  32. Jánosi, I.M.; Müller, R. Empirical mode decomposition and correlation properties of long daily ozone records. Phys. Rev. E 2005, 71, 056126. [Google Scholar] [CrossRef] [Green Version]
  33. Carbone, F.; Landis, M.S.; Gencarelli, C.N.; Naccarato, A.; Sprovieri, F.; De Simone, F.; Hedgecock, I.M.; Pirrone, N. Sea surface temperature variation linked to elemental mercury concentrations measured on Mauna Loa. Geophys. Res. Lett. 2016, 43, 7751–7757. [Google Scholar] [CrossRef] [Green Version]
  34. Cohen, L. Time-Frequency Analysis; Prentice Hall PTR Englewood Cliffs: Upper Saddle River, NJ, USA, 1995. [Google Scholar]
  35. Huang, Y.X.; Schmitt, F.G.; Lu, Z.M.; Liu, Y.L. An amplitude-frequency study of turbulent scaling intermittency using Empirical Mode Decomposition and Hilbert Spectral Analysis. EPL Europhys. Lett. 2008, 84, 40010. [Google Scholar] [CrossRef] [Green Version]
  36. Huang, Y.X.; Schmitt, F.G.; Lu, Z.M.; Fougairolles, P.; Gagne, Y.; Liu, Y.L. Second-order structure function in fully developed turbulence. Phys. Rev. E 2010, 82, 026319. [Google Scholar] [CrossRef] [PubMed] [Green Version]
  37. Carbone, F.; Gencarelli, C.N.; Hedgecock, I.M. Lagrangian statistics of mesoscale turbulence in a natural environment: The Agulhas return current. Phys. Rev. E 2016, 94, 063101. [Google Scholar] [CrossRef] [PubMed]
  38. Carbone, F.; Alberti, T.; Sorriso-Valvo, L.; Telloni, D.; Sprovieri, F.; Pirrone, N. Scale-Dependent Turbulent Dynamics and Phase-Space Behavior of the Stable Atmospheric Boundary Layer. Atmosphere 2020, 11, 428. [Google Scholar] [CrossRef] [Green Version]
  39. Carbone, F.; Yoshida, H.; Suzuki, S.; Fujii, A.; Strangi, G.; Versace, C.; Ozaki, M. Clustering of elastic energy due to electrohydrodynamics instabilities in nematic liquid crystals. EPL Europhys. Lett. 2010, 89, 46004. [Google Scholar] [CrossRef]
  40. Sorriso-Valvo, L.; Carbone, F.; Leonardis, E.; Chen, C.H.; Šafránková, J.; Němeček, Z. Multifractal analysis of high resolution solar wind proton density measurements. Adv. Space Res. 2017, 59, 1642–1651. [Google Scholar] [CrossRef] [Green Version]
  41. Wu, Z.; Huang, N.E. A study of the characteristics of white noise using the empirical mode decomposition method. Proc. R. Soc. Lond. A Math. Eng. Sci. 2004, 460, 1597–1611. [Google Scholar] [CrossRef]
  42. Flandrin, P.; Rilling, G.; Goncalves, P. Empirical mode decomposition as a filter bank. IEEE Signal Process. Lett. 2004, 11, 112–114. [Google Scholar] [CrossRef] [Green Version]
  43. Flandrin, P.; Goncalves, P. Empirical mode decomposition as data-driven wavelet-like expansions. Int. J. Wavelets Multiresolution Inf. Process. 2004, 1, 477–496. [Google Scholar] [CrossRef]
  44. Huang, N.E.; Shen, S.S.P. (Eds.) The Hilbert-Huang Transform and Its Applications; World Scientific: Singapore, 2005. [Google Scholar]
  45. Carbone, F.; Sorriso-Valvo, L.; Alberti, T.; Lepreti, F.; Chen, C.H.K.; Němeček, Z.; Šafránková, J. Arbitrary-order Hilbert Spectral Analysis and Intermittency in Solar Wind Density Fluctuations. Astrophys. J. 2018, 859, 27. [Google Scholar] [CrossRef]
  46. Carbone, F.; Telloni, D.; Bruno, A.G.; Hedgecock, I.M.; De Simone, F.; Sprovieri, F.; Sorriso-Valvo, L.; Pirrone, N. Scaling Properties of Atmospheric Wind Speed in Mesoscale Range. Atmosphere 2019, 10, 611. [Google Scholar] [CrossRef] [Green Version]
  47. Kolmogorov, A.N. The local structure of turbulence in incompressible viscous fluid for very large Reynolds numbers. CR Acad. Sci. URSS 1941, 30, 301–305. [Google Scholar]
  48. Frisch, U. (Ed.) Turbulence: The Legacy of A. N. Kolmogorov; Cambridge University Press: Cambridge UK, 1995. [Google Scholar]
  49. Huang, N.E.; Shen, Z.; Long, S.R. A New View of Nonlinear Water Waves: The Hilbert Spectrum1. Annu. Rev. Fluid Mech. 1999, 31, 417–457. [Google Scholar] [CrossRef] [Green Version]
  50. Huang, N.E.; Chen, X.; Lo, M.T.; Wu, Z. On Hilbert Spectral Representation: A True Time-Frequency Representation for Nonlinear and Nonstationary Data. Adv. Adapt. Data Anal. 2011, 3, 63–93. [Google Scholar] [CrossRef]
  51. Monin, A.S.; Yaglom, A.M. Statistical Fluid Mechanics: Mechanics of Turbulence; Dover: New York, NY, USA, 2007. [Google Scholar]
  52. Bradley, E.; Robert, J.T. An Introduction to the Bootstrap (Chapman & Hall CRC Monographs on Statistics & Applied Probability), 1st ed.; CRC Press: Boca Raton, FL, USA; Taylor & Francis Group: Abingdon, UK, 1994. [Google Scholar]
  53. Boos, D.; Stefanski, L. Efron’s bootstrap. Significance 2010, 7, 186–188. [Google Scholar] [CrossRef]
  54. Mudelsee, M. Climate Time Series Analysis: Classical Statistical and Bootstrap Methods, 2nd ed.; Atmospheric and Oceanographic Sciences Library 51, Springer International Publishing: Berlin/Heidelberg, Germany, 2014. [Google Scholar]
  55. Efron, B.; Rogosa, D.; Tibshirani, R. Resampling Methods of Estimation. In International Encyclopedia of the Social & Behavioral Sciences, 2nd ed.; Wright, J.D., Ed.; Elsevier: Oxford, UK, 2015; pp. 492–495. [Google Scholar] [CrossRef]
  56. Wu, C.F.J. Jackknife, Bootstrap and Other Resampling Methods in Regression Analysis. Ann. Statist. 1986, 14, 1261–1295. [Google Scholar] [CrossRef]
  57. Rao, J.N.K.; Wu, C.F.J. Resampling Inference with Complex Survey Data. J. Am. Stat. Assoc. 1988, 83, 231–241. [Google Scholar] [CrossRef]
  58. Dale, L.G.; William, L.; Ron, T. Does PLS Have Advantages for Small Sample Size or Non-Normal Data? MIS Q. 2012, 36, 981–1001. [Google Scholar]
  59. Wilcox, R.R. Fundamentals of Modern Statistical Methods: Substantially Improving Power and Accuracy, 2nd ed.; Springer: New York, NY, USA, 2010. [Google Scholar]
  60. Wang, X.; Tu, C.; He, J.; Marsch, E.; Wang, L.; Salem, C. The Spectral Features of Low-Amplitude Magnetic Fluctuations in the Solar Wind and Their Comparison with Moderate-Amplitude Fluctuations. Astrophys. J. 2015, 810, L21. [Google Scholar] [CrossRef]
  61. Wu, H.; Tu, C.; Wang, X.; He, J.; Yang, L.; Wang, L. Isotropic Scaling Features Measured Locally in the Solar Wind Turbulence with Stationary Background Field. Astrophys. J. 2020, 892, 138. [Google Scholar] [CrossRef]
  62. Benzi, R.; Ciliberto, S.; Tripiccione, R.; Baudet, C.; Massaioli, F.; Succi, S. Extended self-similarity in turbulent flows. Phys. Rev. E 1993, 48, R29–R32. [Google Scholar] [CrossRef] [PubMed]
  63. Arneodo, A.; Baudet, C.; Belin, F.; Benzi, R.; Castaing, B.; Chabaud, B.; Chavarria, R.; Ciliberto, S.; Camussi, R.; Chillà, F.; et al. Structure functions in turbulence, in various flow configurations, at Reynolds number between 30 and 5000, using extended self-similarity. EPL Europhys. Lett. 1996, 34, 411–416. [Google Scholar] [CrossRef]
  64. Paret, J.; Tabeling, P. Intermittency in the two-dimensional inverse cascade of energy: Experimental observations. Phys. Fluids 1998, 10, 3126. [Google Scholar] [CrossRef]
Figure 1. Left panel: Temporal evolution of the SW bulk speed V (upper plots), zoom of the velocity on the 1-hour region of interest (central plots), and the magnitude of the magnetic field | B | (bottom plots) for the sample dated 2005 / 01 / 03 . The velocity is steady on the whole interval. Central panels: same as previous plot but for sample dated 2007 / 09 / 03 . Right panel: Power spectral density (in dimensional form) for the three components of the magnetic field B x , B y , and B z in the wavevector space, obtained via the traditional Taylor frozen hypothesis [1]. The dashed line represents the theoretical Kolmogorov scaling k 5 / 3 .
Universe 06 00116 g001
Figure 2. Left panel: Intrinsic Mode Functions (IMFs) j [ 3 , 13 ] and the associated residual r ϕ , obtained through Empirical Mode Decomposition (EMD) for sample dated 2005 / 01 / 03 . Modes j = 1 , 2 have been excluded from the plot for readability. Central panel: Log-linear plot of the average IMF period as a function of the mode j (sample 2005/01/03); error bars represent the 95 % confidence bounds; the dashed lines represent the relation τ j = α × γ j , with γ = 1.97 ± 0.01 . Right panel: Comparison of Fourier power spectral density (black line) for sample 2005 / 01 / 03 with the Fourier power spectrum of different IMFs ϕ j ( ω ) ( j [ 1 , 13 ] ), as a function of frequency ω (the curves have been vertically shifted for clarity); the band-like structure of each IMF shows the dyadic nature of the decomposition.
Universe 06 00116 g002
Figure 3. Left panel: Hilbert marginal spectrum, L 2 ( ω ) , for the components B x ( t ) , B y ( t ) , and B z ( t ) of the magnetic field (sample 2005 / 01 / 03 ). In all cases the slope of L 2 ( ω ) is perfectly comparable with the slope of the PSD. The power anisotropy among the parallel and perpendicular direction is observed in all samples. Central Panel: value of the average ratio R ( ω ) (with the 95 % of confidence bounds) between the parallel and perpendicular components of the magnetic field B ( t ) , for all frequency in the inertial range ω [ 10 2 , 10 1 ] (sample 2005 / 01 / 03 ). The horizontal dashed line represent the theoretical value for the isotropy ratio from the Kolmogorov’s second similarity hypothesis R ( ω ) = 3 / 4 for homogeneous and isotropic turbulence [51]. Right panel: Comparison of the Hilbert spectrum, L 2 ( ω ) (circles) with the classical Fourier PSD E ( ω ) (solid line), and the second-order structure function S 2 ( t 1 ) (squares, t 1 represent the inverse time scale), relative to the component B z ( t ) of sample 2006 / 07 / 28 . The power-law behavior in the inertial range is clearly observable with all methods. The scaling exponent, obtained via least square fit are: β 2 = 1.61 ± 0.10 (dashed line) and ζ ( 2 ) = 0.57 ± 0.02 . The curves have been vertically shifted for clarity.
Universe 06 00116 g003
Figure 4. Distribution of slopes β 2 for two samples (component B z ), and for three different number of replicas N s a m p . The PDFs have been constructed by using the residual resampling method.
Universe 06 00116 g004
Figure 5. Distribution of the slopes β q constructed with all the results obtained from the resampling, and from all intervals, relatives to the three component of the magnetic field B ( t ) . The spectral slope β 2 (analogous of the Fourier spectral slope) is characterized by a slope β 2 5 / 3 fully compatible with the classical Kolmogorov spectrum.
Universe 06 00116 g005
Figure 6. Histograms of the measured scaling exponents ξ ( q ) for the first three orders q = 1 , 2 , 3 (form left to right columns), for the three magnetic components x, y, z (top to bottom), for sample 2005 / 01 / 03 . Vertical bars indicate the various percentiles: p 2.5 (dashed line), p 50 (dotted line), and p 97.5 (dash-dotted line), respectively.
Universe 06 00116 g006
Figure 7. Scaling exponents ξ ( q ) obtained through the HSA, in the inertial range, for three differents samples (solid symbols).
Universe 06 00116 g007
Table 1. Parameters of wind data considered for the analysis: the SW bulk speed, proton number density and temperature were measured by the Solar Wind Experiment (SWE) instrument [25] at Δ ω 0.01 Hz resolution; magnetic field at resolution Δ ω 11 Hz was measured by the Magnetic Field Investigation (MFI) magnetometer [26]. The magnetic compressibility C B has been evaluated at scale of 20 min, within in the inertial range.
DateStart TimeEnd Time V [km s 1 ] P m [nPa] C B [%] θ VB [deg]
2005/01/0313:36:5614:36:43631.70.0262210.07
2005/05/0910:06:1011:16:43639.20.03387.13
2006/06/1814:02:3615:13:07579.60.0142313.20
2006/07/2821:13:0822:28:15564.00.007199.60
2006/12/2323:33:5600:33:43640.90.01779.75
2007/09/0307:39:4808:50:19592.80.0141010.64
2007/10/2700:24:1601:51:39576.90.028169.63
2011/04/1301:31:5602:31:43554.90.0201010.04
2014/06/0901:06:4802:55:39588.80.0161810.41
2015/03/2214:00:4015:28:03647.00.044139.99
2016/07/1301:14:4802:17:39575.40.021219.67
2016/07/1305:17:0407:25:51574.70.018159.10
Table 2. Various percentile obtained from PDFs of Figure 5, for  the three order Hilbert spectra L q : p 2.5 , p 50 , and  p 97.5 .
ComponentOrder qPercentile p
p 2 . 5 p 50 P 97 . 5
11.211.311.39
B x 21.551.651.75
31.832.012.31
11.261.361.47
B y 21.551.701.80
31.752.002.24
11.261.331.44
B z 21.561.681.83
31.812.022.24