Communication

Hadron Spectra Parameters within the Non-Extensive Approach †

by
Keming Shen
*,
Gergely Gábor Barnaföldi
and
Tamás Sándor Biró
Wigner Research Center for Physics of HAS, 29-33 Konkoly-Thege Miklós Street, 1121 Budapest, Hungary
*
Author to whom correspondence should be addressed.
This paper is based on my talk at the 18th Zimányi School, Budapest, Hungary, 3–7 December 2018.
These authors contributed equally to this work.
Universe 2019, 5(5), 122; https://doi.org/10.3390/universe5050122
Submission received: 8 April 2019 / Revised: 18 May 2019 / Accepted: 20 May 2019 / Published: 21 May 2019
(This article belongs to the Special Issue The Zimányi School and Analytic Hydrodynamics in High Energy Physics)

Abstract

:
We investigate how the non-extensive approach works in high-energy physics. Transverse momentum ( p T ) spectra of several hadrons are fitted by various non-extensive momentum distributions and by the Boltzmann–Gibbs statistics. It is shown that some non-extensive distributions can be transferred one into another. We find explicit hadron mass and center-of-mass energy scaling both in the temperature and in the non-extensive parameter, q, in proton–proton and heavy-ion collisions. We find that the temperature depends linearly, but the Tsallis q follows a logarithmic dependence on the collision energy in proton–proton collisions. In the nucleus–nucleus collisions, on the other hand, T and q correlate linearly, as was predicted in our previous work.

1. Introduction

In high-energy nuclear physics, the investigation of transverse momentum ( p T ) spectra is a fundamental measure in statistical approaches. The p T spectrum reveals information on the kinetic properties of the particles produced in high-energy collisions. Strong correlation phenomena were recently observed in proton–proton and heavy-ion collisions [1,2], their statistical and thermodynamical description points beyond the classical Boltzmann–Gibbs (BG) statistics. It has long been realized that data on single inclusive particle distributions show a power-law behavior in the high- p T region. For these, the Pareto–Hagedorn–Tsallis distribution has been frequently applied [3,4,5]. Its form coincides with the generalized q-exponential function [6]:
e q ( x ) : = [ 1 + ( 1 - q ) x ] 1 1 - q .
Hadron spectra can be described by the Lorentz-invariant particle spectra. These were successfully fitted by the non-extensive distributions in a wide center-of-mass energy and p T range [7,8,9,10,11,12,13,14,15,16,17,18,19,20]. In the following, we focus on the most often used formulas from [7,8,9,10,11,12,13,14,15] for representing identified particle spectra in various collisions. This work explores differences between ( m T m ) and m T -dependent, as well as simple p T functions:
E d 3 N d 3 p = d 3 N d y p T d p T d ϕ = 1 2 π p T d 2 N d y d p T .
Different research groups used various kinds of expressions of it in order to describe p T spectra. We consider functions of m T m and p T in the non-extensive approach, after applying the normalized functions and the thermodynamically motivated ones [21]. Our aim is to find the best-fitting functions among these, while assigning a physical interpretation to their parameters. We investigate the following distribution forms:
f 0 = f B G = A 0 · exp m T m T 0 , f 1 = A 1 · 1 + m T m n 1 T 1 n 1 , f 2 = A 2 · ( n 2 1 ) ( n 2 2 ) 2 π n 2 T 2 [ n 2 T 2 + m ( n 2 2 ) ] · 1 + m T m n 2 T 2 n 2 , f 3 = A 3 · m T 1 + m T m n 3 T 3 n 3 , f 4 = A 4 · 1 + m T n 4 T 4 n 4 , f 5 = A 5 · 1 + p T n 5 T 5 n 5 .
There are relations among the distributions defined above. It is easy to realize that f 1 and f 2 coincide whenever their amplitudes satisfy the relation
A 1 = A 2 · ( n 2 1 ) ( n 2 2 ) 2 π n 2 T 2 [ n 2 T 2 + m ( n 2 2 ) ] = A 2 · C q , and n 1 = n 2 .
Accounting for the differences between ( m T m ) and m T dependencies, we re-cast f 1 and f 4 described in Equation (3) as follows:
f 1 = A 1 · 1 m n 1 T 1 n 1 · 1 + m T n 1 T 1 m n 1 .
Comparing this with f 4 , we arrive at the relations
A 1 · 1 m n 1 T 1 n 1 = A 4 , n 1 = n 4 , and n 1 T 1 m = n 4 T 4 .
These comments are important for the comparison of different approaches. They also demonstrate that no inconsistency occurs by applying different fit formulas. However, differences arise from the statistical physical motivations behind these formulas [7,8,9,10,11,12,21,22]. The corresponding results and discussions are investigated next. Note that for all the physical quantities, we use the natural units, c = 1 , for convenience in this paper.

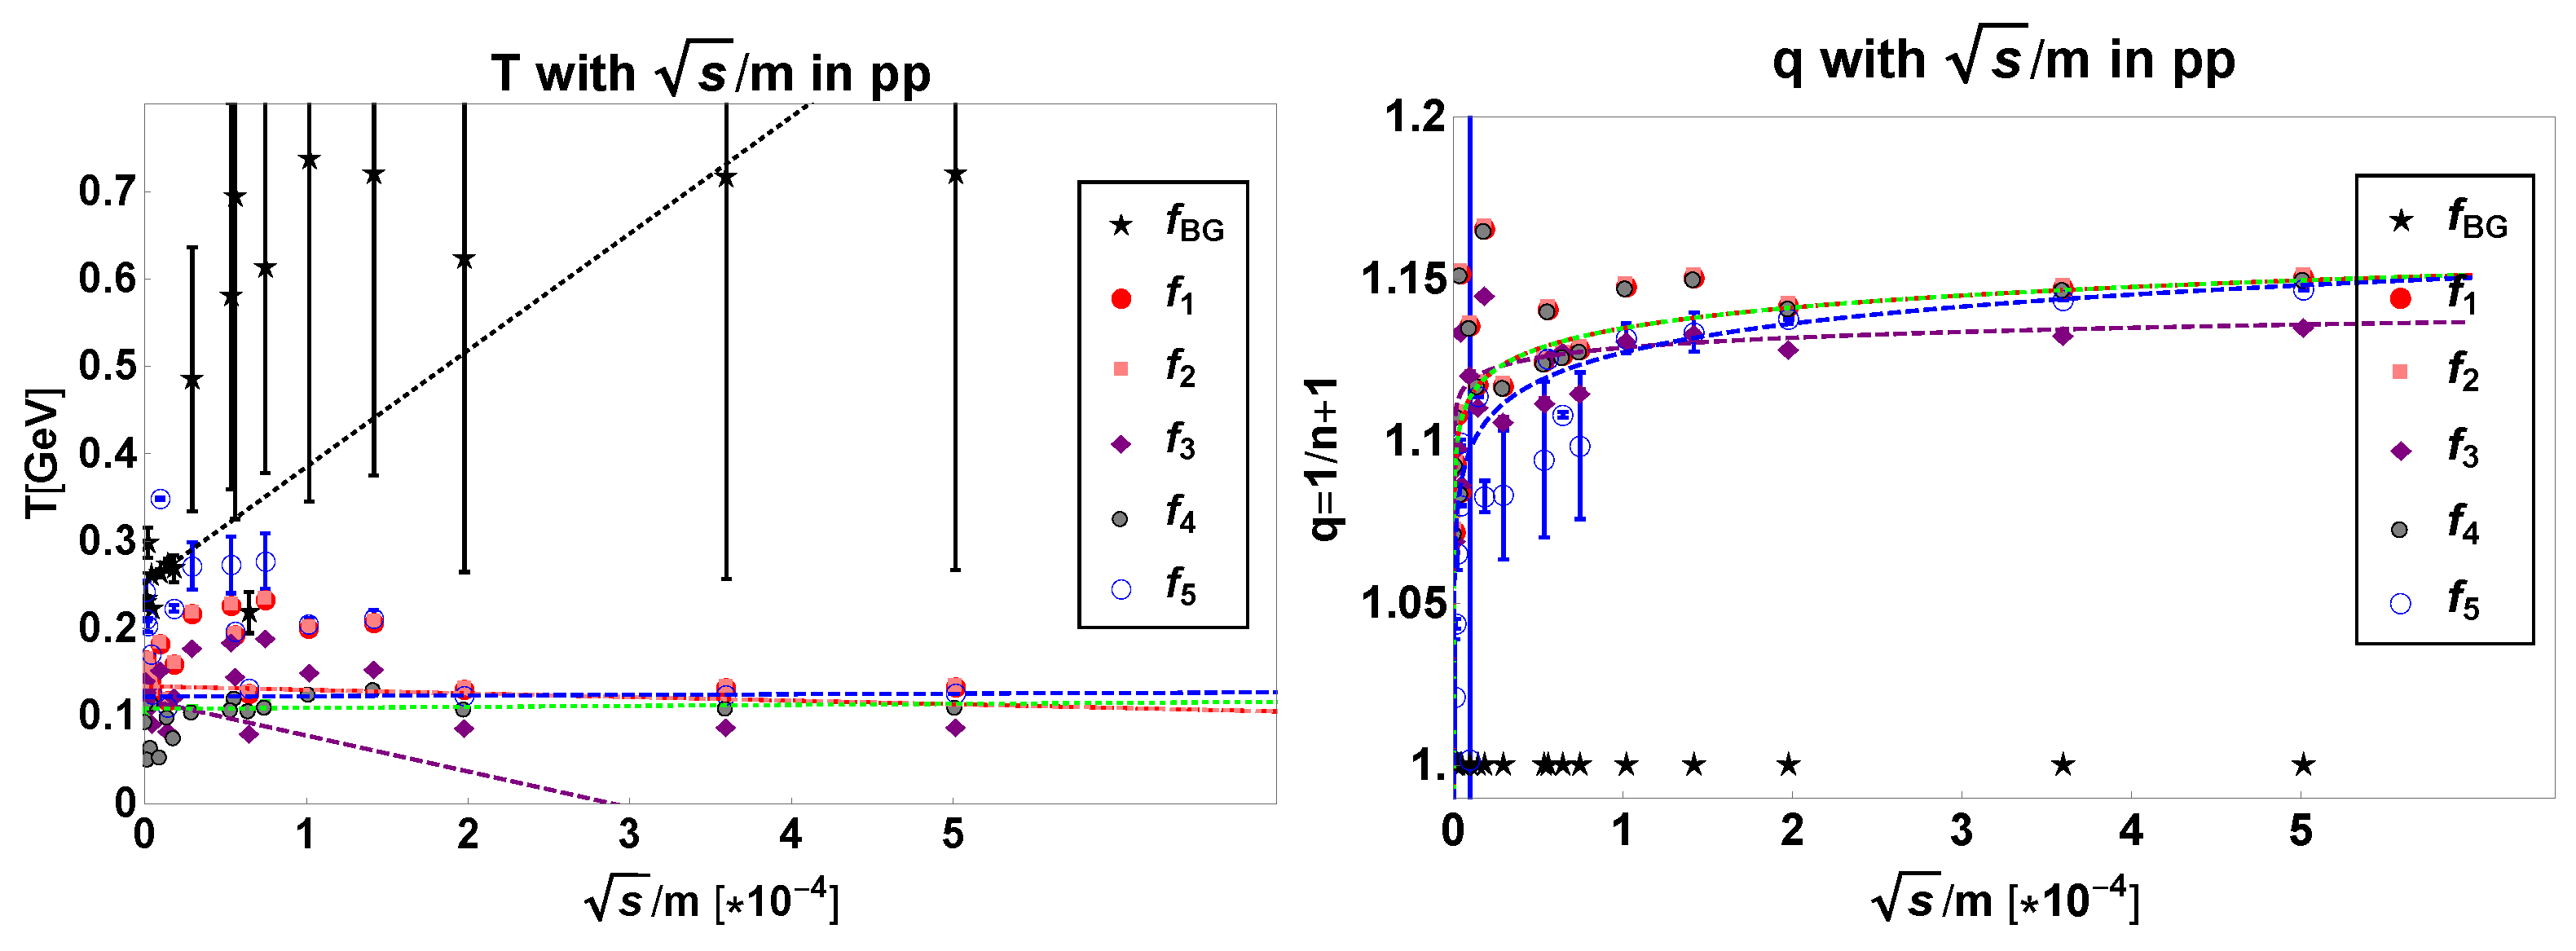
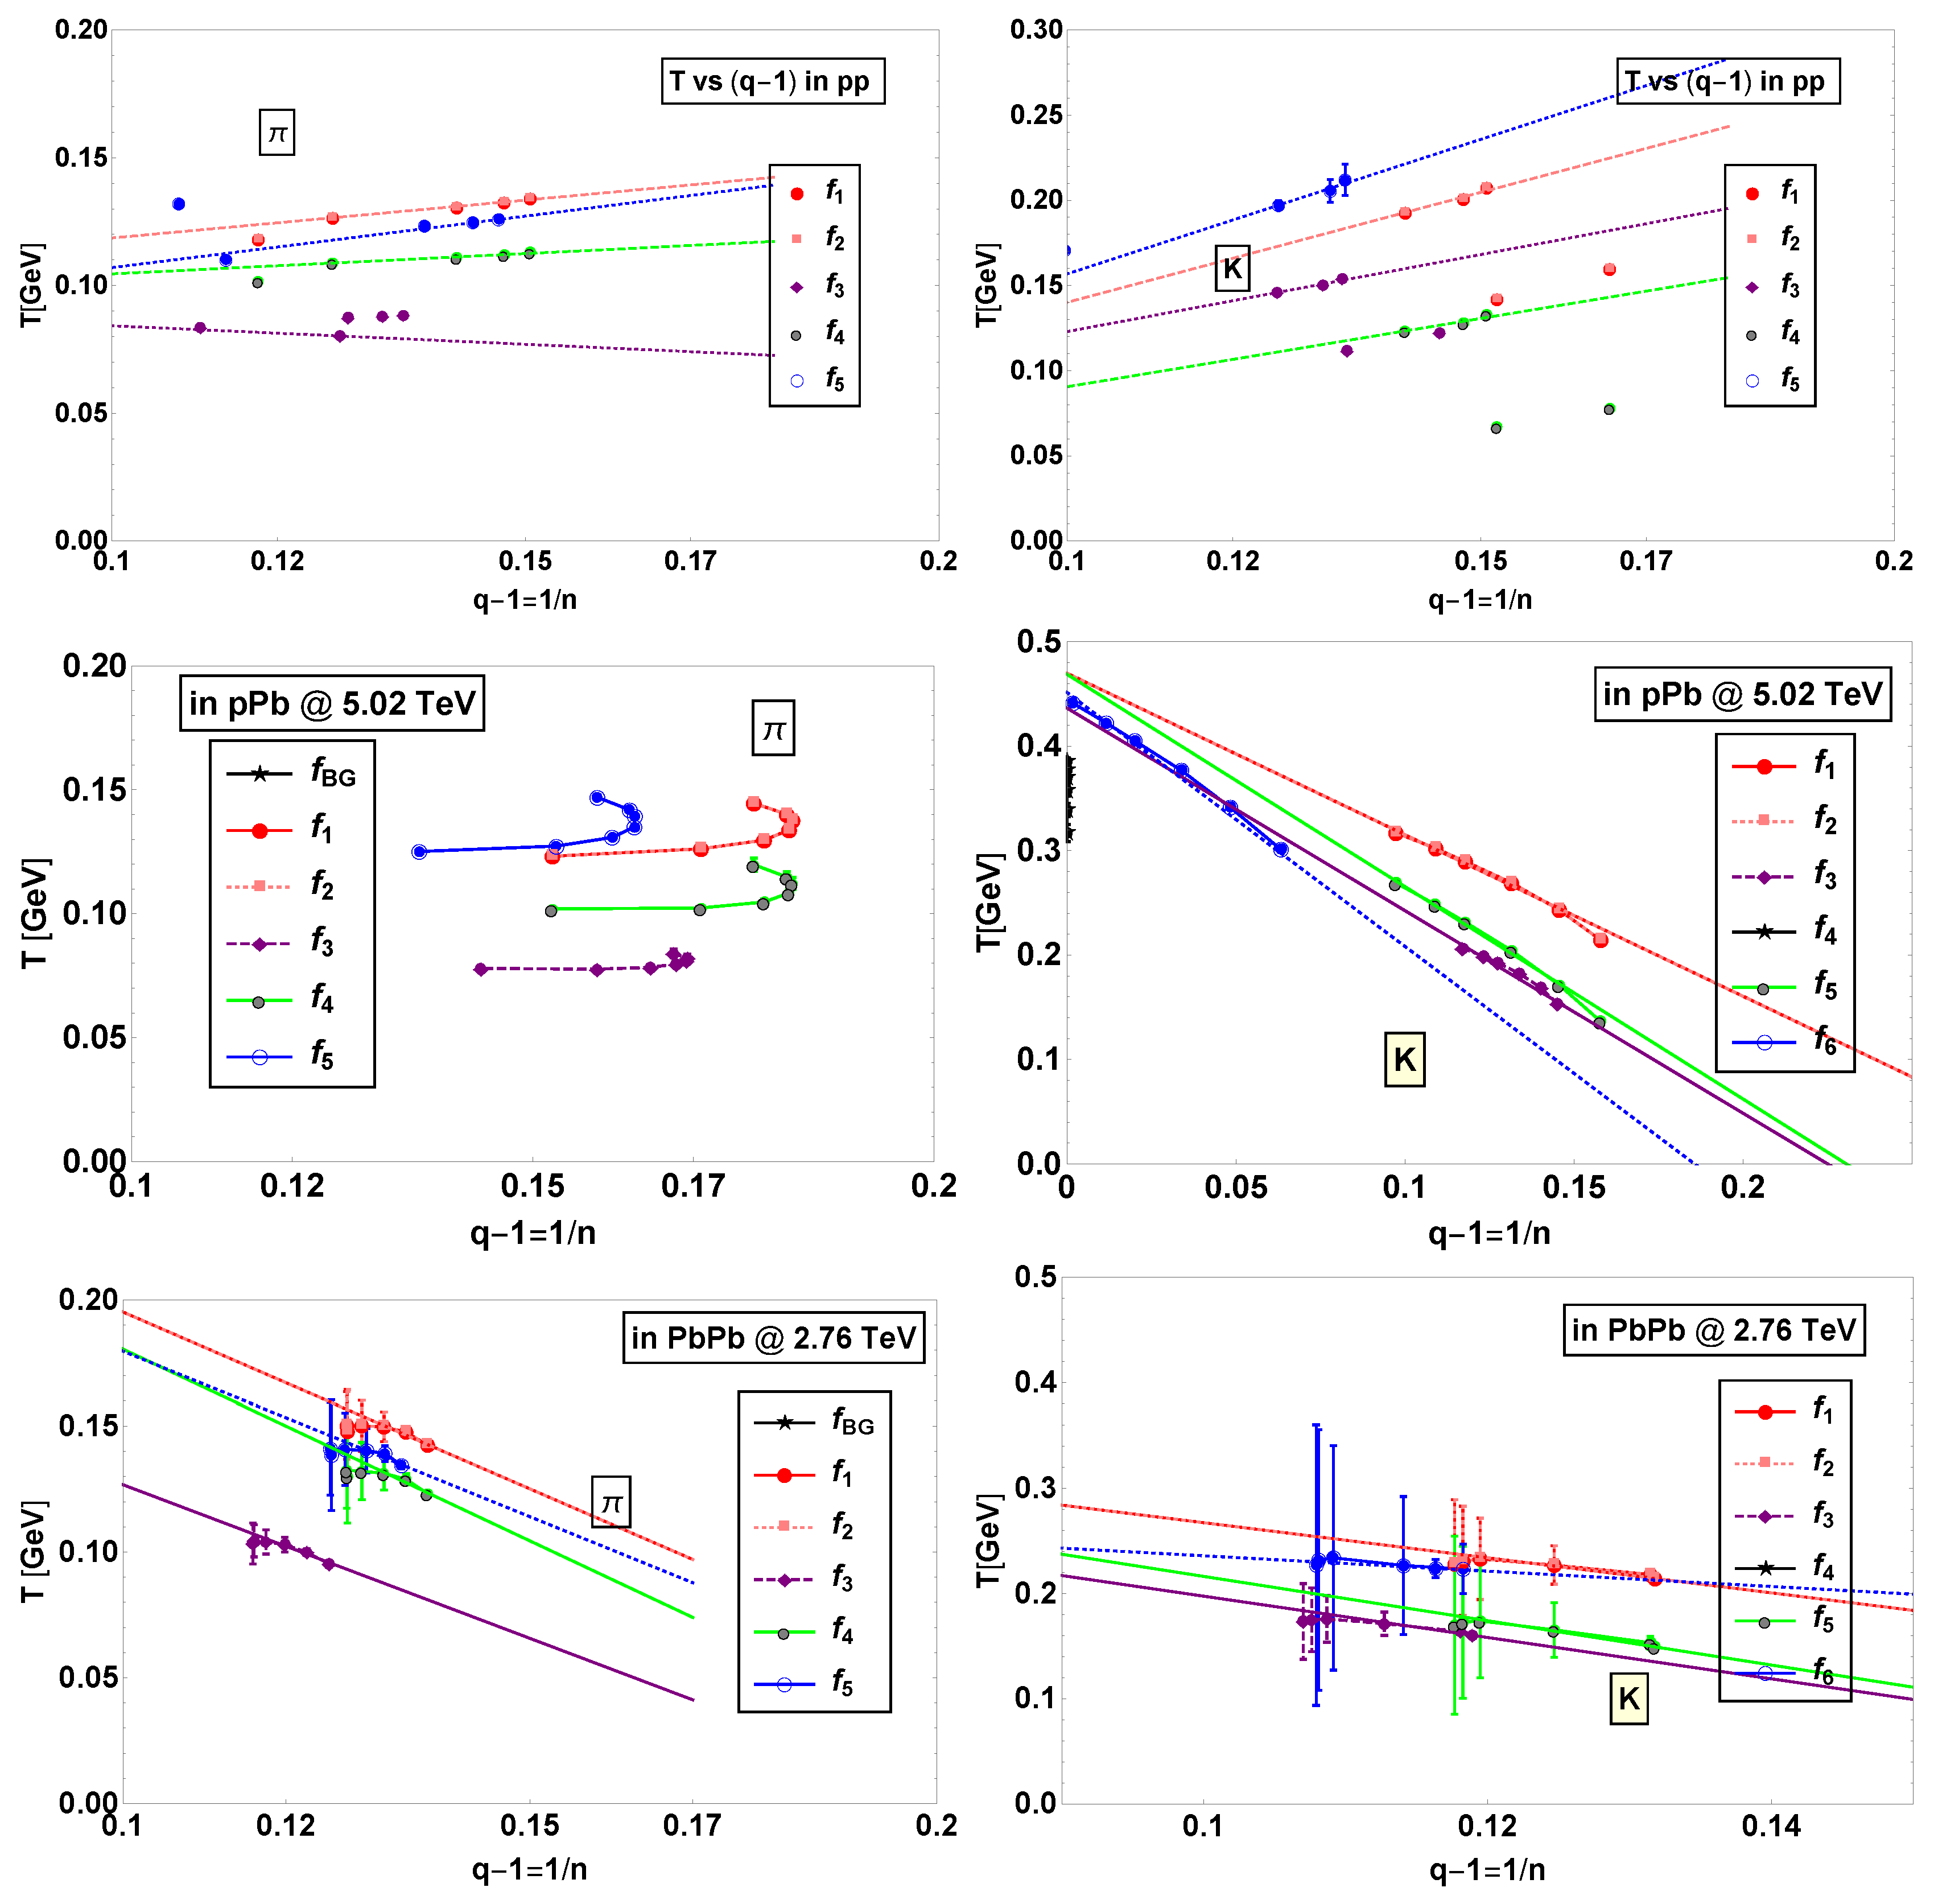
2. Results and Discussions

In this section, we analyze the transverse momentum distributions of identified pions and kaons stemming from the elementary ( p p ) and heavy-ion ( p P b and P b P b ) collisions fitted by the functions listed in Equation (3). All the relevant parameters are then analyzed in order to investigate further the non-extensive physics behind these collisions.

2.1. Analysis of the p p Spectra

In high-energy physics, even the smallest hadron–hadron ( p p ) collisions are rather complicated processes. One usually separates two main regimes of hadron production: one is a soft multiparticle production, dominant at low transverse momenta, where the spectra can also be fitted by an exponential behavior [23], cf. the curve f B G in Figure 1. We realize that f B G describes well this part of the spectra even in p p collisions. As p T gets higher ( p T > 3 GeV), the spectrum displays a power-law tail. They are predicted by perturbative QCD, owing to the hard scattering of current quarks and gluons. In a number of publications [16,17,18,19,20], the Tsallis statistical distribution was successfully applied to describe data for p p collisions over a wide range of the transverse momenta because of its two limits: the exponential shape at small p T and the power-like distribution at large p T ,
e q ( p T T ) e p T / T p T 0 ( q 1 ) p T T 1 1 q p T . .
We focus on the fittings of the produced charged particle spectra in elementary collisions with the non-extensive functions in Equation (3). Data were taken for pions, kaons, and protons in p p collisions at s = 62 . 4 GeV, 200 GeV from the PHENIX Collaboration [18] and at 900 GeV [16], 2.76 TeV [19], 5.02 TeV, and 7 TeV [17] from the ALICE Collaboration. We restrict our analysis to the midrapidity region | y | < 0 . 5 within the p T ranges, as shown in Table 2. Note that in the following, π , K, and p mark the spectra of π + + π 2 , K + + K 2 , and p + p ¯ 2 , respectively.
Figure 1 shows that all of the different non-extensive functions we used fit the pion and kaon spectra very well for various kinds of beam energies at midrapidity. The ratios of χ 2 / d . o . f . of the relevant fits are given in Table 1. Specifically, the first two distributions ( f 1 and f 2 ) of m T m and f 4 of m T show close-fitting results. The distribution, f 3 , derived thermodynamically, does not display large differences in the goodness of fit either. Checking the fitting parameters A, T, and q = 1 + 1 / n , we observe that, as we expected and introduced in the previous section, all these functions share the same Tsallis parameter n. The two m T m functions ( f 1 and f 2 ) lead to fitting values of the temperature T, which are different from the pure m T fit ( f 4 ). This indicates that the normalization constant does not affect the fitted T and q parameters but the integrated yield d N / d y . Namely, by normalizing the momentum spectrum
1 2 π p T d 2 N d y d p T = A 2 · C q · 1 + m T m n 2 T 2 n 2
with the C q normalization constant and the condition of A 2 = d N / d y , we obtain the integral over p T from 0 to its maximal values p T m a x :
0 p T m a x 1 2 π p T d 2 N d y d p T 2 π p T d p T = d N d y .
Moving towards physical interpretation issues, we investigate the temperature, T, and the non-extensive parameter, q. Investigations in [18,24] showed that both of them express s dependence. In this paper, we found that they are also dependent on the hadron mass, m. The s / m dependence, as a result, is studied in order to analyze hadron spectra parameters within the non-extensive approach. Following the phenomenological observations in [25,26], a QCD-like evolution can be introduced for both the parameters T and q. While analyzing data, we found that the temperature T had a weak logarithmic s / m dependence. Thus, here we assume a linear s / m dependence to analyze the temperature T, but the non-extensive parameter q is kept with the stronger logarithmic distribution:
T = T 0 + T 1 · s m , and q = q 0 + q 1 · ln s m .
In summary, our work indicates that the BG distribution is not suitable for describing the hadron spectra over a wide range of p T . Comparisons of their corresponding fitting errors χ 2 / d . o . f . show that both m T m and m T functions share the same goodness between f 1 and f 2 , cf. Equation (3). Together with the thermodynamically derived f 3 , all the non-extensive approaches ( f 1 f 4 ) follow the experimental data accurately. The fitting temperature, T, is nearly constant when changing the ratio of the collision energy to hadron mass, s / m . Specifically, distributions of f 1 , f 2 , f 4 , and f 5 are described best with such a connection, as shown in the left panel of Figure 2. From Table 3, we also see that the slope parameters in these four cases are almost zero, which means that they are constant around some values. The non-extensive parameter q, on the other hand, follows a logarithmic dependence, agreeing with a pQCD-based motivation, cf. [21]. Note that our results on T and q are different from the work by Cleymans et al. [24]. Those authors parameterized this relation as a power-law.

2.2. Analysis of the p P b and P b P b Results

In p P b [17] collisions at 5.02 TeV and in P b P b [27,28,29,30] collisions at 2.76 TeV, more kinds of hadron spectra are analyzed within the formulas of Equation (3). Data are taken from the ALICE Collaboration within wide p T ranges, as seen in Table 4. We observe that all of them present good fittings over the whole range of p T for each hadron at various kinds of centrality bins. On the other hand, similar to the p p cases, the BG formula can still perform well just in the low p T region ( p T < 3 GeV).
In this work, as an example, we analyzed the fitting results of p T spectra of pions and kaons produced in all kinds of collisions mentioned above. It is instructive to plot the relationship between the fitting temperature T and the Tsallis parameter q for the same hadron spectra for different centralities in the same heavy-ion collisions. The results of pions and kaons in p p collisions are also analyzed as comparisons. In Figure 3, we show the linear correlating appearances for both π and K in p P b at 2.76 TeV [17] and in P b P b at 5.02 TeV [27,28] as well as the p p results in all kinds of collision energies [16,17,18,19] in this paper. In fact, whatever kinds of particle we study, all these non-extensive fittings give a similar dependence of T on the parameter q:
T T 0 ( q 1 ) T 1 ,
which agrees with our previous work [21,22] and that of others [31].
Note that the slope parameter T 1 in Table 5 turns negative and T 0 is nearly zero for the p p case, as discussed in [22]. Results of fittings on pion spectra, typically in p P b collisions at 5.02 TeV, fail in the obvious linear combinations probably due to the small mass of pions and high multiplicities. It is found that all forms of non-extensive distributions feature a similar relation between the temperature T and non-extensive parameter q. This, in turn, hopefully promotes a better understanding of the meaning of the non-extensive parameter q.

3. Summary

In this work, we analyzed various fitting formulas of the hadron spectra in order to explore their sensitivity to different fitting parameters in use within the non-extensive approaches, cf. Equation (3). The hadronization, as well as the p T distributions in high-energy physics (in proton–proton, proton–nucleus, and nucleus–nucleus collisions) are being studied here. For more details, see [21].
Our results reveal that normalization parameters have no major effect on the shape of these functions. In other words, the fitting formulas of either m T m or m T lead to the same fit quality. As shown in Table 1, they obtained similar fitting values of χ 2 / d . o . f . Finally, we investigated the relationship between the fitting parameters, T and q. In p p collisions, the temperature values were fitted by the linear relation of s / m , while the non-extensive parameter q had a logarithmic s / m dependence, motivated by the QCD-like evolution [25,26]. All kinds of approaches led to linear relations between the temperature, T, and the non-extensive parameter, q 1 , in heavy-ion collisions at different centralities. This agrees well with our previous results [21,22] and others in [31].
Summarizing, based on the Tsallis q-exponential, five types of non-extensive formulas in Equation (3) were investigated in parallel to the usual BG distribution. Results showed that the BG statistics failed in describing the hadronization in the whole p T range. Within the non-extensive approaches, m T m functions obtained similar fitting results to the m T ones. This provides a free choice between the functions m T m and m T when analyzing the hadron spectra. On the other hand, it does not make any differences with regards to the normalization. Nevertheless, the normalized function, f 2 , is the best choice since it is also connected to the particle yield per unit rapidity, d N / d y , by its normalization, A 2 .

Author Contributions

Authors contributed equally to the contribution.

Funding

This research was funded by the Hungarian National Research, Development and Innovation Office (NKFIH) under the contract numbers K120660 and K123815 and THOR COST CA 15213.

Acknowledgments

Computational resources were provided by the Wigner GPU Laboratory and the Wigner Datacenter.

Conflicts of Interest

The authors declare no conflict of interest. The funders had no role in the design of the study; in the collection, analyses, or interpretation of data; in the writing of the manuscript, or in the decision to publish the results.

Abbreviations

The following abbreviations are used in this manuscript:
p T transverse momentum
BGBoltzmann–Gibbs
m T transverse mass

References

  1. ALICE Collaboration. Enhanced production of multi-strange hadrons in high-multiplicity proton-proton collisions. Nat. Phys. 2017, 13, 535–539. [Google Scholar]
  2. ALICE Collaboration. ALICE measures pA collisions: Collectivity in small systems? J. Phys. Conf. Ser. 2017, 798, 012068. [Google Scholar]
  3. Pareto, V. Cours d’Economie Politique; Droz: Geneva, Switzerland, 1896. [Google Scholar]
  4. Hagedorn, R.; Multiplicities, T. pT distributions and the expected hadron → quark-gluon phase transition. Riv. Nuovo Cimento 1983, 6, 1–50. [Google Scholar] [CrossRef]
  5. Tsallis, C. Possible generalization of Boltzmann-Gibbs statistics. J. Stat. Phys. 1988, 52, 479–487. [Google Scholar] [CrossRef]
  6. Tsallis, C. Generalizing What We Learnt: Nonextensive Statistical Mechanics. In Introduction to Nonextensive Statistical Mechanics; Springer: New York, NY, USA, 2009; p. 382. [Google Scholar]
  7. Osada, T.; Wilk, G. Nonextensive hydrodynamics for relativistic heavy-ion collisions. Phys. Rev. C 2008, 77, 044903. [Google Scholar] [CrossRef]
  8. STAR Collaboration. Identified Baryon and Meson Distributions at Large Transverse Momenta from Au + Au Collisions at s NN = 200 GeV. Phys. Rev. Lett. 2006, 97, 152301. [Google Scholar]
  9. BRAHMS Collaboration. Charged Meson Rapidity Distributions in Central Au + Au Collisions at s NN = 200 GeV. Phys. Rev. Lett. 2005, 94, 162301. [Google Scholar]
  10. CMS Collaboration. Transverse momentum and pseudorapidity distributions of charged hadrons in pp collisions at sqrt(s) = 0.9 and 2.36 TeV. J. High Energy Phys. 2010, 2010, 41. [Google Scholar]
  11. CMS Collaboration. Transverse-Momentum and Pseudorapidity Distributions of Charged Hadrons in pp Collisions at s = 7 TeV. Phys. Rev. Lett. 2010, 105, 022002. [Google Scholar]
  12. PHENIX Collaboration. Identified charged particle spectra and yields in Au + Au collisions at s NN = 200 GeV. Phys. Rev. C 2004, 69, 034909. [Google Scholar]
  13. STAR Collaboration. Identified hadron spectra at large transverse momentum in p + p and d + Au collisions at s NN = 200 GeV. Phys. Lett. B 2006, 637, 161–169. [Google Scholar]
  14. STAR Collaboration. K(892)* Resonance Production in Au + Au and p + p Collisions at s NN = 200 GeV at RHIC. Phys. Rev. C 2005, 71, 064902. [Google Scholar]
  15. Wilk, G.; Wlodarczyk, Z. Interpretation of the Nonextensivity Parameter q in Some Applications of Tsallis Statistics and Lévy Distributions. Phys. Rev. Lett. 2000, 84, 2770–2773. [Google Scholar] [CrossRef] [PubMed]
  16. ALICE Collaboration. Production of pions, kaons and protons in pp collisions at s = 900 GeV with ALICE at the LHC. Eur. Phys. J. C 2011, 71, 1655. [Google Scholar]
  17. ALICE Collaboration. Multiplicity Dependence of Pion, Kaon, Proton and Lambda Production in p + Pb Collisions at s NN = 5.02 TeV. Phys. Lett. B 2014, 728, 25–38. [Google Scholar]
  18. PHENIX Collaboration. Identified charged hadron production in p + p collisions at s = 200 and 62.4 GeV. Phys. Rev. C 2011, 83, 064903. [Google Scholar]
  19. ALICE Collaboration. Production of charged pions, kaons and protons at large transverse momentum in pp and PbPb collisions at s NN = 2.76 TeV. Phys. Lett. B 2014, 736, 196–207. [Google Scholar]
  20. Tang, Z.; Xu, Y.; Ruan, L.; van Buren, G.; Wang, F.; Xu, Z. Spectra and radial flow in relativistic heavy ion collisions with Tsallis statistics in a blast-wave description. Phys. Rev. C 2009, 79, 051901. [Google Scholar] [CrossRef] [Green Version]
  21. Shen, K.; Barnaföldi, G.G.; Biró, T.S. Hadronization within Non-Extensive Approach and the Evolution of the Parameters. arXiv 2019, arXiv:1905.05736. [Google Scholar]
  22. Shen, K.M.; Biro, T.S.; Wang, E.K. Different non-extensive models for heavy-ion collisions. Phys. A 2018, 492, 2353–2360. [Google Scholar] [CrossRef] [Green Version]
  23. Hagedorn, R. Hot and Hadronic Matter: Theory and Experiment; Plenum Press, Publishing House: New York, NY, USA, 1995; p. 13. [Google Scholar]
  24. Cleymans, J.; Lykasov, G.I.; Parvan, A.S.; Sorin, A.S.; Teryaev, O.V.; Worku, D. Systematic properties of the Tsallis distribution: Energy dependence of parameters in high energy p-p collisions. Phys. Lett. B 2013, 723, 351–354. [Google Scholar] [CrossRef]
  25. Barnaföldi, G.G.; Ürmössy, K.; Biró, T.S. Tsallis–Pareto–like Distributions in Hadron-Hadron Collisions. J. Phys. Conf. Ser. 2011, 270, 357–363. [Google Scholar] [CrossRef]
  26. Takacs, A.; Barnaföldi, G.G. Non-Extensive Motivated Parton Fragmentation Functions. Multidiscipl. Digit. Publ. Inst. Proc. 2019, 10, 12. [Google Scholar] [CrossRef]
  27. ALICE Collaboration. Centrality dependence of the nuclear modification factor of charged pions, kaons, and protons in PbPb collisions at s NN = 2.76 TeV. Phys. Rev. C 2016, 93, 034913. [Google Scholar]
  28. ALICE Collaboration. K s 0 and Λ Production in PbPb Collisions at s NN = 2.76 TeV. Phys. Rev. Lett. 2013, 111, 222301. [Google Scholar]
  29. ALICE Collaboration. Multi-strange baryon production at mid-rapidity in PbPb collisions at s NN = 2.76 TeV. Phys. Lett. B 2014, 728, 216. [Google Scholar]
  30. ALICE Collaboration. K*(892)0 and ϕ(1020) production in PbPb collisions at s NN = 2.76 TeV. Phys. Rev. C 2015, 91, 024609. [Google Scholar]
  31. Wilk, G.; Włodarczyk, Z. On possible origins of power-law distributions. AIP Conf. Proc. 2015, 1558, 893–896, and its corresponding references. [Google Scholar]
Figure 1. The p T spectra for pions (upper) and kaons (lower) in p p collisions at s = 900 GeV and 7 TeV at midrapidity as examples. Data are taken from [16,17]. All are fitted with all of the functions of Equation (3) in the ranges of 0 . 1 < p T < 2 . 6 GeV at s = 900 GeV and 0 . 1 < p T < 20 GeV at 7 TeV, respectively. Ratios of the net fits to data are also shown in the lower panel. The relevant values of χ 2 / d . o . f . are shown in Table 1.
Universe 05 00122 g001
Figure 2. Both the center-of-mass energy s and hadron mass m distributions of the fitting temperature T and the non-extensive parameter q. In this work, we analyze the results at all given energies with the relationship cf. Equation (10). Here we list the results for s = 62.4 GeV, 200 GeV, 900 GeV, 2.76 TeV, 5.02 TeV, and 7 TeV. and hadron species of pions, kaons, and protons. We have extracted a factor of 10 4 from the values of s / m for convenience.
Universe 05 00122 g002
Figure 3. Correlations between T and q 1 = 1 / n for spectra of π (left) and K (right) in p p , p P b , and P b P b collisions. The corresponding p T range is listed in Table 4, and the values of fitting parameters in Equation (11) are listed in Table 5.
Universe 05 00122 g003
Table 1. The values of χ 2 / d . o . f . of spectral fits for pions, kaons, and protons in p p collisions at 900 GeV and 7 TeV as examples.
Collision Energy ( s )Produced Hadrons f BG f 1 f 2 f 3 f 4 f 5
900 GeV π 110.80.28140.28140.46970.28141.456
K8.0470.17480.17490.16980.17490.6669
p3.4910.37240.37240.37350.37240.4145
7 TeV π 1316.00.96810.96813.4170.96810.3049
K520.20.42020.42020.43130.42023.100
p254.30.44810.44810.43560.44814.357
Table 2. Fitting p T ranges of spectra for different charged particles in p p collisions [16,17,18,19].
s π [GeV]K [GeV]p [GeV]
62.4 GeV0.3–2.90.4–20.6–3.6
200 GeV0.3–30.4–20.5–4.6
900 GeV0.1–2.60.2–2.40.35–2.4
2.76 TeV0.1–200.2–200.3–20
5.02 TeV0.1–200.2–200.3–20
7 TeV0.1–200.2–200.3–20
Table 3. Fitting parameters of Equation (10) in use within Figure 2.
Fitting Functions T 0 T 1 q 0 q 1
f B G 0.2515 ± 0.00050.1335 ± 0.0002--
f 1 0.1343 ± 0.0003−0.0041 ± 0.00011.135 ± 0.0020.009 ± 0.001
f 2 0.1343 ± 0.0003−0.0041 ± 0.00011.135 ± 0.0020.009 ± 0.001
f 3 0.1190 ± 0.0002−0.0412 ± 0.00021.129 ± 0.0010.004 ± 0.001
f 4 0.1083 ± 0.00030.0011 ± 0.00041.135 ± 0.0020.009 ± 0.001
f 5 0.1222 ± 0.00050.0007 ± 0.00011.127 ± 0.0020.013 ± 0.002
Table 4. Fitting p T range of different hadron spectra in heavy-ion collisions in this work [17,27,28,29,30].
ParticlesMass [GeV] pPb [GeV] PbPb [GeV]
π 0.1400.11–2.850.11–19
K0.4940.225–2.450.225–19
K S 0 0.4980.05–70.45–11
K * 0.896 0.55–4.5
p0.9380.325–3.90.325–17.5
ϕ 1.019 0.65–4.5
Λ 1.1160.65–70.65–11
Ξ 1.321 0.7–7.5
Ω 1.672 1.3–7.5
Table 5. Fitting parameters of Equation (11) between T and q 1 = 1 / n for spectra of π (upper) and K (lower) in p p , p P b , and  P b P b collisions (note that f B G is not included because q = 1 is a constant).
ParticlesFittings T 1 in pp T 0 in pp T 1 in pPb T 0 in pPb T 1 in PbPb T 0 in PbPb
  f 1 −0.36 ± 0.020.08 ± 0.01--1.40 ± 0.020.335 ± 0.004
  f 2 −0.36 ± 0.020.08 ± 0.01--1.40 ± 0.020.335 ± 0.004
π f 3 −0.14 ± 0.040.07 ± 0.02--1.22 ± 0.020.249 ± 0.005
  f 4 −0.22 ± 0.010.08 ± 0.01--1.52 ± 0.020.333 ± 0.005
  f 5 −0.31 ± 0.030.08 ± 0.01--1.31 ± 0.010.311 ± 0.007
  f 1 −1.30 ± 0.020.011 ± 0.0011.55 ± 0.020.470 ± 0.0011.67 ± 0.060.434 ± 0.003
  f 2 −1.30 ± 0.020.011 ± 0.0011.55 ± 0.020.470 ± 0.0011.67 ± 0.060.434 ± 0.003
K f 3 −0.90 ± 0.040.032 ± 0.0051.94 ± 0.030.436 ± 0.0041.96 ± 0.030.394 ± 0.007
  f 4 −0.81 ± 0.010.010 ± 0.0042.03 ± 0.030.470 ± 0.0032.11 ± 0.050.427 ± 0.006
  f 5 −1.59 ± 0.02−0.001 ± 0.00052.43 ± 0.010.453 ± 0.0020.73 ± 0.020.309 ± 0.007

