Abstract
Short-range correlations of identified charged hadrons in pp ( 0.9, 2.76, and 7 TeV), pPb ( 5.02 TeV), and peripheral PbPb collisions ( 2.76 TeV) are studied with the CMS detector at the LHC. Charged pions, kaons, and protons at low momentum and in laboratory pseudorapidity are identified via their energy loss in the silicon tracker. The two-particle correlation functions show effects of quantum statistics, Coulomb interaction, and also indicate the role of multi-body resonance decays and mini-jets. The characteristics of the one-, two-, and three-dimensional correlation functions are studied as a function of transverse pair momentum, , and the charged-particle multiplicity of the event. The extracted radii are in the range 1–5 fm, reaching highest values for very high multiplicity pPb, also for similar multiplicity PbPb collisions, and decrease with increasing . The dependence of radii on multiplicity and largely factorizes and appears to be insensitive to the type of the colliding system and center-of-mass energy.
1. Introduction
Measurements of the correlation between hadrons emitted in high-energy collisions of nucleons and nuclei can be used to study the spatial extent and shape of the created system. The characteristic radii and the homogeneity lengths of the particle-emitting source can be extracted with reasonable precision [1]. The topic of quantum correlations was well researched in the past by the CMS Collaboration [2,3] using unidentified charged hadrons produced in 0.9, 2.36, and 7 TeV pp collisions. Those studies only included one-dimensional fits () of the correlation function. In the meantime, the ALICE, PHENIX, and STAR collaborations have published numerous interesting results on the Bose–Einstein and other femtoscopic (multidimensional) correlations of identified charged hadrons: charged pions [4,5] and kaons [6,7] in diverse energy pp, AuAu, and PbPb collisions.
Our aim was to look for effects present in pp, pPb, and PbPb interactions using the same analysis methods, producing results as a function of the transverse pair momentum and of the fully corrected charged-particle multiplicity (in 2.4) of the event. In addition, not only charged pions, but also charged kaons are studied. All details of the analysis are given in Ref. [8].
2. Data Analysis
The analysis methods (event selection, reconstruction of charged particles in the silicon tracker, finding interaction vertices, treatment of pile-up) are identical to the ones used in the previous CMS papers on the spectra of identified charged hadrons produced in 0.9, 2.76, and 7 TeV pp [9] and 5.02 TeV pPb collisions [10]. A detailed description of the CMS detector can be found in Ref. [11].
For the present study, 8.97, 9.62, and 6.20 M minimum bias events are used from pp collisions at 0.9 TeV, 2.76 TeV, and 7 TeV, respectively, while 8.95 M minimum bias events are available from pPb collisions at 5.02 TeV. The data samples are completed by 3.07 M peripheral (60–100%) PbPb events, where 100% corresponds to fully peripheral, and 0% means fully central (head-on) collision. The centrality percentages for PbPb are determined by measuring the sum of the energies in the forward calorimeters.
The multiplicity of reconstructed tracks, , is obtained in the region 2.4. Over the range 0 240, the events were divided into 24 classes—a region that is well covered by the 60–100% centrality PbPb collisions. To facilitate comparisons with models, the corresponding corrected charged particle multiplicity in the same acceptance of 2.4 is also determined.
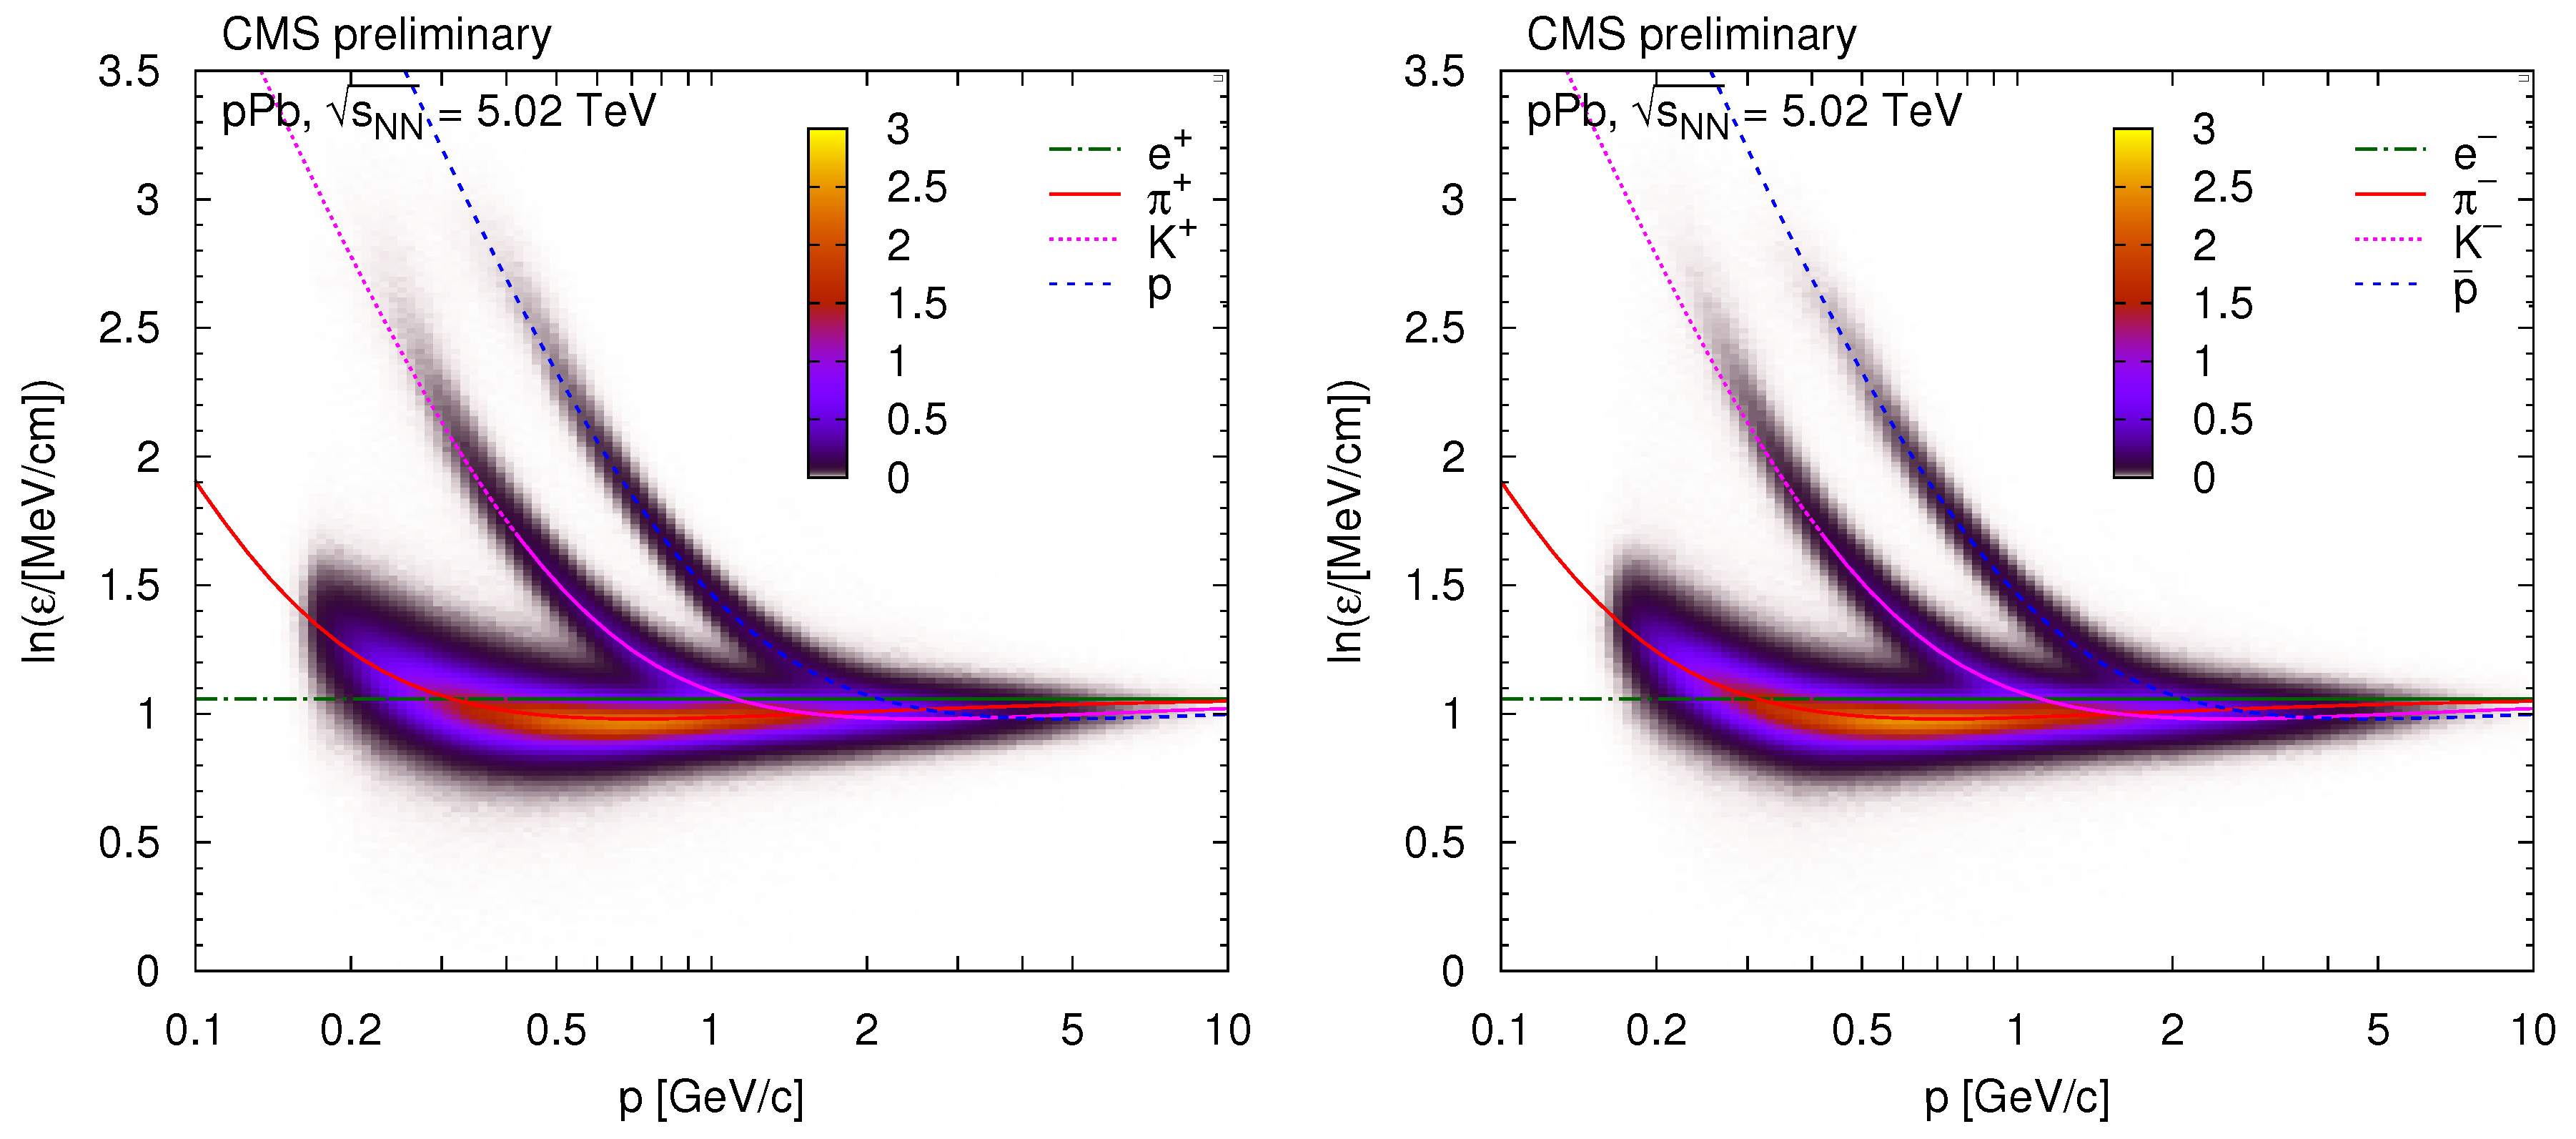
The reconstruction of charged particles in CMS is bounded by the acceptance of the tracker and by the decreasing tracking efficiency at low momentum. Particle-by-particle identification using specific ionization is possible in the momentum range 0.15 GeV/c for electrons, 1.15 GeV/c for pions and kaons, and 2.00 GeV/c for protons (Figure 1). In view of the regions where pions, kaons, and protons can all be identified, only particles in the band −1 1 (in the laboratory frame) were used for this measurement. In this analysis, a very high purity (>99.5%) particle identification is required, ensuring that less than 1% of the examined particle pairs would be fake.
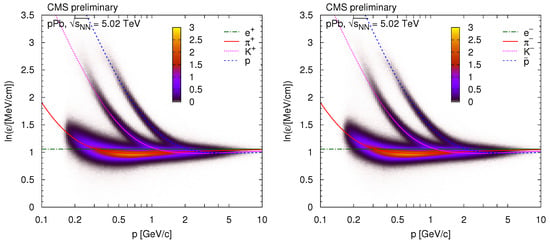
Figure 1.
The distribution of as a function of total momentum p, for positively (Left) and negatively (Right) charged particles, in case of pPb collisions at 5.02 TeV [8]. Here is the most probable energy loss rate at a reference path length 450 . The z scale is shown in arbitrary units and is linear. The curves show the expected for electrons, pions, kaons, and protons (full theoretical calculation, Equation (30.11) in Ref. [12]).
2.1. Correlations
The pair distributions are binned in the number of reconstructed charged particles of the event, in the transverse pair momentum , and also in the relative momentum () variables in the longitudinally co-moving system of the pair. One-dimensional (), two-dimensional , and three-dimensional analyses are performed. Here is the component of parallel to , is the component of perpendicular to .
The construction of the distribution for the “signal” pairs is straightforward: all valid particle pairs from the same event are taken and the corresponding histograms are filled. There are several choices for the construction of the background. We considered the following three prescriptions:
- particles from the actual event are paired with particles from some given number (in our case 25) of preceding events (“event mixing”); only events belonging to the same multiplicity () class are mixed;
- particles from the actual event are paired, the laboratory momentum vector of the second particle is rotated around the beam axis by 90 degrees (“rotated”);
- particles from the actual event are paired, but the laboratory momentum vector of the second particle is negated (“mirrored”).
Based on the goodness-of-fit distributions, the event mixing prescription was used while the rotated and mirrored versions—which give worse or much worse /ndf values—were employed in the estimation of the systematic uncertainty.
The measured two-particle correlation function is the ratio of signal and background distributions
where the background is normalized such that it has the same integral as the signal distribution. The quantum correlation function —part of —is the Fourier transform of the source density distribution . There are several possible functional forms that are commonly used to fit present in the data: Gaussian () and exponential parametrizations (), and a mixture of those in higher dimensions. (The denominator 0.197 GeV fm is usually omitted from the formulas; we will also do that in the following.) Factorized forms are particularly popular, such as or with some theoretical motivation. The fit parameters are usually interpreted as chaoticity , and characteristic radii R, the homogeneity lengths of the particle-emitting source.
As will be shown in Section 3, the exponential parametrization does a very good job of describing all our data. It corresponds to the Cauchy (Lorentz) type source distribution . Theoretical studies show that for the class of stable distributions with index of stability , the Bose–Einstein correlation function has a stretched exponential shape [13,14]. The exponential correlation function implies (the Gaussian would correspond to the special case of ). The forms used for the fits are
meaning that the system in multi-dimensions is an ellipsoid with differing radii , , or , , and .
2.2. Coulomb Interaction
After the removal of the trivial phase space effects (ratio of signal and background distributions), one of the most important sources of correlations is the mutual Coulomb interaction of the emitted charged particles. The effect of the Coulomb interaction is taken into account by the factor K, the squared average of the relative wave function , as , where is the source intensity discussed above. For pointlike source, , and we get the Gamow factor , where is the Landau parameter, is the fine-structure constant, and m is the mass of the particle. The positive sign should be used for repulsion, and the negative for attraction.
For an extended source, a more elaborate treatment is needed [15]. The use of the Bowler-Sinyukov formula [16,17] is popular. Our data on unlike-sign correlation functions show that while the Gamow factor might give a reasonable description of the Coulomb interaction for pions, it is clearly not enough for kaons. In the q range studied in this analysis, applies. The absolute square of confluent hypergeometric function of the first kind F, present in , can be well approximated as , where Si is the sine integral function. Furthermore, for Cauchy-type source functions the factor K is nicely described by the formula . In the last step we substituted . The factor in the approximation comes from the fact that for large arguments . Otherwise it is a simple but faithful approximation of the result of a numerical calculation, with deviations less than 0.5%.
2.3. Clusters: Mini-Jets, Multi-Body Decays of Resonances
The measured unlike-sign correlation functions show contributions from various resonances. The seen resonances include the , the , the , the decaying to , and the decaying to . Additionally, when misidentified as pion pairs, pairs from conversions can appear as a very low peak in the spectrum. With increasing values, the effect of resonances diminishes, since their contribution is quickly exceeded by the combinatorics of unrelated particles.
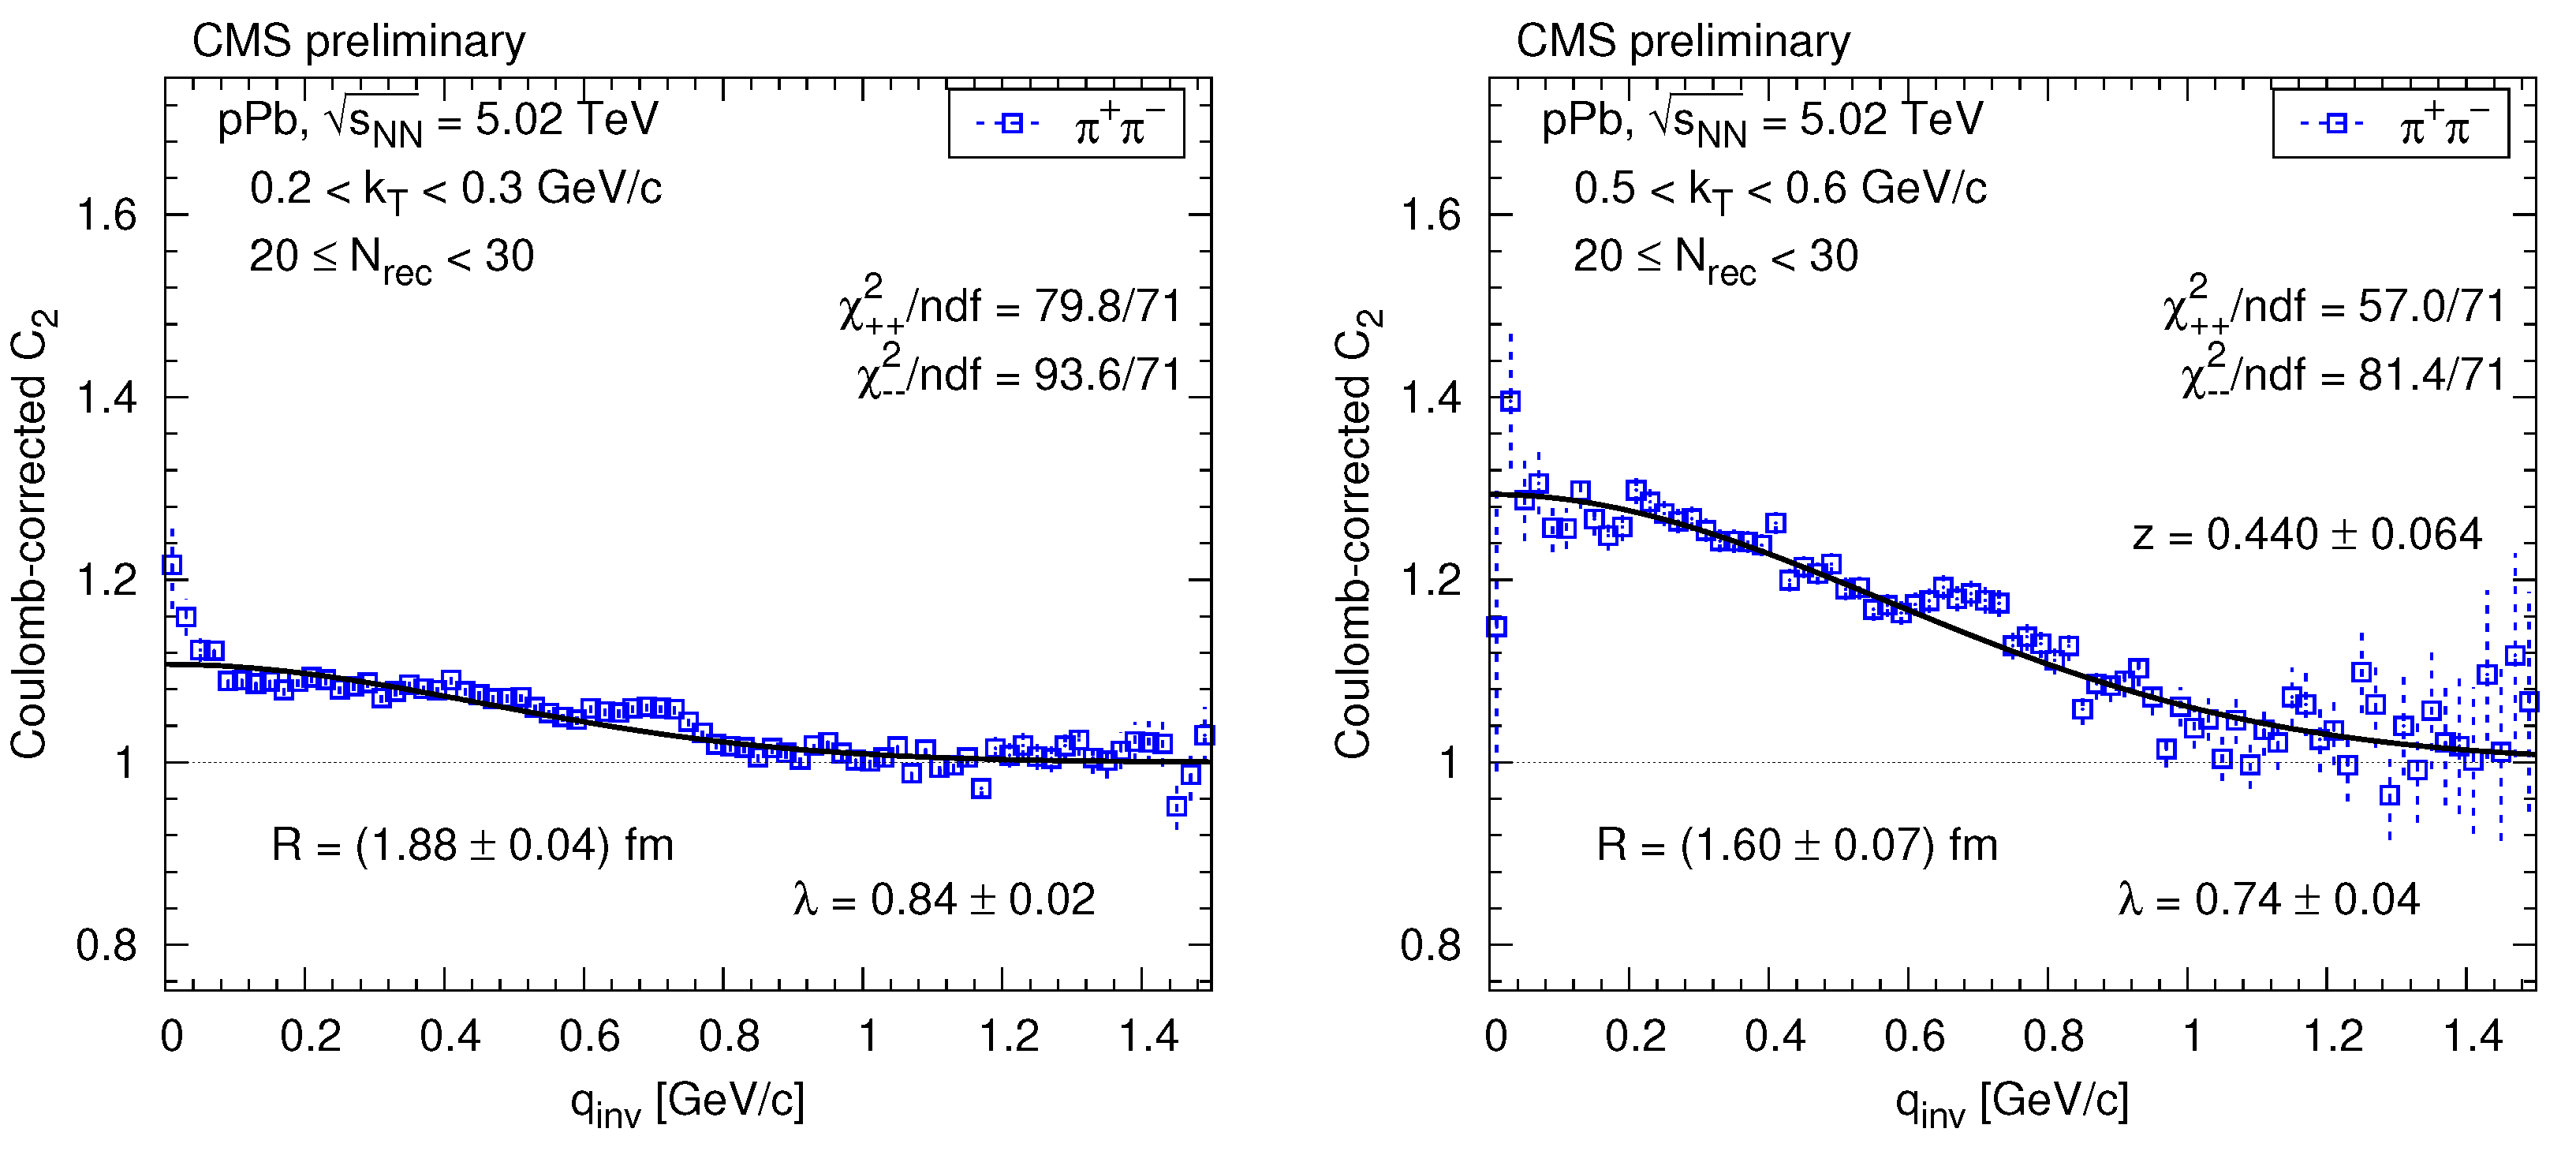
Nevertheless, the Coulomb-corrected unlike-sign correlation functions are not always close to unity at low , but show a Gaussian-like hump (Figure 2). That structure has a varying amplitude but a stable scale ( of the corresponding Gaussian) of about 0.4 GeV/c. This feature is often related to particles emitted inside low-momentum mini-jets, but can also be attributed to the effect of multi-body decays of resonances. In the following, we will refer to those possibilities as fragmentation of clusters, or cluster contribution. We have fitted the one-dimensional unlike-sign correlation functions with a -dependent Gaussian parametrization [8].
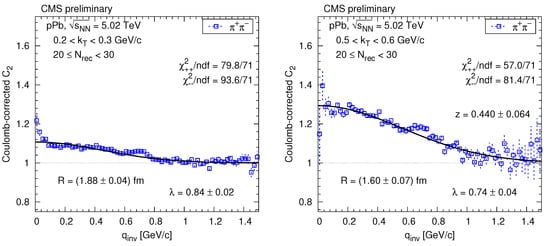
Figure 2.
Contribution of clusters (mini-jets and multi-body decays of resonances) to the measured Coulomb-corrected correlation function of (open squares) for some selected bins, 20 30, in case of pPb interactions at 5.02 TeV [8]. The solid curves show the result of the Gaussian fit.
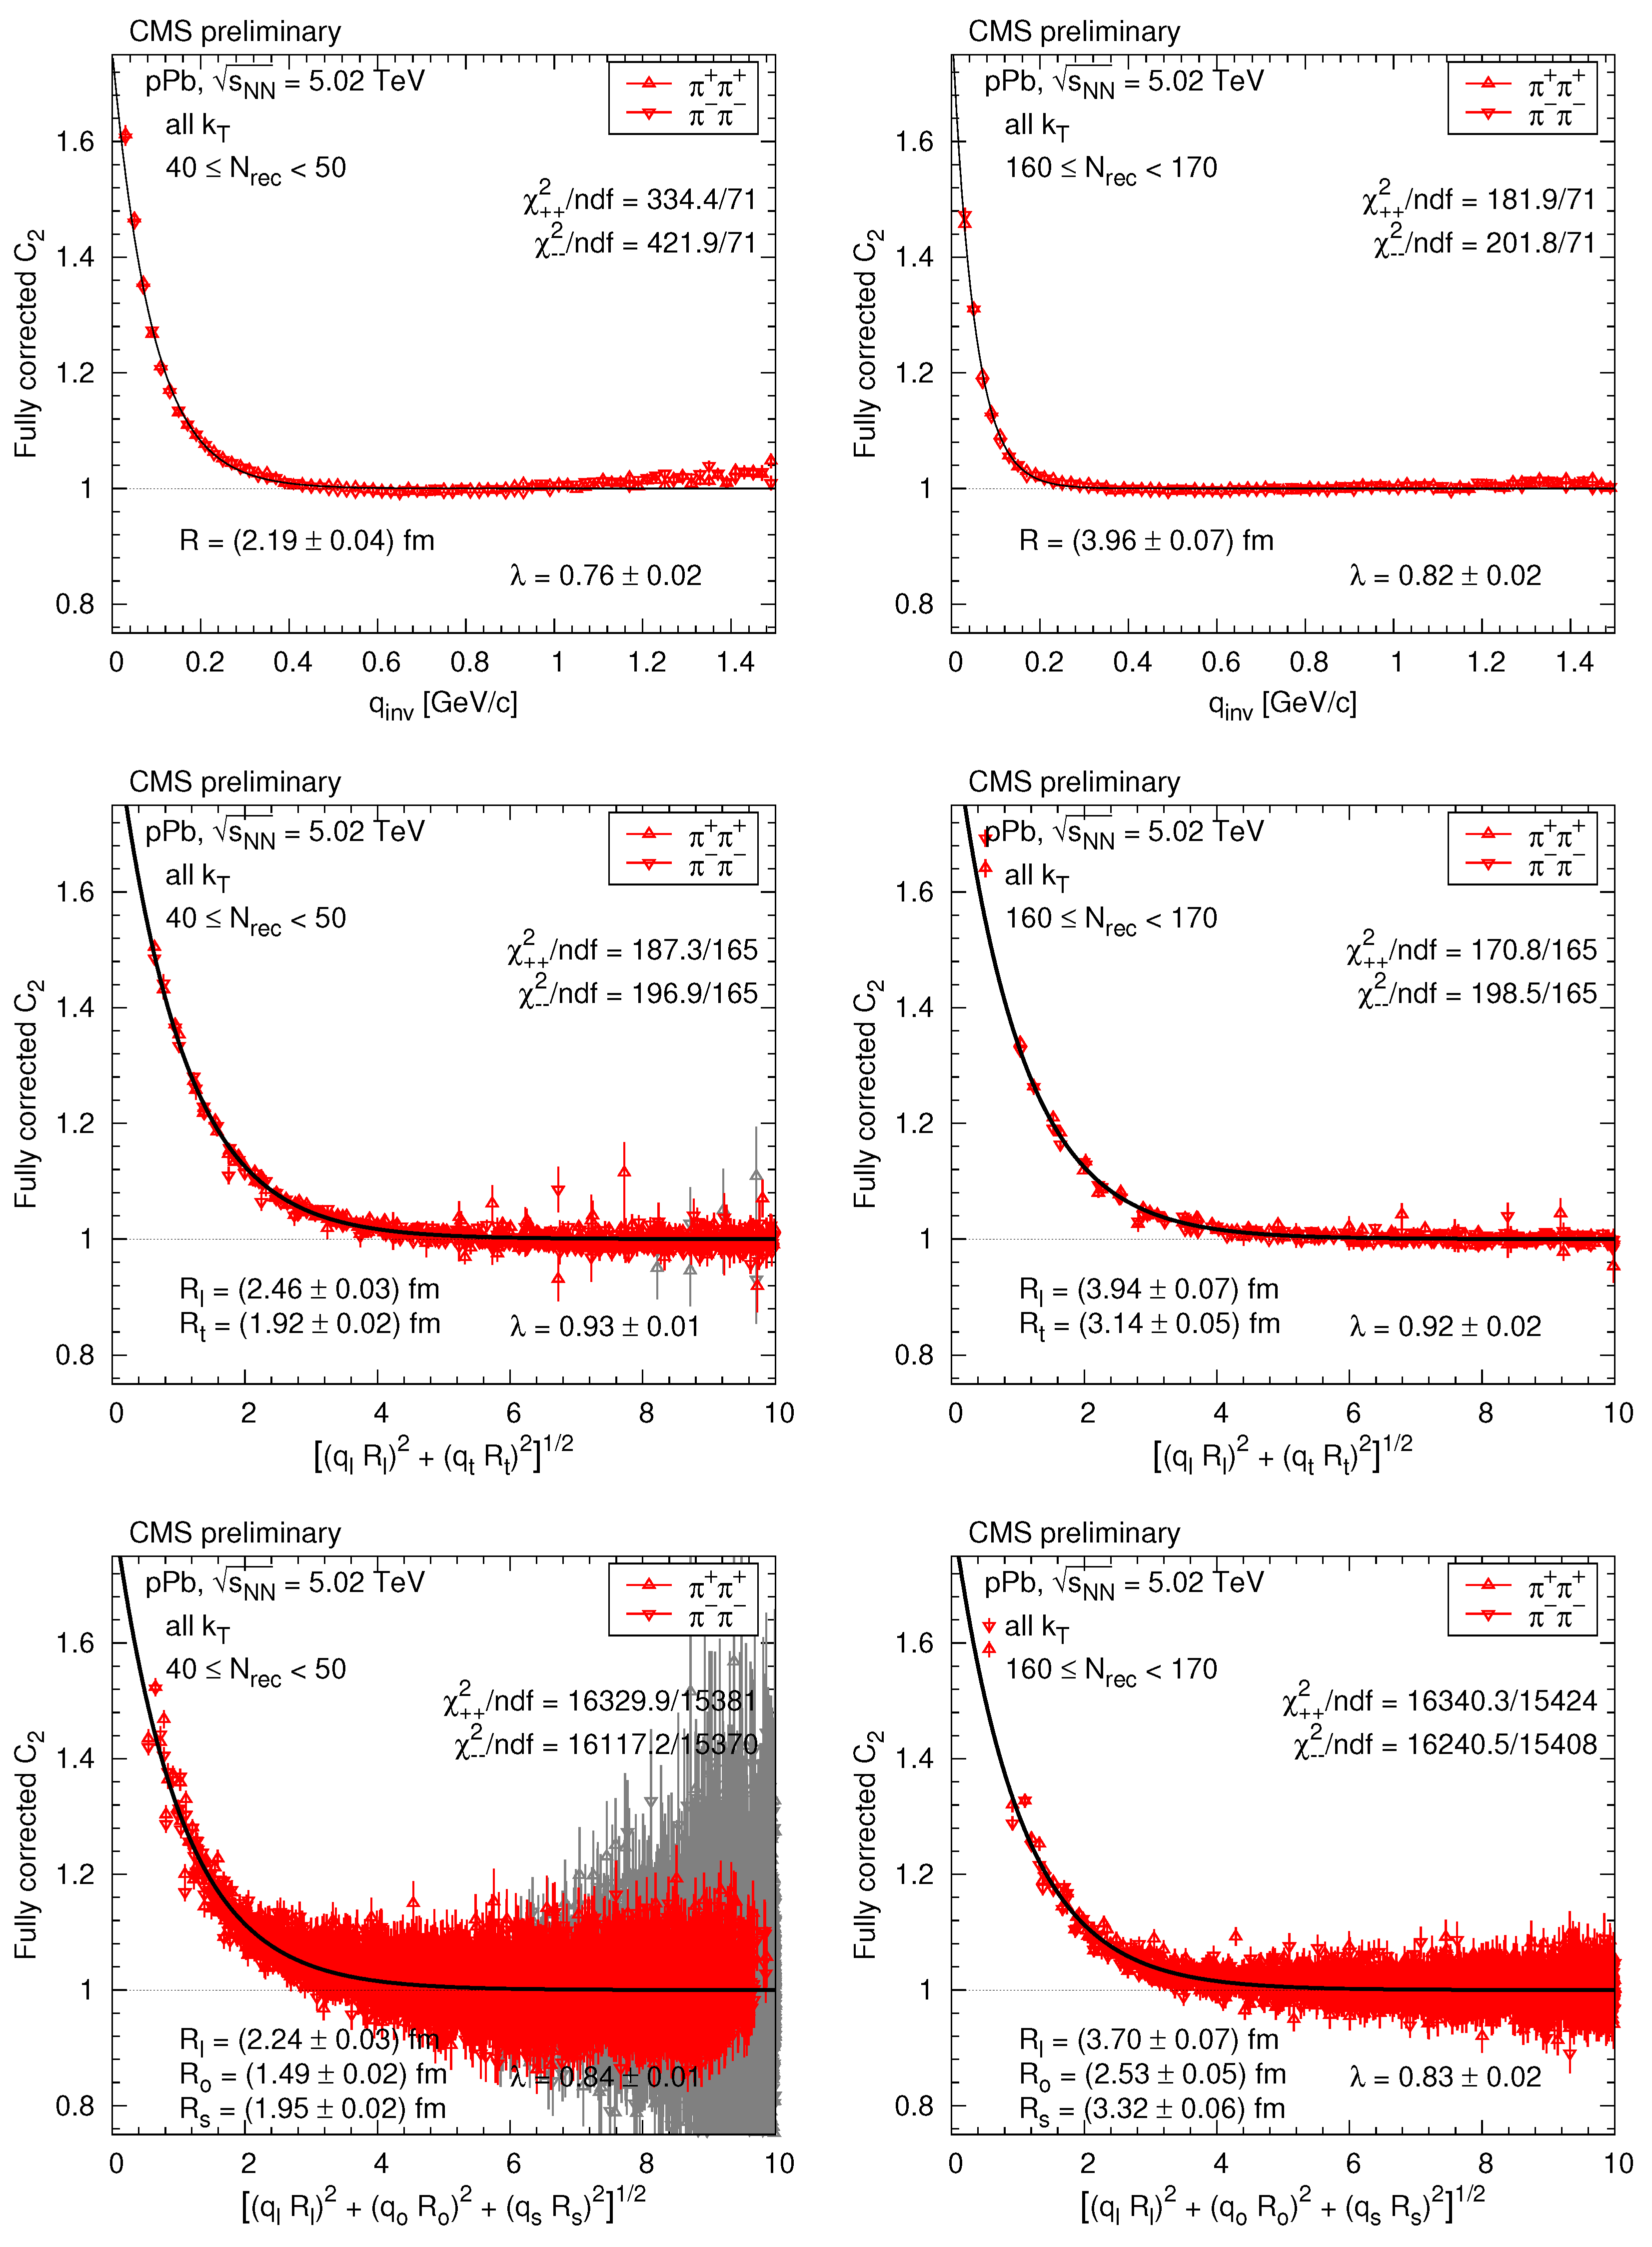
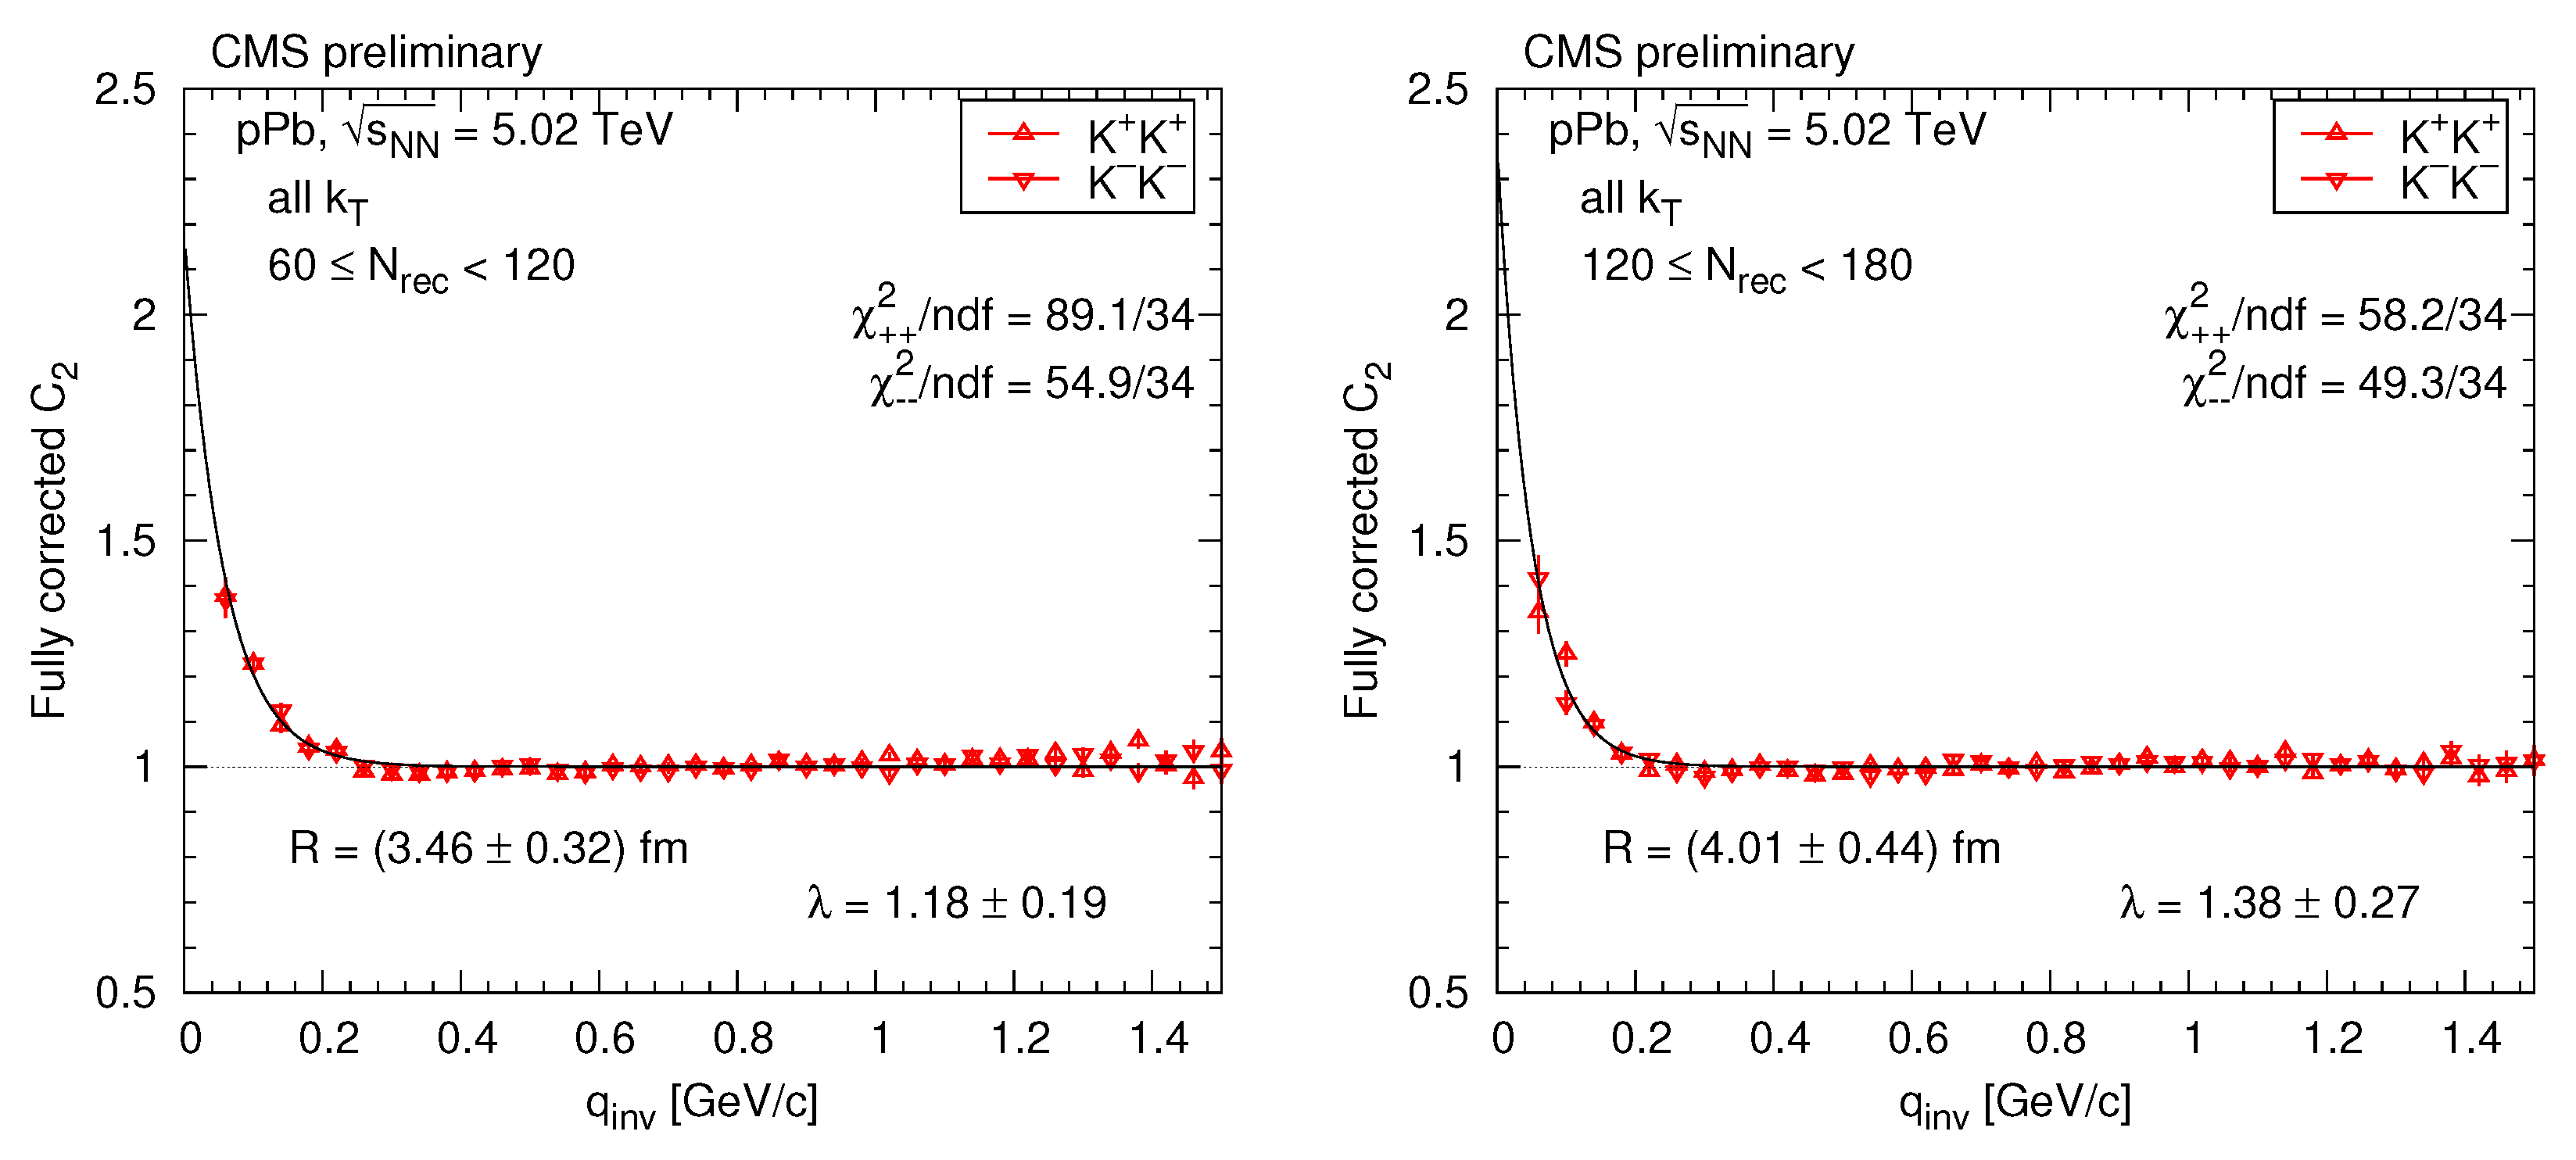
The cluster contribution can also be extracted in the case of a like-sign correlation function if the momentum scale of the Bose–Einstein correlation and that of the cluster contribution (≈ 0.4 GeV/c) are different enough. An important element in both mini-jet and multi-body resonance decays is the conservation of electric charge that results in a stronger correlation for unlike-sign pairs than for like-sign pairs. Hence the cluster contribution is expected to be also present for like-sign pairs, with similar shape but a somewhat smaller amplitude. The form of the cluster-related contribution obtained from unlike-sign pairs, but now multiplied by the extracted relative amplitude z, is used to fit the like-sign correlations. A selection of correlation functions and fits are shown in Figure 3 and Figure 4.
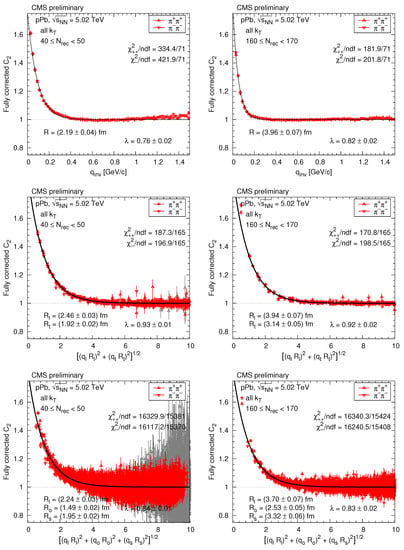
Figure 3.
The like-sign correlation function of pions (red triangles) corrected for Coulomb interaction and cluster contribution (mini-jets and multi-body resonance decays) as a function of or the combined momentum, in some selected bins for all [8]. Points with statistical uncertainty higher than 10% are plotted with light grey color. The solid curves indicate fits with the exponential Bose–Einstein parametrization.
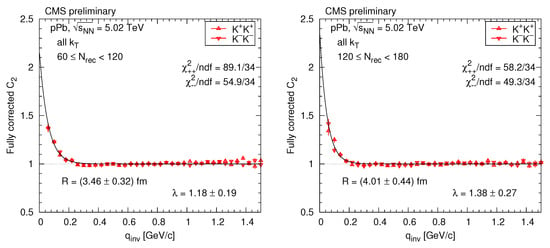
Figure 4.
The like-sign correlation function of kaons (red triangles) corrected for Coulomb interaction and cluster contribution (mini-jets and multi-body resonance decays) as a function of , in some selected bins for all [8]. Points with statistical uncertainty higher than 10% are plotted with light grey color. The solid curves indicate fits with the Bose–Einstein parametrization.
In the case of two and three dimensions, the measured unlike-sign correlation functions show that instead of , the length of the weighted sum of components is a better common variable.
3. Results
The systematic uncertainties are dominated by two sources: the dependence of the final results on the way the background distribution is constructed, and the uncertainties of the amplitude z of the cluster contribution for like-sign pairs with respect to those for unlike-sign ones.
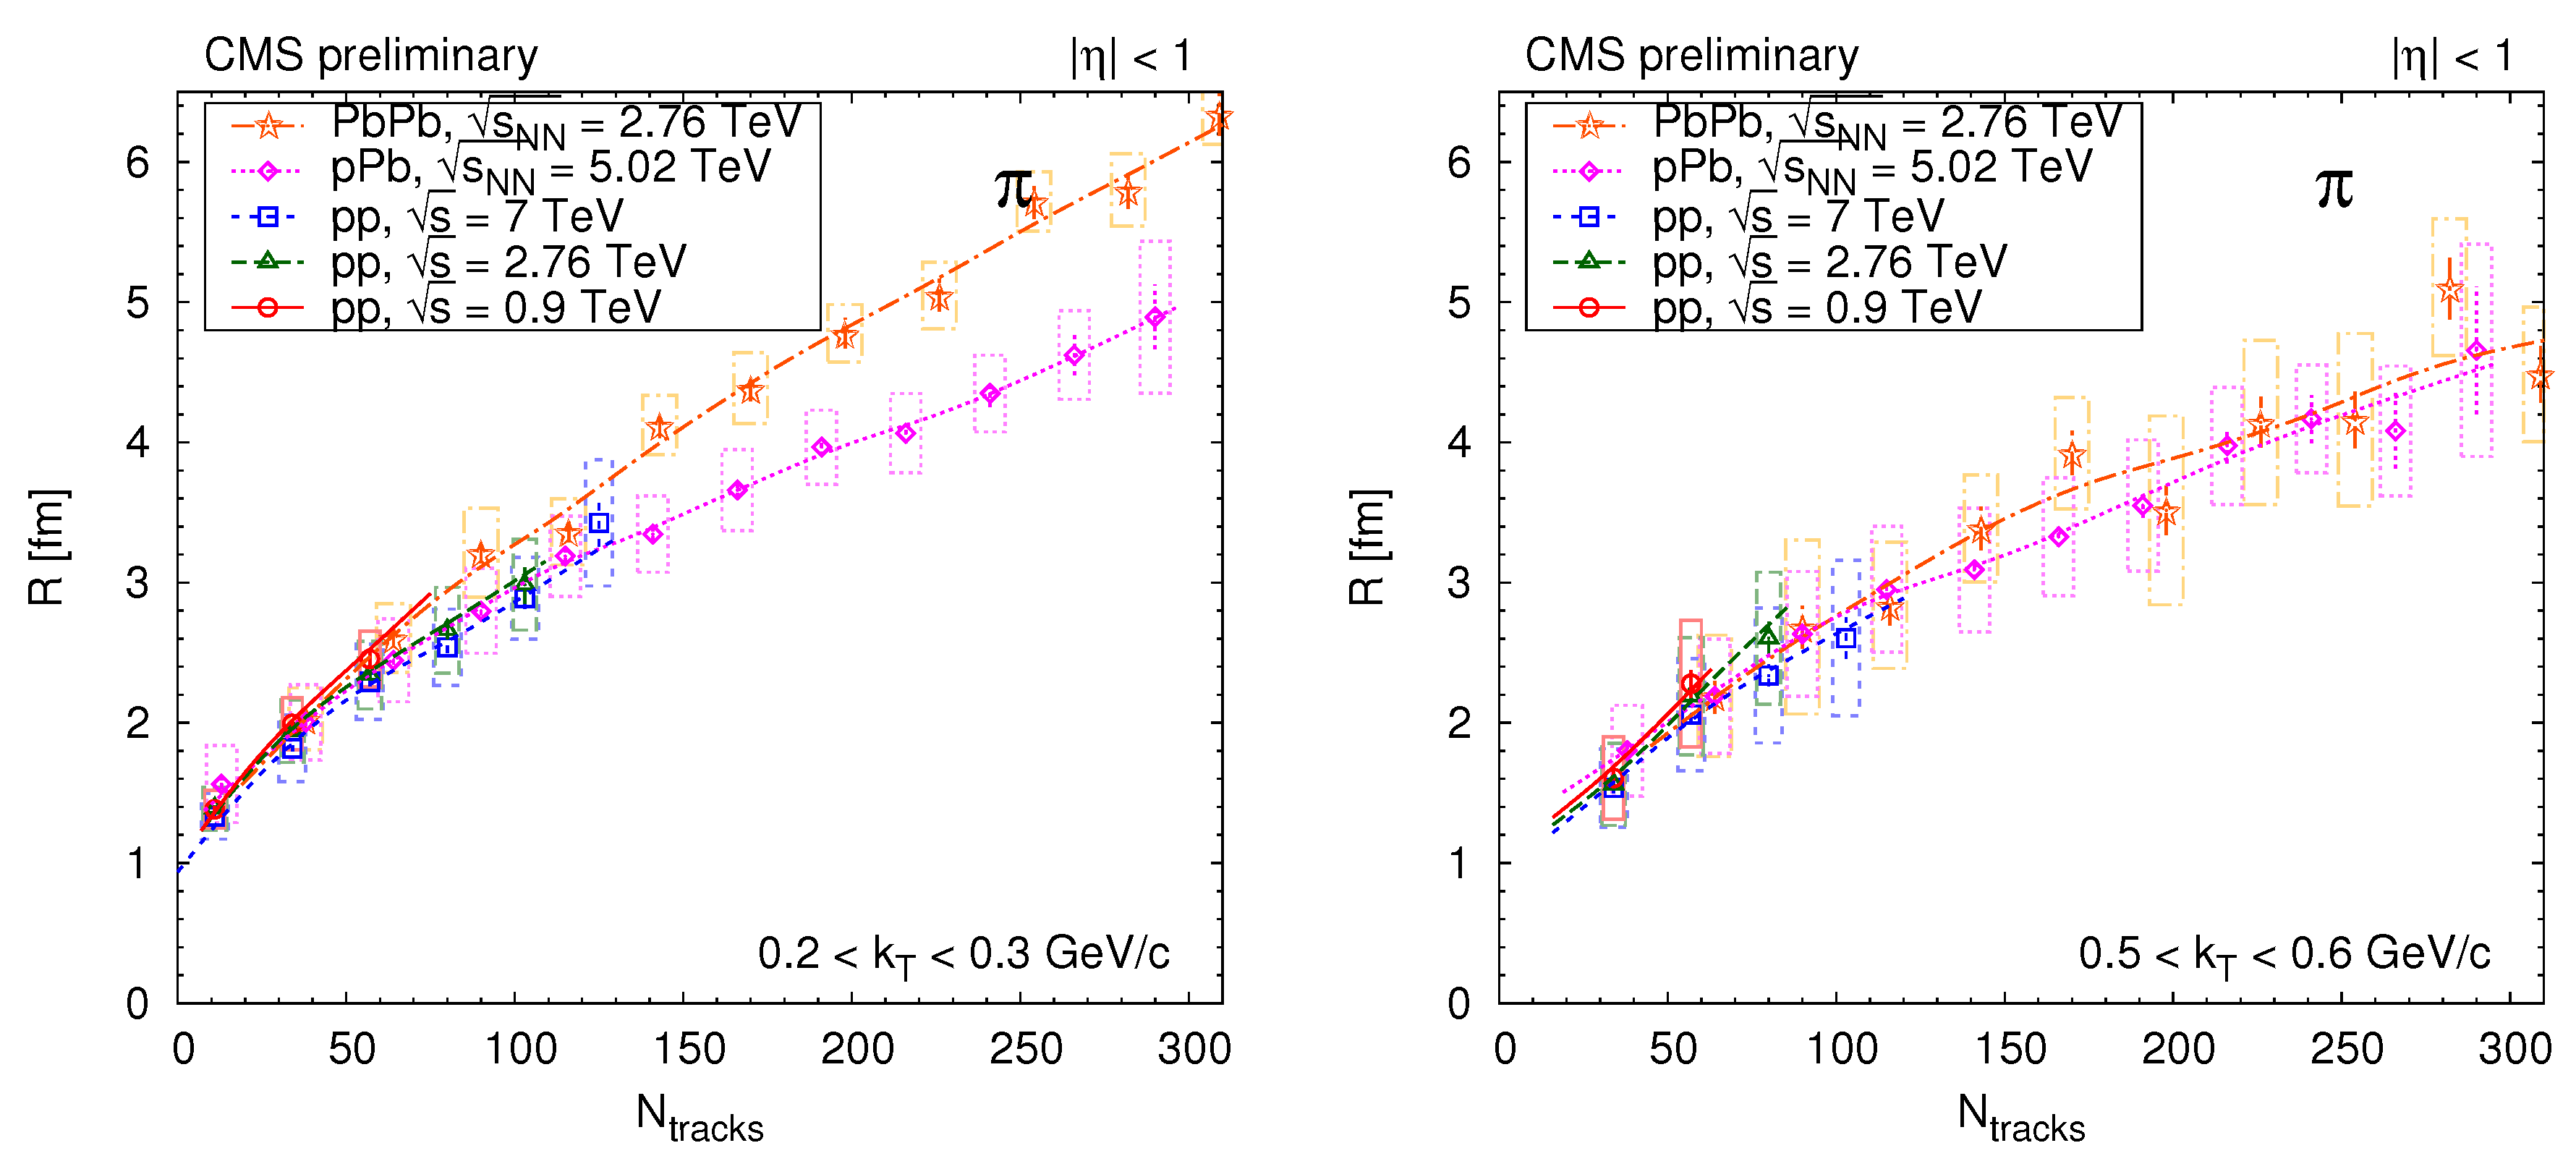
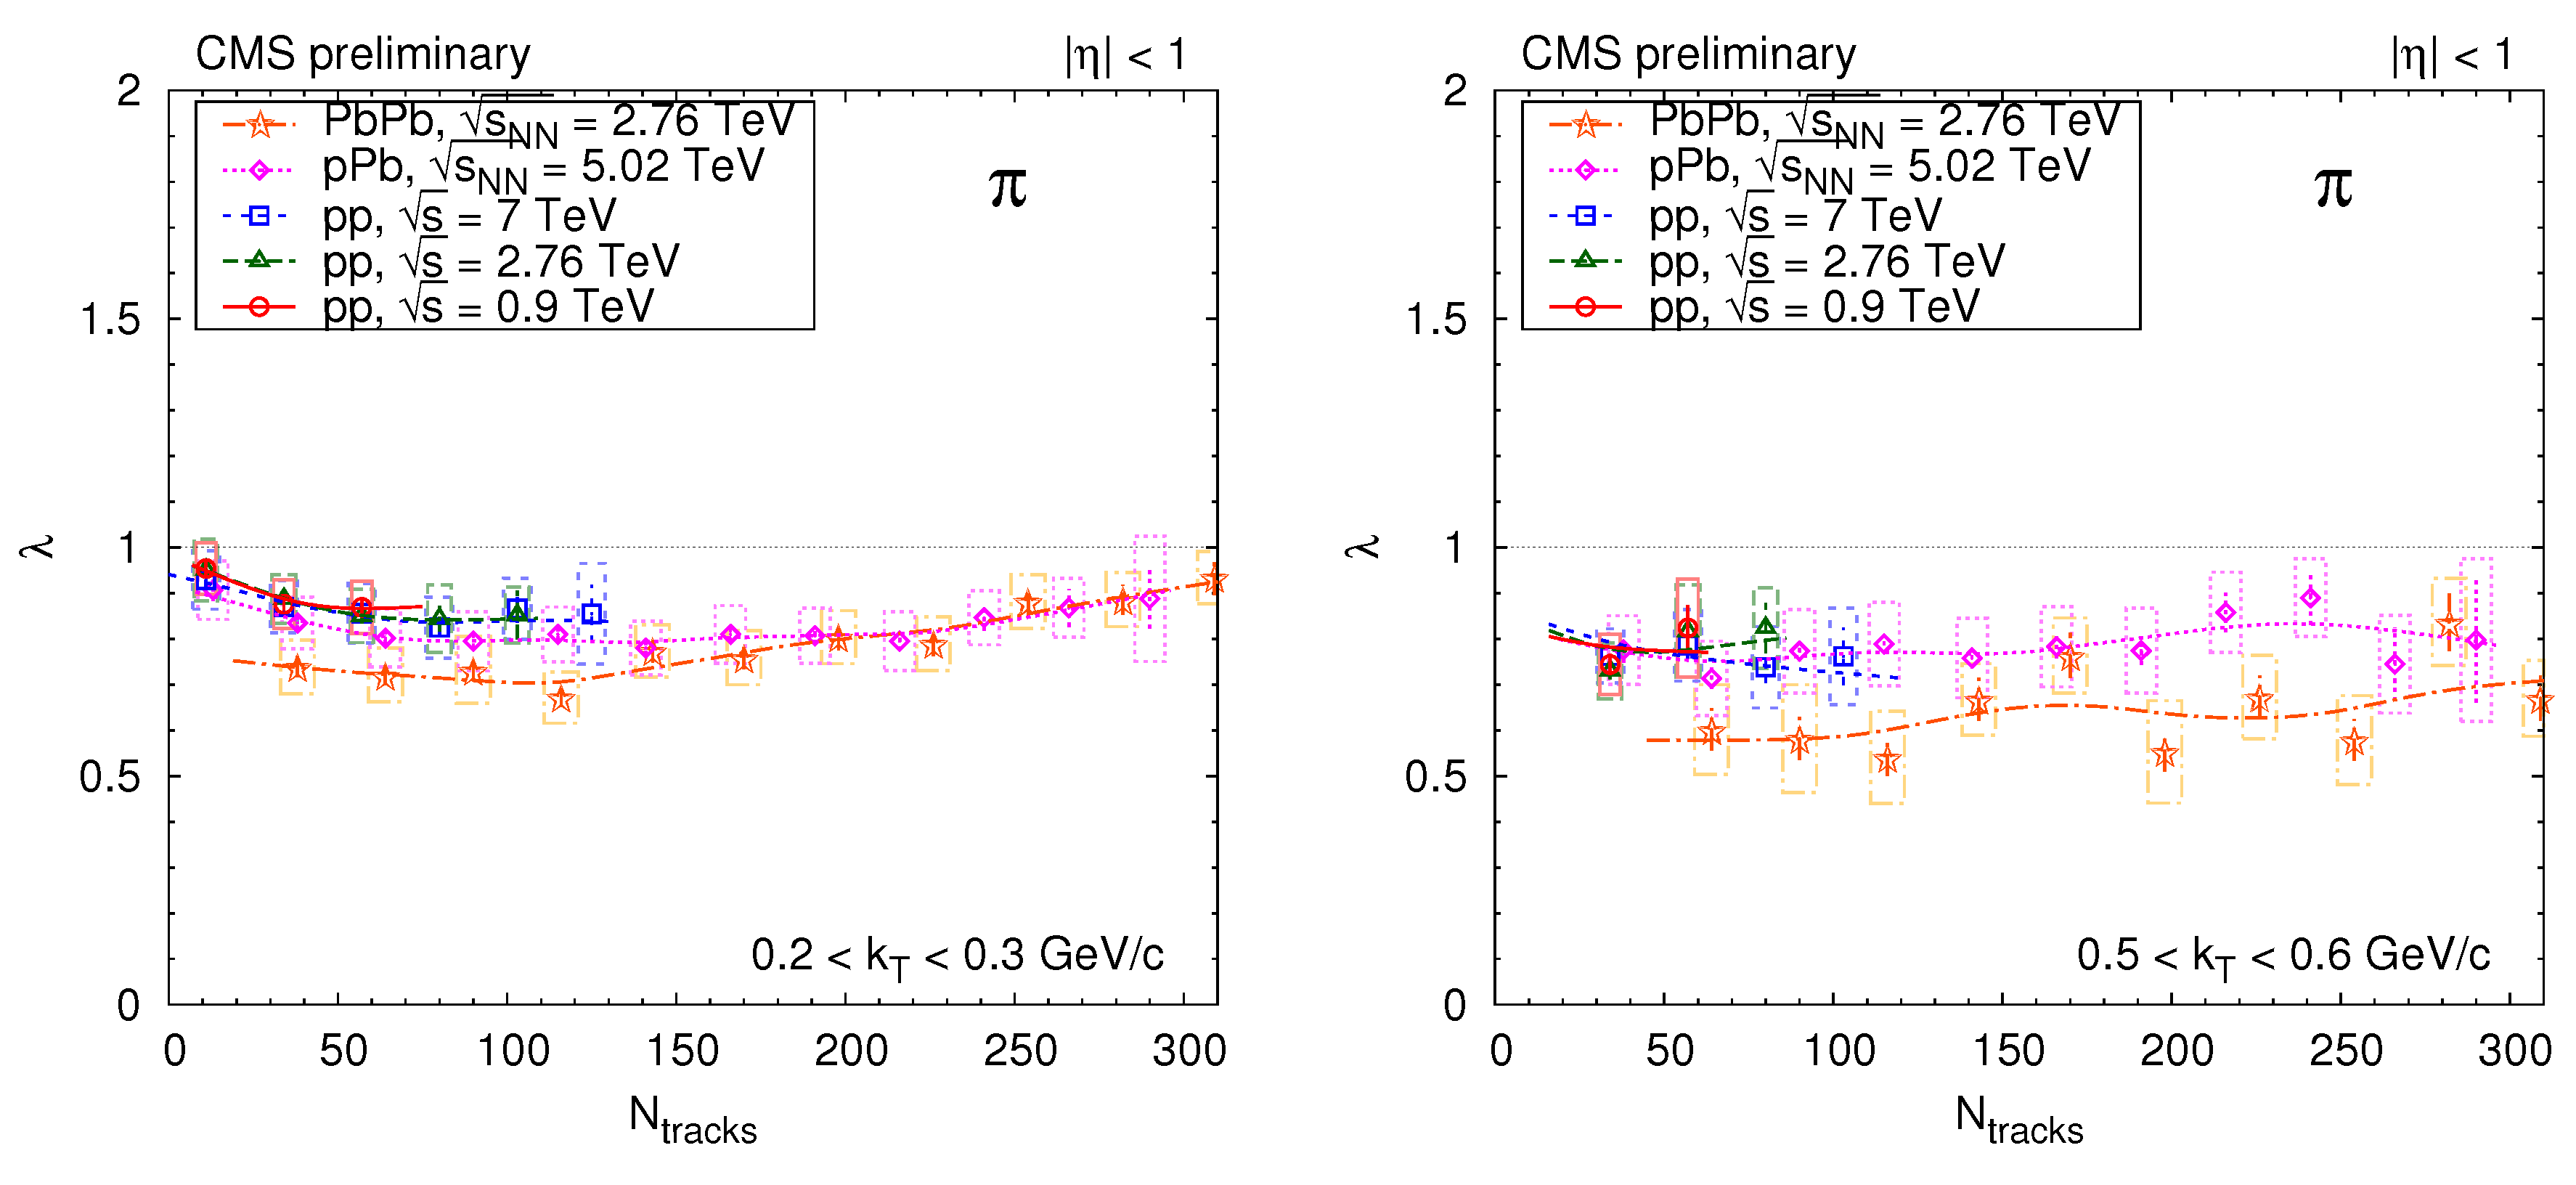
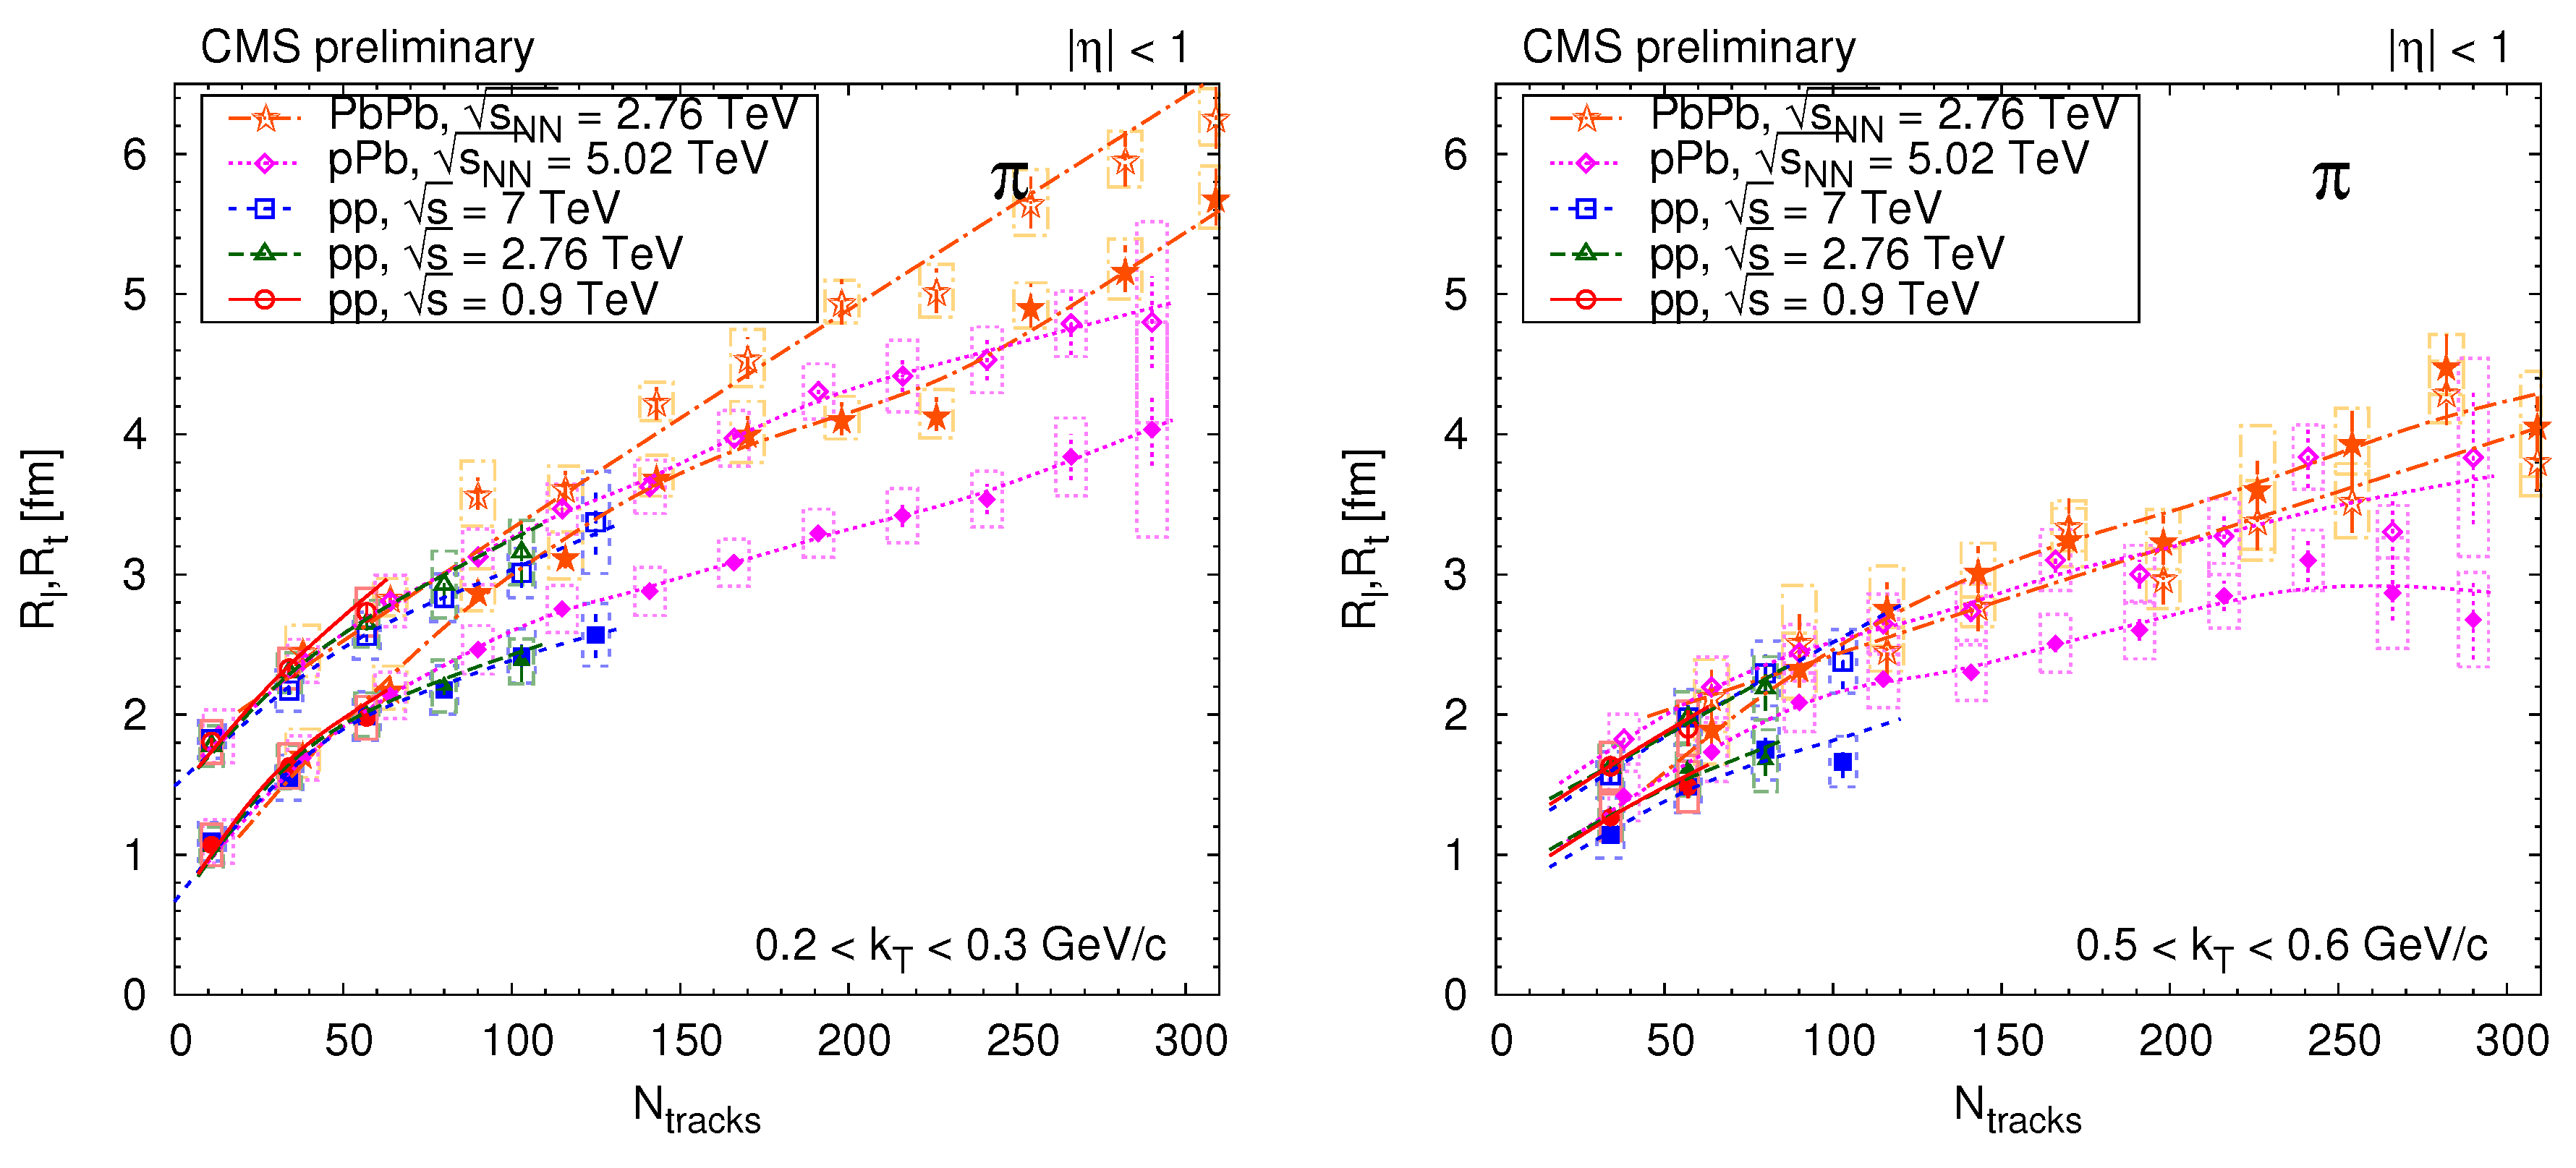
The characteristics of the extracted one- and two-dimensional correlation functions as a function of the transverse pair momentum and of the charged-particle multiplicity (in the range 2.4 in the laboratory frame) of the event are presented here. Three-dimensional results are detailed in Ref. [8]. In all the following plots (Figure 5, Figure 6 and Figure 7), the results of positively- and negatively-charged hadrons are averaged. For clarity, values and uncertainties of the neighboring bins were averaged two by two, and only the averages are plotted. The central values of radii and chaoticity parameter are given by markers. The statistical uncertainties are indicated by vertical error bars, the combined systematic uncertainties (choice of background method; uncertainty of the relative amplitude z of the cluster contribution; low q exclusion) are given by open boxes. Unless indicated, the lines are drawn to guide the eye (cubic splines whose coefficients are found by weighing the data points with the inverse of their squared statistical uncertainty).
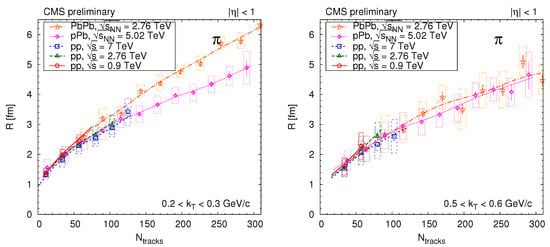
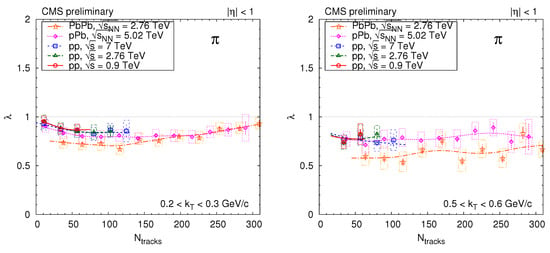
Figure 5.
The dependence of the one-dimensional pion radius (Top) and the one-dimensional pion chaoticity parameter (Bottom), shown here for several bins, for all studied reactions [8]. Lines are drawn to guide the eye.
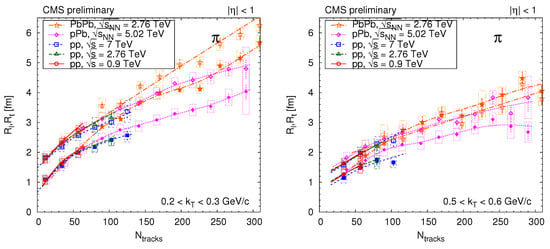
Figure 6.
The dependence of the two-dimensional pion radii (—open symbols, —closed symbols), shown here for several bins, for all studied reactions [8]. Lines are drawn to guide the eye.
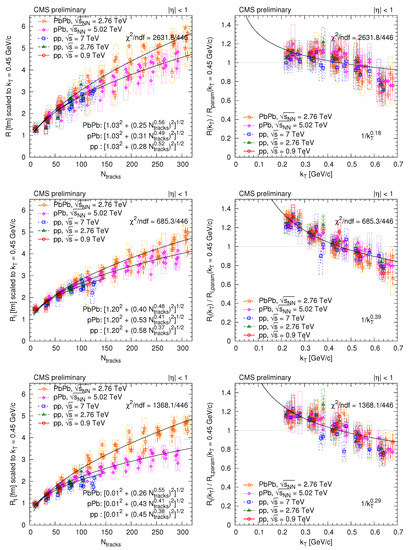
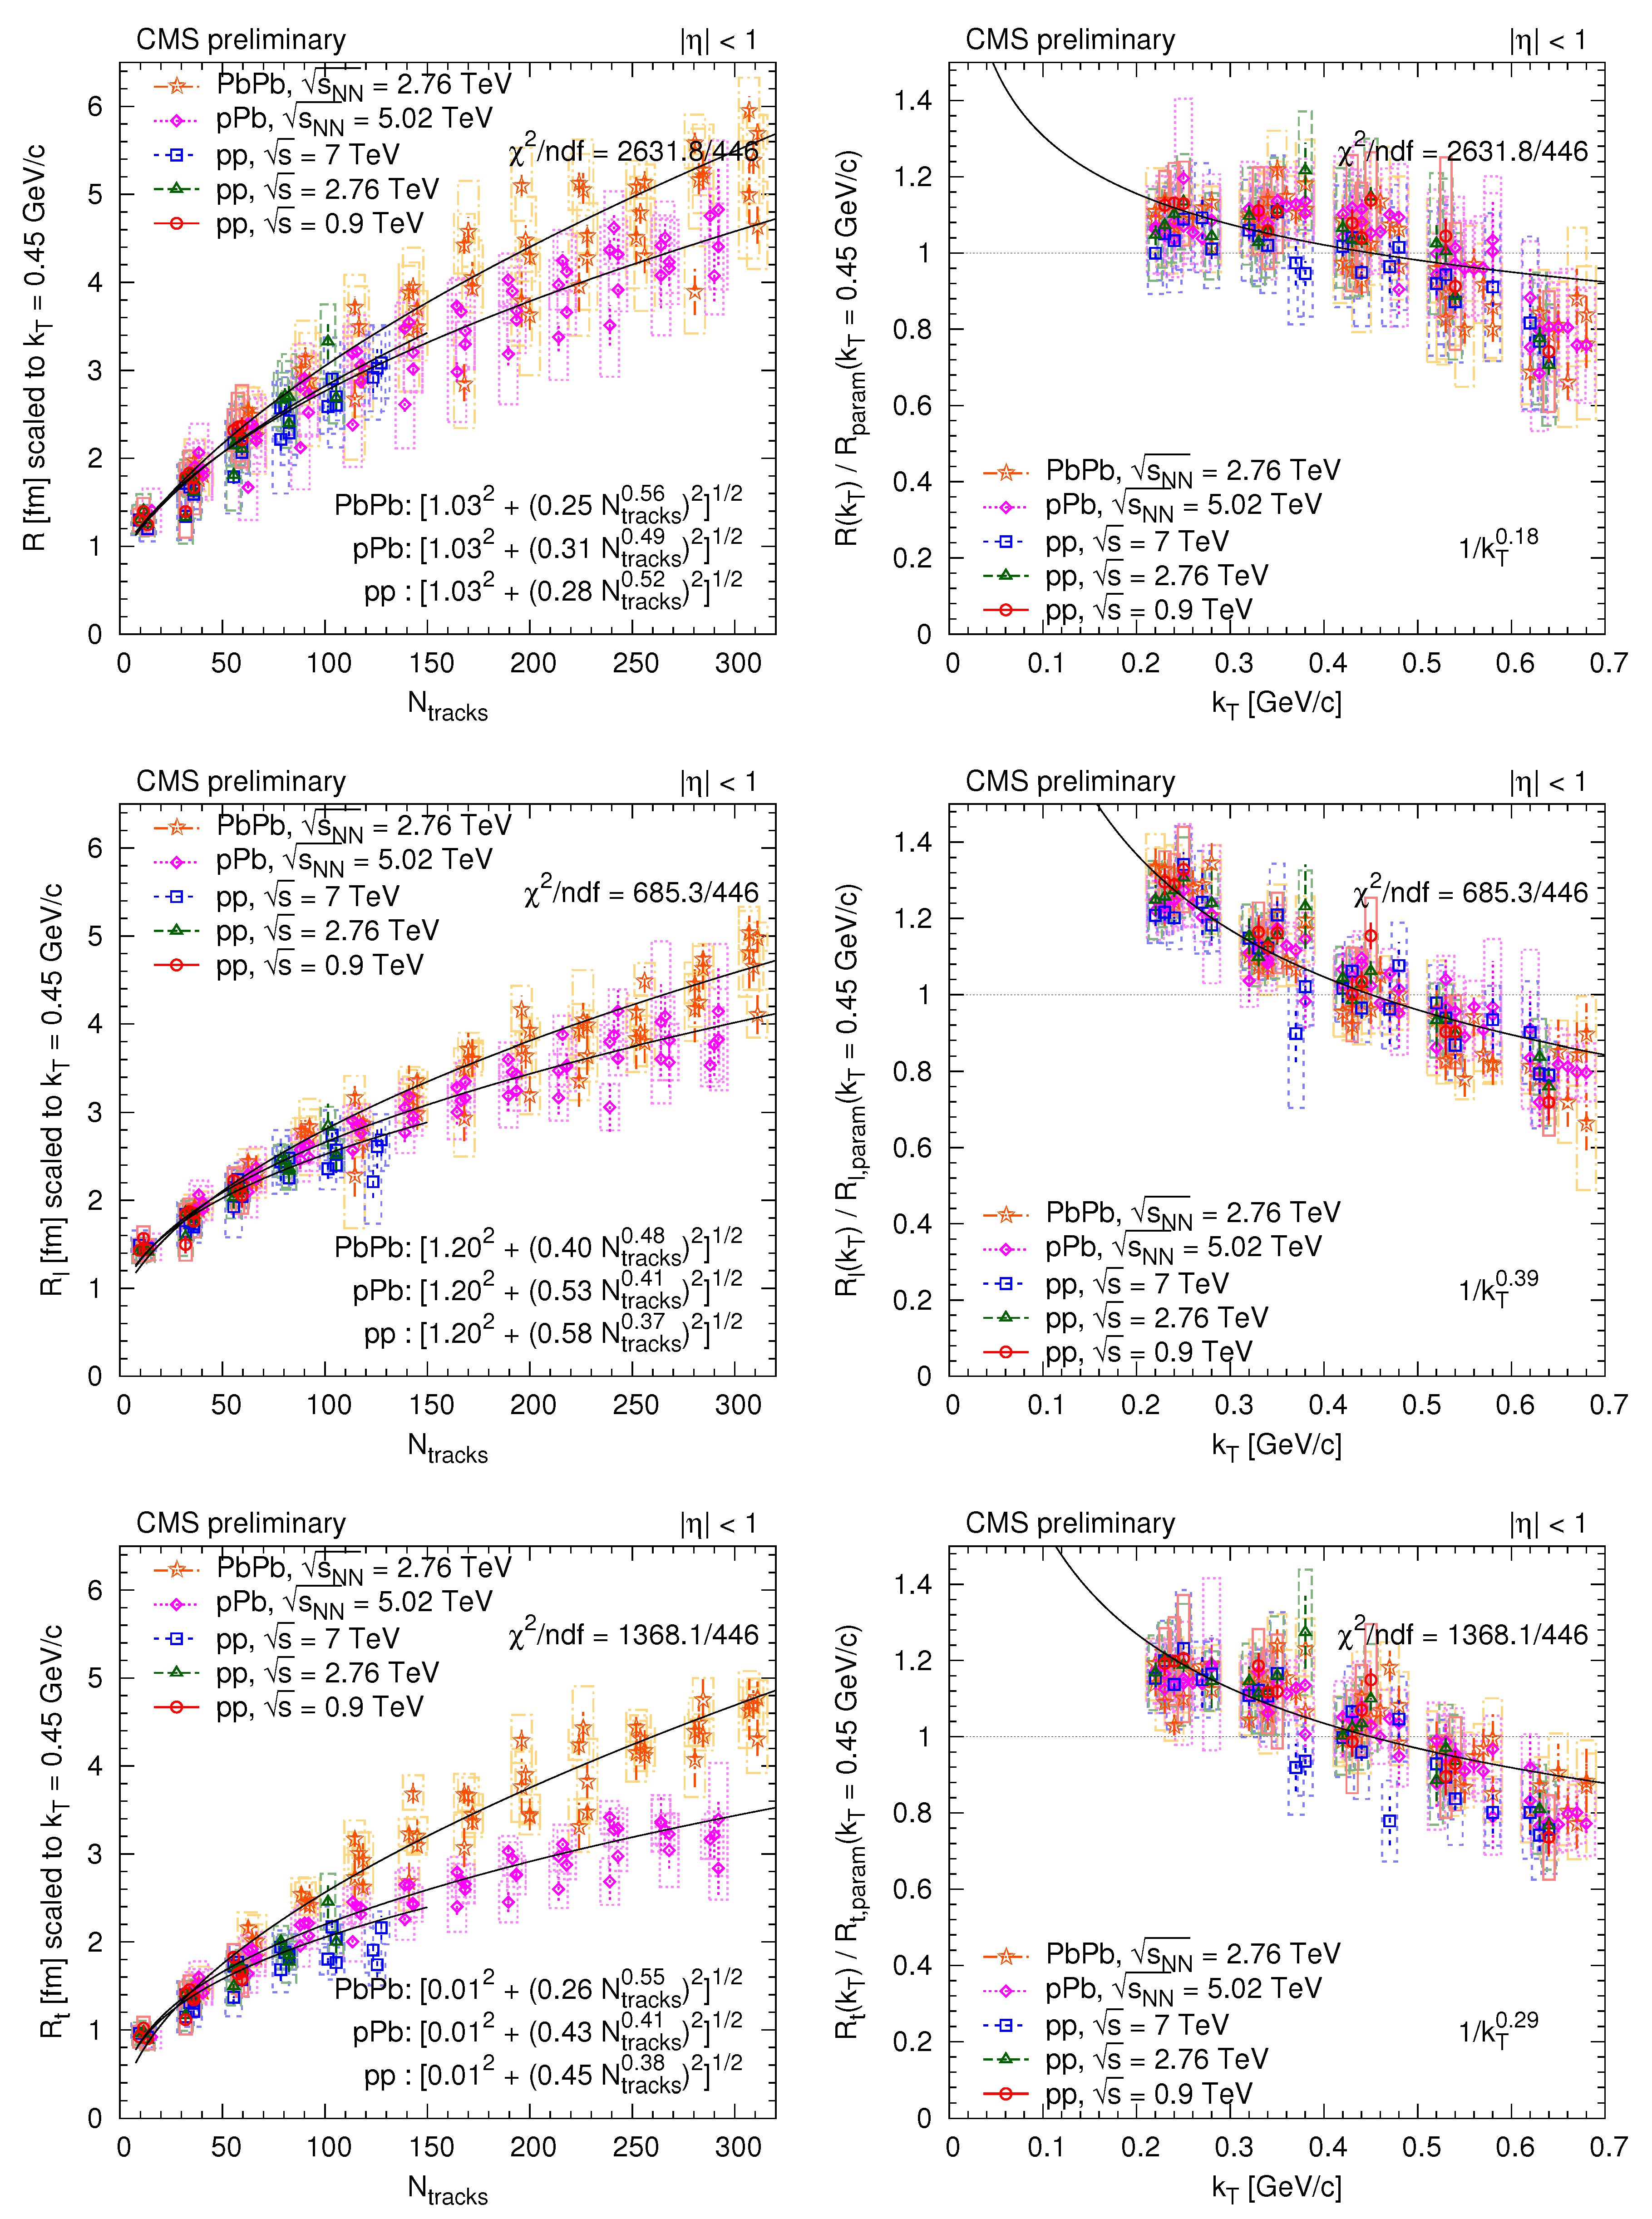
Figure 7.
(Left) Radius parameters as a function of scaled to 0.45 GeV/c with the help of the parametrization (Equation 5). (Right) ratio of the radius parameter and the value of the parametrization (Equation 5) at 0.45 GeV/c as a function of (points were shifted left and right with respect to the center of the bin for better visibility). Upper row: R from the one-dimensional () analysis. Middle row: from the two-dimensional analysis. Bottom row: from the two-dimensional analysis. Fit results are indicated in the figures [8]; for details, see text.
The extracted exponential radii for pions increase with increasing for all systems and center-of-mass energies studied, for one, two, and three dimensions alike. Their values are in the range 1–5 fm, reaching the highest values for very high multiplicity pPb, also for similar multiplicity PbPb collisions. The dependence of and is similar for pp and pPb in all bins, and that similarity also applies to peripheral PbPb if 0.4 GeV/c. Similar increase of source radii with increasing multiplicity density () in pp collisions was observed by the ALICE Collaboration [5]. In general there is an ordering, , and ; thus, the pp and pPb source is elongated in the beam direction. In the case of peripheral PbPb the source is quite symmetric, and shows a slightly different dependence, with largest differences for and , while there is a good agreement for and . The most visible divergence between pp, pPb, and PbPb is seen in , which could point to the differing lifetime of the created systems in those collisions.
The kaon radii also indicate some increase with (not shown), although its magnitude is smaller than that for pions. Longer-lived resonances and rescattering may play a role here.
Scaling
The extracted radii are in the range 1–5 fm, reaching highest values for very high multiplicity pPb, also for similar multiplicity PbPb collisions, and decrease with increasing . By fitting the radii with a product of two independent functions of and , the dependences on multiplicity and pair momentum appear to factorize. In some cases, the radii are less sensitive to the type of the colliding system and center-of-mass energy. Radius parameters as a function of at 0.45 GeV/c are shown in the left column of Figure 7. We have also fitted and plotted the following functions:
where the minimal radius a and the exponents of are kept the same for a given radius component, for all collision types. This choice of parametrization is based on previous results [18]. The minimal radius can be connected to the size of the proton, while the power-law dependence on is often attributed to the freeze-out density of hadrons. The ratio of radius parameter and the value of the above parametrization at 0.45 GeV/c as a function is shown in the right column of Figure 7.
4. Conclusions
The similarities observed in the dependence may point to a common critical hadron density in pp, pPb, and peripheral PbPb collisions, since the present correlation technique measures the characteristic size of the system near the time of the last interactions.
Acknowledgments
This work was supported by the Hungarian Scientific Research Fund (K 109703), and the Swiss National Science Foundation (SCOPES 152601).
Conflicts of Interest
The authors declare no conflict of interest.
References
- Erazmus, B.; Lednicky, R.; Martin, L.; Nouais, D.; Pluta, J. Nuclear Interferometry from Low-Energy to Ultrarelativistic Nucleus-Nucleus Collisions. Available online: http://lss.fnal.gov/archive/other/subatech-96-03.pdf (accessed on 6 November 2017).
- CMS Collaboration. Measurement of Bose-Einstein correlations with first CMS data. Phys. Rev. Lett. 2010, 105, 032001. [Google Scholar]
- CMS Collaboration. Measurement of Bose-Einstein Correlations in pp Collisions at = 0.9 and 7 TeV. J. High Eenergy Phys. 2011, 2011, 029. [Google Scholar]
- STAR Collaboration. Pion femtoscopy in p + p collisions at = 200 GeV. Phys. Rev. C 2011, 83, 064905. [Google Scholar]
- ALICE Collaboration. Femtoscopy of pp collisions at = 0.9 and 7 TeV at the LHC with two-pion Bose- Einstein correlations. Phys. Rev. D 2011, 84, 112004. [Google Scholar]
- PHENIX Collaboration. Charged kaon interferometric probes of space-time evolution in Au+Au collisions at 200 GeV. Phys. Rev. Lett. 2009, 103, 142301. [Google Scholar]
- ALICE Collaboration. Charged kaon femtoscopic correlations in pp collisions at 7 TeV. Phys. Rev. D 2013, 87, 052016. [Google Scholar]
- Siklér, F. Femtoscopy with identified charged hadrons in pp, pPb, and peripheral PbPb collisions at LHC energies. In Proceedings of the WPCF 2014 workshop, Gyöngyös, Hungary, 25–29 August 2014. [Google Scholar]
- CMS Collaboration. Study of the inclusive production of charged pions, kaons, and protons in pp collisions at 0.9, 2.76, and 7 TeV. Eur. Phys. J. C 2012, 72, 2164. [Google Scholar]
- CMS Collaboration. Study of the production of charged pions, kaons, and protons in pPb collisions at 5.02 TeV. Eur. Phys. J. C 2014, 74, 2847. [Google Scholar]
- CMS Collaboration. The CMS experiment at the CERN LHC. J. Instrum. 2008, 3, S08004. [Google Scholar]
- Particle Data Group; Beringer, J.; Arguin, J.-F.; Barnett, R.M.; Copic, K.; Dahl, O.; Groom, D.E.; Lin, C.-J.; Lys, J.; Murayama, H.; et al. Review of Particle Physics. Phys. Rev. D 2012, 86, 010001. [Google Scholar]
- Csörgő, T.; Hegyi, S.; Zajc, W. Bose-Einstein correlations for Levy stable source distributions. Eur. Phys. J. C 2004, 36, 67–78. [Google Scholar] [CrossRef]
- Csörgő, T.; Hegyi, S.; Zajc, W. Stable Bose-Einstein correlations. Nukleonika 2004, 49, S7–S10. [Google Scholar]
- Pratt, S. Coherence and Coulomb effects on pion interferometry. Phys. Rev. D 1986, 33, 72–79. [Google Scholar] [CrossRef]
- Bowler, M. Coulomb corrections to Bose-Einstein correlations have been greatly exaggerated. Phys. Lett. B 1991, 270, 69–74. [Google Scholar] [CrossRef]
- Sinyukov, Y.; Lednicky, R.; Akkelin, S.; Pluta, J.; Erazmus, B. Coulomb corrections for interferometry analysis of expanding hadron systems. Phys. Lett. B 1998, 432, 248–257. [Google Scholar] [CrossRef]
- Lisa, M. Femtoscopy in heavy ion collisions: Wherefore, whence, and whither? AIP Conf. Proc. 2006, 828, 226–237. [Google Scholar]
© 2017 by the author. Licensee MDPI, Basel, Switzerland. This article is an open access article distributed under the terms and conditions of the Creative Commons Attribution (CC BY) license (http://creativecommons.org/licenses/by/4.0/).

