Abstract
This research examines in detail the behavior of the Equatorial Ionization Anomaly (EIA) during a severe geomagnetic storm that occurred on 10–11 October 2024. The global data of Total Electron Content (TEC) represented by relative deviation, giving information about the variations compared to quiet conditions, were used. The main attention is paid to the appearance of an additional “fountain effect” under the action of disturbed dynamo currents and the vertical drift of the ionospheric plasma caused by them. The results show that the area in which a positive response (increase) of TEC is observed occurs in an area corresponding to local time around 18–20 h (longitude around 60 °W) at magnetic latitudes ±30° and during the storm shifts westward to around 180 °W. The westward drift of the storm-induced “fountain effect” is moving at a speed much slower than the Earth’s rotation speed. As a result, the area of positive TEC response (vertical upward drift) and the area of negative response (vertical downward drift) are localized in both nighttime and daytime conditions. In this investigation, an example of a very similar geomagnetic storm registered on 25 September 1998 is given for comparison, in which a similar stationing of the storm-induced EIA was observed at longitudes around 180 °E.
1. Introduction
In recent decades, solar-terrestrial coupling and its effects on humanity have been of significant interest to scientists working in this field. It is well known that solar processes and changes in the solar wind have a significant impact on the Earth’s magnetosphere-thermosphere-ionosphere system. The dynamic pressure and electric field are the mechanisms for the connection between the solar wind and the magnetosphere. An important requirement for the coupling between the interplanetary magnetic field (IMF) and the dipole field is that the IMF be antiparallel to the dayside magnetic field. As a result of solar wind transport of the newly opened field lines to the nightside, an internal convection system is created [1]. The coupling between the solar wind and the magnetosphere is conditioned by the process of magnetic reconnection [2]. After a brief description of the interaction between the solar wind and the Earth’s magnetosphere, we should consider the cases of enhanced solar wind–magnetosphere interaction, which are defined as so-called geomagnetic storms. A sufficiently intense and long-lasting interplanetary convection electric field leads through a substantial energization in the magnetosphere-ionosphere system [3] during these moments. The result of the effect of magnetospheric storms on the ionosphere vary during each specific disturbance, which is defined as an ionospheric storm [4].
Ionospheric storms are part of space weather with important significance for ground and space-based technological systems, and in particular communication and navigation systems. These phenomena are the result of an increase in the flow of solar wind and magnetospheric energy, which inputs to the ionosphere [5]. As mentioned, the ionospheric storm is a complex process, which includes various features. The ionospheric response at mid latitude is determined by storm-induced changes in the neutral atmosphere, which are mainly the result of a strong Joule heating in the auroral thermosphere. In the neutral upper middle atmosphere, the effects of enhanced precipitation weaken with decreasing altitude and become insignificant and/or absent in the stratosphere [6]. The ionospheric response can generally be divided into positive and negative. Equatorward winds in sunlight produce positive ionospheric changes during the main phase of the geomagnetic storm. The increase in molecular nitrogen in areas of sunlight, the strength of which depends on the longitude and local time of the sector at the time of the storm onset, leads to a negative ionospheric response [7]. An interesting ionospheric effect that occurs at low and mid latitudes is the equatorial ionization anomaly (EIA). The presence of an anomalous latitudinal distribution of the critical frequencies of the ionospheric region F2 was noticed after the end of World War II [8]. This phenomenon occurs as a result of the removal of plasma from areas around the equator by the upward E × B drift creating the trough and consequently the crests with a small accumulation of plasma at the crests when the crests are within ~±20° magnetic latitudes. Electric fields are formed under the action of the zonal neutral wind in the so-called “dynamo region” of the ionosphere and have a tidal dependence on wind speed in quiet conditions [9]. An expansion of EIA is observed during geomagnetic storms, which is a result of the simultaneous impulsive action of eastward prompt penetration electric field and equatorward neutral wind. Intense ionospheric irregularities develop in the post-sunset bottom-side equatorial ionosphere when it rises to high altitudes and evolve nonlinearly into the topside [10]. The main physical mechanisms that influence electron density and play a significant role during ionospheric storms are as follows: magnetospherically driven ion convection and Joule heating and their impact on the high-latitude thermosphere and ionosphere; global changes in thermospheric circulation and composition; and traveling atmospheric disturbances and effects of electric field penetration to mid and low latitudes [11].
The study by Imtiaz et al., 2020 [12], showed that the equatorial TEC responded to intense solar flares even before the main phase of the geomagnetic storm on 8 September 2017. Under the influence of coronal mass ejection, a positive anomaly was registered in the vertical component of the interplanetary magnetic field one day before the onset of the geomagnetic storm, which did not cause an increase in the Kp index but was synchronous with an increase in TEC at low latitudes. The observed effect indicates that the high-speed solar wind stream can affect the ionosphere even before the geomagnetic storm occurs.
The main idea of the present research is to analyze the ionospheric TEC response and the manifestation of EIA during the geomagnetic storm that occurred on 10–11 October 2024. The introduction of the relative deviation of the TEC allows separating only the disturbed EIA. The disturbed EIA has peculiarities that indicate the presence of a disturbed “fountain effect”, leading to the appearance of local increases in TEC symmetrically located around the magnetic equator. The results of this work can be used to supplement the understanding of the main ionospheric irregularities occurring at low and mid latitudes in the conditions of geomagnetic storms.
2. Data and Methods
This section sequentially presents the data and methods used to study the ionospheric response. Selected solar and geomagnetic parameters characterizing the storm, which are important in the analysis of electron density anomalies, are examined. Detailed information about the TEC data is presented, as well as data on the ΣO/N2 ratio, which is a fundamental physical mechanism responsible for the response of the ionosphere to geomagnetic conditions.
2.1. Parameters Describing the Geomagnetic Storm
In this research, the components of the interplanetary magnetic field (IMF) are used, the data of which are provided by the NASA Advanced Composition Explorer (ACE) satellite at the following link: ftp://ftp.swpc.noaa.gov/pub/lists/ace/ (accessed on 28 August 2025). The Power Index was used, which provides data of the energy from the Sun entering the Earth’s auroral regions, received from the National Oceanic and Atmospheric Administration (NOAA), Space Weather Prediction Center (http://services.swpc.noaa.gov/text/aurora-nowcast-hemi-power.txt, accessed on 28 August 2025). The advantage of these types of data is related to the 5 min discretization of the data, which allows us to determine the exact time and initial phase of the geomagnetic storm.
Two other parameters that well describe geomagnetic activity and are widely used by scientists studying geomagnetic disturbances are the Dst index and planetary Kp index. In this study, both types of data were received from Goddard Space Flight Center (https://omniweb.gsfc.nasa.gov/, accessed on 28 August 2025).
2.2. Global Ionospheric TEC Data
The ionospheric response in the conditions of geomagnetic storms is important both for navigation systems and for various types of communications, in which it plays an essential role. The global TEC data used in the ionospheric response analysis were obtained from the NASA JPL (Jet Propulsion Laboratory, California Institute of Technology, La Cañada Flintridge, CA, USA): https://www.izmiran.ru/ionosphere/weather/grif/Maps/TEC/, accessed on 28 August 2025. Time resolution of the used ionospheric data is 1 h, with a grid spacing of 5° × 2.5° in longitude and latitude.
TEC data used in the present investigation are converted to a coordinate system with modip latitude and geographical longitude. The use of this modification was introduced by Rawer with the purpose of improving the accuracy of the representation of the ionospheric response at low and mid latitudes [13].
To study the spatial distribution of the TEC response, the relative deviation (rTEC) of its values from the hourly medians (TECmed) calculated over a time period of 27 days centered on the current day is used.
By introducing Formula (1), it is possible to estimate with sufficient accuracy the significance and type of the ionospheric response (positive or negative), even at high latitudes during the winter season during a geomagnetic storm.
2.3. ΣO/N2 Data
A very important parameter that indicates the change in atmospheric composition and leads to changes in the electron density of the ionosphere is the O/N2 ratio. In this study, the data for the column density ratio of O and N2 (ΣO/N2) measured by Global-scale Observations of the Limb and Disk (GOLD) were used, available at the following link: https://gold.cs.ucf.edu/data/search/, accessed on 28 August 2025. The geostationary GOLD satellite conducts density and temperature measurements in the thermosphere and ionosphere using an ultraviolet (UV) spectrograph. The advantage of this data is that it allows maps to be constructed of the magnitude at a specific time in a geographic region.
3. Results
This section will describe in detail the view of solar and geomagnetic conditions for the period 9–12 October 2024, in which the studied geomagnetic storm occurs. Based on the global TEC maps, the spatial distribution of the ionospheric response is studied in detail, with the main emphasis placed on the effects in the low and equatorial ionosphere.
Solar and Geomagnetic Conditions
The geomagnetic storm recorded on 10–11 October 2024 was caused by a Coronal Mass Ejection (CME) that erupted from the sun during the evening on 8 October 2024. (For more information, see the following link: https://www.swpc.noaa.gov/news/g4-severe-storm-watch-10-11-october, accessed on 28 August 2025). The speed of the solar wind recorded by DSCOVR and ACE satellites was 1200 to 1300 km/s.
The choice of parameters to describe the manifestation of geomagnetic storm is related to the interaction of the Earth’s geomagnetic field and all components—this determines the strength of the coupling [14,15].
The other types of parameters that are included in the analysis are the Power Index, Kp index and Dst index, which are essential in investigating the variability of geomagnetic activity [16].
The use of the planetary Kp index is related to tracking subauroral geomagnetic storms on a global scale. The Kp index is defined as a quasi-logarithmic measure from magnetic field measurements at 13 geomagnetic observatories at subauroral latitudes. The time interval is three hours, and the quantity scale is from 0 to 9. The physical processes that explain the variations in the Kp index are geomagnetic pulsations, bays or substorms, sudden commencements, geomagnetic storms and other anomalies, resulting from variations in the ring-current, magnetospheric and ionospheric currents [17,18,19].
The Dst index is derived from low-latitude ground-based observations of deviations in the H-component of the Earth’s geomagnetic field [20,21]. The Dst index characterizes the magnetic perturbation near the equator from currents flowing above the ionosphere. As such, it is adjusted for the Sq dayside ionospheric current system and for the secular variation due to changes in the internal magnetic field of the Earth [22]. The result of enhanced solar wind–magnetosphere interaction and the significant energization in the magnetosphere-ionosphere system under geomagnetic storm conditions are the main physical mechanisms associated with variations in the so-called ring current [23].
Detailed information about the variations in the solar and geomagnetic indices is shown in Figure 1. The illustrated parameters Bx, By and the Bz component of IMF (Figure 1a); solar wind speed (Figure 1b), the Kp index (Figure 1c), the Dst index (Figure 1d) and the Power Index (Figure 1e) allow an analysis of the type of geomagnetic event according to the accepted classifications.
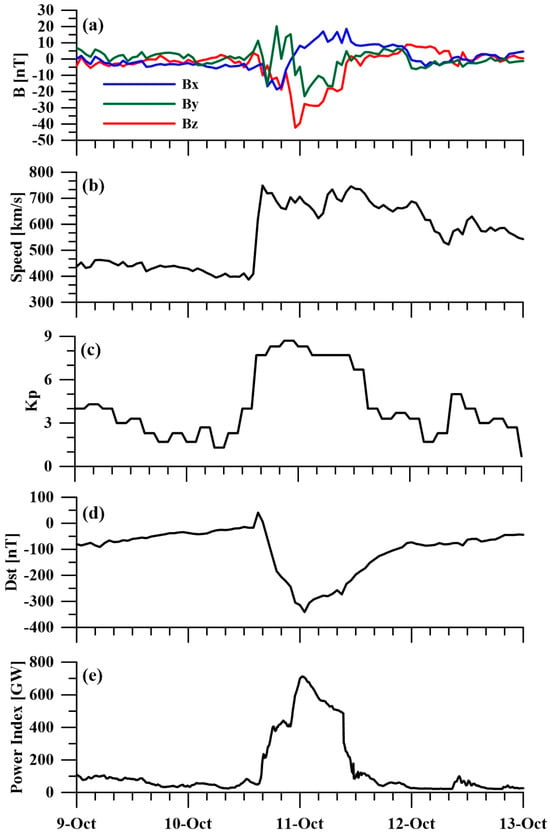
Figure 1.
Behavior of (a) Bx, By and the Bz component of IMF; (b) solar wind speed; (c) Kp index; (d) Dst index and (e) Power Index for the period 9–12 October 2024.
From Figure 1a, it can be seen that the Bz component is orientated southward and as a result connects with Earth’s magnetosphere in the hours after 16 UT on 10 October. The most significant negative value of the Bz component of the IMF is in the hours shortly before midnight on October 11 (Bz is about −40 nT/−50 nT). After this moment, the so-called recovery phase begins. The index reaches quiet conditions in the hours around 10 UT on 11 October, when the Bz component shows positive values. The speed of the solar wind (see Figure 1b) sharply increases (almost doubles) simultaneously with the orientation of the Bz to the south.
According to the displayed behavior of the Kp index for the period 9–12 October 2024, the beginning of the considered event occurs at around 16 UT, when the value of the index rises sharply to around Kp = 7.66. The maximum value of the Kp index is 8.66 in the hours from about 20 UT on 10 October 2024 to midnight on 11 October 2024. According to the behavior of the Kp index, as shown in Figure 1c, it can be seen that the duration of the geomagnetic storm is one day (from about 16 UT on 10 October to 16 UT on 11 October 2024). Based on the accepted classification of this index, the geomagnetic storm under consideration is classified as “Severe” (G4) (see the following link: https://www.swpc.noaa.gov/noaa-scales-explanation, accessed on 28 August 2025).
The manifestation of the other geomagnetic parameter Dst index is illustrated in Figure 1d. According to its behavior in the hours after 16 UT on 10 October, a sharp decrease in the Dst index values was observed, reaching around −350 nT in the hours shortly after midnight on 11 October (maximum of the considered storm). Through the accepted classification of the Dst index, the geomagnetic storm under consideration is defined as a Severe Storm (Dst values are between −200 nT and −350 nT) [14]. The interesting thing about the figure for this index is that it does not succeed in illustrating quiet conditions even in the next few days.
The power entering the auroral ovals, as indicated by the Power Index (Figure 1e), starts to increase around 14 UT on 10 October and reaches a maximum of around 700 GW in the hours around 00 UT on 11 October, then drops to quiet conditions around 15 UT on 11 October.
From the behavior of the parameters shown in Figure 1, it can be seen that the duration of the storm is about one day. The rising and falling phases are of relatively equal duration, which can be used to estimate the delay of the ionospheric responses. An advantage of the storm in question is that it occurs on days close to the autumnal equinox. The statistical study of Mukhtarov, Bojilova, 2025 [24], shows that geomagnetic disturbances in the ionosphere in the equinoctial months are relatively symmetrical with respect to both Earth hemispheres. It turns out that the transition from summer to winter meridional circulation suppresses the penetration of heated air from the auroral regions to mid and low latitudes. It also reduces the influence of changes in the O/N2 ratio on the effects caused by disturbed dynamo, which are the subject of the present study.
Figure 2 shows the variability of the monthly medians for October of TEC as a function of modip latitude and local time. These values characterize the diurnal course of TEC in quiet conditions for the month under consideration. The relative TEC values used in this work were obtained as the deviations of the measured TEC during the storm relative to them.
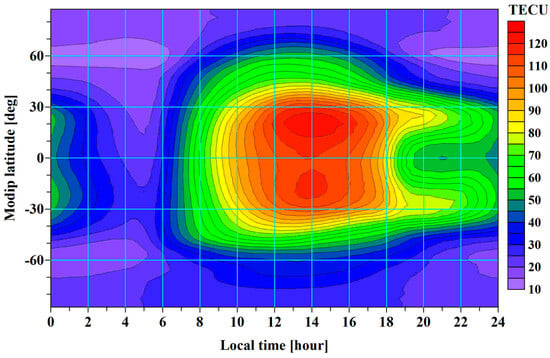
Figure 2.
Behavior of monthly medians of TEC depending on modip latitude and local time.
According to the EIA theory, the splitting of the TEC maximum around the magnetic equator is due to an ExB vertical plasma drift directed upwards, which is caused by eastward-directed currents in the ionospheric region E induced by the neutral zonal wind [25]. For the month chosen in this investigation, namely October 2024, the splitting of the maximum becomes noticeable around 14 LT, reaches a maximum around 21 LT and disappears around 04 LT (see Figure 2). The values of average quiet day vertical drift based on Jicamarca data presented in Fejer et al., 1983 [26], show an almost sinusoidal dependence with a positive maximum around 12 LT.
Negative values of the equatorial vertical drift, at which the “fountain effect” cannot be expected, occur between 18 LT and 06 LT. In the specific month of October 2024, the EIA is out of phase with the equatorial vertical drift, which can be explained by the delay caused by the time required for plasma transport from low to mid-latitudes along the Earth’s magnetic field lines.
Figure 3 shows the global distribution of TEC at specific hours (between 10 UT–18 UT) for the days 10 and 11 October of the studied geomagnetic storm. The maps referring to 10 UT and 12 UT on 10 October illustrate the quiet conditions of the ionosphere and coincide with the medians presented in Figure 2. At 18 UT on 10 October, an increase in the TEC at lengths of 90 °W (12 LT) and a deepening of the splitting were observed, which could be interpreted as a consequence of the strengthening of the “fountain effect”. At longitudes 60 °E (22 LT), a decrease in TEC is observed. On October 11 at 10 UT, the longitudinal (and local time) distribution of TEC differs significantly from that under quiet conditions. At longitudes around 120 °W (02 LT, night conditions), both an increase in TEC and an expansion of the split region are observed, which can be interpreted as an increase in vertical drift and the “fountain effect”. The opposite is observed in daytime conditions (60 °E, 14 UT) with a decrease in TEC and disappearance of the splitting around the magnetic equator. The difference between 10 and 11 October is particularly strong at 12 UT.
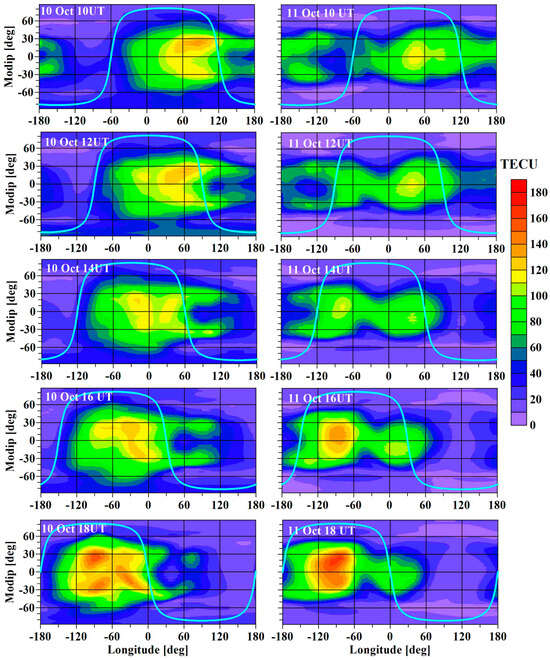
Figure 3.
Global TEC distribution for selected hours between 10 UT and 18 UT on 10 October 2024 (left part panels) and 11 October 2024 (right part panels).
The longitudinal distribution of the storm-induced vertical drift differs significantly from that of the vertical drift under quiet conditions. A second maximum of the TEC appears between 14 UT and 18 UT on 11 October, but without a bifurcation in conditions around sunset (around 18 LT).
The longitudinal distribution of TEC can be described quite well as the sum of the zonal mean value and a cosine with a spatial period of one full angle (360°). The decomposition of ionospheric quantities (including TEC) into zonal mean values and sinusoidal longitudinal distributions (stationary and migrating) is widely used in empirical modeling of ionospheric characteristics.
Figure 4a shows the behavior of the zonal mean value, the amplitude of the cosine (see Figure 4b) and the phase expressed in local time (see Figure 4c), which determines the positive maximum of the cosine.
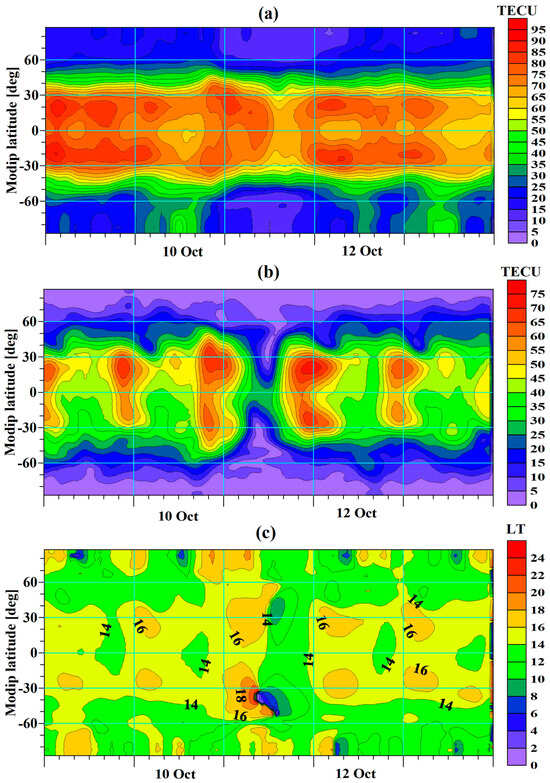
Figure 4.
(a) Behavior of the zonal mean value of TEC; (b) the amplitude of the cosine and (c) the phase expressed in local time.
During the geomagnetic storm, the zonal mean TEC did not change considerably, but in the hours around 00 UT on October 11 (around the maximum of the storm), an increase in and expansion of the split of the positive response to ±30 was observed. The amplitude, shown in Figure 4b, varies widely. After an increase in the second half on 10 October, a strong decrease occurred, registered around 12 UT on 11 October. This result illustrates the particular longitudinal distribution of TEC shown in Figure 3 during those hours when the storm intensity drops almost close to quiet conditions. The phase of the cosine wave remains almost the same as under quiet conditions (around 14 LT–16 LT) until the middle of the day on 11 October when a sharp shift towards the night hours is observed (see Figure 4c).
From the analysis of the TEC data, it is found that the storm-induced vertical drift and fountain effect differs greatly in geographical longitude and local time from that under quiet conditions. The conversion of measured (raw) TEC data into relative to quiet conditions TEC can contribute to determining the spatial distribution and temporal evolution of the disturbed vertical drift and “fountain effect”.
As described in Mukhtarov et al., 2018 [27], the relative TEC calculation procedure effectively filters out all components of the quiet diurnal cycle, including the quiet equatorial drift. It follows that the values of the relative deviation and their spatial and temporal distribution qualitatively represent the spatial and temporal distribution of the disturbed vertical drift and “fountain effect”. To eliminate the effects associated with the thermal impact of the storm on recombination through the O/N2 ratio, the zonal mean values of relative TEC were subtracted from the relative TEC values. Zonal mean relative TEC is illustrated in Figure 5.
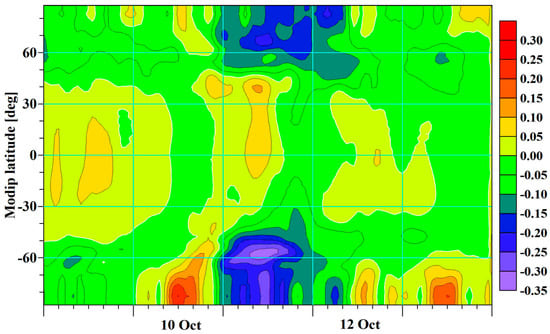
Figure 5.
Zonal mean relative TEC.
The figure below shows that in the low-latitude region (30 °N–30 °S), a weak negative response was observed in the second half of the day on 11 October, i.e., after the storm ended in the recovery phase. A strong negative response during the geomagnetic storm is observed only at high latitudes, which is a characteristic feature of the season.
The spatial distribution maps of the relative TEC shown in Figure 6 and Figure 7 illustrate the peculiarities of disturbed dynamo effects during the considered geomagnetic storm.
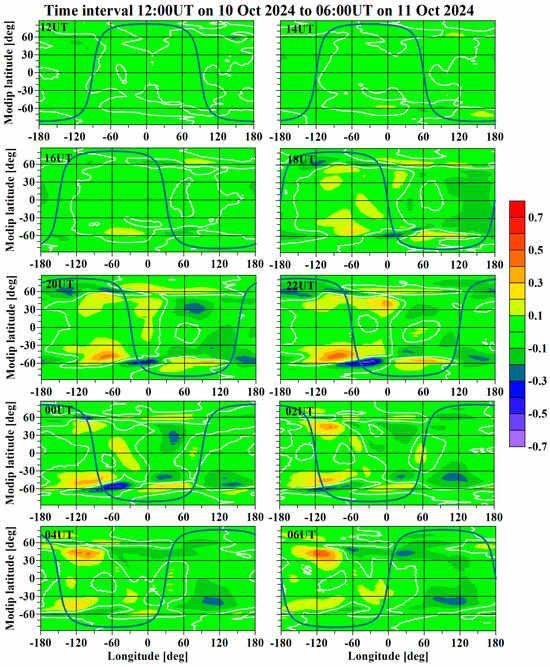
Figure 6.
Spatial distribution of relative TEC values with zonal mean values removed from them for the period 11 October at 08:00 UT–12 October at 02:00 UT. The ice blue color in all subgraphs indicates the terminator line.
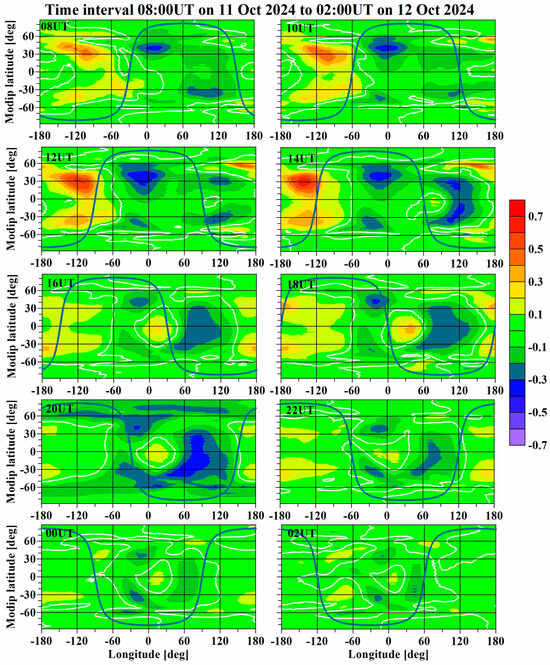
Figure 7.
Spatial distribution of relative TEC values with zonal mean values removed from them for the period 11 October at 08:00 UT–12 October at 02:00 UT.
Figure 6 presents the spatial distribution of the ionospheric response for the period 11 October at 08:00 UT–12 October at 02:00 UT. Two symmetrically located positive responses relative to the magnetic equator appear around 16 UT on 10 October at longitudes of about 60 °W, which corresponds to 12 LT. Until 06 UT on 11 October, these responses slowly shift westward to about 90°W, therefore moving from daytime conditions to the nighttime region, which is also observed in Figure 3. The symmetrical distribution relative to the magnetic equator gives reason to interpret this response as a disturbed “fountain effect”.
An interesting result, which can be seen from Figure 6, is related to the appearance of an area with a positive ionospheric TEC response between the negative responses, located on the magnetic equator (in the time interval 16 UT–20 UT) around the zero meridian, which at these hours passes from daytime to nighttime conditions. The negative response reaches its maximum at 20 UT on 11 October and gradually decreases until 02 UT on 12 October without moving noticeably.
A similar representation of the spatial distribution of the ionospheric response is shown in Figure 7. In this particular example, the period 11 October at 08:00 UT–12 October at 02:00 UT is covered. The figure below shows that the positive anomaly of ±30° is formed in the night sector and is more significant in the northern hemisphere. TEC reaches maximum values around 12 UT–14 UT on 11 October. Along with the positive response, two pairs of areas are formed at the same modip latitudes, but one negative pair of responses occurs in daytime conditions, while the other occurs in night conditions. One of the pairs is located in the area of local noon, and the other pair is in the eastern hemisphere in the hours after sunset. The negative nature of the response can be interpreted as a consequence of negative drift caused by downward directed electric fields.
Additional visualization of the longitudinal and local time dependence of disturbed EIA during the considered geomagnetic storm is presented in the maps in Figure 8. This map shows the behavior of the relative TEC at modip latitudes 40 °N (a, b), equator (c, d) and 40 °S (e, f) depending on longitude and depending on local time from 12 UT on 10 October to 12 UT on 12 October. An area of positive response at both mid-latitudes appears at the beginning of the storm. A noticeable increase was observed during the night on 10 October and throughout the entire 11 October. The positive response is localized around 90 °W at the beginning of the day on 11 October and shifting to 180°W by the end of the day. An area with a negative response is observed at eastern longitudes with a corresponding slow westward shift. The longitudinal structure of the TEC response has a clearly pronounced “zonal wave with wave number 1” character. The slope of the zero value lines, especially on the right column of maps (dependence on local time) clearly shows that the movement of this “wave” from east to west has a phase velocity significantly smaller than the Earth’s rotation speed, which means that the time evolution of disturbed EIA cannot be represented only as a function of local time.
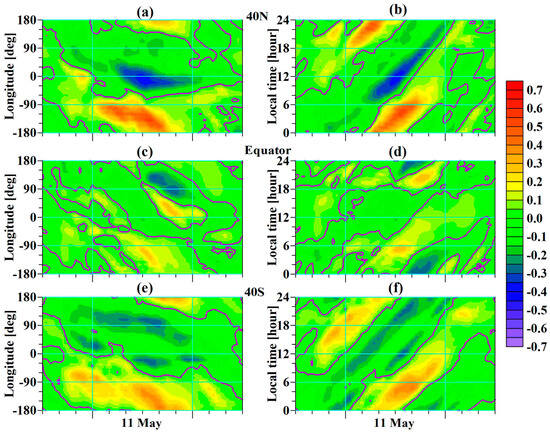
Figure 8.
Behavior of the relative TEC at modip latitudes 40°N (a,b), equator (c,d) and 40°S (e,f) depending on longitude (left part panels) and depending on local time (right part panels) from 12 UT on 10 October to 12 UT on 12 October.
Figure 9 presents the relative TEC approximated by a zonally distributed cosine with a spatial period of 360°. The appropriateness of such a representation follows from Figure 8. The maps show the Earth’s hemisphere from 180 °W to 180 °E. The central meridian of the maps is 90 °W. Positive responses, which can be associated with a disturbed “fountain effect”, are observed at modip latitudes around 50° and gradually migrate to modip latitudes of 30°. The westward shift of positive responses is much slower than the Earth’s rotation. In almost a day, the response migrates from about 60 °W to about 180 °W, i.e., with a speed about three times slower than the Earth’s rotation speed.
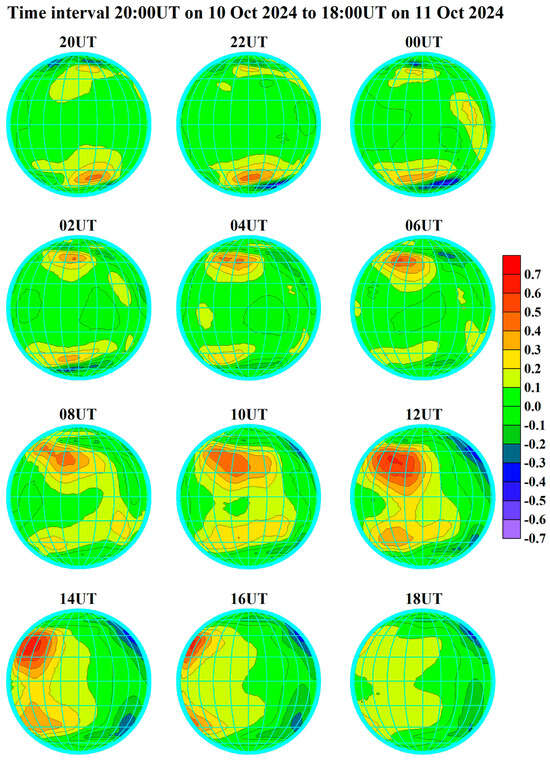
Figure 9.
Manifestation of the relative TEC approximated by a zonally distributed cosine with a spatial period of 360° for the period from 10 October 2024 at 20:00 UT to 11 October 2024 at 18:00 UT with a step of 2 h.
Figure 10a presents the amplitudes of the approximating cosine for all latitudes during the studied geomagnetic storm. Figure 10b demonstrates the behavior of the phases expressed in geographic degrees. Figure 10c illustrates the behavior of the phases expressed in local time. As can be seen from the figure, at the beginning of the storm, the amplitude of the two modip latitudes around 45 °N and 45 °S increases after 16 UT at a phase around 0° (local time around noon). After a certain attenuation, the amplitude increases significantly, especially in the northern hemisphere, and reaches a maximum around 14 UT on October 11 (at local time around 04 LT–06 LT). At this time, the energy entering the auroral regions from particle precipitation decreases to that under quiet conditions (see Figure 1d). By the end of the day on October 11, the amplitude decreases to low values, and the phase smoothly reaches about 180 °W.
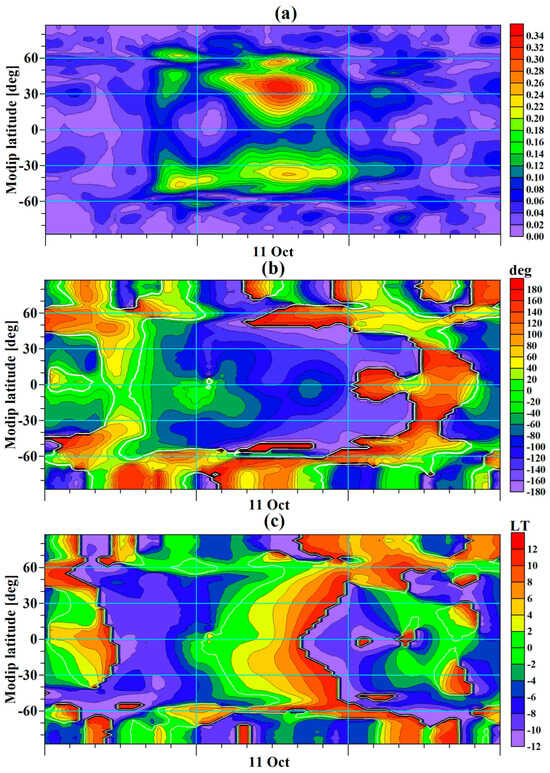
Figure 10.
Behavior of (a) the amplitudes of the approximating cosine for all latitudes, (b) the phases, represented in geographic degrees, and (c) the phases, represented in local time.
Fejer et al., 2008 [28], in their work, show the generalized dependence of equatorial disturbance dynamo vertical plasma drifts during equinox on satellite data. The authors’ results show a significant local time dependence at all seasons of prompt penetration vertical drifts, which are directed upward during the day and downward at night. Another effect analyzed by the authors’ team is related to the fact that during equinox, the downward disturbance dynamo drifts near sunset are largest in the eastern hemisphere, while the late night upward drifts are largest in the western hemisphere.
As shown in Figure 3 of this investigation, positive values of vertical drift are observed between 21 LT and 06 LT, and negative values are observed between 17 LT and 21 LT. During the rest of the day, the values of the vertical drift are positive, but very small. The response of the ionospheric TEC during the storm under consideration differs significantly from the local time dependence.
For comparison with the results of the storm considered above (October 2024), Figure 11 shows analogous representations for the geomagnetic disturbance during 24–25 September 1998. The results obtained for this storm can be compared with the main storm subject of this research for the following reasons: (a) it has practically the same intensity (Kp = 8.33—See Figure 11a); (b) it has the same duration (about one day); and (c) this disturbance also develops during equinox conditions. The behavior of the zonal amplitude presented in Figure 11b is very similar to that of the considered storm in October 2024. The maxima of modip latitudes ±30° are observed around 12 UT–14 UT on 25 September, shortly before the end of the storm. However, the phase progression presented in Figure 11c is different from the main event in October 2024. In the early hours of September 24, the phase is around zero (respectively 360°, eastern longitudes are presented on the map). The phase shifts westward to about 120° in the northern hemisphere and to about 140° in the southern hemisphere. The maxima have phases of about 180°, which means local time around midnight. Despite the noted differences, in this case too, a movement of disturbed EIA in a westerly direction is observed with a phase speed significantly smaller than the Earth’s rotation speed.
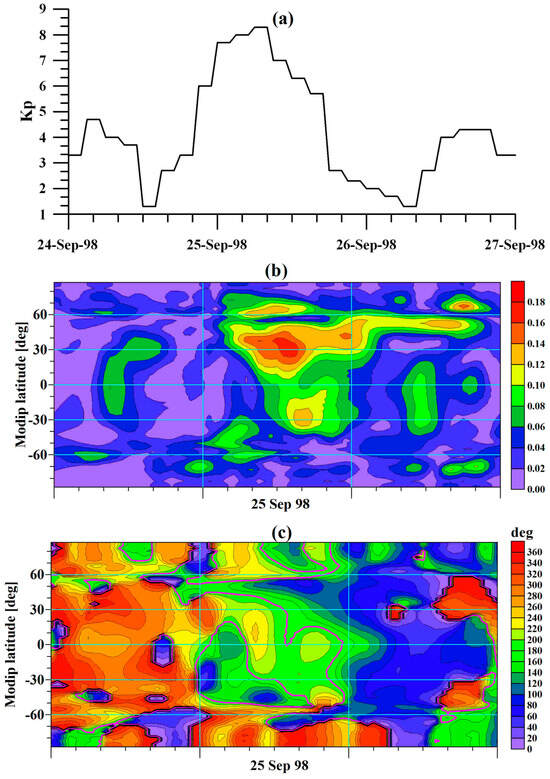
Figure 11.
The manifestation of geomagnetic storm on 24–25 September 1998. (a) Behavior of Kp index for the period 24–26 September; (b) the zonal amplitudes and (c) phases.
In their investigations, the authors Scherliess, L., Fejer, B. G., 1997 [29], and Abdu et al., 2006 [30], noted the presence of a delay between the auroral indices and the vertical drift measured around the equator. The values of the delay obtained based on correlation and regression analysis are from 1 to 12 h. A delay varying in such wide limits (half a day) confirms the results obtained in the present study.
4. Discussion
In this section, an attempt is made to assess the extent to which changes in the ratio of atomic oxygen and molecular nitrogen gases (O/N2 ratio) during a geomagnetic storm affect the response of the ionospheric TEC at low latitudes.
In their study, Cai et al., 2020 [31], investigated ΣO/N2 variations during weak geomagnetic activity events. The authors obtained a negative response at mid-latitudes in the northern hemisphere. The article by Cai et al., 2023 [32], investigated the behavior of ΣO/N2 in the southern hemisphere during the geomagnetic storm on 3 February 2022. An area with a positive response was obtained in low southern latitudes. In the paper by Huang et al., 2016 [33], special attention is paid to the effect of the decrease in O/N2 at high and mid-latitudes and its increase at low latitudes during the St. Patrick’s Day geomagnetic storm in 2015. The authors explain the observed increase in the O+ concentration with variations of atomic oxygen and molecular N2 densities under the influence of the vertical drift of positive and negative ions.
In the paper by Imtiaz et al., 2020 [12], an increase in the O/N2 ratio during the September 2017 storm was obtained in low and mid-latitudes, more significantly in the African, Asian and East Pacific sectors. According to this study, the asymmetry in the distribution of the O/N2 density ratio is found to be related to the asymmetry of the magnetic poles.
Figure 12 shows the spatial distribution of relative ΣO/N2 compared to the quiet day (9 October 2024) at given hours for the period 10–12 October. On 10 October, an increase was observed in the polar regions, probably related to particle precipitation processes in the auroral region. At low latitudes, ΣO/N2 is indistinguishable from that in quiet conditions. A significant and sudden change occurs on 11 October. At mid-latitudes, a significant decrease in ΣO/N2 is observed, which fully corresponds to the negative response of the zonal mean TEC shown in Figure 5.
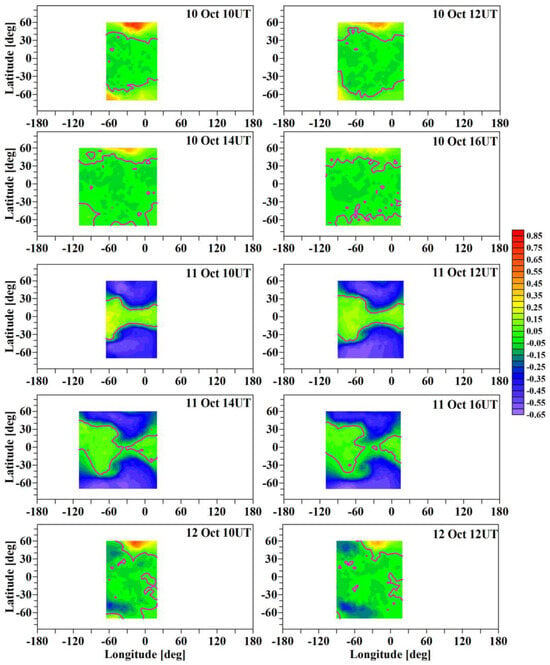
Figure 12.
Spatial distribution of relative deviations of the ΣO/N2 compared to the undisturbed day 9 October for selected hours for the period 10 October 2024 at 10 UT–12 October 2024 at 12 UT.
At low latitudes and at the equator, a positive response (increase) of about 25% is obtained compared to quiet conditions, which is the situation on 9 October 2024. The data used do not allow an analysis of the effect of all latitudes, but this positive effect probably corresponds to the positive response of the relative TEC at low latitudes, which is demonstrated in Figure 5. The extension of the area of the ΣO/N2 increase around 60 °W does not coincide with the disturbed EIA at the same time, which is localized to the west (See Figure 7). It is possible that the storm-induced increase in ΣO/N2 has an impact on the longitudinal and latitudinal distribution of TEC in the low-latitude region, but based on the available data, it is difficult to separate its influence from the direct influence of plasma drift. The resulting influence of ΣO/N2 variations at low latitude TEC is secondary due to the significant longitudinal difference.
The significant distinction between the mid-latitude regions of the strongly reduced O/N2 ratio and the low-latitude region of increase means that the influence of the geomagnetic storm on the neutral atmosphere is carried out through different physical mechanisms in different latitude regions of the Earth.
5. Conclusions
In this work, was the response of TEC during a severe geomagnetic storm registered on 10–11 October 2024 was investigated. The occurrence of this geomagnetic storm is in conditions close to equinoxes, and this makes it possible to track the behavior of the EIA phenomenon due to the reduced influence of temperature on the neutral composition of the atmosphere compared to the summer season.
The introduction of the relative deviation of the TEC compared to the stationary diurnal course during the considered month allows separation of the disturbed EIA, caused by the presence of disturbed winds in the equatorial region and the electric fields and plasma drift generated by them. The disturbed EIA has features that indicate the presence of a disturbed “fountain effect”, leading to the appearance of local increases in TEC symmetrically located around the magnetic equator.
For a first approximation, disturbed EIA can be represented as a zonal co-sinusoidal wave, the positive region of which corresponds to a vertical drift directed upwards, which is similar to EIA during quiet conditions. However, the zonal wave that describes the EIA in quiet conditions moves in a westerly direction with a speed equal to the Earth’s rotation speed. The disturbed EIA moves westward, but in the selected geomagnetic storm, its speed is about three times slower than the Earth’s rotation speed. Its amplitude increases during the storm and reaches a maximum approximately one day after the storm begins and half a day after its maximum. This result is analogous to the observed response of TEC during the geomagnetic storm on 25–26 September 1998 and in other geomagnetic storms occurring in different seasons [34].
The observed expansion of the EIA in the latitudinal and longitudinal distribution of TEC is only at the beginning of the storm when the positive maxima of the quiet and disturbed “fountain effect” coincide. Due to the delay of the positive maximum, the EIA is shifted to the night part.
In this investigation, the behavior of the O/N2 ratio at low latitudes was also investigated. An increase in the O/N2 ratio of about 25% compared to quiet conditions is observed, but at longitudes that do not coincide with a positive TEC response. A “stationing” of the disturbed “fountain effect” was obtained in a limited longitudinal region between 60 °W and 180°W during a period of one day when the considered geomagnetic storm occurred. This means that the disturbed meridional wind generated by the storm has similarly “stationed” in a limited longitudinal interval, despite the fact that it is the midnight region in which particles precipitate. Accordingly, the heating of neutral air shifts in a westerly direction along with the rotation of the Earth, as shown in Bojilova, R., Mukhtarov, P., 2024 [34]. The transport of disturbed meridional wind to equatorial latitudes occurs with a delay, including the influence of the Earth’s rotation. The observed stationarity of disturbed EIA may also be influenced by Prompt Penetration Electric Fields (PPEFs) induced directly in the equatorial region, which also cause vertical plasma drift and which, according to Fejer et al., 2008 [28], have a different dependence on local time than that of the disturbance dynamo.
Author Contributions
Conceptualization, P.M. and R.B.; methodology, P.M.; software, P.M. and R.B.; validation, P.M.; formal analysis, R.B.; investigation, P.M. and R.B.; resources, P.M.; data curation, P.M. and R.B.; writing—original draft preparation, R.B.; writing—review and editing, R.B.; visualization, R.B.; supervision, R.B. All authors have read and agreed to the published version of the manuscript.
Funding
This work was partially supported by the Centre of Excellence in Informatics and ICT under the Grant No BG16RFPR002-1.014-0018, financed by the Research, Innovation and Digitalization for Smart Transformation Programme 2021-2027 and co-financed by the European Union.
Data Availability Statement
The global TEC data are available at https://www.izmiran.ru/ionosphere/weather/grif/Maps/TEC/, accessed on 28 August 2025. The indices Dst and Kp and the Bz component were obtained from https://omniweb.gsfc.nasa.gov/. The data for column density ratio of O/N2, measured by GOLD, are available at the following link: https://gold.cs.ucf.edu/data/search/, accessed on 28 August 2025. The Power Index is available at http://services.swpc.noaa.gov/text/aurora-nowcast-hemi-power.txt, accessed on 28 August 2025.
Acknowledgments
The authors express their special thanks to Goddard Space Flight Center for freely available data of the Bz component, Dst index and Kp index. The authors are grateful for the global TEC data, which are freely available on the website of the Institute of Terrestrial Magnetism, Ionosphere and Radio Wave Propagation (IZMIRAN). We are grateful to the NOAA, Space Weather Prediction Center, for Power Index data and the data for the O/N2 ratio obtained from GOLD.
Conflicts of Interest
The authors declare no conflicts of interest.
References
- McPherron, R.L.; Weygand, J.M.; Hsu, T.S. Response of the Earth’s magnetosphere to changes in the solar wind. J. Atmos. Sol.-Terr. Phys. 2008, 70, 303–315. [Google Scholar] [CrossRef]
- Lyon, J.G. The solar wind-magnetosphere-ionosphere system. Science 2000, 288, 1987–1991. [Google Scholar] [CrossRef]
- Gonzalez, W.D.; Joselyn, J.A.; Kamide, Y.; Kroehl, H.W.; Rostoker, G.; Tsurutani, B.T.; Vasyliunas, V.M. What is a geomagnetic storm? J. Geophys. Res. Space Phys. 1994, 99, 5771–5792. [Google Scholar] [CrossRef]
- Blagoveshchenskii, D.V. Effect of geomagnetic storms (substorms) on the ionosphere: 1. A review. Geomagn. Aeron. 2013, 53, 275–290. [Google Scholar] [CrossRef]
- Buonsanto, M. Ionospheric Storms—A Review. Space Sci. Rev. 1999, 88, 563–601. [Google Scholar] [CrossRef]
- Danilov, A.D.; Lastovicka, J. Effects of geomagnetic storms on the ionosphere and atmosphere. Int. J. Geomagn. Aeron. 2001, 2, 209–224. [Google Scholar]
- Fuller-Rowell, T.J.; Codrescu, M.V.; Moffett, R.J.; Quegan, S. Response of the thermosphere and ionosphere to geomagnetic storms. J. Geophys. Res. Space Phys. 1994, 99, 3893–3914. [Google Scholar] [CrossRef]
- Appleton, E.V. Two anomalies in the ionosphere. Nature 1946, 157, 691. [Google Scholar] [CrossRef]
- Blanc, M.; Richmond, A.D. The ionospheric disturbance dynamo. J. Geophys. Res. Space Phys. 1980, 85, 1669–1686. [Google Scholar] [CrossRef]
- Balan, N.; Liu, L.; Le, H. A brief review of equatorial ionization anomaly and ionospheric irregularities. Earth Planet. Phys. 2018, 2, 257–275. [Google Scholar] [CrossRef]
- Richmond, A.D.; Lu, G. Upper-atmospheric effects of magnetic storms: A brief tutorial. J. Atmos. Sol.-Terr. Phys. 2000, 62, 1115–1127. [Google Scholar] [CrossRef]
- Imtiaz, N.; Younas, W.; Khan, M. Response of the low-to mid-latitude ionosphere to the geomagnetic storm of September 2017. Ann. Geophys. 2020, 38, 359–372. [Google Scholar] [CrossRef]
- Rawer, K. Encyclopedia of Physics. In Geophysics III, 1st ed.; Rawer, K., Ed.; Springer: Berlin/Heidelberg, Germany, 1984; Part VII; pp. 389–391. [Google Scholar]
- Adebesin, B.O.; Ikubanni, S.O.; Kayode, J.S.; Adekoya, B.J. Variability of solar wind dynamic pressure with solar wind parameters during intense and severe storms. Afr. Rev. Phys. 2013, 8, 119–128. [Google Scholar]
- Mishra, R.K.; Adhikari, B.; Chapagain, N.P.; Baral, R.; Das, P.K.; Klausner, V.; Sharma, M. Variation on solar wind parameters and total electron content over middle-to low-latitude regions during intense geomagnetic storms. Radio Sci. 2020, 55, e2020RS007129. [Google Scholar] [CrossRef]
- Rostoker, G. Geomagnetic indices. Rev. Geophys. 1972, 10, 935–950. [Google Scholar] [CrossRef]
- Matzka, J.; Stolle, C.; Yamazaki, Y.; Bronkalla, O.; Morschhauser, A. The geomagnetic Kp index and derived indices of geomagnetic activity. Space Weather 2021, 19, e2020SW00264. [Google Scholar] [CrossRef]
- Matzka, J.; Bronkalla, O.; Tornow, K.; Elger, K.; Stolle, C. Geomagnetic kp index. GFZ Ger. Res. Cent. Geosci. 2021, 11, 1–5. [Google Scholar] [CrossRef]
- Menvielle, M.; Berthelier, A. The K-derived planetary indices: Description and availability. Rev. Geophys. 1991, 29, 415–432. [Google Scholar] [CrossRef]
- Sugiura, M. Hourly values of equatorial Dst for the IGY. In Annual International Geophysical Year; Pergamon: New York, NY, USA, 1964. [Google Scholar]
- Guarnieri, F.L.; Tsurutani, B.T.; Gonzalez, W.D.; Echer, E.; Gonzalez, A.L.; Grande, M.; Soraas, F. ICME and CIR storms with particular emphasis on HILDCAA events. In Proceedings of the ILWS Workshop, Goa, India, 19–24 February 2006; pp. 19–20. [Google Scholar]
- Temerin, M.; Li, X. The Dst index underestimates the solar cycle variation of geomagnetic activity. J. Geophys. Res. Space Phys. 2015, 120, 5603–5607. [Google Scholar] [CrossRef]
- Kozyra, J.U.; Liemohn, M.W. Ring current energy input and decay. Space Sci. Rev. 2003, 109, 105–131. [Google Scholar] [CrossRef]
- Mukhtarov, P.; Bojilova, R. Correlation Analysis Between Total Electron Content and Geomagnetic Activity: Climatology of Latitudinal, Seasonal and Diurnal Dependence. Atmosphere 2025, 16, 478. [Google Scholar] [CrossRef]
- Richmond, A.D. Ionospheric wind dynamo theory: A review. J. Geomagn. Geoelectr. 1979, 31, 287–310. [Google Scholar] [CrossRef]
- Fejer, B.G.; Larsen, M.F.; Farley, D.T. Equatorial disturbance dynamo electric fields. Geophys. Res. Lett. 1983, 10, 537–540. [Google Scholar] [CrossRef]
- Mukhtarov, P.; Andonov, B.; Pancheva, D. Empirical model of TEC response to geomagnetic and solar forcing over Balkan Peninsula. J. Atmos. Sol. Terr. Phys. 2018, 167, 80–95. [Google Scholar] [CrossRef]
- Fejer, B.G.; Jensen, J.W.; Su, S.-Y. Seasonal and longitudinal dependence of equatorial disturbance vertical plasma drifts. Geophys. Res. Lett. 2008, 35, L20106. [Google Scholar] [CrossRef]
- Scherliess, L.; Fejer, B.G. Storm time dependence of equatorial disturbance dynamo zonal electric fields. J. Geophys. Res. Space Phys. 1997, 102, 24037–24046. [Google Scholar] [CrossRef]
- Abdu, M.A.; De Souza, J.R.; Sobral, J.H.A.; Batista, I.S. Magnetic storm associated disturbance dynamo effects in the low and equatorial latitude ionosphere. In Recurrent Magnetic Storms: Corotating Solar Wind Streams Geophysical Monograph Series, 1st ed.; Tsurutani, B., McPherron, R., Lu, G., Sobral, J.H.A., Gopalswamy, N., Eds.; AGU: Washington, DC, USA, 2006; Volume 167, pp. 283–304. [Google Scholar]
- Cai, X.; Burns, A.G.; Wang, W.; Qian, L.; Solomon, S.C.; Eastes, R.W.; Pedatella, N.; Daniell, R.E.; McClintock, W.E. The two-dimensional evolution of thermospheric ∑O/N2 response to weak geomagnetic activity during solar-minimum observed by GOLD. Geophys. Res. Lett. 2020, 47, e2020GL088838. [Google Scholar] [CrossRef]
- Cai, X.; Wang, W.; Lin, D.; Eastes, R.W.; Qian, L.; Zhu, Q.; Correira, J.; McClintock, W.E.; Gan, Q.; Aryal, S.; et al. Investigation of the Southern Hemisphere mid-high latitude thermospheric ∑O/N2 responses to the Space-X storm. J. Geophys. Res. Space Phys. 2023, 128, e2022JA031002. [Google Scholar] [CrossRef]
- Huang, C.S.; Wilson, G.R.; Hairston, M.R.; Zhang, Y.; Wang, W.; Liu, J. Equatorial ionospheric plasma drifts and O+ concentration enhancements associated with disturbance dynamo during the 2015 St. Patrick’s Day magnetic storm. J. Geophys. Res. Space Phys. 2016, 121, 7961–7973. [Google Scholar] [CrossRef]
- Bojilova, R.; Mukhtarov, P. Seasonal Features of the Ionospheric Total Electron Content Response at Low Latitudes during Three Selected Geomagnetic Storms. Atmosphere 2024, 15, 278. [Google Scholar] [CrossRef]
Disclaimer/Publisher’s Note: The statements, opinions and data contained in all publications are solely those of the individual author(s) and contributor(s) and not of MDPI and/or the editor(s). MDPI and/or the editor(s) disclaim responsibility for any injury to people or property resulting from any ideas, methods, instructions or products referred to in the content. |
© 2025 by the authors. Licensee MDPI, Basel, Switzerland. This article is an open access article distributed under the terms and conditions of the Creative Commons Attribution (CC BY) license (https://creativecommons.org/licenses/by/4.0/).