Article

Spectral Analysis of Star-Forming Galaxies at z < 0.4 with FADO: Impact of Nebular Continuum on Galaxy Properties

1
Jodrell Bank Centre for Astrophysics, Department of Physics and Astronomy, The University of Manchester, Oxford Road, Manchester M13 9PL, UK
2
South-Western Institute for Astronomy Research, Yunnan University, Kunming 650500, China
3
School of Physics and Astronomy, Beijing Normal University, Beijing 100875, China
4
Institute for Frontier in Astronomy and Astrophysics, Beijing Normal University, Beijing 102206, China
5
Instituto de Astrofísica e Ciências do Espaço, Universidade de Lisboa-OAL, Tapada da Ajuda, PT1349-018 Lisboa, Portugal
6
Departamento de Física, Faculdade de Ciências da Universidade de Lisboa, Edifício C8, Campo Grande, PT1749-016 Lisboa, Portugal
*
Author to whom correspondence should be addressed.
Universe 2025, 11(9), 285; https://doi.org/10.3390/universe11090285
Submission received: 8 July 2025 / Revised: 19 August 2025 / Accepted: 22 August 2025 / Published: 24 August 2025
(This article belongs to the Section Galaxies and Clusters)

Abstract

The star formation rate (SFR) is a crucial astrophysical characteristic for understanding the formation and evolution of galaxies, determining the interplay between the interstellar medium and stellar activity. The mainstream approach to studying stellar properties in galaxies relies on stellar population synthesis models. However, these methods neglect nebular emission, which can bias SFR estimates. Recent studies have indicated that nebular emission is non-negligible in strongly star-forming regions. However, targeted research is currently limited, particularly regarding galaxies at slightly higher redshifts ( z < 0.4 ). In this work, 696 star-formation galaxies with stellar mass in 10 9 10 11 M are selected from the SDSS-DR18 and their spectra are fitted via the fitting analysis using differential evolution optimization (FADO) technique. FADO self-consistently fits both stellar and nebular emissions in galaxy spectra. The results show that the median H α flux from FADO fitting differs from that of qsofitmore by approximately 0.028 dex. Considering the stellar mass effect, we found that although the nebular emission contribution (Nebular Ratio hereafter) is minimal, it increases modestly with redshift. We advocate explicitly accounting for nebular emission in the spectral fitting of higher-redshift galaxies, as its inclusion is essential to obtaining higher precision in future analyses.

1. Introduction

The star formation rate (SFR), particularly the instantaneous SFR (SFR(t)), is a fundamental tracer of galactic star formation activity, evolutionary history, and chemical enrichment [1]. Combining SFR measurements with simulations of galaxy evolution helps to identify the dominant physical processes that drive galaxy growth. These processes include quenching, gas accretion, star formation, and feedback from supernovae and active galactic nuclei (AGN) [2,3]. Measuring SFR across cosmic time constrains the contributions of different galaxy populations to the cosmic background radiation, refines cosmological ionization models, and guides searches for Population III (Pop III) stars [4]. To date, extensive efforts have focused on SFR, including environmental variations formation of clusters and massive stars [5,6,7,8], enhanced SFR or black hole growth triggered by galaxy interactions [9,10], SFR corrections relevant to cosmological re-ionization [4,11,12,13], and re-evaluation of star formation within individual molecular clouds and gas relations [14]. Several major surveys underpin studies of star-forming galaxies, including the Sloan Digital Sky Survey (SDSS) [15], Hubble Ultra Deep Field (HUDF) [16], and Atacama Large Millimeter Array (ALMA) [17].
Mainstream methods for SFR estimation typically begin with spectral fitting of galaxy spectra. This involves representing each spectrum as a linear combination of stellar population templates, using stellar-only models as the primary fitting basis (e.g., STARLIGHT [18], pPXF [19]). Historically, many analyses of SDSS galaxy spectra have omitted explicit modeling of nebular gas, thereby neglecting nebular emission [20,21]. The limitation of these stellar models lies in their inability to solve different processes of gas emission within galaxies, as they incorporate assumptions that combine stellar mass, gas mass, and dust mass within a single framework. Studies by Krueger et al. [22] and Salim et al. [23] indicate that vigorous star forming activities can lead to the nebular continuum contributing approximately 30–70% to optical and near-infrared emissions, and that nebular emission in star-forming regions can account for about 60% of the total emissions [2,24]. Pacifici et al. [25] demonstrated that neglecting nebular emission in spectral modeling can overestimate SFR by approximately 0.12 dex. Ignoring the nebular continuum also biases fits toward larger stellar masses and shallower ultraviolet slopes [26]. Galaxy evolution is driven by star formation, gas accretion, interactions/collisions, and mergers [27]. FADO is an independent and self-consistent spectral fitting tool that simultaneously models stellar and nebular components, dynamically decomposing their contributions across the full galaxy spectrum [28]. Therefore, we employ FADO to explicitly model nebular emission in this work.
Nebular emission arises from ionized gas in galaxies, primarily excited by ultraviolet ionizing photons from young massive stars. It comprises the nebular line emission and nebular continuum, including free–free, free–bound, and two-photon processes [28]. The nebular continuum modifies the overall spectral shape because it is generally flatter than the stellar continuum. If the nebular continuum is ignored during spectral fitting, it may be misattributed to the stellar component. This misattribution can overestimate the stellar luminosity contribution and bias the derived stellar mass and age [29,30]. Moreover, the nebular continuum dilutes stellar absorption features, making them appear weaker than their intrinsic strengths [29].
In this work, we select spectra of actively star-forming galaxies at low redshift ( z < 0.4 ) from SDSS-DR18. We fit these spectra with FADO, which simultaneously models stellar and nebular components, and with qsofitmore, which employs stellar population templates with fixed nebular emissions. The aim is to test whether, at z < 0.4 , star-forming galaxies (SFGs) require self-consistent modeling of nebular emission rather than treating it as fixed. This allows us to assess how different treatments affect SFR estimates and preliminarily examine impacts on other derived properties. H α and H β are widely used recombination-line tracers of SFR [31]. For z > 0.5 , the [O II] λ 3728 line is often used as an SFR indicator out to z < 1.4 [32]. For z < 0.5 , SFR is commonly traced by H α [33], as well as by [O II] λ 3728 [32] at intermediate redshifts; at higher redshifts, [O III] λ 5007 can also serve as an SFR diagnostic [34].
Several recent studies have demonstrated the robust performance of FADO in spectral fitting and emission line measurement. Breda et al. [30] used simulated data to compare FADO with STARLIGHT, finding that STARLIGHT overestimates the mass-weighted and light-weighted mean stellar ages as well as the metallicity. These results indicate that FADO recovers stellar mass, age, and mean metallicity with accuracy of ∼0.2 dex. Furthermore, Cardoso et al. [29] showed that for galaxies with EW ( H α ) > 3 Å , galaxy-integrated stellar mass and metallicity can differ by up to ∼0.06 dex. Most recently, Miranda et al. [20] compared SFRs for the MPA–JHU sample derived with both FADO and STARLIGHT, reporting a difference of 0.01 dex in H α flux between the methods. They also argued that nebular emission is crucial for star-formation activity and impacts SFR estimates, particularly at high redshift. Additionally, Izotov et al. [26] showed that neglecting the nebular continuum biases fits toward larger stellar masses and shallower ultraviolet slopes.
This work compares the spectral fits of qsofitmore and FADO in order to explore the possible impacts of their different treatment of nebular emission on the resulting SFR estimation. In addition, we explore the relationship between nebular emission and other galaxy properties. Section 2 outlines the criteria for selecting sources in galaxy spectroscopic analysis and the process of spectral fitting employed in this work. In Section 3, we present our statistical analysis of the selected sample and the main findings. Section 4 discusses the limitations of fitting techniques and samples with respect to the spectral data used in this work. Finally, Section 5 summarizes this preliminary research. Throughout the paper, we assume a standard cosmological model with Hubble constant H 0 = 72 km s−1 Mpc−1, matter density Ω M = 0.3, and cosmological constant Ω Λ = 0.7.

2. Sample Selection and Spectral Fitting

The galaxy sample and its spectra used in this work are selected from the Sloan Digital Sky Survey Data Release 18 (SDSS-DR18) [35]. SDSS-DR18 integrates data from the previous seventeen releases and includes new observations and pipeline improvements. The galaxy sample was obtained by SQL query, and the corresponding spectroscopic data were retrieved from the SDSS Science Archive Server (SAS) (https://dr18.sdss.org/optical/spectrum/search) (accessed on 6 October 2024).

2.1. SQL Query

To guarantee the subsequent spectral fitting, it is necessary to select spectra with sufficient signal-to-noise ratio (S/N). Because FADO performs reliably for spectra with median S/N> 5 [36], the SQL query was adopted to select high S/N spectra. The query obtained 91,252 spectra with 5 < S/N < 20 for 0 < z < 0.2 galaxies and 6604 with S/N > 5 for 0.2 < z < 0.4 galaxies. Additionally, we required S/N> 5 for the principal emission lines in each spectrum. The following conditions were added to the query in order to ensure the reliability of the redshift measurements: zwarning = 0, veldisperr > 0, veldisp > 3 * veldisperr, and 80 < veldisp < 350 (see Appendix A for detailed SQL query).

2.2. BPT Selection

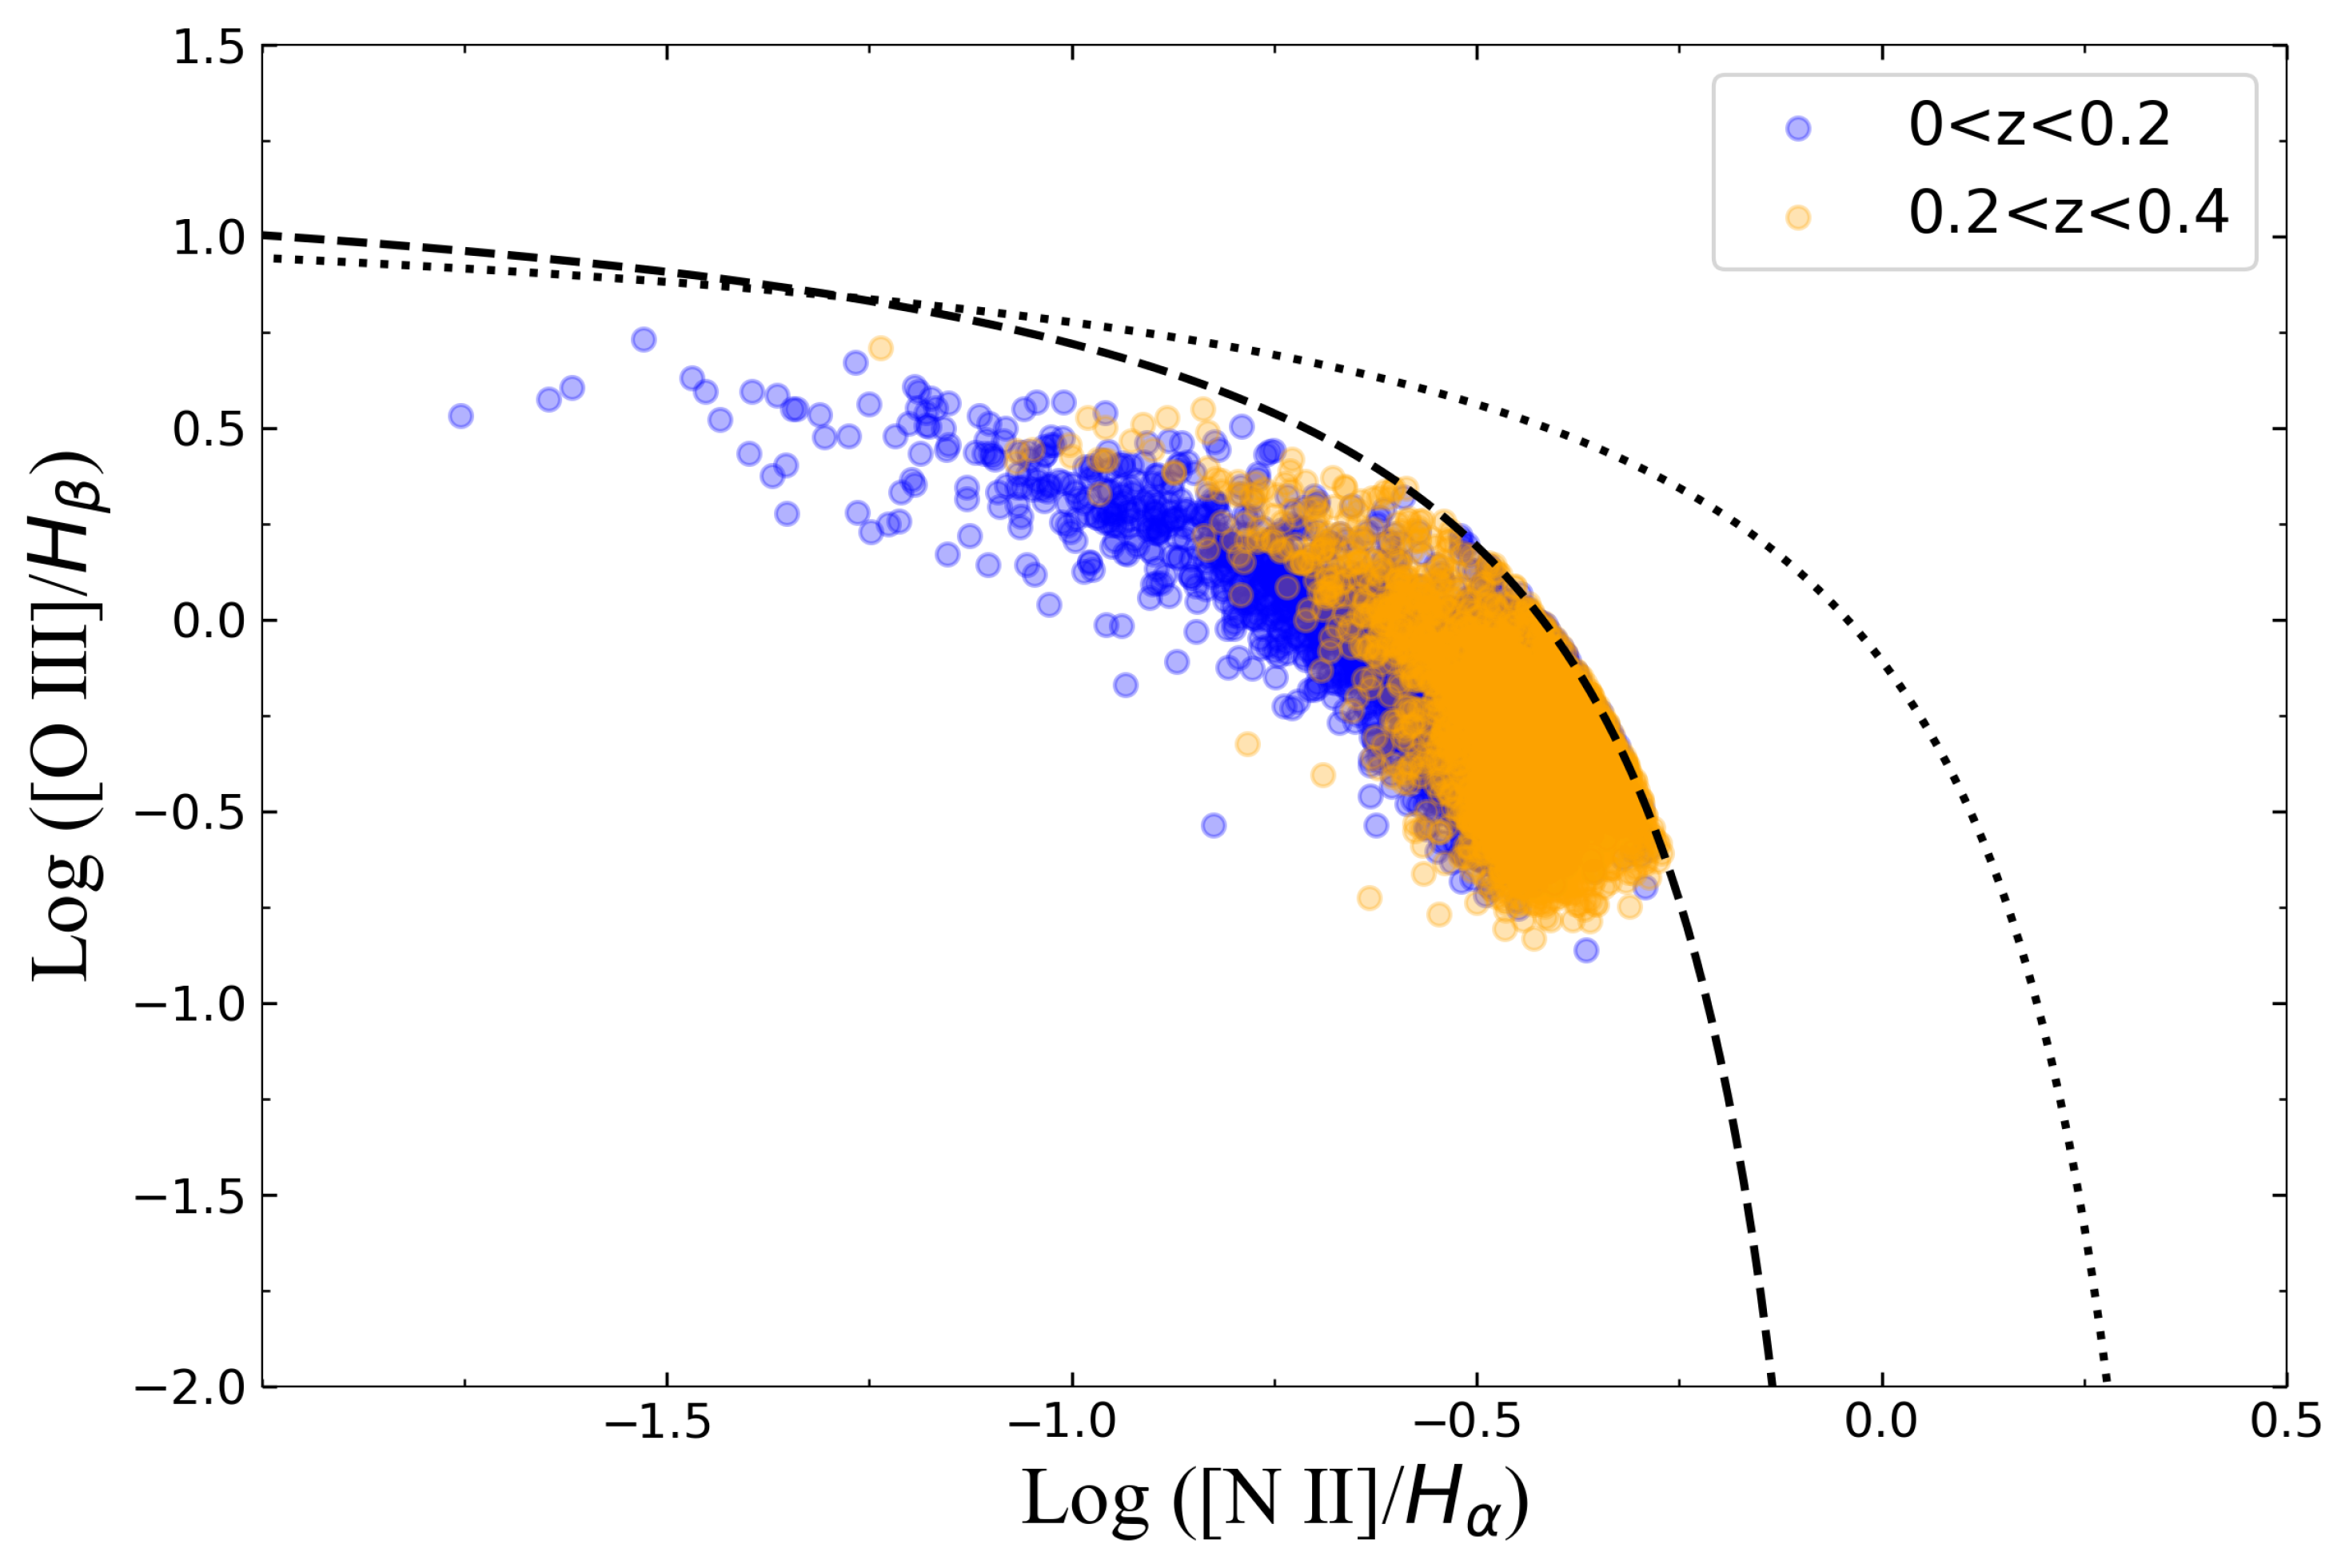
After SQL selection, the BPT diagram [37] was adopted to identify SFGs in the sample. The BPT diagram employs the line ratios [N II] λ 6583/ H α and [O III] λ 5007/ H β . Two empirical boundaries divide the diagram into three regions: star-forming, composite, and AGN. In Figure 1, the dashed boundary Equation (1) is derived from Kewley et al. [38], while the dotted one Equation (2) is derived from Kauffmann et al. [39]. Galaxies in the star-forming region were selected as SFGs (blue points in Figure 1).
log [ O III ] λ 5007 H β = 0.61 log [ N II ] λ 6538 / H α 0.47 + 1.19 ,
log [ O III ] λ 5007 H β > 0.61 log ( [ N II ] λ 6538 / H α ) 0.05 + 1.3 .
A total of 21,455 galaxies were classified as SFGs, comprising 18,176 galaxies with 0 < z < 0.2 (lower-redshift sample) and 3279 galaxies with 0.2 < z < 0.4 (higher-redshift sample). To avoid sample size bias, we randomly selected 3279 low-redshift galaxies to match the higher-redshift sample size. Ultimately, we fit 6558 galaxies with qsofitmore and FADO to derive accurate emission line fluxes. Figure 2 shows the redshift distributions of the two subsamples.

2.3. qsofitmore vs. FADO

qsofitmore is a Python module for fitting and analyzing quasar and galaxy spectra [40]. The module has demonstrated good performance in spectral fitting and analysis, and has become increasingly popular in quasar and galaxy spectroscopic studies [41,42,43,44]. qsofitmore estimates component uncertainties via Monte Carlo (MC) resampling. It uses principal component analysis (PCA)-derived host galaxy templates from large observational samples (e.g., SDSS) to model the host galaxy continuum. These templates contain a fixed average level of nebular emission from the training sample, as described in Section 5 of Yip et al. [45]. For a detailed description of the fitting, refer to [46,47,48].
FADO is a self-consistent spectral fitting tool that dynamically estimates galaxy spectral parameters. It infers nebular contributions from emission line luminosities. FADO operates in Full-Consistency (FC), Nebular-Continuum (NC), and STellar (ST) modes [28]. The main difference between FADO and qsofitmore is whether nebular emission is modeled self-consistently. FADO self-consistently models nebular emission based on the Lyman-continuum photon output of the stellar populations and the inferred physical conditions (e.g., electron temperature, electron density, metallicity of the ionized gas) rather than fixing nebular emission at a constant level. In this work, we adopted base template spectra from the BC03 model for both qsofitmore and FADO [49]. In addition, both were used to perform extinction correction, rest framing (de-redshifting), and K-correction given the sky coordinates and redshifts. These settings ensure the comparability of the spectral fits. A comparison of spectral fitting by qsofitmore and FADO for the same galaxy is shown in Appendix B.
In general, the differences between qsofitmore and FADO can be summarized in terms of the following three aspects:
(i):
Spectral Fitting Models: FADO employs population spectral synthesis (PSS) to decompose a galaxy spectrum into a linear combination of single stellar population (SSP) templates of different ages and metallicities, thereby inferring the fractional contributions of stellar populations. Additionally, FADO implements physically self-consistent coupling between stellar and nebular emission; it computes nebular continuum and Balmer emission line intensities based on the Lyman continuum (LyC) photon output from the fitted stellar populations and simultaneously fits these components with the observed spectrum. In contrast, qsofitmore performs linear fitting with PCA-based host galaxy templates [41]. These eigenspectra are derived from large observational samples, and implicitly include an average level of nebular emission inherited from the training set; however, they do not distinguish between the stellar and nebular continua of the target galaxy or adapt the nebular component to the specific physical conditions of the target. For emission line fitting, qsofitmore employs high-order Balmer series and complex Fe ii templates.
(ii):
Fitting Algorithms: FADO uses a differential evolution optimization (DEO) algorithm, which is a population-based evolutionary method that employs mutation, crossover, and selection operators to iteratively approach a global optimum. This approach enables multi-objective fitting, allowing several objectives to be optimized simultaneously and promoting physically meaningful solutions. Conversely, qsofitmore performs linear combination fitting using predefined spectral templates (SSPs, emission lines, and Fe ii complexes), minimizing the residuals via least-squares or similar linear optimization techniques.
(iii):
Treatment of Nebular Emissions: FADO implements self-consistent modeling of both the nebular continuum and Balmer emission lines, ensuring consistency between the nebular emission and the properties of the underlying stellar populations. On the other hand, qsofitmore does not compute nebular emission in a self-consistent manner. Instead, it employs PCA-derived galaxy templates in which the nebular emission is fixed at an invariant average level, which does not reflect the actual nebular emission of the target galaxy [40,41,45].
Many studies have compared results from FADO and STARLIGHT, consistently reporting minor differences [20,29,30]. In this work, our comparison between FADO and qsofitmore for low-redshift SFGs tests whether a self-consistent treatment of nebular emission is necessary and whether spectral fits that include nebular emission self-consistently differ from those that treat it as fixed. For details of the two spectral fitting packages, see [28,40].

2.4. Spectral Fitting

Following the comparison above, we performed spectral fitting of the 6558 galaxies identified in Section 2.1 using qsofitmore and FADO. In order to consider intrinsic extinction correction, both methods must return physically meaningful H α and H β fluxes along with their uncertainties. Accordingly, qsofitmore successfully fit 6546 galaxies and FADO fit 6523. Finally, 6511 galaxies were retained for which the spectra were successfully fit by both FADO and qsofitmore. However, the 6511 successfully fitted galaxies do not meet the requirements of this work due to the number of sources per redshift bin being inconsistent, with a sharp decrease at 0.3 < z < 0.4 . This interval lies beyond the median redshift of the SDSS survey (around 0.1 ) [50], leading to a noticeable drop in the sample counts. In addition, H α approaches the upper wavelength limit of SDSS at z 0.4 , which can prevent a reliable fit. Therefore, we imposed additional sample restrictions.
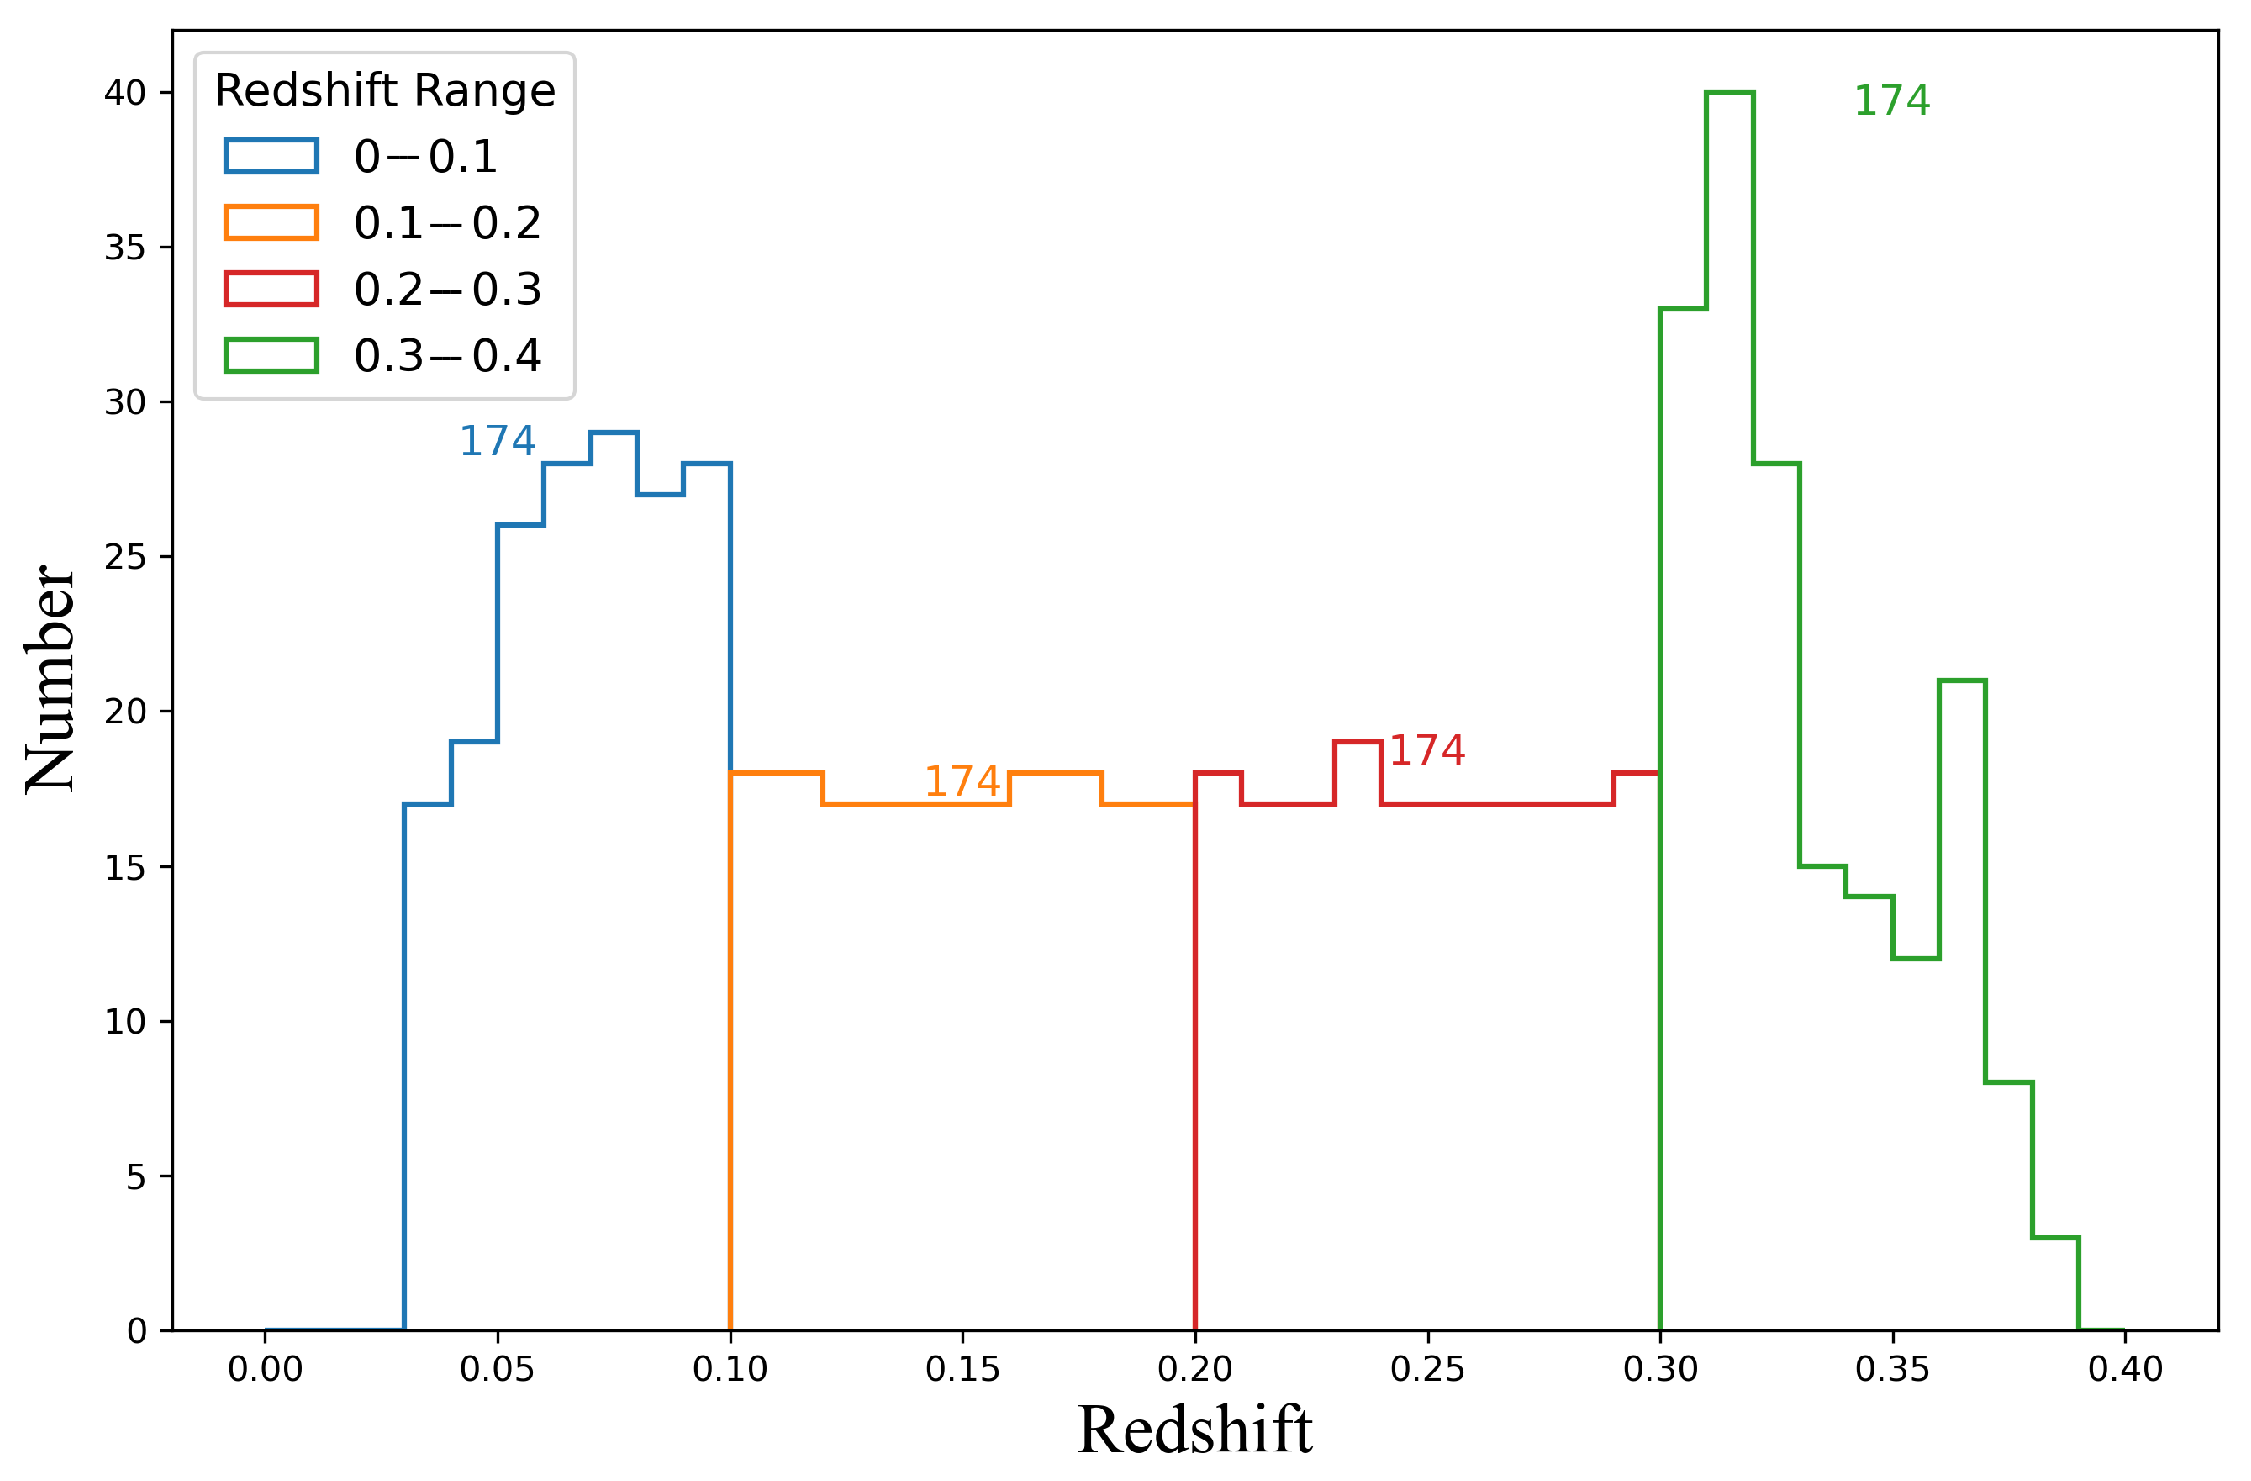
To place the sample within the typical stellar mass range for SFGs, we restricted the SFG stellar mass ( M ) to 10 9 M 10 11 M . This range spans intermediate-mass high-specific star formation rate (sSFR) systems. Stellar masses were derived from the FADO spectral fits. This restriction enables systematic assessment of how nebular emission affects inferred galaxy properties while mitigating biases from extreme or peculiar systems [51]. Furthermore, random sampling was applied to ensure the consistency of the samples within each redshift bin size. We set a redshift bin width of 0.01 to ensure near-equal counts per bin. Finally, all samples were selected via SQL queries and BPT diagrams before fitting with FADO and qsofitmore, ensuring a redshift range of 0 < z < 0.4 and 10 9 M 10 11 M . Ultimately, we selected 696 high-quality samples (referred to hereafter as the Golden Sample), the redshifts and number count distributions of which are displayed in Figure 3. The absence of samples at 0 z < 0.02 results from the lower mass threshold at 10 9 M , as discussed in Section 4.

2.5. Intrinsic Extinction Correction

Young massive stars in star-forming regions produce sufficient ionizing photons to ionize hydrogen. This ionized gas captures photons and undergoes recombination transitions, leading to simultaneous emission of H α and H β . However, dust in the interstellar medium attenuates this emission. Because dust attenuation is more efficient at shorter wavelengths, H β is more suppressed than H α , increasing the observed Balmer decrement ( H α / H β ) [52]. The intrinsic Balmer decrement is typically ( H α / H β ) = 2.86 under Case B recombination, which we adopt for intrinsic extinction correction [53,54,55]. In this work, we define intrinsic extinction as the dust attenuation internal to the galaxy, estimated from the deviation of the observed H α / H β from its intrinsic value. Therefore, the intrinsic extinction of Golden Sample H α was corrected using the Balmer decrement ( H α / H β ) .

3. Analysis and Results

This section compares the H α flux of Golden Sample fitted by qsofitmore and FADO to assess their mutual consistency. We calculate the nebular contribution in the H α wavelength to examine its redshift dependence. In addition, this section examines the influence of stellar mass and SFR on the nebular contribution to disentangle stellar mass and SFR-related effects.

3.1. Comparison of H α Flux

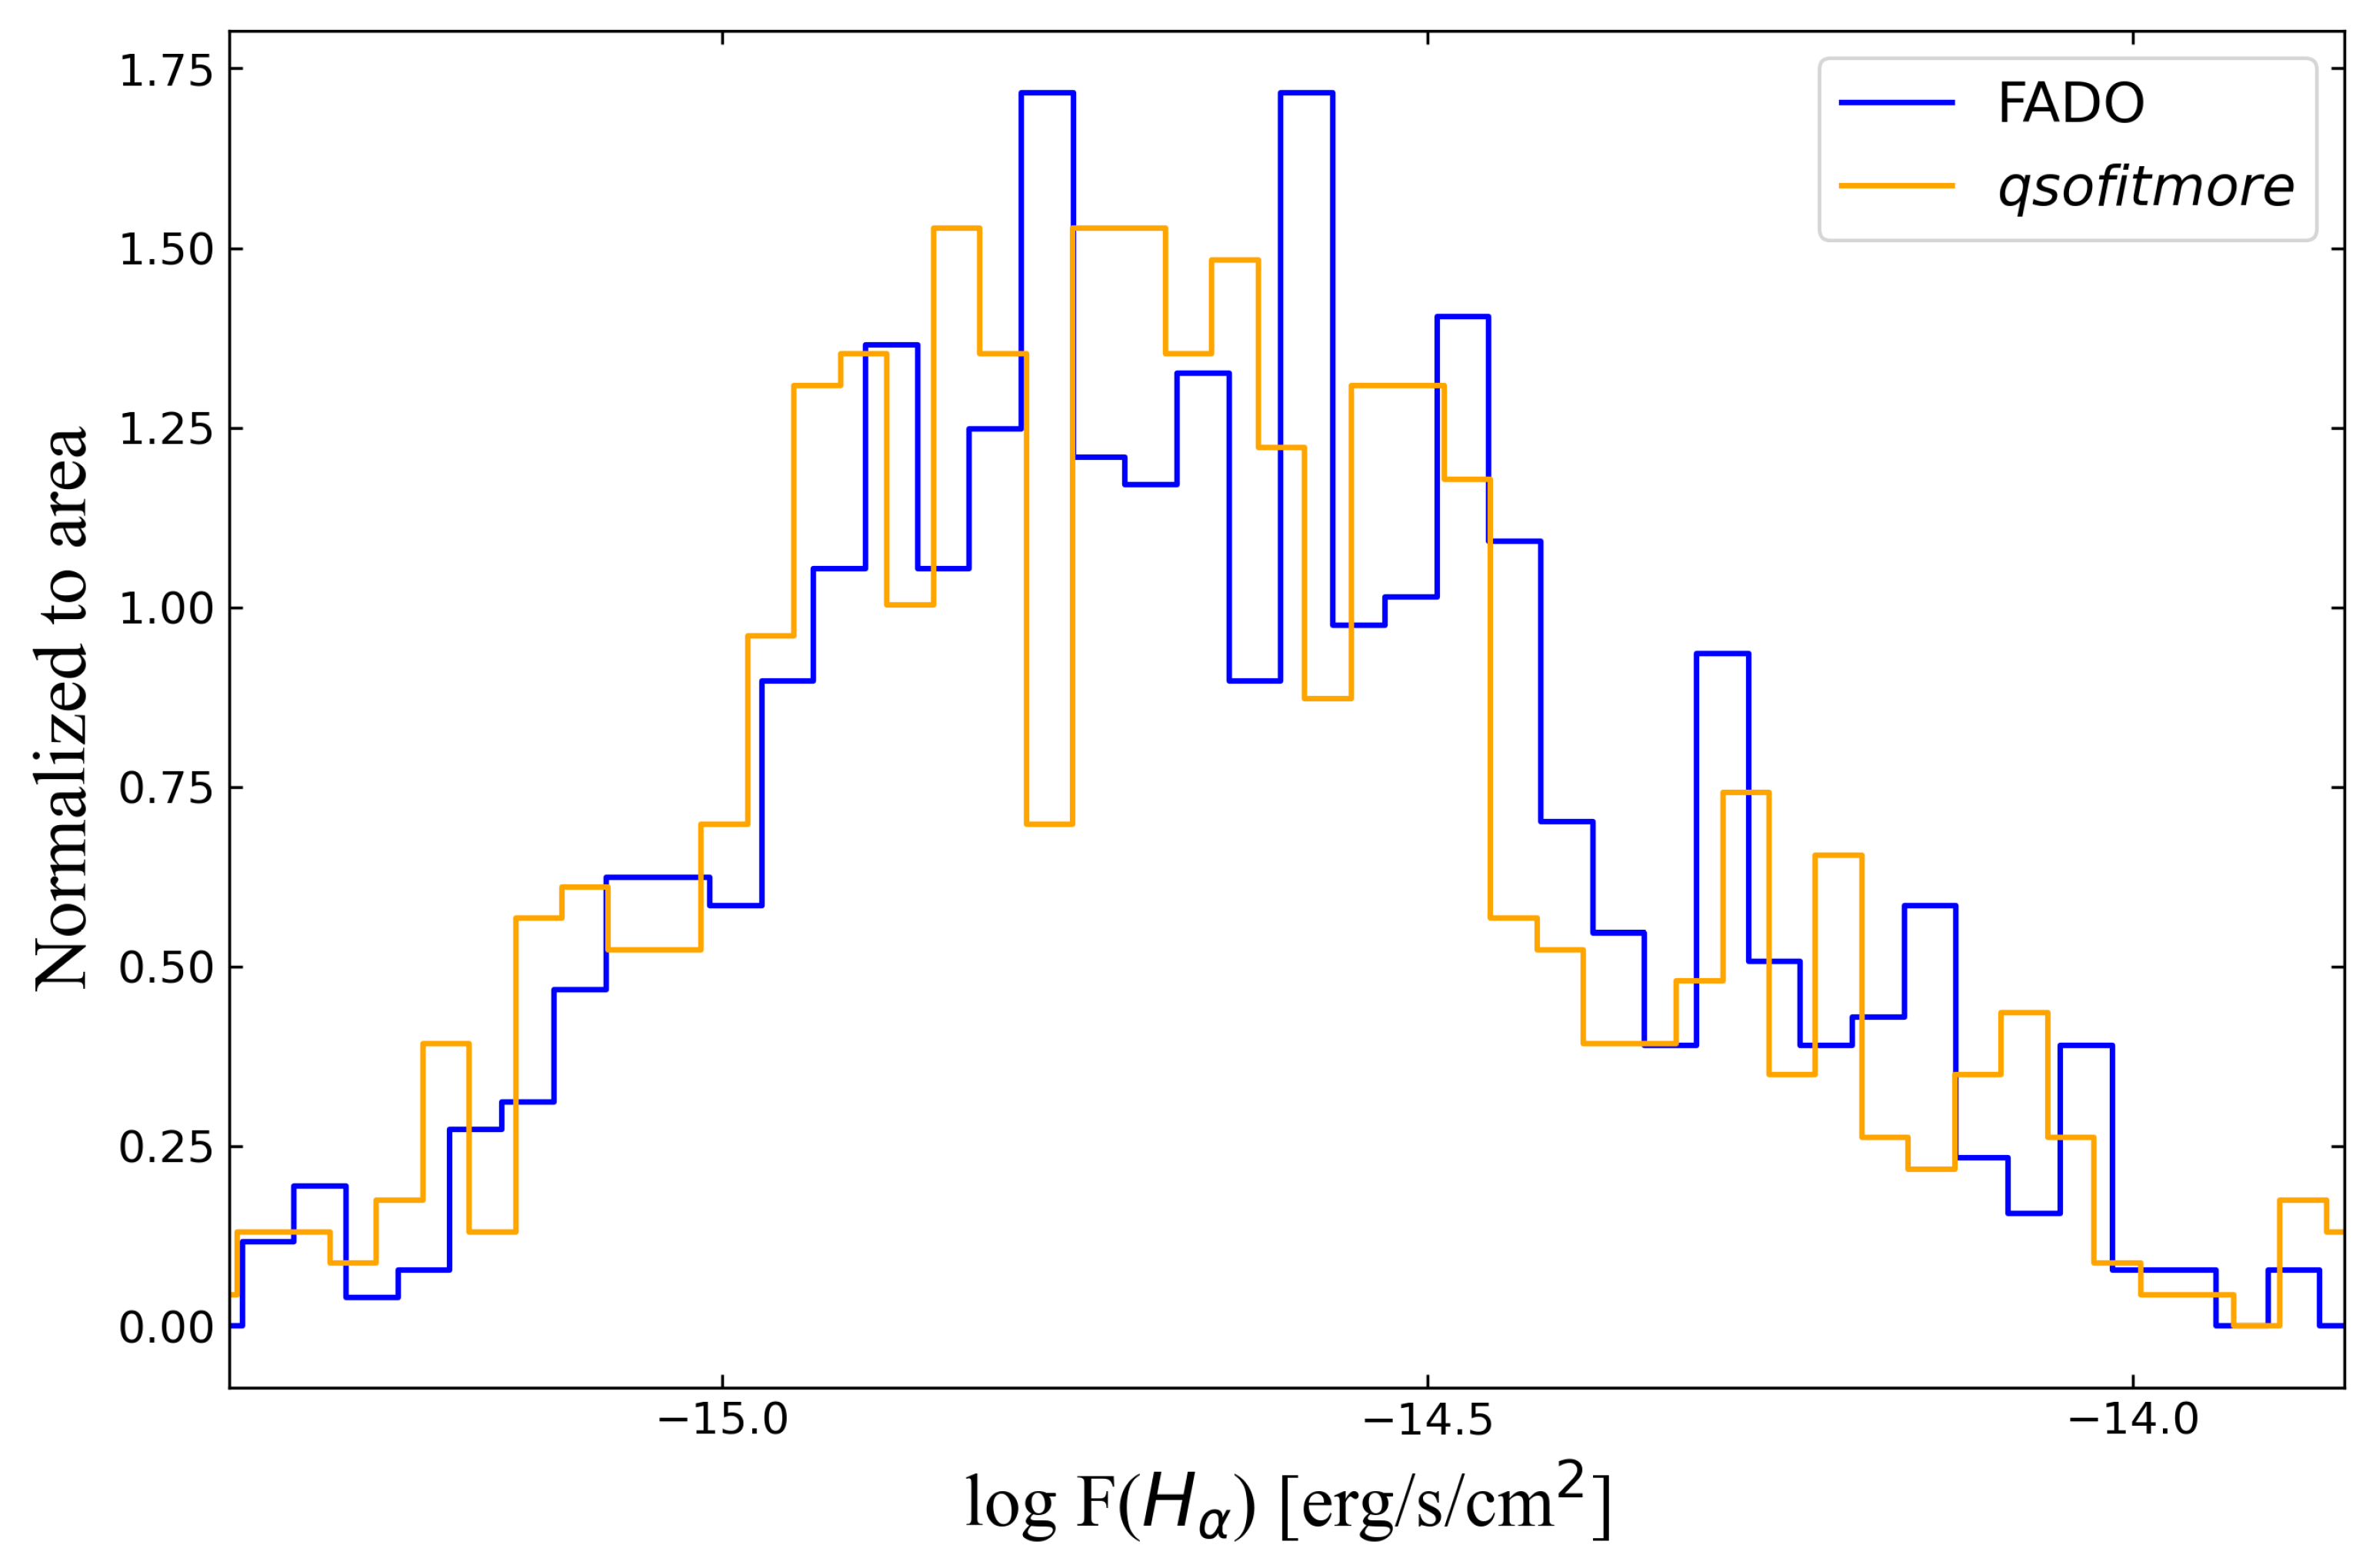
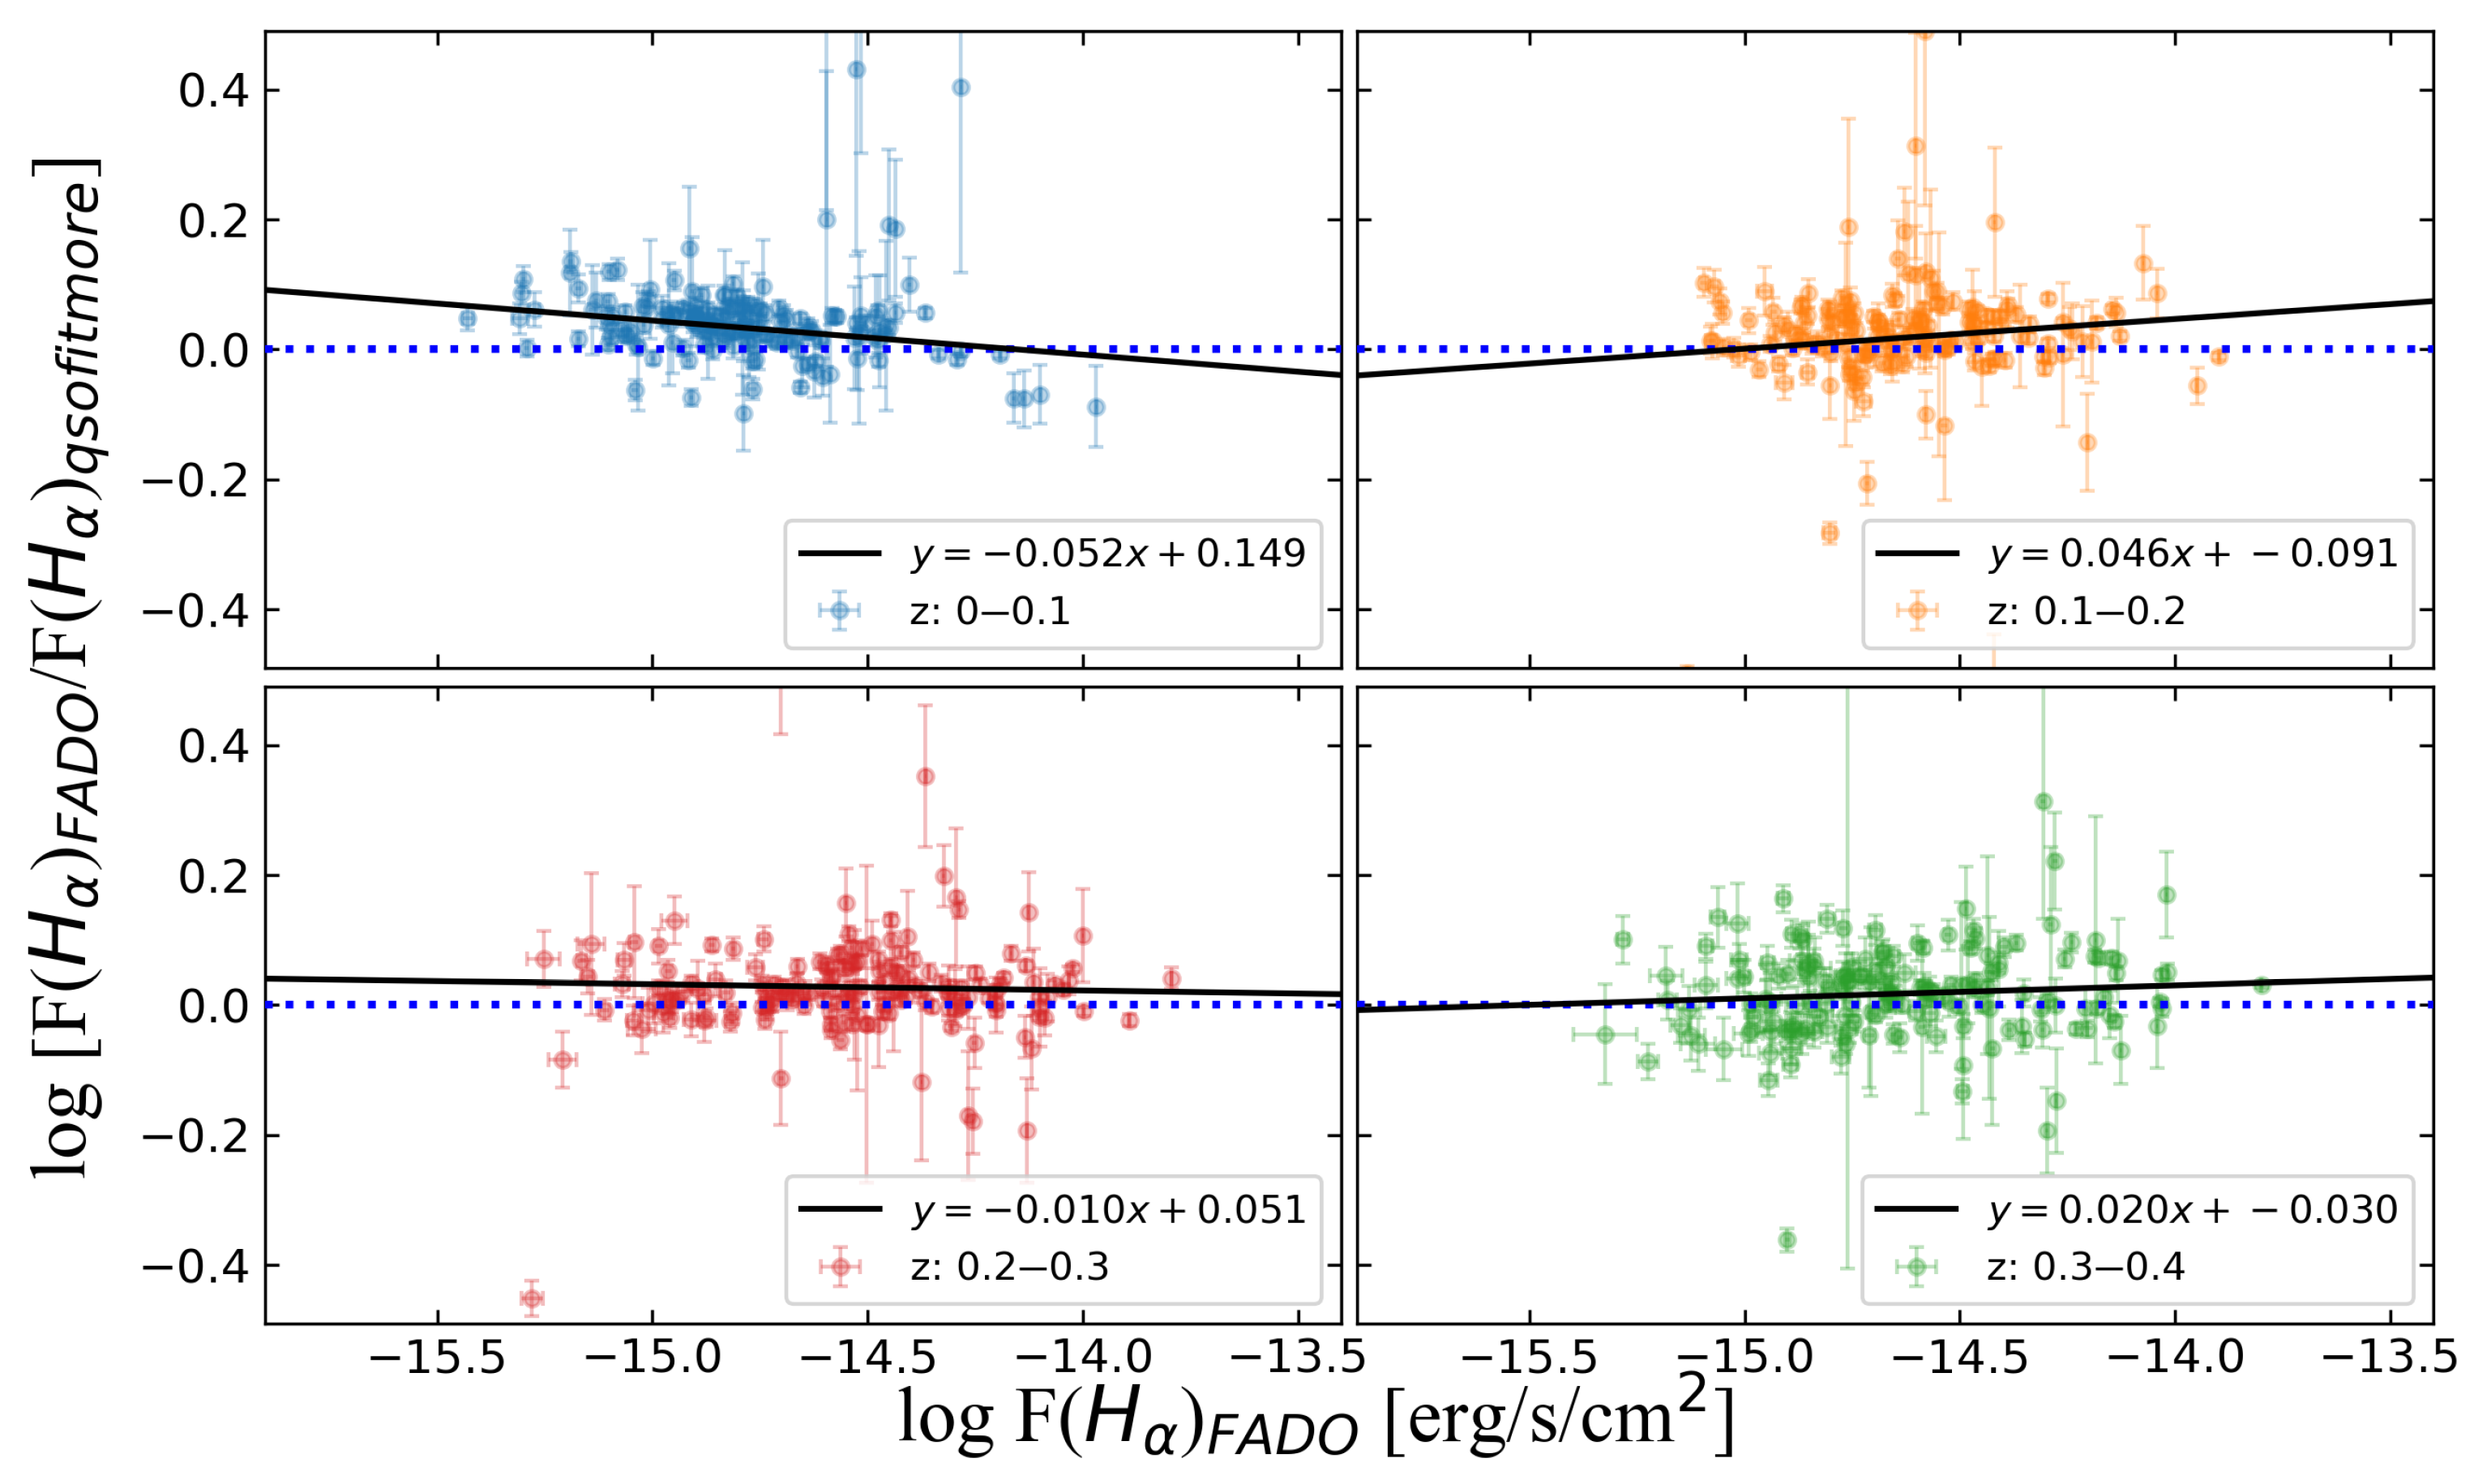
As shown in Figure 4, the H α flux from FADO is statistically similar to that from qsofitmore. A Kolmogorov–Smirnov (KS) test was performed on the qsofitmore- and FADO-fitted H α fluxes to test for distributional equivalence. The KS statistic is 0.059 and the p-value is 0.179, suggesting statistical uniformity between the two fitted H α subsets. Furthermore, we binned the fluxes by redshift with a bin width of 0.1 in order to test for redshift-dependent offsets between the two fittings. The results in Figure 5 indicate no clear redshift dependent differences in H α up to z 0.4 and stellar mass in 10 9 10 11 M . Generally, the H α fluxes fitted by qsofitmore and FADO do not exhibit noticeable differences. The median difference is 0.028 dex 6.68 % .
For SFGs with stellar mass 10 9 10 11 M at z < 0.4 , these results suggest that H α fluxes are only weakly sensitive to whether nebular emission is modeled self-consistently or approximated by an average level. However, this does not preclude larger impacts on other diagnostics (e.g., continuum, age, metallicities).

3.2. Nebular Ratio and Other Physical Parameters

We extracted the fitted nebular spectra from the FADO results to further analyze and quantify the nebular contribution. All the parameters provided by FADO are detailed in Appendix Figure A2. Despite known limitations (e.g., dust attenuation and redshift), the H α flux remains a widely used SFR tracer for nearby galaxies and is the primary diagnostic in this analysis. Equation (3) defines the nebular ratio, while the SFRs of the Golden Sample were calculated with Equations (4) and (5):
Nebular Ratio = F Nebular F Nebular + F Stellar × 100 %
L ( H α ) = F ( H α ) × 4 π d L 2
SFR = L ( H α ) η ( H α )
where F Nebular is the nebular model flux, F Stellar is the stellar model flux, F Nebular + F Stellar = F Total , d L is the luminosity distance, F ( H α ) is the best fitted flux of extinction-corrected H α , L ( H α ) is the luminosity of H α , and η ( H α ) is the multiplication factor provided by Miranda et al. [20]. We adopted η ( H α ) = 10 41.28 erg s 1 M 1 yr in this work, which is calibrated to the IMF of Chabrier [56].
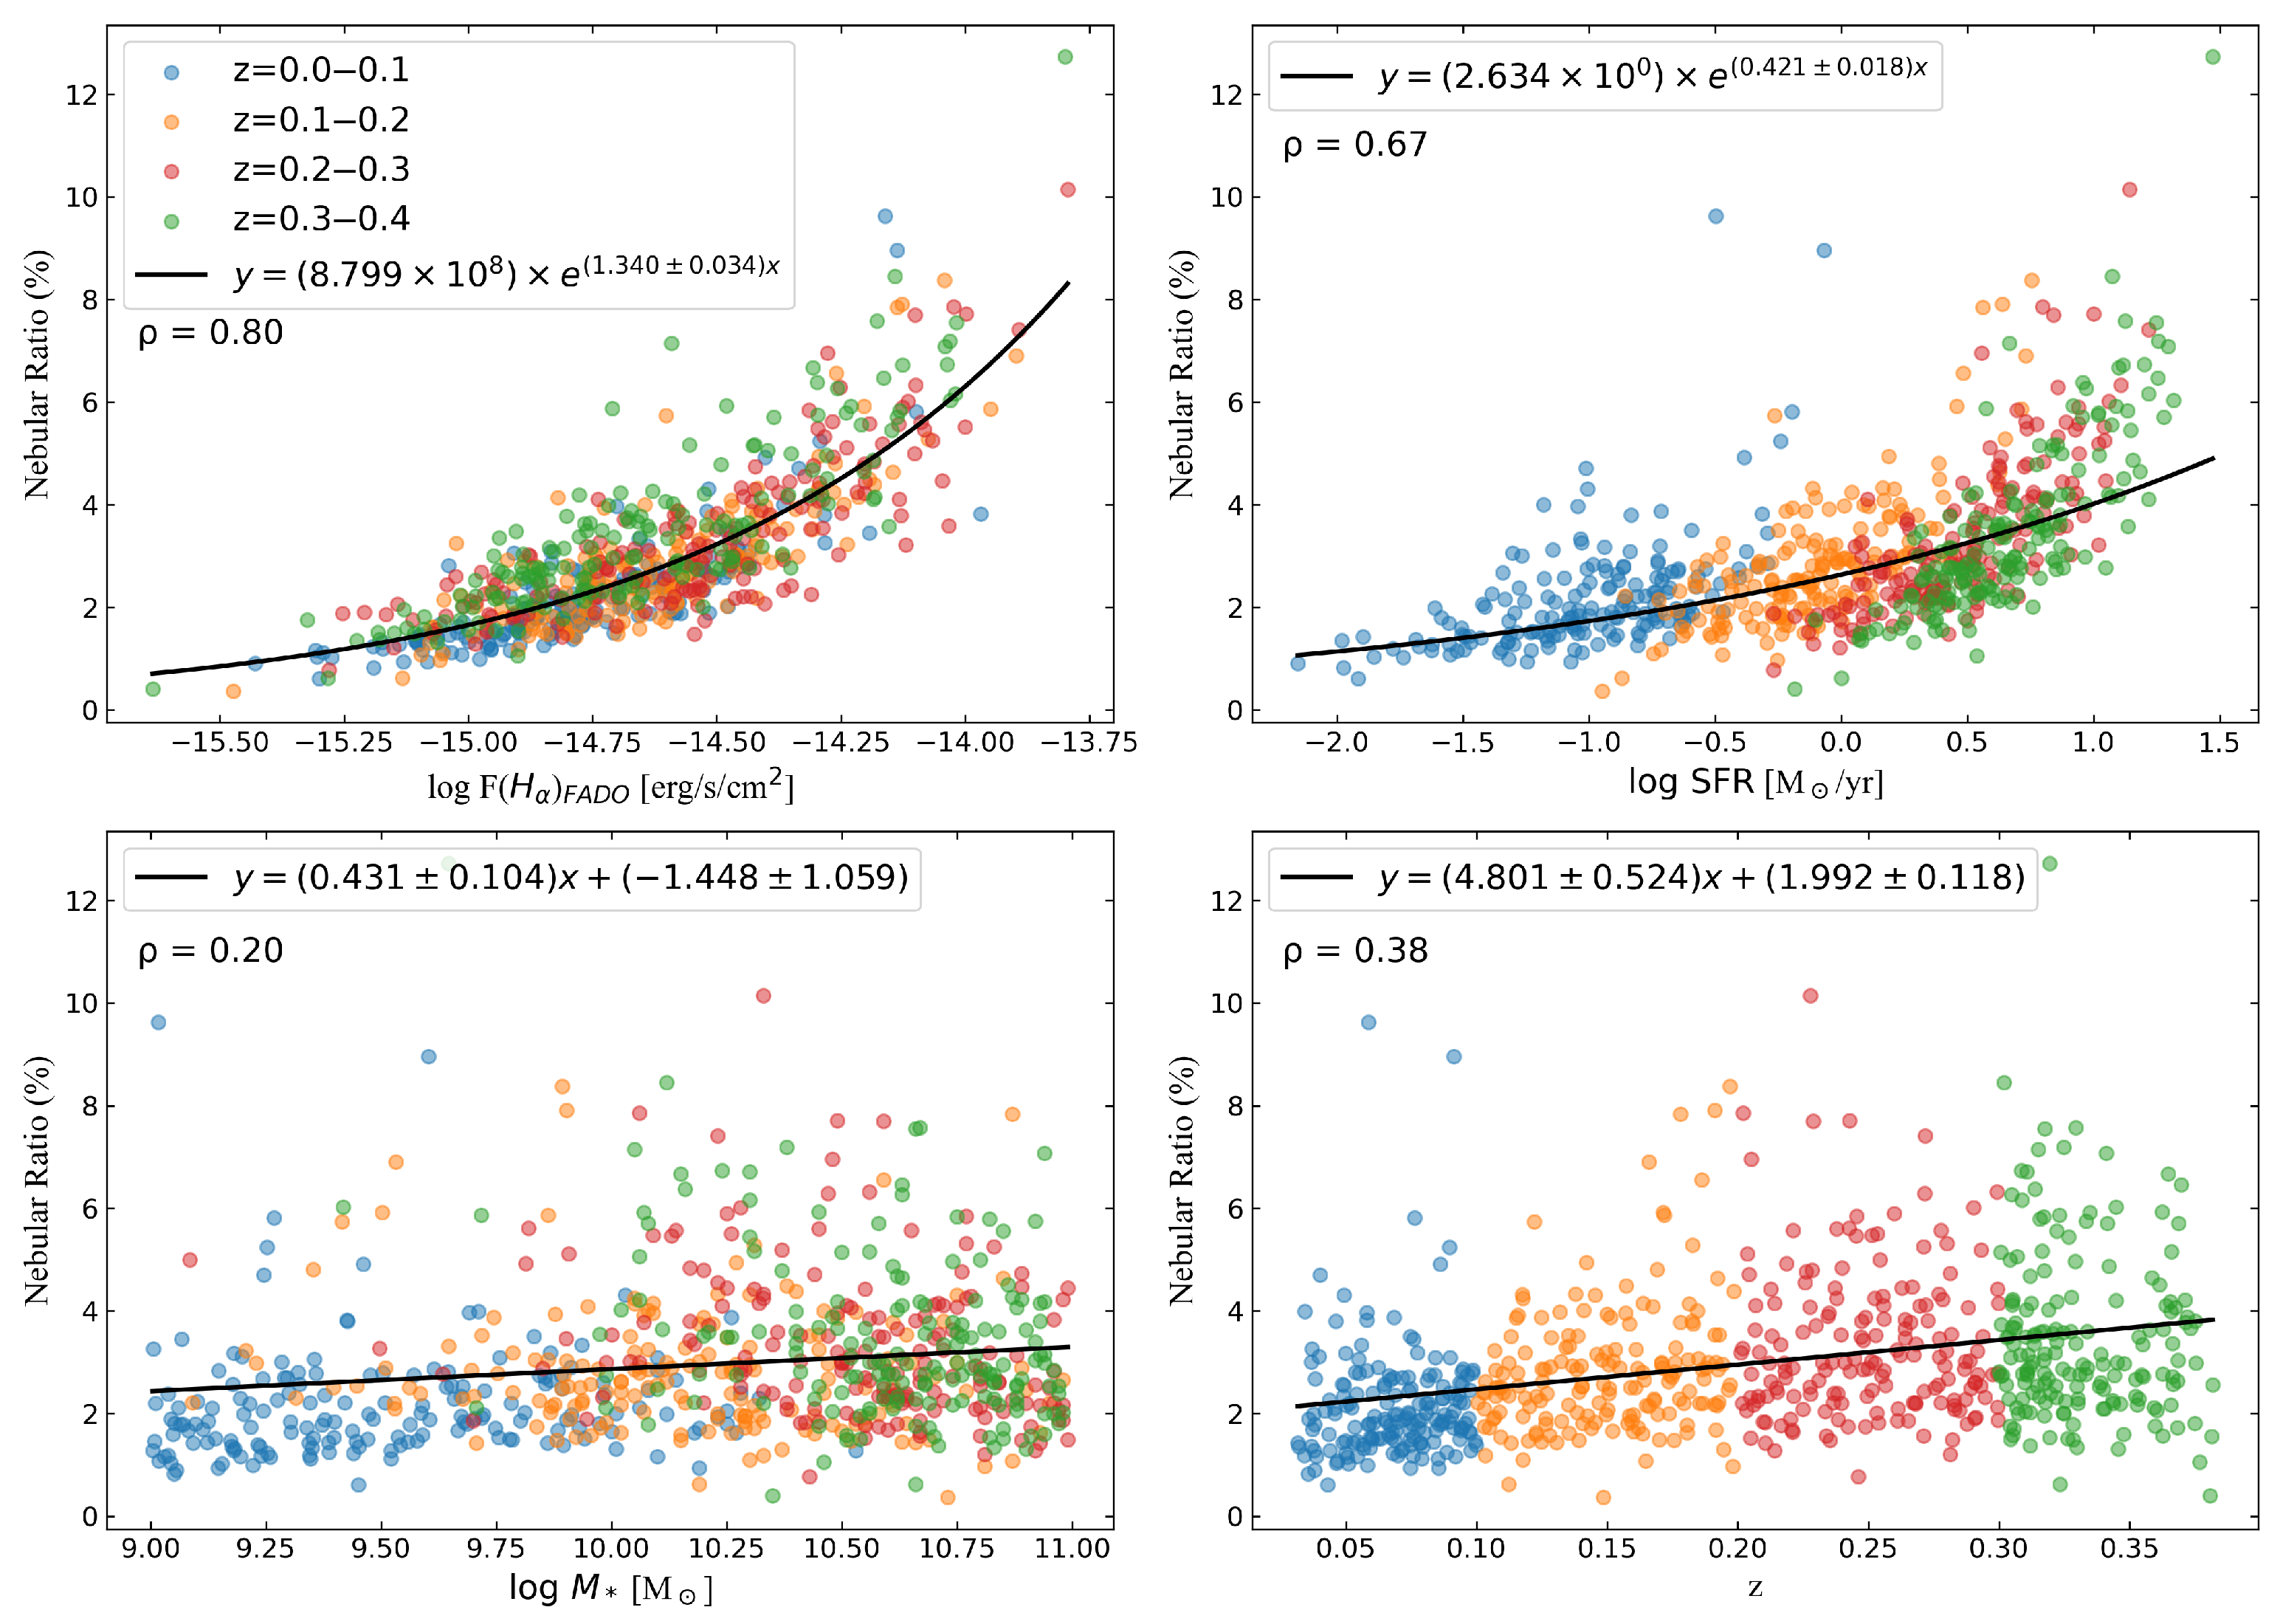
Figure 6 displays the nebular ratio (from FADO) across other parameters, which include the FADO-fitted H α flux, extinction-corrected SFR, stellar mass derived from FADO, and galaxy redshift. The corresponding Spearman’s rank correlation coefficient ( ρ ) is marked in each panel. Here, ρ > 0 , ρ < 0 , and ρ 0 indicate positive, negative, and no significant monotonic association, respectively. As shown in Figure 6, the nebular ratio is strongly correlated with H α , which is consistent with Miranda et al. [51]. The SFR derived from H α also exhibits a significant positive correlation with the nebular ratio, as expected given their shared H α dependence. Despite a substantial sample, the nebular ratio shows a weak but monotonic increase, with increasing stellar mass and redshift overall. In addition, the relationship between the two parameters (black solid line) in each panel was fitted and the uncertainty in each analytic function was estimated from the covariance matrix. The fitted relationships are listed as follows:
Nebular Ratio = 8.799 × 10 8 × e ( 1.340 ± 0.034 ) × log F ( H α ) FADO ( top left )
Nebular Ratio = 2.634 × e ( 0.421 ± 0.018 ) × log SFR ( top right )
Nebular Ratio = ( 0.431 ± 0.104 ) log M * ( 1.448 ± 1.059 ) ( bottom left )
Nebular Ratio = ( 4.801 ± 0.524 ) z + ( 1.992 ± 0.118 ) ( bottom right )
where F ( H α ) FADO is the H α flux fitted by FADO, SFR is calculated by Equation (5), M * is the stellar mass derived from FADO, and z is galaxy redshift.
Equation (6) reveals an exponential growth relationship. This trend is consistent with H α tracing nebular emission from gas ionized by ultraviolet photons from young massive stars in star-forming regions [33]. Accordingly, larger H α fluxes generally imply stronger nebular emission, yielding an expected strong correlation with the nebular ratio. Equation (7) shows a strong correlation between nebular ratio and SFR; because SFR is F ( H α ) -based, part of this trend reflects their shared dependence on H α . Galaxies with higher SFR tend to exhibit larger nebular contributions, and consequently larger nebular ratios. Equation (8) shows a weak dependence of the nebular ratio on stellar mass. This is consistent with massive galaxies having lower cold gas fractions and smaller proportions of young stars [57]. This result aligns with the “downsizing” proposed by Mannucci et al. [58], where more massive galaxies exhibit fewer SFRs and higher gas metallicity. Moreover, the large diffusion and small ρ indicate that within 10 9 10 11 M , stellar mass is not an ideal predictor of the nebular ratio. Nevertheless, we report the fitted relation in Equation (8), noting that verification with broader mass coverage is required. Equation (9) shows a moderate positive correlation between the nebular ratio and redshift; because higher redshift corresponds to earlier cosmic times with higher sSFRs and gas fractions, such an increase is plausible within z < 0.4 . This trend is consistent with the broader picture in which star formation activity peaks at z∼2 [59]. This result is preliminarily consistent with the expectation put forward in Miranda et al. [20].

3.3. Redshift vs. Nebular Ratio

Figure 7 quantifies the dependence of the median nebular ratio on redshift for the SFG Golden Sample. We divide the sample into four redshift bins and compute the median nebular ratio in each bin; these medians serve as the summary statistics. Yellow points represent median nebular ratio in each redshift bin; a cubic polynomial provided the lowest chi-square and highest R 2 among the tested forms, and is used descriptively. The corresponding analytic expressions are presented in Equation (10).
M e d i a n N e b u l a r R a t i o = 24.5 z 3 + 2.35 z 2 + 7.72 z + 1.123 .
The results in Figure 7 are consistent with Figure 12 in Miranda et al. [51]; the y-axis has been calibrated to match their convention. Unlike their results, which combined theoretical considerations with EW estimates and extended to z 6 , our results are derived from direct spectral fitting of the SFG sample at z < 0.4 . We provide preliminary evidence that the predicted redshift dependence of the nebular ratio agrees with that derived from our data within z < 0.4 . This suggests that the nebular contribution to spectral fitting increases with redshift within our probed range, although higher-z behavior requires more observations.

4. Discussion

This section discusses three main issues which will serve as a foundation for future research in this field. First, we compare our results with Miranda et al. [20] to explain the differences between our main conclusions and the relevant parts of their work. Second, we examine other factors that could affect SFR estimation. In particular, we discuss how recent findings on the initial mass function (IMF) may affect SFR estimates and their redshift trends. Finally, we discuss some limitations of this work in terms of sample redshift and stellar mass.

4.1. Comparison with Miranda’s Results and Uncertainty

Comparing the results of Miranda et al. [20], they used the MPA-JHU integrated sample and reported a 0.1 dex difference between the H α fluxes from FADO and MPA-JHU, while our results show that the median difference between the H α fluxes fitted by FADO and qsofitmore (with PCA-derived galaxy templates) is 0.028 dex. This indicates that for SFGs at z < 0.4 , the impact of different nebular emission treatments on H α is small. Unlike [20], this work uses SDSS-DR18 galaxy data and applies strict selection via SQL queries and the BPT diagram to ensure a pure SFG sample. Furthermore, our redshift range of 0 < z < 0.4 exceeds the range of 0 < z < 0.3 used in Miranda et al. [20], where data above z 0.25 were sparse. Although many lower-quality spectra at 0.3 < z < 0.4 were excluded during fitting, this interval approaches the upper limit for reliable H α -based SFR in SDSS, as H α exits the spectral range near z 0.4 . Finally, we find a modest monotonic increase of the nebular ratio with redshift, and quantify a relation that is only weakly dependent on stellar mass.

4.2. Other Factors Affecting SFR Estimation

The H α flux obtained by FADO is generally similar to that from qsofitmore, with a median difference of ∼0.028 dex. In FADO’s self-consistent spectral-fitting framework, gas conditions such as electron density, extinction, temperature, and nebular kinematics enter the nebular component, with electron density and temperature often playing leading roles [28]. Therefore, any apparent H α -based SFR underestimation could partially reflect assumed electron densities and temperatures, which we did not independently constrain. Accurate SFR estimates benefit from multi-band observations, as UV, optical, and IR emission arise in different regions and are differentially obscured by dust [60]. AGN can influence host galaxy star formation via feedback. Gas in the host disk can interact with AGN-driven outflows, potentially suppressing or enhancing the overall SFR. Finally, AGN activity in some starbursts can trigger, enhance, or suppress star formation [60]. Such effects can bias single-band SFR estimates regardless of the chosen band. Thus, robust exploration of SFRs requires multi-wavelength data.
Spectral fitting (e.g., FADO and qsofitmore) typically assumes a fixed IMF, yet Li et al. [61] reported IMF variations with metallicity and redshift. Such variations affect H α luminosities and SFR calibrations [28,62,63]. Although both methods used here adopt the same BC03 IMF [49], ensuring comparability, IMF-dependent calibrations could modulate the observed correlation between the SFR and nebular ratio. We provide preliminary evidence that H α -based SFRs are affected by nebular contamination, with the apparent impact increasing with redshift within z < 0.4 . Accurate SFR measurements require accounting for nebular emission and combining optical, ultraviolet, and infrared data [14,64,65].

4.3. Sample Variation

In this work, all results are based on the conditions 0 z 0.4 and 10 9 M 10 11 M ; therefore our characterization of the nebular ratio applies only within this regime. The apparent lack of sources at z = 0 0.02 , shown in the lower-left panel of Figure 3, primarily reflects our stellar mass selection of 10 9 10 11 M . This sample incompleteness can be attributed to the Malmquist bias [66]. Due to the detection limits of the SDSS survey, progressively more massive (or intrinsically brighter) galaxies dominate at higher redshifts. Consequently, lower-mass galaxies fall below the flux limit at higher redshifts, biasing the sample toward more massive systems. Conversely, at very low redshifts ( z 0.02 ), the survey volume is small, meaning that galaxies with stellar masses exceeding 10 9 M are relatively sparse in our selection. Previous studies have also shown that low-redshift field samples contain many systems with 10 7 10 8 M [67,68,69,70]. Although this selection approach excludes galaxies at very low redshifts ( z < 0.02 ) with extremely low masses and rare very-high-mass systems, the interval 10 9 10 11 M is the most uniformly populated within our sample. Breda et al. [30] investigated the impact of nebular emission on extreme-emission-line galaxies (EELGs) using FADO. However, how the nebular ratio responds in extreme mass systems (e.g., green peas, dwarf ellipticals, and giant ellipticals) remains an open question.
The redshift limitation primarily reflects SDSS sensitivity and wavelength coverage for H α . High-quality H α detections are scare at z = 0.3 0.4 , and leave the SDSS spectral range beyond z 0.4 H α . Moreover, a nebular ratio rising with redshift is consistent with higher specific SFRs and gas fractions at earlier cosmic times. Numerous observations have demonstrated that the equivalent width (EW) of emission lines in galaxies, such as the H α EW, shows a clear increasing trend with redshift, predicting that nebular emission will become a significant spectral component in the redshift interval z 2 6 [51,71,72,73,74]. Miranda et al. [51] further pointed out that low-redshift samples, such as the SDSS main sample with an average redshift of z 0.07 , predominantly contain galaxies with weak nebular emission, leading to insufficient statistics of galaxies with high nebular contributions and thereby limiting our understanding of the nebular ratio’s impact.
In recent years, facilities such as the JWST have greatly expanded studies of high-redshift galaxies, revealing strong nebular contributions and their impact on inferred galaxy properties [75]. Therefore, limited redshift coverage can underestimate the importance of nebular emission in galaxy analyses, especially when studying galaxy evolution in the early universe. Future investigations using other high-quality spectroscopic surveys such as the Large Sky Area Multi-Object Fiber Spectroscopic Telescope Survey (LAMOST) [76] and DESI [77] remain necessary to further explore the nebular ratio. Because H α is inaccessible beyond z > 0.4 , whether other lines (e.g., [O ii], [O iii]) show similar sensitivity to the nebular ratio remains an open question. The effectiveness of FADO for spectra beyond the optical regime also remains to be explored.

5. Conclusions

This work aims to investigate the differences in SFR estimation arising from various spectral fitting packages, with particular emphasis on the combined effects of stellar and nebular emission. To achieve this goal, we have utilized the latest spectroscopic data from the SDSS-DR18 large-scale survey, applying SQL queries and BPT diagrams to select high-quality SFGs within the redshift range z < 0.4 and stellar mass range 10 9 10 11 M . Employing FADO, a spectral fitting tool capable of self-consistently modeling stellar and nebular emission, along with the recent stellar population-based fitting code qsofitmore, we performed spectral analysis and SFR calculations on the selected sample. This comprehensive approach shows a positive correlation between the nebular ratio and redshift within our sample ( z < 0.4 ) and stellar mass range in 10 9 10 11 M . This constitutes a quantitative characterization based on direct spectral fits in this low-redshift regime, and is consistent with prior theoretical expectations. This finding has implications for future SFR studies of higher-redshift galaxies, particularly those with non-negligible nebular contributions such as starburst and actively star-forming galaxies. Based on our results, we summarize the following three key conclusions:
(1)
This work compares the recently developed qsofitmore stellar population-based code with PCA-derived galaxy templates to the nebular-inclusive FADO code, aiming to evaluate their differences in fitting the H α emission. This comparison adds diversity to the evaluation between FADO and other consider nebula emission codes, supporting the robustness of FADO’s self-consistent approach for our sample. We find that FADO produces stable galaxy spectral fits within the low-redshift range ( z < 0.4 ), showing only minor differences compared to models that treat nebular emission as a constant. Specifically, the median difference in H α flux between the two codes is approximately 0.028 dex (corresponding to a linear difference of about 6.68 % ). This result is similar to the findings of Miranda et al. [20], who performed H α fitting using FADO and MAP-JHU. We infer that for H α -based SFR estimates at z < 0.4 , the choice between self-consistent nebular modeling and an average nebular level has only a modest impact on the H α flux.
(2)
Statistical analysis indicates that for galaxies with z < 0.4 and stellar masses in the range 10 9 10 11 M , both H α and SFR serve as reliable tracers of the nebular ratio, which itself shows weak sensitivity to stellar mass within this mass range. In particular, we observe an increasing trend of the nebular ratio with redshift, which is especially pronounced in the interval z = 0.2 to 0.4 . This finding underscores the necessity of adequately accounting for the nebular contribution in future spectroscopic analyses of higher-redshift star-forming galaxies. Such effects are expected to become increasingly significant under these conditions, particularly when investigating the active star-forming environments of the early universe.
(3)
This work presents a quantitative characterization of the increasing trend of the median nebular ratio with redshift in SFGs, which is largely insensitive (within uncertainties) to variations in stellar mass over 10 9 10 11 M . Moreover, a quantitative model describing the dependence of the average nebular emission fraction on the redshift is established. This empirical relation provides a practical tool for estimating nebular contributions in low-redshift SDSS-like samples, and with appropriate calibration may inform assessments at higher redshifts. This framework provides a basis for quantitatively assessing nebular contributions in future studies of high-redshift galaxies, thereby supporting improved SFR inference and laying a solid foundation for future galaxy evolution studies utilizing large spectroscopic surveys.
In the future, high-quality spectroscopic data from DESI will enable nebular emission samples spanning a broader redshift range. Thanks to its spectral resolution and depth, DESI will deliver precise high-S/N measurements to constrain nebular emissions, substantially increasing the size and fidelity of observational samples [77,78]. Using this dataset, we will be able to perform systematic analyses of the relative contributions and evolution of nebular emission across a wider span of cosmic time. These investigations should refine our understanding of star formation processes and their environmental interactions, thereby informing models of galaxy evolution. Finally, by integrating multi-wavelength spectroscopy, consistent modeling and subtraction of nebular emission across bands should enable more accurate recovery of intrinsic stellar continua. This approach will mitigate continuum flattening and absorption-line dilution caused by nebular emission, improving the precision of inferred ages, metallicities, and star-formation histories to support a more comprehensive view of galaxy formation and evolution.

Author Contributions

Formal analysis, Y.Y. and Q.C.; investigation, Y.Y.; writing—original draft preparation, Y.Y. and Q.C.; writing—review and editing, Y.Y., Q.C. and L.J.; software, C.P. and H.M.; validation, C.P. and H.M. All authors have read and agreed to the published version of the manuscript.

Funding

This research received no external funding.

Data Availability Statement

The data underlying this article will be shared on reasonable request to the corresponding authors.

Acknowledgments

The author thanks the anonymous referee for their detailed reading of the paper and useful constructive suggestions and comments. This work used Sloan Digital Sky Survey VIII spectroscopic data products. Sloan Digital Sky Survey VIII acknowledges support and resources from the Center for High-Performance Computing at the University of Utah. The SDSS website can be found at www.sdss.org, and the spectroscopic data website used in this work are provided at https://dr18.sdss.org/optical/spectrum/search (accessed on 6 October 2024). The authors would like to thank the University of Lisbon for providing the FADO code and Fu for improving qsofitmore. The author sincerely thanks Jiahe Xiao for helping with the FADO running problem. The authors also thank Han Yirui for all your support.

Conflicts of Interest

The authors declare no conflicts of interest.

Appendix A. List of SQL Queries

To find suitable SFGs with an obvious velocity offset (velocity offset > 150 km s 1 ), we selectd galaxies in SDSS DR18 Almeida et al. [35] using the Structured Query Language (SQL) Search tool (http://skyserver.sdss.org/dr18/en/tools/search/sql.aspx) (accessed on 6 October 2024).
SQL Query 1:
SELECT S.plate, S.fiberid, S.mjd,
S.z, G.oiii_5007_flux,
G.h_beta_flux, G.h_beta_flux_err,
G.oiii_5007_flux, G.oiii_5007_flux_err,
G.nii_6584_flux, G.nii_6584_flux_err,
G.h_alpha_flux, G.h_alpha_flux_err,
G.oiii_5007_flux/G.h_beta_flux as o3hb,
G.nii_6584_flux/G.h_alpha_flux as n2ha
FROM GalSpecLine as G
JOIN SpecObjall as S
ON S.specobjid = G.specobjid
WHERE S.class =’GALAXY’ and
S.SNmedian > 5 and SNmedian < 20
S.z < 0.2 and z  >= 0
S.zwarning = 0
S.veldisperr > 0
and S.veldisp > 3*S.veldisperr and
(S.veldisp > 80 and S.veldisp < 350)
and G.h_beta_flux_err > 0 and
G.h_beta_flux > 5*G.h_beta_flux_err
and G.h_alpha_flux_err > 0 and
G.h_alpha_flux > 5*G.h_alpha_flux_err
and G.oiii_5007_flux_err > 0 and
G.oiii_5007_flux > 5*G.oiii_5007_flux_err
and G.nii_6584_flux_err > 0 and
G.nii_6584_flux > 5*G.nii_6584_flux_err
SQL Query 2:
SELECT S.plate, S.fiberid, S.mjd,
S.z, G.oiii_5007_flux,
G.h_beta_flux, G.h_beta_flux_err,
G.oiii_5007_flux, G.oiii_5007_flux_err,
G.nii_6584_flux, G.nii_6584_flux_err,
G.h_alpha_flux, G.h_alpha_flux_err,
G.oiii_5007_flux/G.h_beta_flux as o3hb,
G.nii_6584_flux/G.h_alpha_flux as n2ha
FROM GalSpecLine as G
JOIN SpecObjall as S
ON S.specobjid = G.specobjid
WHERE S.class = ’GALAXY’ and
S.SNmedian > 5
S.z < 0.4 and z  >= 0.2
S.zwarning = 0
S.veldisperr > 0
and S.veldisp > 3*S.veldisperr and
(S.veldisp > 80 and S.veldisp < 350)
and G.h_beta_flux_err > 0 and
G.h_beta_flux > 5*G.h_beta_flux_err
and G.h_alpha_flux_err > 0 and
G.h_alpha_flux > 5*G.h_alpha_flux_err
and G.oiii_5007_flux_err > 0 and
G.oiii_5007_flux > 5*G.oiii_5007_flux_err
and G.nii_6584_flux_err > 0 and
G.nii_6584_flux > 5*G.nii_6584_flux_err

Appendix B. Example of qsofitmore and FADO Spectral Fitting
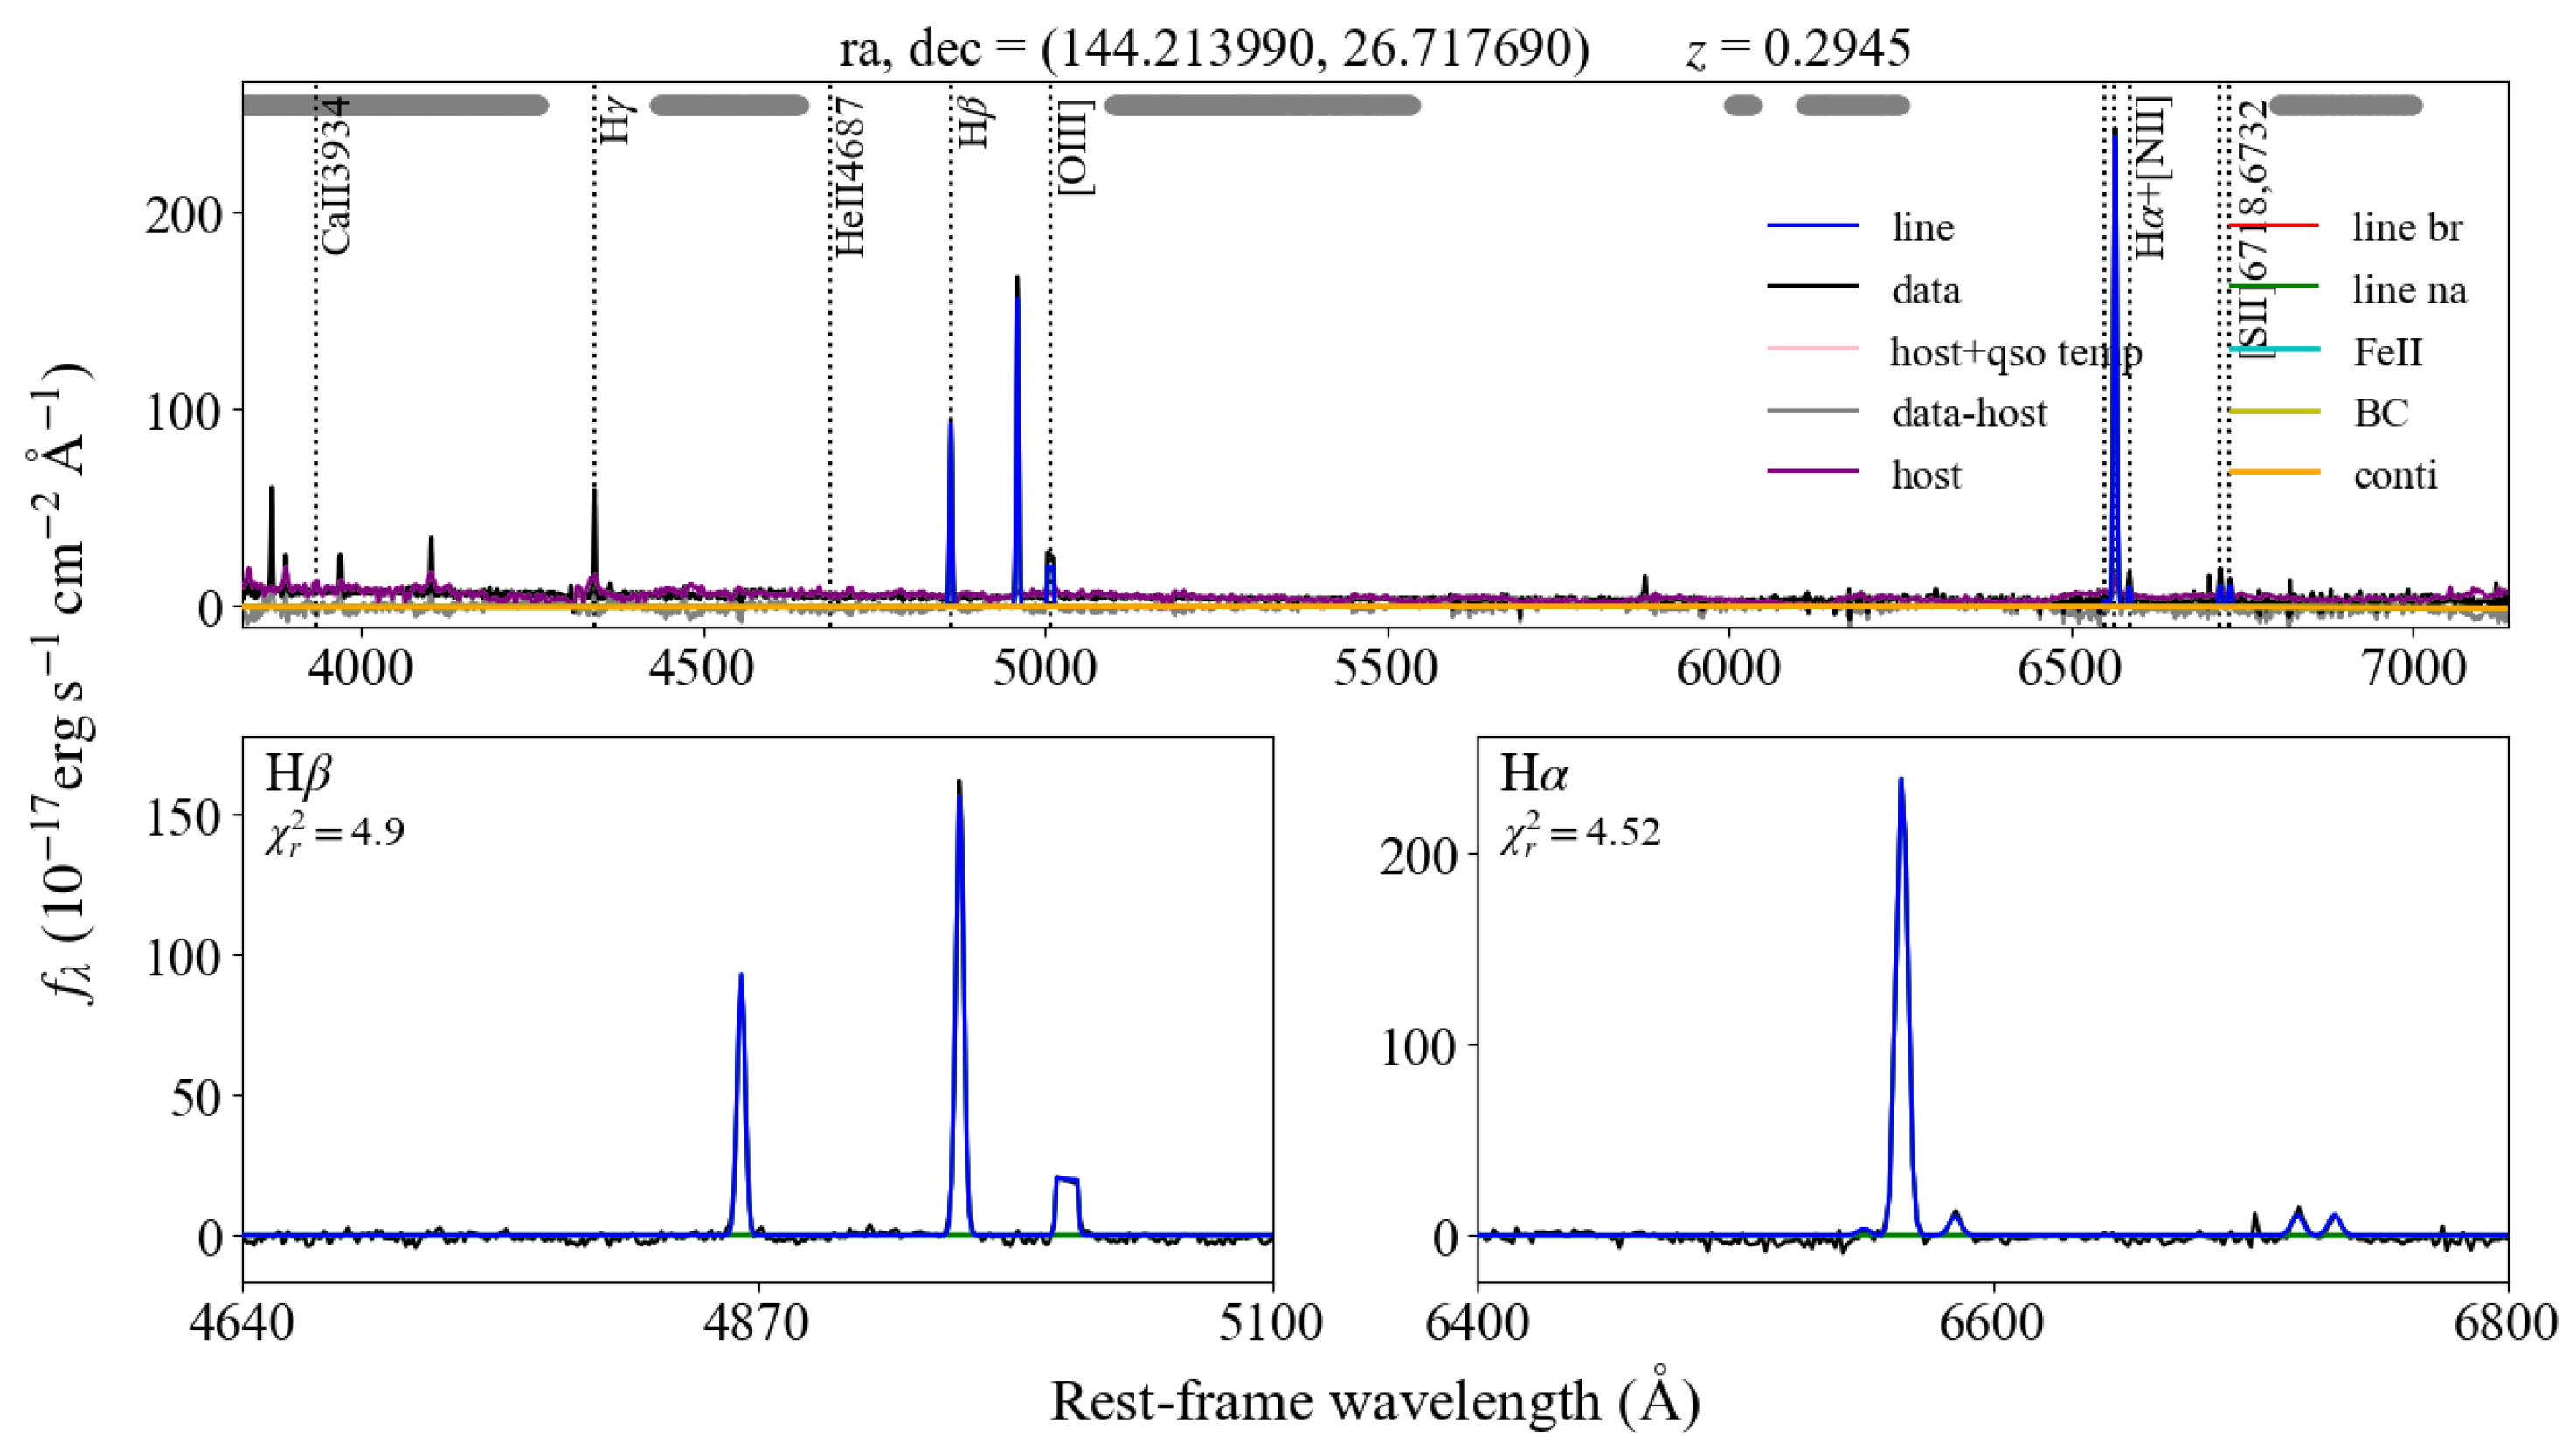
This section shows a comparison between qsofitmore and FADO fitting results for the same galaxy spectrum (SDSS J093+2643).
Figure A1. Fitting results for galaxy SDSS J093+2643 with qsofitmore. (Upper panel): Fitting results of the full spectrum considering the subtraction of the host component. (Lower panels): Zoomed-in view of the fitting results for H α and H β .
Universe 11 00285 g0a1
Figure A2. Fitting results for galaxy SDSS J093+2643 with FADO. (Lower panels): The main fitted emission line result; the red line at the bottom represents the nebula model flux, the orange line is the input data, the green line is the stellar model flux, and the blue line is the total fitting model. For a more detailed analysis of this fit, see Gomes and Papaderos [28].
Universe 11 00285 g0a2

References

  1. Zhuang, M.Y.; Ho, L.C. Recalibration of [O II] λ3727 as a Star Formation Rate Estimator for Active and Inactive Galaxies. Astrophys. J. 2019, 882, 89. [Google Scholar] [CrossRef]
  2. Krumholz, M.R.; Dekel, A.; McKee, C.F. A Universal, Local Star Formation Law in Galactic Clouds, nearby Galaxies, High-redshift Disks, and Starbursts. Astrophys. J. 2012, 745, 69. [Google Scholar] [CrossRef]
  3. Mullaney, J.R.; Pannella, M.; Daddi, E.; Alexander, D.M.; Elbaz, D.; Hickox, R.C.; Bournaud, F.; Altieri, B.; Aussel, H.; Coia, D.; et al. GOODS-Herschel: The far-infrared view of star formation in active galactic nucleus host galaxies since z ≈ 3. Mon. Not. R. Astron. Soc. 2012, 419, 95–115. [Google Scholar] [CrossRef]
  4. Madau, P.; Dickinson, M. Cosmic Star-Formation History. Annu. Rev. Astron. Astrophys. 2014, 52, 415–486. [Google Scholar] [CrossRef]
  5. Lada, C.J.; Lada, E.A. Embedded Clusters in Molecular Clouds. Annu. Rev. Astron. Astrophys. 2003, 41, 57–115. [Google Scholar] [CrossRef]
  6. McKee, C.F.; Tan, J.C. Massive star formation in 100,000 years from turbulent and pressurized molecular clouds. Nature 2002, 416, 59–61. [Google Scholar] [CrossRef]
  7. Kirk, H.; Klassen, M.; Pudritz, R.; Pillsworth, S. The Role of Turbulence and Magnetic Fields in Simulated Filamentary Structure. Astrophys. J. 2015, 802, 75. [Google Scholar] [CrossRef]
  8. McKee, C.F.; Ostriker, E.C. Theory of Star Formation. Annu. Rev. Astron. Astrophys. 2007, 45, 565–687. [Google Scholar] [CrossRef]
  9. Di Matteo, T.; Springel, V.; Hernquist, L. Energy input from quasars regulates the growth and activity of black holes and their host galaxies. Nature 2005, 433, 604–607. [Google Scholar] [CrossRef] [PubMed]
  10. Springel, V.; Di Matteo, T.; Hernquist, L. Modelling feedback from stars and black holes in galaxy mergers. Mon. Not. R. Astron. Soc. 2005, 361, 776–794. [Google Scholar] [CrossRef]
  11. Wang, F.Y. The high-redshift star formation rate derived from gamma-ray bursts: Possible origin and cosmic reionization. Astron. Astrophys. 2013, 556, A90. [Google Scholar] [CrossRef]
  12. Robertson, B.E.; Ellis, R.S. Connecting the Gamma Ray Burst Rate and the Cosmic Star Formation History: Implications for Reionization and Galaxy Evolution. Astrophys. J. 2012, 744, 95. [Google Scholar] [CrossRef]
  13. Daigne, F.; Olive, K.A.; Vangioni-Flam, E.; Silk, J.; Audouze, J. Cosmic Star Formation, Reionization, and Constraints on Global Chemical Evolution. Astrophys. J. 2004, 617, 693–706. [Google Scholar] [CrossRef]
  14. Kennicutt, R.C.; Evans, N.J. Star Formation in the Milky Way and Nearby Galaxies. Annu. Rev. Astron. Astrophys. 2012, 50, 531–608. [Google Scholar] [CrossRef]
  15. York, D.G.; Adelman, J.; Anderson, J.E., Jr.; Anderson, S.F.; Annis, J.; Bahcall, N.A.; Bakken, J.A.; Barkhouser, R.; Bastian, S.; Berman, E.; et al. The Sloan Digital Sky Survey: Technical Summary. Astron. J. 2000, 120, 1579–1587. [Google Scholar] [CrossRef]
  16. Ellis, R.S.; McLure, R.J.; Dunlop, J.S.; Robertson, B.E.; Ono, Y.; Schenker, M.A.; Koekemoer, A.; Bowler, R.A.A.; Ouchi, M.; Rogers, A.B.; et al. The Abundance of Star-forming Galaxies in the Redshift Range 8.5-12: New Results from the 2012 Hubble Ultra Deep Field Campaign. Astrophys. J. Lett. 2013, 763, L7. [Google Scholar] [CrossRef]
  17. Wang, R.; Wagg, J.; Carilli, C.L.; Walter, F.; Lentati, L.; Fan, X.; Riechers, D.A.; Bertoldi, F.; Narayanan, D.; Strauss, M.A.; et al. Star Formation and Gas Kinematics of Quasar Host Galaxies at z ~ 6: New Insights from ALMA. Astrophys. J. 2013, 773, 44. [Google Scholar] [CrossRef]
  18. Cid Fernandes, R.; Mateus, A.; Sodré, L.; Stasińska, G.; Gomes, J.M. Semi-empirical analysis of Sloan Digital Sky Survey galaxies—I. Spectral synthesis method. Mon. Not. R. Astron. Soc. 2005, 358, 363–378. [Google Scholar] [CrossRef]
  19. Cappellari, M.; Emsellem, E. Parametric Recovery of Line-of-Sight Velocity Distributions from Absorption-Line Spectra of Galaxies via Penalized Likelihood. Publ. Astron. Soc. Pac. 2004, 116, 138–147. [Google Scholar] [CrossRef]
  20. Miranda, H.; Pappalardo, C.; Papaderos, P.; Afonso, J.; Matute, I.; Lobo, C.; Paulino-Afonso, A.; Carvajal, R.; Lorenzoni, S.; Santos, D. An investigation of the star-forming main sequence considering the nebular continuum emission at low-z. Astron. Astrophys. 2023, 669, A16. [Google Scholar] [CrossRef]
  21. Ahumada, R.; Allende Prieto, C.; Almeida, A.; Anders, F.; Anderson, S.F.; Andrews, B.H.; Anguiano, B.; Arcodia, R.; Armengaud, E.; Aubert, M.; et al. The 16th Data Release of the Sloan Digital Sky Surveys: First Release from the APOGEE-2 Southern Survey and Full Release of eBOSS Spectra. Astrophys. J. Suppl. Ser. 2020, 249, 3. [Google Scholar] [CrossRef]
  22. Krueger, H.; Fritze-v. Alvensleben, U.; Loose, H.H. Optical and near infrared spectral energy distributions. of blue compact galaxies from evolutionary synthesis. Astron. Astrophys. 1995, 303, 41. [Google Scholar]
  23. Salim, S.; Rich, R.M.; Charlot, S.; Brinchmann, J.; Johnson, B.D.; Schiminovich, D.; Seibert, M.; Mallery, R.; Heckman, T.M.; Forster, K.; et al. UV Star Formation Rates in the Local Universe. Astrophys. J. Suppl. Ser. 2007, 173, 267–292. [Google Scholar] [CrossRef]
  24. Schaerer, D.; de Barros, S. The impact of nebular emission on the ages of z ≈ 6 galaxies. Astron. Astrophys. 2009, 502, 423–426. [Google Scholar] [CrossRef]
  25. Pacifici, C.; da Cunha, E.; Charlot, S.; Rix, H.W.; Fumagalli, M.; Wel, A.v.d.; Franx, M.; Maseda, M.V.; van Dokkum, P.G.; Brammer, G.B.; et al. On the importance of using appropriate spectral models to derive physical properties of galaxies at 0.7 < z < 2.8. Mon. Not. R. Astron. Soc. 2015, 447, 786–805. [Google Scholar] [CrossRef]
  26. Izotov, Y.I.; Schaerer, D.; Guseva, N.G.; Thuan, T.X.; Worseck, G. Extremely strong C IV λ1550 nebular emission in the extremely low-metallicity star-forming galaxy J2229+2725. Mon. Not. R. Astron. Soc. 2024, 528, L10–L14. [Google Scholar] [CrossRef]
  27. Scoville, N.; Faisst, A.; Weaver, J.; Toft, S.; McCracken, H.J.; Ilbert, O.; Diaz-Santos, T.; Staguhn, J.; Koda, J.; Casey, C.; et al. Cosmic Evolution of Gas and Star Formation. Astrophys. J. 2023, 943, 82. [Google Scholar] [CrossRef]
  28. Gomes, J.M.; Papaderos, P. Fitting Analysis using Differential evolution Optimization (FADO): Spectral population synthesis through genetic optimization under self-consistency boundary conditions. Astron. Astrophys. 2017, 603, A63. [Google Scholar] [CrossRef]
  29. Cardoso, L.S.M.; Gomes, J.M.; Papaderos, P.; Pappalardo, C.; Miranda, H.; Paulino-Afonso, A.; Afonso, J.; Lagos, P. Revisiting stellar properties of star-forming galaxies with stellar and nebular spectral modelling. Astron. Astrophys. 2022, 667, A11. [Google Scholar] [CrossRef]
  30. Breda, I.; Vilchez, J.M.; Papaderos, P.; Cardoso, L.; Amorin, R.O.; Arroyo-Polonio, A.; Iglesias-Páramo, J.; Kehrig, C.; Pérez-Montero, E. Characterisation of the stellar content of SDSS EELGs through self-consistent spectral modelling. Astron. Astrophys. 2022, 663, A29. [Google Scholar] [CrossRef]
  31. Sobral, D.; Smail, I.; Best, P.N.; Geach, J.E.; Matsuda, Y.; Stott, J.P.; Cirasuolo, M.; Kurk, J. A large Hα survey at z = 2.23, 1.47, 0.84 and 0.40: The 11 Gyr evolution of star-forming galaxies from HiZELS. Mon. Not. R. Astron. Soc. 2013, 428, 1128–1146. [Google Scholar] [CrossRef]
  32. Kewley, L.J.; Geller, M.J.; Jansen, R.A. O II as a Star Formation Rate Indicator. Astron. J. 2004, 127, 2002–2030. [Google Scholar] [CrossRef]
  33. Kennicutt, R.C., Jr. Star Formation in Galaxies Along the Hubble Sequence. Annu. Rev. Astron. Astrophys. 1998, 36, 189–232. [Google Scholar] [CrossRef]
  34. Shapley, A.E.; Reddy, N.A.; Sanders, R.L.; Topping, M.W.; Brammer, G.B. JWST/NIRSpec Measurements of the Relationships between Nebular Emission-line Ratios and Stellar Mass at z 3–6. Astrophys. J. Lett. 2023, 950, L1. [Google Scholar] [CrossRef]
  35. Almeida, A.; Anderson, S.F.; Argudo-Fernández, M.; Badenes, C.; Barger, K.; Barrera-Ballesteros, J.K.; Bender, C.F.; Benitez, E.; Besser, F.; Bird, J.C.; et al. The Eighteenth Data Release of the Sloan Digital Sky Surveys: Targeting and First Spectra from SDSS-V. Astrophys. J. Suppl. Ser. 2023, 267, 44. [Google Scholar] [CrossRef]
  36. Pappalardo, C.; Cardoso, L.S.M.; Michel Gomes, J.; Papaderos, P.; Afonso, J.; Breda, I.; Humphrey, A.; Scott, T.; Amarantidis, S.; Matute, I.; et al. Self-consistent population spectral synthesis with FADO. II. Star formation history of galaxies in spectral synthesis methods. Astron. Astrophys. 2021, 651, A99. [Google Scholar] [CrossRef]
  37. Baldwin, J.A.; Phillips, M.M.; Terlevich, R. Classification parameters for the emission-line spectra of extragalactic objects. Publ. Astron. Soc. Pac. 1981, 93, 5–19. [Google Scholar] [CrossRef]
  38. Kewley, L.J.; Dopita, M.A.; Sutherland, R.S.; Heisler, C.A.; Trevena, J. Theoretical Modeling of Starburst Galaxies. Astrophys. J. 2001, 556, 121–140. [Google Scholar] [CrossRef]
  39. Kauffmann, G.; Heckman, T.M.; Tremonti, C.; Brinchmann, J.; Charlot, S.; White, S.D.M.; Ridgway, S.E.; Brinkmann, J.; Fukugita, M.; Hall, P.B.; et al. The host galaxies of active galactic nuclei. Mon. Not. R. Astron. Soc. 2003, 346, 1055–1077. [Google Scholar] [CrossRef]
  40. Fu, Y. QSOFITMORE: A Python Package for Fitting UV-Optical Spectra of Quasars; Zenodo: Geneva, Switzerland, 2021. [Google Scholar] [CrossRef]
  41. Fu, Y.; Wu, X.B.; Jiang, L.; Zhang, Y.; Huo, Z.Y.; Ai, Y.L.; Yang, Q.; Ma, Q.; Feng, X.; Joshi, R.; et al. Finding Quasars behind the Galactic Plane. II. Spectroscopic Identifications of 204 Quasars at ∣b∣ < 20°. Astrophys. J. Suppl. Ser. 2022, 261, 32. [Google Scholar] [CrossRef]
  42. Jin, J.J.; Wu, X.B.; Fu, Y.; Yao, S.; Ai, Y.L.; Feng, X.T.; He, Z.Q.; Ma, Q.C.; Pang, Y.X.; Zhu, R.; et al. The Large Sky Area Multi-Object Fiber Spectroscopic Telescope (LAMOST) Quasar Survey: Quasar Properties from Data Releases 6 to 9. Astrophys. J. Suppl. Ser. 2023, 265, 25. [Google Scholar] [CrossRef]
  43. Ding, X.; Onoue, M.; Silverman, J.D.; Matsuoka, Y.; Izumi, T.; Strauss, M.A.; Jahnke, K.; Phillips, C.L.; Li, J.; Volonteri, M.; et al. Detection of stellar light from quasar host galaxies at redshifts above 6. Nature 2023, 621, 51–55. [Google Scholar] [CrossRef]
  44. Chen, G.; Zheng, Z.; Zeng, X.; Zhang, L.; Xiao, H.; Liu, X.; Cui, L.; Fan, J. A Study of Broad Emission Line and Doppler Factor Estimation for Fermi Blazars. Astrophys. J. Suppl. Ser. 2024, 271, 20. [Google Scholar] [CrossRef]
  45. Yip, C.W.; Connolly, A.J.; Szalay, A.S.; Budavári, T.; SubbaRao, M.; Frieman, J.A.; Nichol, R.C.; Hopkins, A.M.; York, D.G.; Okamura, S.; et al. Distributions of Galaxy Spectral Types in the Sloan Digital Sky Survey. Astron. J. 2004, 128, 585–609. [Google Scholar] [CrossRef]
  46. Shen, Y.; Richards, G.T.; Strauss, M.A.; Hall, P.B.; Schneider, D.P.; Snedden, S.; Bizyaev, D.; Brewington, H.; Malanushenko, V.; Malanushenko, E.; et al. A Catalog of Quasar Properties from Sloan Digital Sky Survey Data Release 7. Astrophys. J. Suppl. Ser. 2011, 194, 45. [Google Scholar] [CrossRef]
  47. Shen, Y.; Hall, P.B.; Horne, K.; Zhu, G.; McGreer, I.; Simm, T.; Trump, J.R.; Kinemuchi, K.; Brandt, W.N.; Green, P.J.; et al. The Sloan Digital Sky Survey Reverberation Mapping Project: Sample Characterization. Astrophys. J. Suppl. Ser. 2019, 241, 34. [Google Scholar] [CrossRef]
  48. Rakshit, S.; Stalin, C.S.; Kotilainen, J. Spectral Properties of Quasars from Sloan Digital Sky Survey Data Release 14: The Catalog. Astrophys. J. Suppl. Ser. 2020, 249, 17. [Google Scholar] [CrossRef]
  49. Bruzual, G.; Charlot, S. Stellar population synthesis at the resolution of 2003. Mon. Not. R. Astron. Soc. 2003, 344, 1000–1028. [Google Scholar] [CrossRef]
  50. Abazajian, K.N.; Adelman-McCarthy, J.K.; Agüeros, M.A.; Allam, S.S.; Allende Prieto, C.; An, D.; Anderson, K.S.J.; Anderson, S.F.; Annis, J.; Bahcall, N.A.; et al. The Seventh Data Release of the Sloan Digital Sky Survey. Astrophys. J. Suppl. Ser. 2009, 182, 543–558. [Google Scholar] [CrossRef]
  51. Miranda, H.; Pappalardo, C.; Afonso, J.; Papaderos, P.; Lobo, C.; Paulino-Afonso, A.; Carvajal, R.; Matute, I.; Lagos, P.; Barbosa, D. Importance of modelling the nebular continuum in galaxy spectra. Astron. Astrophys. 2025, 694, A102. [Google Scholar] [CrossRef]
  52. Calzetti, D.; Armus, L.; Bohlin, R.C.; Kinney, A.L.; Koornneef, J.; Storchi-Bergmann, T. The Dust Content and Opacity of Actively Star-forming Galaxies. Astrophys. J. 2000, 533, 682–695. [Google Scholar] [CrossRef]
  53. Gaskell, C.M.; Ferland, G.J. Theoretical hydrogen-line ratios for the narrow-line regions of active galactic nuclei. Publ. Astron. Soc. Pac. 1984, 96, 393–397. [Google Scholar] [CrossRef]
  54. Hummer, D.G.; Storey, P.J. Recombination-line intensities for hydrogenic ions - I. Case B calculations for H I and He II. Mon. Not. R. Astron. Soc. 1987, 224, 801–820. [Google Scholar] [CrossRef]
  55. Cardelli, J.A.; Clayton, G.C.; Mathis, J.S. The Relationship between Infrared, Optical, and Ultraviolet Extinction. Astrophys. J. 1989, 345, 245. [Google Scholar] [CrossRef]
  56. Chabrier, G. The Galactic Disk Mass Function: Reconciliation of the Hubble Space Telescope and Nearby Determinations. Astrophys. J. Lett. 2003, 586, L133–L136. [Google Scholar] [CrossRef]
  57. Brinchmann, J.; Charlot, S.; White, S.D.M.; Tremonti, C.; Kauffmann, G.; Heckman, T.; Brinkmann, J. The physical properties of star-forming galaxies in the low-redshift Universe. Mon. Not. R. Astron. Soc. 2004, 351, 1151–1179. [Google Scholar] [CrossRef]
  58. Mannucci, F.; Cresci, G.; Maiolino, R.; Marconi, A.; Gnerucci, A. A fundamental relation between mass, star formation rate and metallicity in local and high-redshift galaxies. Mon. Not. R. Astron. Soc. 2010, 408, 2115–2127. [Google Scholar] [CrossRef]
  59. Behroozi, P.S.; Wechsler, R.H.; Conroy, C. The average star formation histories of galaxies in dark matter halos from z = 0–8. Astrophys. J. 2013, 770, 57. [Google Scholar] [CrossRef]
  60. Elbaz, D.; Leiton, R.; Nagar, N.; Okumura, K.; Franco, M.; Schreiber, C.; Pannella, M.; Wang, T.; Dickinson, M.; Díaz-Santos, T.; et al. Starbursts in and out of the star-formation main sequence. Astron. Astrophys. 2018, 616, A110. [Google Scholar] [CrossRef]
  61. Li, J.; Liu, C.; Zhang, Z.Y.; Tian, H.; Fu, X.; Li, J.; Yan, Z.Q. Stellar initial mass function varies with metallicity and time. Nature 2023, 613, 460–462. [Google Scholar] [CrossRef]
  62. Weilbacher, P.M.; Fritze-v. Alvensleben, U. On star formation rates in dwarf galaxies. Astron. Astrophys. 2001, 373, L9–L12. [Google Scholar] [CrossRef]
  63. Kewley, L.J.; Nicholls, D.C.; Sutherland, R.S. Understanding Galaxy Evolution Through Emission Lines. Annu. Rev. Astron. Astrophys. 2019, 57, 511–570. [Google Scholar] [CrossRef]
  64. Smith, J.D.T.; Draine, B.T.; Dale, D.A.; Moustakas, J.; Kennicutt, R.C., Jr.; Helou, G.; Armus, L.; Roussel, H.; Sheth, K.; Bendo, G.J.; et al. The Mid-Infrared Spectrum of Star-forming Galaxies: Global Properties of Polycyclic Aromatic Hydrocarbon Emission. Astrophys. J. 2007, 656, 770–791. [Google Scholar] [CrossRef]
  65. Rosario, D.J.; Mendel, J.T.; Ellison, S.L.; Lutz, D.; Trump, J.R. Local SDSS galaxies in the Herschel Stripe 82 survey: A critical assessment of optically derived star formation rates. Mon. Not. R. Astron. Soc. 2016, 457, 2703–2721. [Google Scholar] [CrossRef]
  66. Malmquist, K.G. On some relations in stellar statistics. Medd. Fran Lunds Astron. Obs. Ser. I 1922, 100, 1–52. [Google Scholar]
  67. Tasca, L.A.M.; Kneib, J.P.; Iovino, A.; Le Fèvre, O.; Kovač, K.; Bolzonella, M.; Lilly, S.J.; Abraham, R.G.; Cassata, P.; Cucciati, O.; et al. The zCOSMOS redshift survey: The role of environment and stellar mass in shaping the rise of the morphology-density relation from z ~ 1. Astron. Astrophys. 2009, 503, 379–398. [Google Scholar] [CrossRef]
  68. Ilbert, O.; McCracken, H.J.; Le Fèvre, O.; Capak, P.; Dunlop, J.; Karim, A.; Renzini, M.A.; Caputi, K.; Boissier, S.; Arnouts, S.; et al. Mass assembly in quiescent and star-forming galaxies since z = 4 from UltraVISTA. Astron. Astrophys. 2013, 556, A55. [Google Scholar] [CrossRef]
  69. Muzzin, A.; Marchesini, D.; Stefanon, M.; Franx, M.; McCracken, H.J.; Milvang-Jensen, B.; Dunlop, J.S.; Fynbo, J.P.U.; Brammer, G.; Labbé, I.; et al. The Evolution of the Stellar Mass Functions of Star-forming and Quiescent Galaxies to z = 4 from the COSMOS/UltraVISTA Survey. Astrophys. J. 2013, 777, 18. [Google Scholar] [CrossRef]
  70. Leja, J.; Johnson, B.D.; Conroy, C.; van Dokkum, P.; Speagle, J.S.; Brammer, G.; Momcheva, I.; Skelton, R.; Whitaker, K.E.; Franx, M.; et al. An Older, More Quiescent Universe from Panchromatic SED Fitting of the 3D-HST Survey. Astrophys. J. 2019, 877, 140. [Google Scholar] [CrossRef]
  71. Fumagalli, M.; Patel, S.G.; Franx, M.; Brammer, G.; van Dokkum, P.; da Cunha, E.; Kriek, M.; Lundgren, B.; Momcheva, I.; Rix, H.W.; et al. Hα Equivalent Widths from the 3D-HST Survey: Evolution with Redshift and Dependence on Stellar Mass. Astrophys. J. Lett. 2012, 757, L22. [Google Scholar] [CrossRef]
  72. Faisst, A.L.; Capak, P.; Hsieh, B.C.; Laigle, C.; Salvato, M.; Tasca, L.; Cassata, P.; Davidzon, I.; Ilbert, O.; Le Fèvre, O.; et al. A Coherent Study of Emission Lines from Broadband Photometry: Specific Star Formation Rates and [O III]/Hβ Ratio at 3 > z > 6. Astrophys. J. 2016, 821, 122. [Google Scholar] [CrossRef]
  73. Mármol-Queraltó, E.; McLure, R.J.; Cullen, F.; Dunlop, J.S.; Fontana, A.; McLeod, D.J. The evolution of the equivalent width of the Hα emission line and specific star formation rate in star-forming galaxies at 1 < z < 5. Mon. Not. R. Astron. Soc. 2016, 460, 3587–3597. [Google Scholar] [CrossRef]
  74. Reddy, N.A.; Shapley, A.E.; Sanders, R.L.; Kriek, M.; Coil, A.L.; Shivaei, I.; Freeman, W.R.; Mobasher, B.; Siana, B.; Azadi, M.; et al. The MOSDEF Survey: Significant Evolution in the Rest-frame Optical Emission Line Equivalent Widths of Star-forming Galaxies at z = 1.4–3.8. Astrophys. J. 2018, 869, 92. [Google Scholar] [CrossRef]
  75. Larson, R.L.; Hutchison, T.A.; Bagley, M.; Finkelstein, S.L.; Yung, L.Y.A.; Somerville, R.S.; Hirschmann, M.; Brammer, G.; Holwerda, B.W.; Papovich, C.; et al. Spectral Templates Optimal for Selecting Galaxies at z > 8 with the JWST. Astrophys. J. 2023, 958, 141. [Google Scholar] [CrossRef]
  76. Yan, H.; Li, H.; Wang, S.; Zong, W.; Yuan, H.; Xiang, M.; Huang, Y.; Xie, J.; Dong, S.; Yuan, H.; et al. Overview of the LAMOST survey in the first decade. Innov. 2022, 3, 100224. [Google Scholar] [CrossRef]
  77. DESI Collaboration; Abareshi, B.; Aguilar, J.; Ahlen, S.; Alam, S.; Alexander, D.M.; Alfarsy, R.; Allen, L.; Allende Prieto, C.; Alves, O.; et al. Overview of the Instrumentation for the Dark Energy Spectroscopic Instrument. Astron. J. 2022, 164, 207. [Google Scholar] [CrossRef]
  78. Dey, A.; Schlegel, D.J.; Lang, D.; Blum, R.; Burleigh, K.; Fan, X.; Findlay, J.R.; Finkbeiner, D.; Herrera, D.; Juneau, S.; et al. Overview of the DESI Legacy Imaging Surveys. Astron. J. 2019, 157, 168. [Google Scholar] [CrossRef]
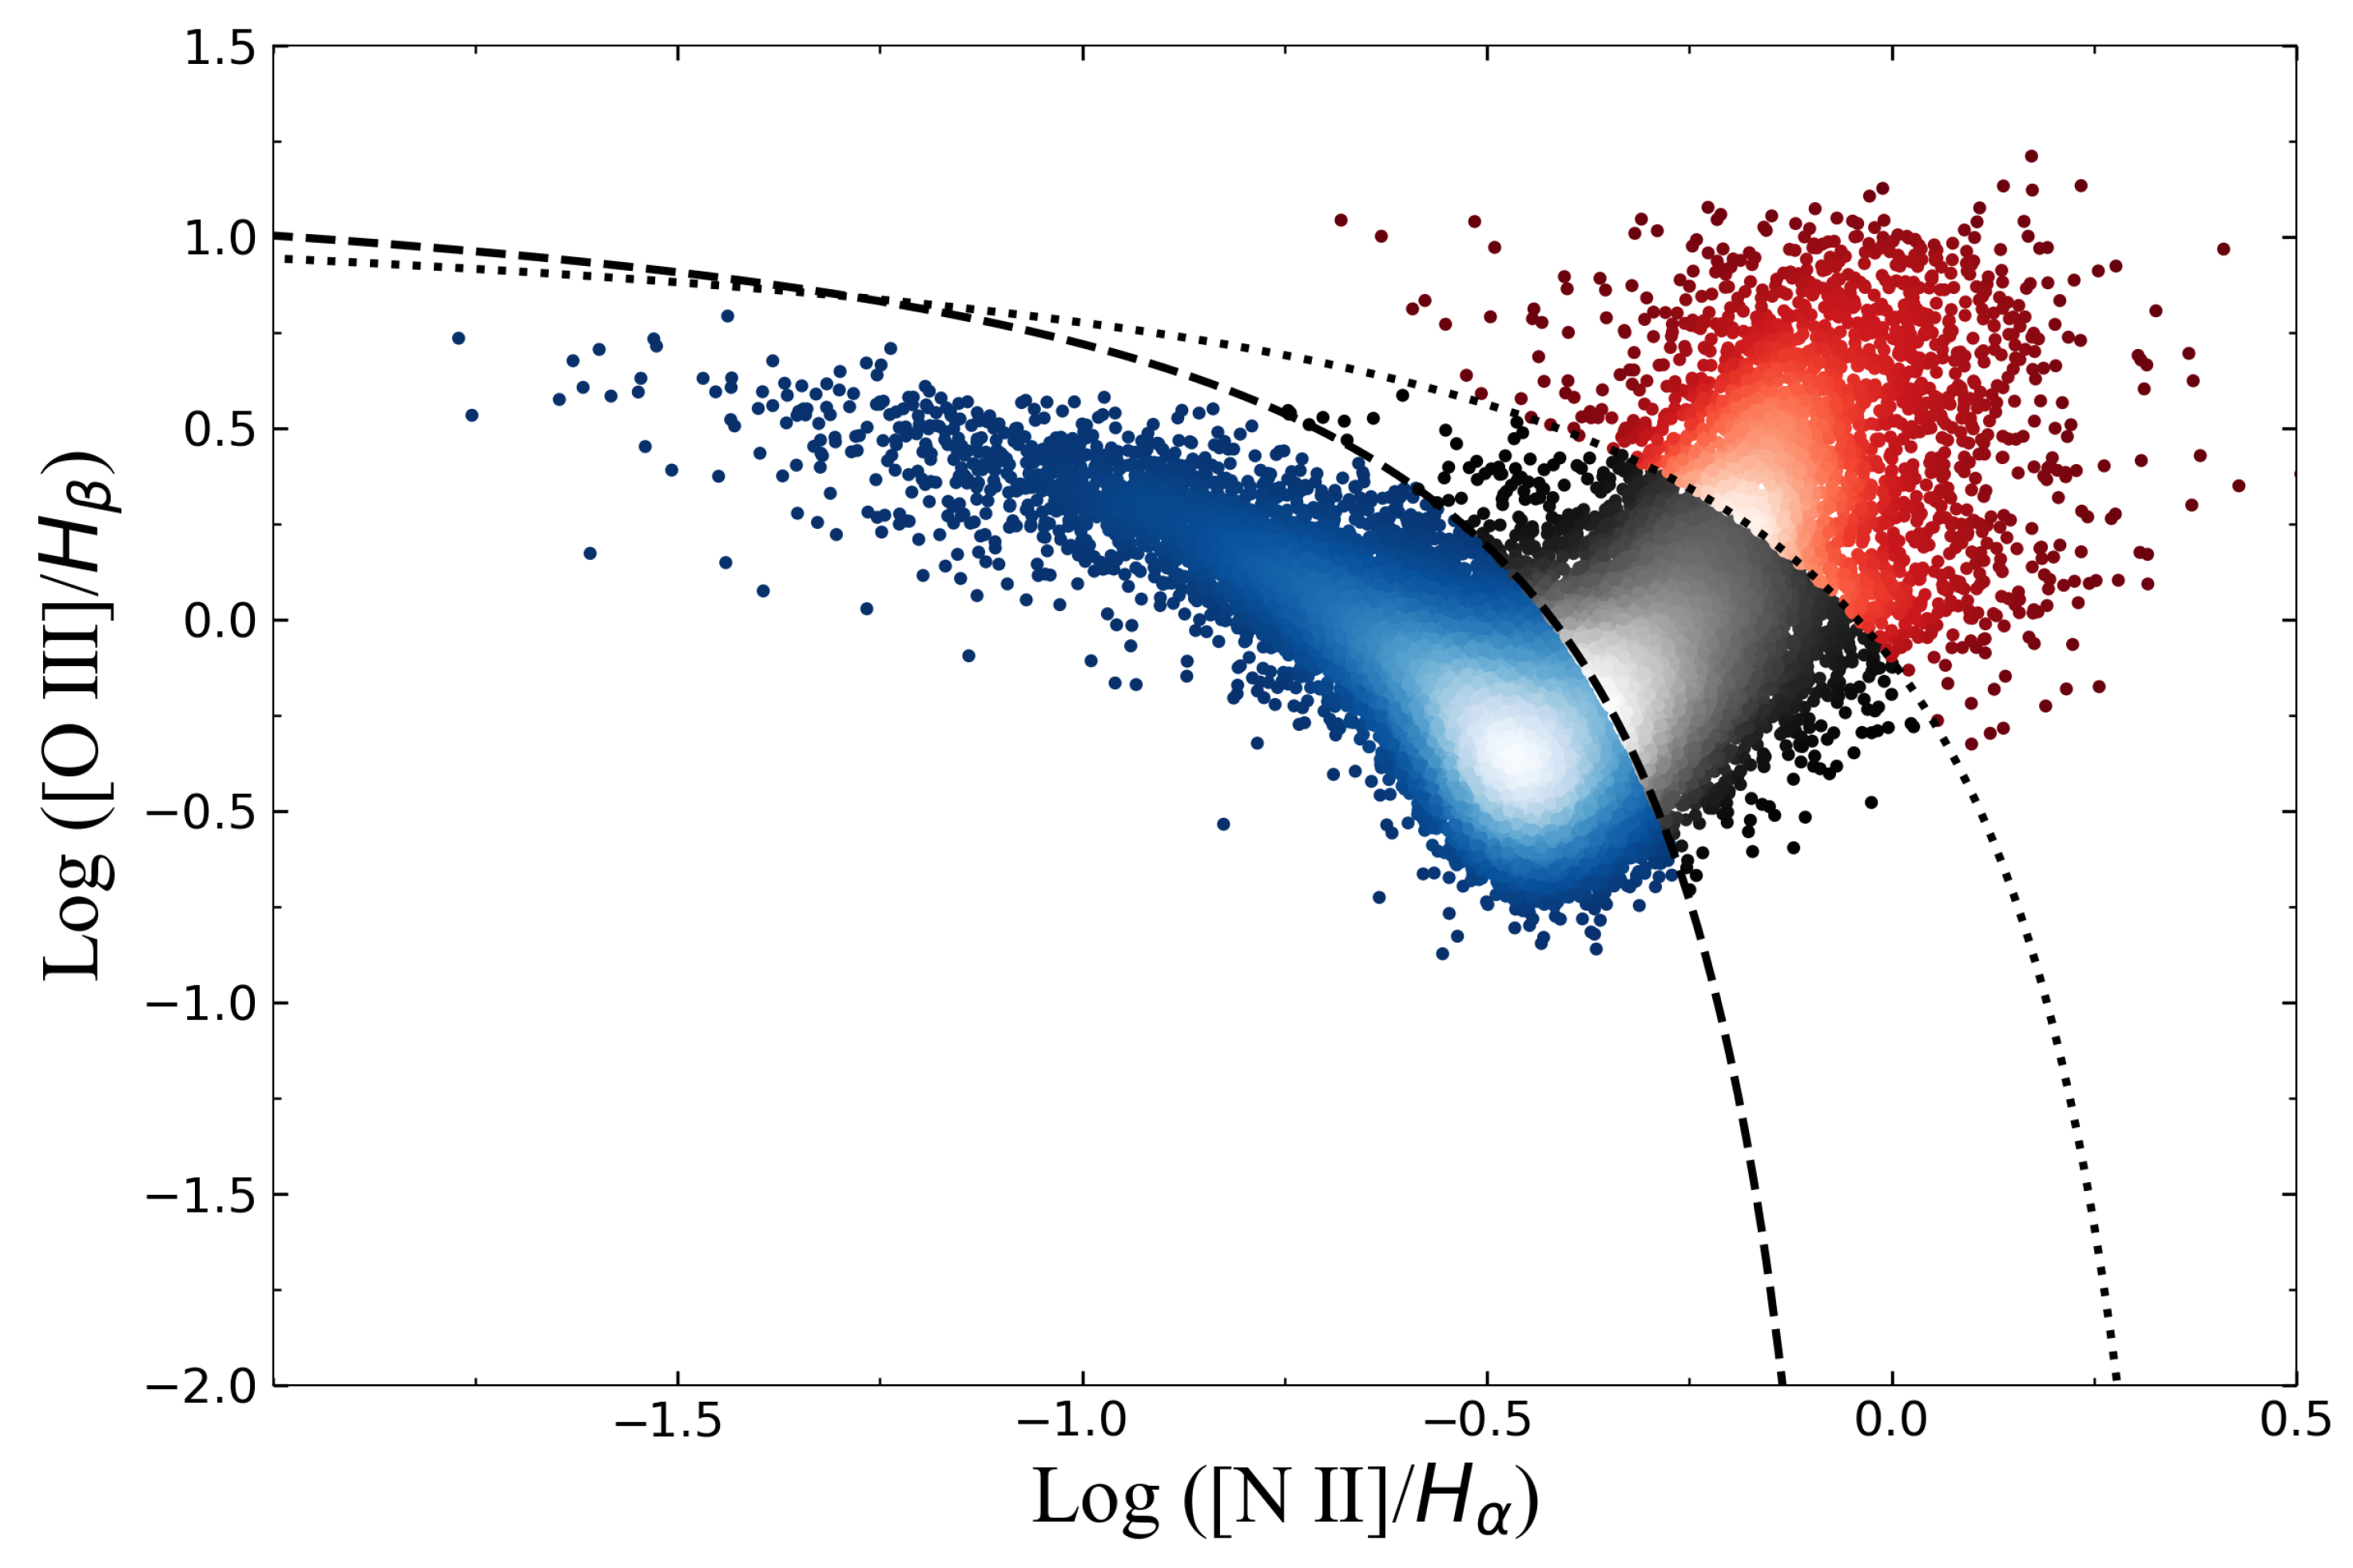
Figure 1. The distribution of the 21,455 galaxies on the BPT diagram. The blue, black, and red scatter points represent star-forming, composite, and AGN/Seyfert galaxies, with the dashed linis defined by Equation (1) and the dotted line by Equation (2). Whiter areas indicate a higher density of samples.
Universe 11 00285 g001
Figure 2. The distribution of the lower-redshift (blue) and higher-redshift (orange) samples. The dashed and dotted boundaries are the same as in Figure 1.
Universe 11 00285 g002
Figure 3. Statistics of the redshift and number of galaxies of the Golden Sample. The redshift is binned with an interval of 0.1.
Universe 11 00285 g003
Figure 4. Histograms of the H α flux fitted by qsofitmore (orange) and FADO (blue). The x-axis represents the fitted H α flux of the two packages, while the y-axis represents the normalized number of galaxy samples.
Universe 11 00285 g004
Figure 5. The redshift-binned logarithmized H α flux ratio versus the logarithmized H α flux fitted by FADO. The flux ratio in each panel is calculated using the FADO-fitted and qsofitmore-fitted H α . In each panel, the blue dotted lines represent the equality of the H α flux fitted by qsofitmore and FADO; in contrast, the black solid lines denote the linear fitting of the scatter considering uncertainties.
Universe 11 00285 g005
Figure 6. (Top-left panel): Relationship between FADO fitted H α flux and nebular ratio; an exponential fit is overlaid. (Top-right panel): Relationship between SFR and nebular ratio; an exponential fit provides the best fit. (Bottom-left panel): Relationship between stellar mass and nebular ratio overlaid by a linear fit. (Bottom-right panel): Relationship between galaxy redshift and nebular ratio; a linear fit describes the trend. The Spearman’s rank correlation coefficient ρ of each relation is marked on each panel, which is the monotonic correlation between the two parameters. Colors of scatter are encoded by redshift bins.
Universe 11 00285 g006
Figure 7. Relationship between each redshift bin and the median nebular ratio. The orange dashed line fit comes from the cubic function and represents the best fit result.
Universe 11 00285 g007
Disclaimer/Publisher’s Note: The statements, opinions and data contained in all publications are solely those of the individual author(s) and contributor(s) and not of MDPI and/or the editor(s). MDPI and/or the editor(s) disclaim responsibility for any injury to people or property resulting from any ideas, methods, instructions or products referred to in the content.