Article

Red Noise Suppression in Pulsar Timing Array Data Using Adaptive Splines

1
National Gravitation Laboratory, MOE Key Laboratory of Fundamental Physical Quantities Measurements, Department of Astronomy and School of Physics, Huazhong University of Science and Technology, Wuhan 430074, China
2
Department of Physics and Astronomy, The University of Texas Rio Grande Valley, Brownsville, TX 78520, USA
3
Department of Physics, IIT Hyderabad, Kandai 502284, Telangana, India
*
Authors to whom correspondence should be addressed.
Universe 2025, 11(8), 268; https://doi.org/10.3390/universe11080268
Submission received: 9 July 2025 / Revised: 7 August 2025 / Accepted: 13 August 2025 / Published: 15 August 2025
(This article belongs to the Special Issue Supermassive Black Hole Mass Measurements)

Abstract

Noise in Pulsar Timing Array (PTA) data is commonly modeled as a mixture of white and red noise components. While the former is related to the receivers, and easily characterized by three parameters (EFAC, EQUAD and ECORR), the latter arises from a mix of hard to model sources and, potentially, a stochastic gravitational wave background (GWB). Since their frequency ranges overlap, GWB search methods must model the non-GWB red noise component in PTA data explicitly, typically as a set of mutually independent Gaussian stationary processes having power-law power spectral densities. However, in searches for continuous wave (CW) signals from resolvable sources, the red noise is simply a component that must be filtered out, either explicitly or implicitly (via the definition of the matched filtering inner product). Due to the technical difficulties associated with irregular sampling, CW searches have generally used implicit filtering with the same power law model as GWB searches. This creates the data analysis burden of fitting the power-law parameters, which increase in number with the size of the PTA and hamper the scaling up of CW searches to large PTAs. Here, we present an explicit filtering approach that overcomes the technical issues associated with irregular sampling. The method uses adaptive splines, where the spline knots are included in the fitted model. Besides illustrating its application on real data, the effectiveness of this approach is investigated on synthetic data that has the same red noise characteristics as the NANOGrav 15-year dataset and contains a single non-evolving CW signal.

1. Introduction

Pulsar Timing Arrays (PTAs) aim to detect the gravitational waves (GWs) at nano-hertz frequencies by precisely monitoring an ensemble of highly stable millisecond pulsars (MSPs) distributed across the galaxy. Among the expected sources of GWs in this frequency range are individual Supermassive Black Hole Binaries (SMBHBs) [1] and the stochastic GW background (GWB) from the entire population of SMBHBs. The fundamental methodology begins with the collection of pulse times of arrival (ToAs) from these pulsars over many years. For each pulsar, a detailed deterministic timing model is constructed, accounting for factors such as its spin-down, binary motion (if applicable), astrometric parameters, and interstellar medium effects [2,3]. The differences between the observed ToAs and the predictions from this timing model are known as timing residuals. These residuals are then carefully analyzed to characterize and mitigate various noise sources, including the frequency-dependent red noise intrinsic to each pulsar and white noise associated with measurement uncertainties [4]. The GWB is anticipated to manifest as an additional stochastic process that is common to all pulsars in the array but exhibits a specific quadrupolar spatial correlation pattern. This distinctive inter-pulsar correlation is described by the Hellings and Downs (HD) curve [5,6,7,8], which predicts the expected correlation coefficient as a function of the angular separation between any pair of pulsars for an isotropic, unpolarized GWB.
Statistical frameworks, predominantly Bayesian inference, are employed to analyze the ensemble of timing residuals. This involves constructing a likelihood function that models the probability of the observed data given a set of parameters describing individual pulsar noise, any common uncorrelated red noise, and the GWB signal (typically parameterized by its amplitude and spectral index) [9,10,11,12,13,14,15,16]. Techniques like Parallel Tempering Markov Chain Monte Carlo (PTMCMC) [17] are often used to explore this parameter space, derive posterior probability distributions for the GWB parameters, and compute Bayes factors to evaluate the statistical evidence for a GWB signal compared to models without it. While the specifics of noise modeling and data handling may differ slightly among PTA collaborations [18], this general approach of analyzing timing residuals, characterizing noise, and searching for the characteristic HD spatial correlations forms the common backbone of GWB detection and characterization efforts.
Recently, PTAs have made significant strides in characterizing the GWB. While early analyses from NANOGrav’s 12.5-year dataset [9] and PPTA DR2 [11] identified a common-spectrum process, definitive HD spatial correlations [5] have remained elusive. Subsequently, multiple PTAs have all reported varying levels of evidence for an HD-correlated GWB. These include ∼4 σ findings from NANOGrav with its 15-year dataset [10] (henceforth the NG15 dataset) and PPTA [13], a ∼3–4 σ signal from EPTA in conjunction with InPTA [12], a 4.6 σ HD-correlated signal from CPTA [14], and 3–3.4 σ evidence from MPTA [15,16]. Despite differing modeling approaches, the GWB parameters measured by these collaborations are largely consistent [18], with the signal predominantly interpreted as arising from supermassive black hole binary mergers (SMBHBs) [1,19].
Several searches for individual SMBHBs have been carried out [20,21,22,23], but a statistically significant detection is yet to be made. Signals from isolated SMBHBs in the PTA band are often called continuous wave (CW) signals due to their long lifetimes that far exceed observational time scales. The statistical problem posed by CW detection differs in a crucial aspect from GWB searches. For CWs, the signal is deterministic and coherent across the PTA, and the primary objective is to identify this specific waveform and sky location. Consequently, unlike GWB analysis, where distinguishing the power spectral density (PSD) of the GWB from intrinsic red noise PSDs is paramount, CW searches benefit from treating both intrinsic red noise and any underlying GWB as a combined noise background that needs to be effectively mitigated or filtered out. Current Bayesian approaches to CW detection often extend the already complex GWB search models by incorporating additional parameters for the CW signal [24,25], leading to an even higher dimensional parameter space and further intensifying the computational burden.
To circumvent this, we propose a novel methodology specifically tailored for CW searches. This approach introduces an explicit technique for filtering out the combined red noise and GWB background, thereby significantly reducing the complexity of the subsequent search for CW signals and offering a computationally efficient pathway to their detection. Our method uses an algorithm called SHAPES (Swarm Heuristics-based Adaptive and Penalized Estimation of Splines), which utilizes an adaptive spline curve fitting method [26], to model and subtract red noise from the data of each pulsar. The SHAPES-based pipeline is computational efficient and scalable, making it well-suited for large PTA datasets.We illustrate the method on NANOGrav data as well as simulated PTA data. With the latter, we conduct a search for an injected signal and demonstrate that the red noise suppression method does not adversely affect the detectability of signals outside the the frequencies dominated by the red noise. Notably, the entire pipeline completed in a few hours, representing a significant reduction in computational cost compared to Bayesian analyses on the same dataset, which typically require tens of hours or more on the same computing platform.
The rest of the paper is organized as follows: in Section 2, we describe the methods used in this work, including the adaptive spline fitting technique for red noise removal. In Section 3, we present the results of our simulations and the performance of our red noise removal algorithm in a single CW search. Finally, in Section 4, we discuss the implications of our findings and potential future work.

2. Methods

In the Bayesian framework, red noise is commonly modeled as a power law [4,20,21,23,24,27,28,29]. This introduces two free parameters for each pulsar—the spectral index (RNIDX) and amplitude (RNAMP)—that must be fitted, thus increasing the computational burden, which scales with the number of pulsars in the PTA. However, in a search for a CW signal under a Bayesian or Likelihood-based Fisherian formalism, the search statistic is composed of inner products of the data with template waveforms that are weighted by the reciprocal of the PSD. This means that the search statistic essentially suppresses the frequencies where the red noise dominates. This situation is similar to that of LIGO data analysis where the red noise originates from ground motion. As in the case of LIGO data analysis, one can take the approach of explicitly filtering out the red noise from PTA data, thereby alleviating the need to fit the red noise parameters. The principal technical problem in implementing this for PTA data analysis is that it is irregularly sampled, unlike LIGO data.
To handle the explicit filtering of red noise from irregularly sampled data, we introduce a novel time-domain approach based on using a method called SHAPES (Swarm Heuristics-based Adaptive and Penalized Estimation of Splines). SHAPES is an implementation in MATLAB of the adaptive spline fitting algorithm described in [26], and has been successfully applied in GW data analysis for glitch subtraction in LIGO data [30]. Operating directly on the residual data, SHAPES models and subtracts red noise without the need for frequency-domain parameterization. The SHAPES method fits data using an adaptive spline, where the knot locations are optimized via Particle Swarm Optimization (PSO) [31,32]. For any given set of knots, the spline is formed as a linear combination of B-spline basis functions [33]. The values of these B-splines are calculated using the de Boor recursion relations, which are inherently unbiased and function correctly with both regularly and irregularly spaced data. However, the current implementation of SHAPES is limited to regularly sampled data. This is because it employs a computationally efficient version of the recursion relations that leverages symmetries only present in uniform sampling. Future work will involve adopting the native form of the de Boor recursions to support irregularly sampled data. To offset the anticipated loss in computational efficiency from this change, the implementation will be migrated from its current MATLAB environment to a compiled language such as C.
For making this paper self-contained, we provide a brief overview of the essential ingredients of SHAPES and refer the reader to [26,30] for the details. The fundamental underlying model for SHAPES posits that the observed data y ¯ is a composite of a true signal s ¯ ( θ ) , with parameters θ and additive white noise ϵ ¯ , mathematically represented as
y ¯ = s ¯ ( θ ) + ϵ ¯ .
In this formulation, y ¯ , s ¯ ( θ ) , and  ϵ ¯ are N-element row vectors, where y ¯ i = y ¯ ( t i ) and s ¯ i ( θ ) = s ¯ ( t i ; θ ) are samples at discrete time points t i (that need not be regularly spaced). Within the SHAPES framework, the signal s ¯ ( t ; θ ) is specifically modeled as a cubic spline, which is a piecewise polynomial of order 4, and can be represented by a linear combination of B-spline functions [33]
s ( t ; θ = { α ¯ , τ ¯ } ) = j = 0 P 5 α j B j , 4 ( t ; τ ¯ ) ,
where B j , 4 ( t ; τ ¯ ) denotes the B-spline basis functions [30], τ ¯ is the vector specifying the knot locations (knots are the boundaries of the polynomial pieces in a spline), and  α ¯ are independent coefficients in the linear combination of the B-splines above. The determination of the knot locations τ ¯ , which are a crucial component of θ , for a given number of knots P, is accomplished using a local-best variant of PSO metaheuristic. To ascertain the optimal number of knots P, SHAPES employs model selection guided by the Akaike Information Criterion (AIC) [34], which aims to find a balance between the model’s goodness-of-fit and its complexity (i.e., the number of knots). For practical implementation, the algorithm typically minimizes the AIC over a finite set of knot numbers. The best-fit parameters α ¯ and τ ¯ are those that minimize a penalized least-squares function:
L λ ( α ¯ , τ ¯ ) = L ( α ¯ , τ ¯ ) + λ R ( α ¯ ) , L ( α ¯ , τ ¯ ) = i = 0 N 1 y i s i ( α ¯ , τ ¯ ) 2 ,
with the penalty term defined as
R ( α ¯ ) = j = 0 P 5 α j 2 ,
The user-specified parameter λ , called the penalty gain, governs the smoothness of the resulting spline estimate. A key feature of SHAPES is that knots can be collapsed to have higher multiplicity, allowing discontinuities to be fitted along with the smooth parts automatically.
The procedure for red noise removal from the pulsar timing residuals is detailed in the following steps:
  • Uniform Sampling and Initial Estimation: For each pulsar, the irregularly sampled timing residuals are initially converted into a uniformly sampled sequence via interpolation based on their observation epochs. This uniform sequence is then processed using the SHAPES algorithm to obtain a preliminary estimate of the residuals.
  • Reversion to Original Cadence: The estimates generated by SHAPES on the uniform grid are interpolated back to the original, non-uniform observation epochs of each pulsar. This step yields estimates that align precisely with the original data points.
  • Low-Pass Filtering: The resulting SHAPES estimates is low-pass filtered to isolate the low-frequency noise components. This is accomplished using a zero-phase digital filter implemented with the filtfilt function in MATLAB, which ensures that the filtering process introduces no phase distortion. A cutoff frequency of 2 × 10 8 Hz is utilized. The order of the filter is determined for each pulsar separately by the formula floor ( nSample / R 1 ) , where nSample is the number of data points and the hyperparameter R is introduced to satisfy the minimum data length requirement of the filter. An optimal value of R = 8 was selected empirically for this study.
  • Noise Subtraction: In the final step, the low-pass filtered SHAPES estimates, representing the extracted red noise, are subtracted from the original timing residuals.
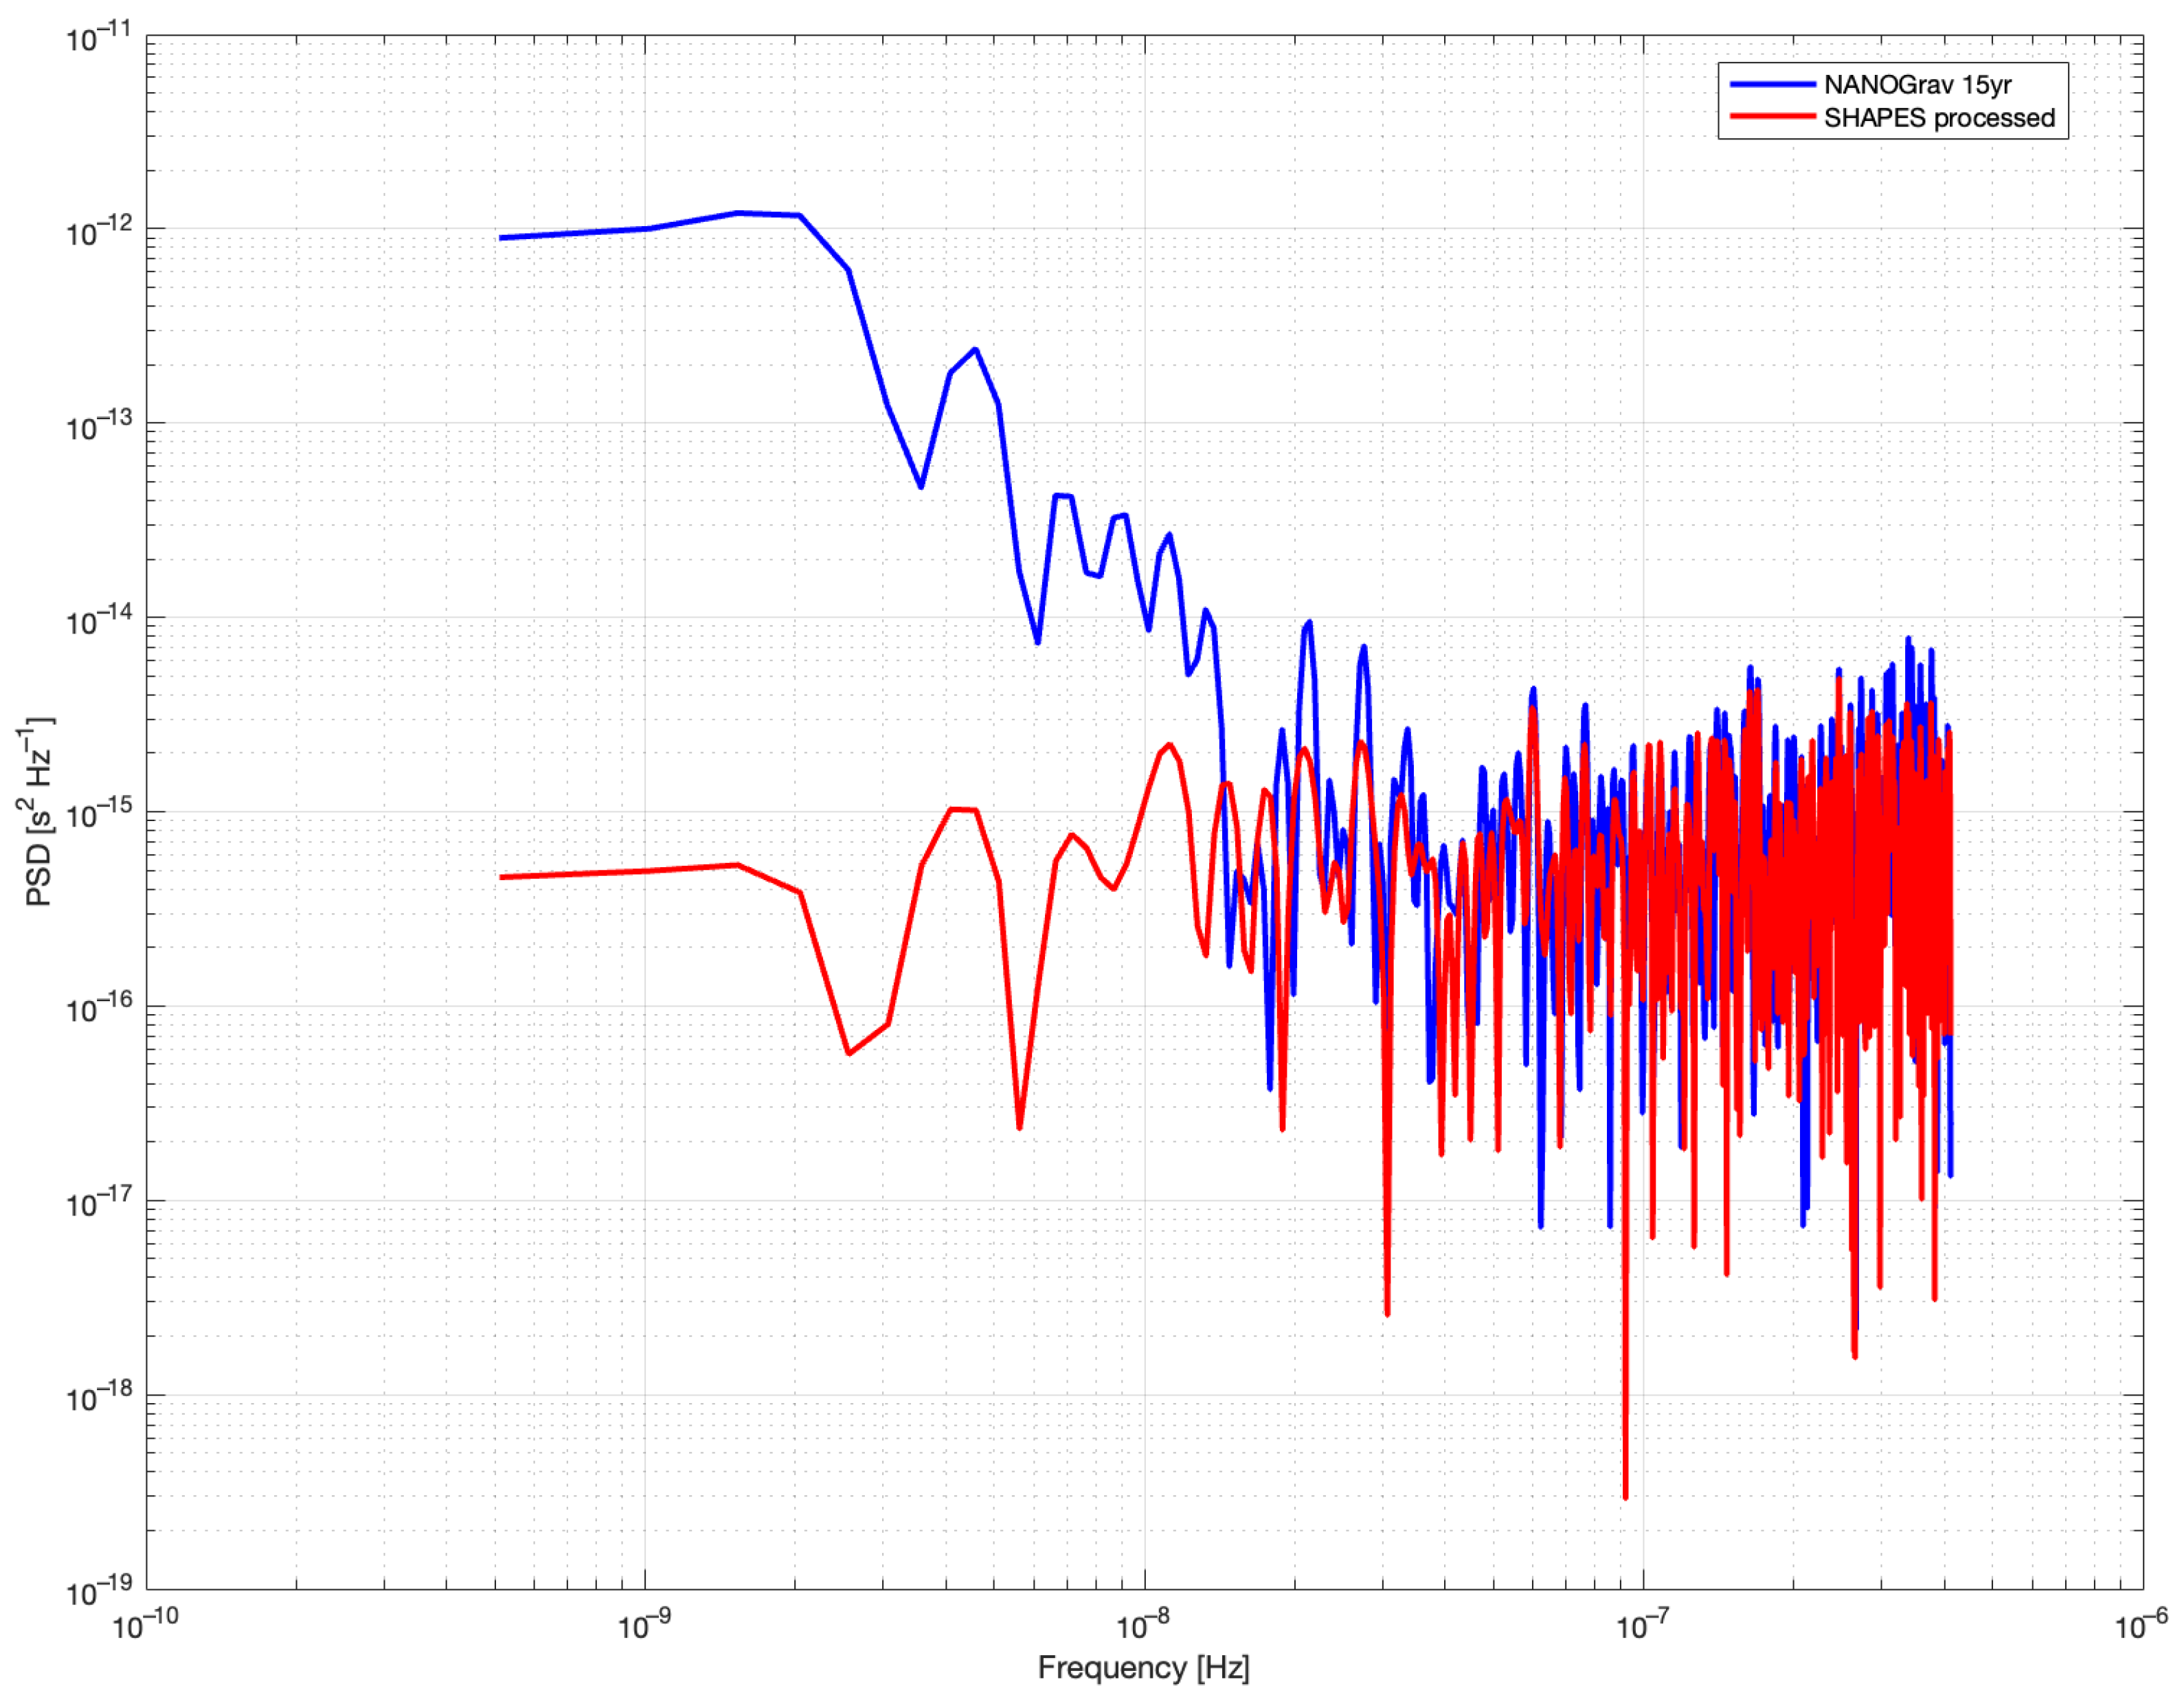
The performance of the SHAPES algorithm was evaluated using observational data from the NG15 dataset for pulsar PSR J1909-3744. The efficacy of this method in suppressing intrinsic red noise is illustrated in Figure 1, which depicts the original NG15 data, the SHAPES estimates, and the resulting timing residuals. The data was processed with a Finite Impulse Response (FIR) low-pass filter with a cutoff frequency at 20 nHz. This specific value was chosen strategically for the purposes of this proof-of-concept study. Our primary objective here was to validate the algorithm’s performance by recovering a simulated CW signal injected into the data at a known frequency of 26 nHz. Therefore, selecting a cutoff at 20 nHz ensures that the filter characterizes the red noise without attenuating the target signal of interest. We acknowledge that a single, fixed cutoff frequency is suboptimal for a blind search in real observational data where signal parameters are unknown a priori. In such a scenario, a more sophisticated, data-driven approach is required. The optimal cutoff frequency should be determined adaptively for each pulsar, likely based on an analysis of its PSD. The development of such an adaptive filtering strategy is a key objective for our future work involving searches in real pulsar timing data. Figure 2 shows the Lomb–Scargle Periodogram (LSP) [35] of the data and residual after subtraction of the red noise estimate. It corroborates the effectiveness of this approach, as the power of the red noise below 3 × 10 9 Hz is suppressed by approximately three orders of magnitude.

3. Results

We use PINT, which is an open-source Python alternative to the pulsar timing package TEMPO2 [36,37,38], to simulate realistic timing residuals. The simulations are based on the NG15 data [39], which includes observations of 68 pulsars over a span of more than 15 years. Among these pulsars, 23 were found to have detectable levels of red noise. While most of the 68 pulsars are observed at an approximately monthly cadence, 6 of the highest-precision pulsars benefit from additional high-cadence observations performed roughly every five days. The released data is composed of two parts: (1) the observed ToAs for each pulsar, stored in files that are called tim files, and (2) the timing model for each pulsar, stored in files called par files. Here, we use the par files from the released data in PINT to obtain simulated realizations of timing residual noise for each pulsr. The simulation includes the following steps:
  • Within the observation duration for each pulsar as given in its par file, create a sequence of regularly spaced observation epochs with 14 days cadence. This is followed by the addition of a 3-day random shift to each epoch to form a sequence of irregularly sampled epochs. The random shift is drawn from an uniform distribution.
  • Using PINT, a noise realization for each pulsar is generated using its irregularly spaced sequence of observation epochs. For this, we set the timing uncertainty (i.e., the white noise standard deviation) for all pulsars to 100 ns, and set the intrinsic red noise PSD according to each pulsar’s par file.
  • A CW signal, as described below, is injected into the simulated noise.
We consider the simplest type of a CW signal, namely, one that is emitted by an unevolving and circular orbit SMBHBs. The timing residual S I ( t ; θ ) induced by such a source for the I’th pulsar in the PTA is given by [40]
s I ( t ; θ ) = 0 t d t z I ( t ; θ ) ,
where z I ( t ; θ ) ( ν I ( t ; θ ) ν 0 I ) / ν 0 I is the GW-induced Doppler shift, given by the difference between the frequency of the radio pulses observed at the Solar System Barycenter (SSB), ν I ( t ; θ ) and the rest frame of the pulsar, ν 0 I . For a plane GW traveling across the Earth-pulsar line of sight, originating from a source positioned in equatorial coordinates with right ascension α and declination δ , the function z ( t ; θ ) can be represented as
z I ( t ; θ ) = A = + , × F A I ( α , δ ) Δ h A ( t ; θ s ) ,
where θ = { α , δ } θ s and F + , × I ( α , δ ) are the antenna pattern functions for the + and × polarizations of the GW [41,42]. The two–pulse response [43],
Δ h + , × ( t ; θ s ) = h + , × ( t ; θ s ) h + , × ( t κ I ; θ s ) .
It includes the so-called Earth and pulsar terms that result from the influence of gravitational waves on the pulses at the times t and t κ I , corresponding to their reception and emission, respectively. The time delay κ I can be considered an unknown constant phase offset, referred to as the pulsar phase parameter ϕ I , for a non-evolving source.
The injected signal in our simulation has monochromatic h + and h x with an unevolving frequency of 2.63 × 10 8 Hz and a network SNR around 57. Here, the network SNR is defined as
SNR = I = 1 N p ρ I 2 1 / 2 , ρ I = ( r I ) T · C 1 · r I ,
where ρ I and r I are the per-pulsar SNR and timing residuals for Ith pulsar, and C is the noise covariance matrix.
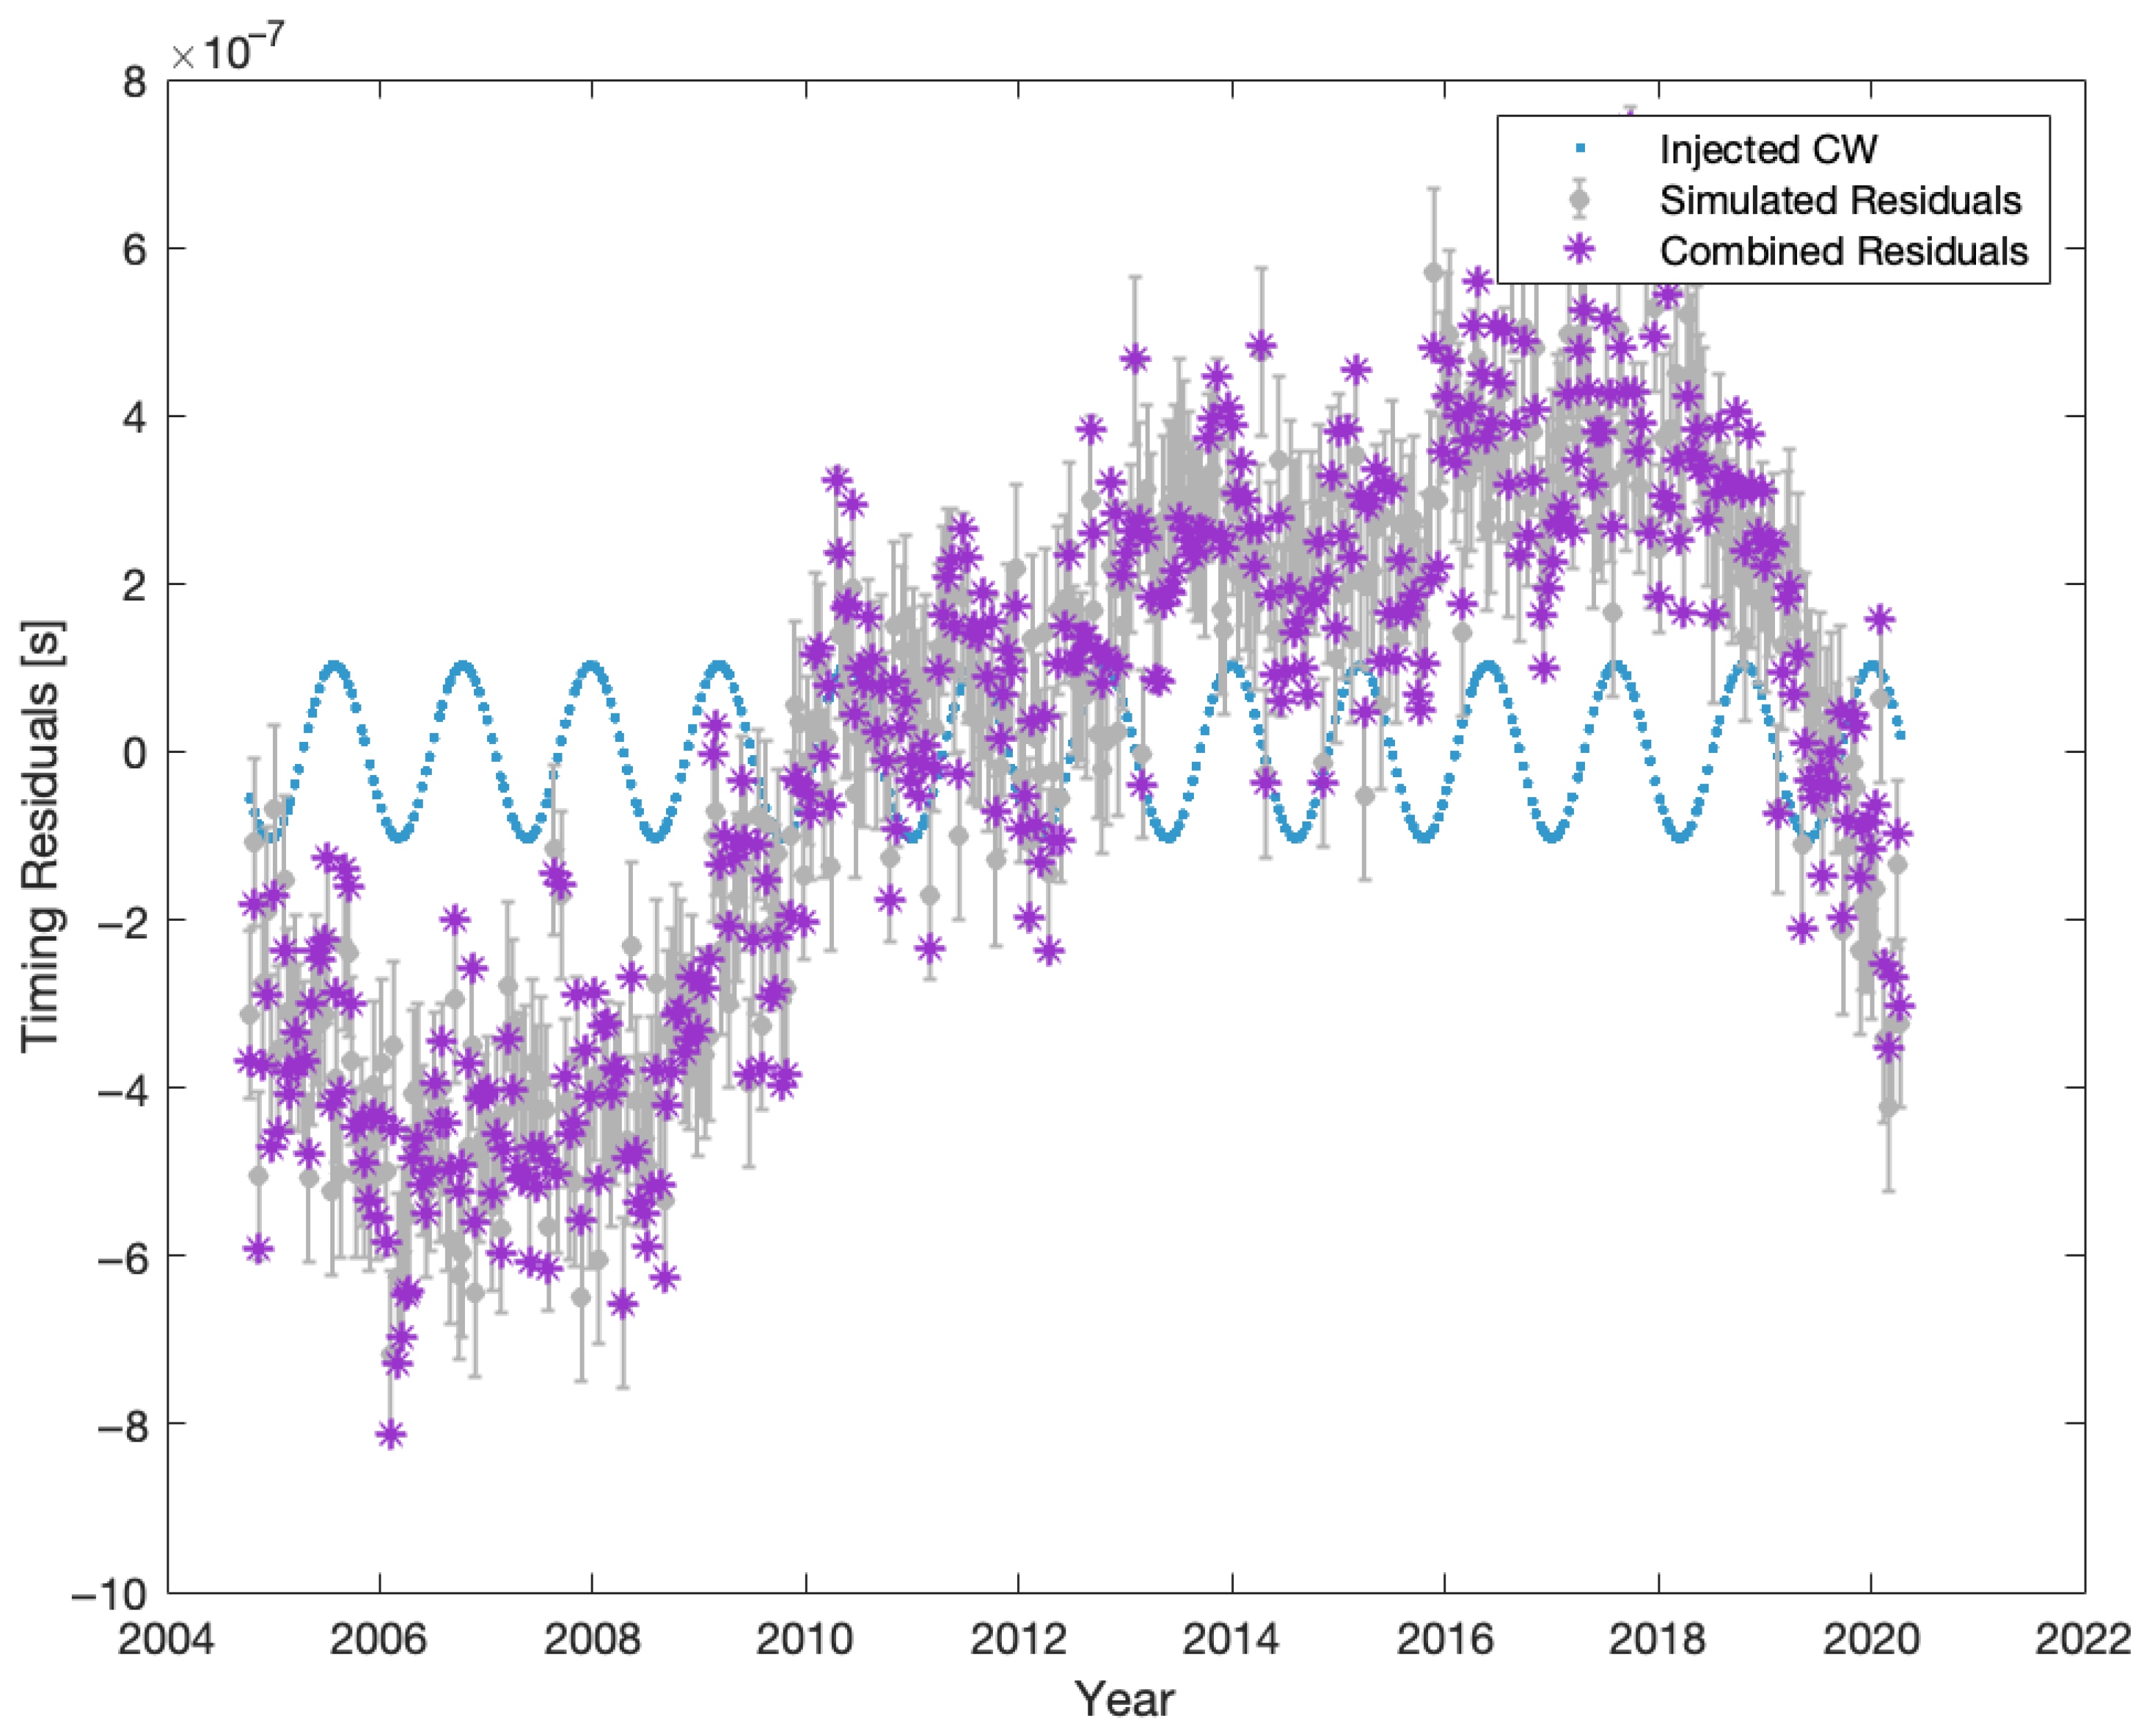
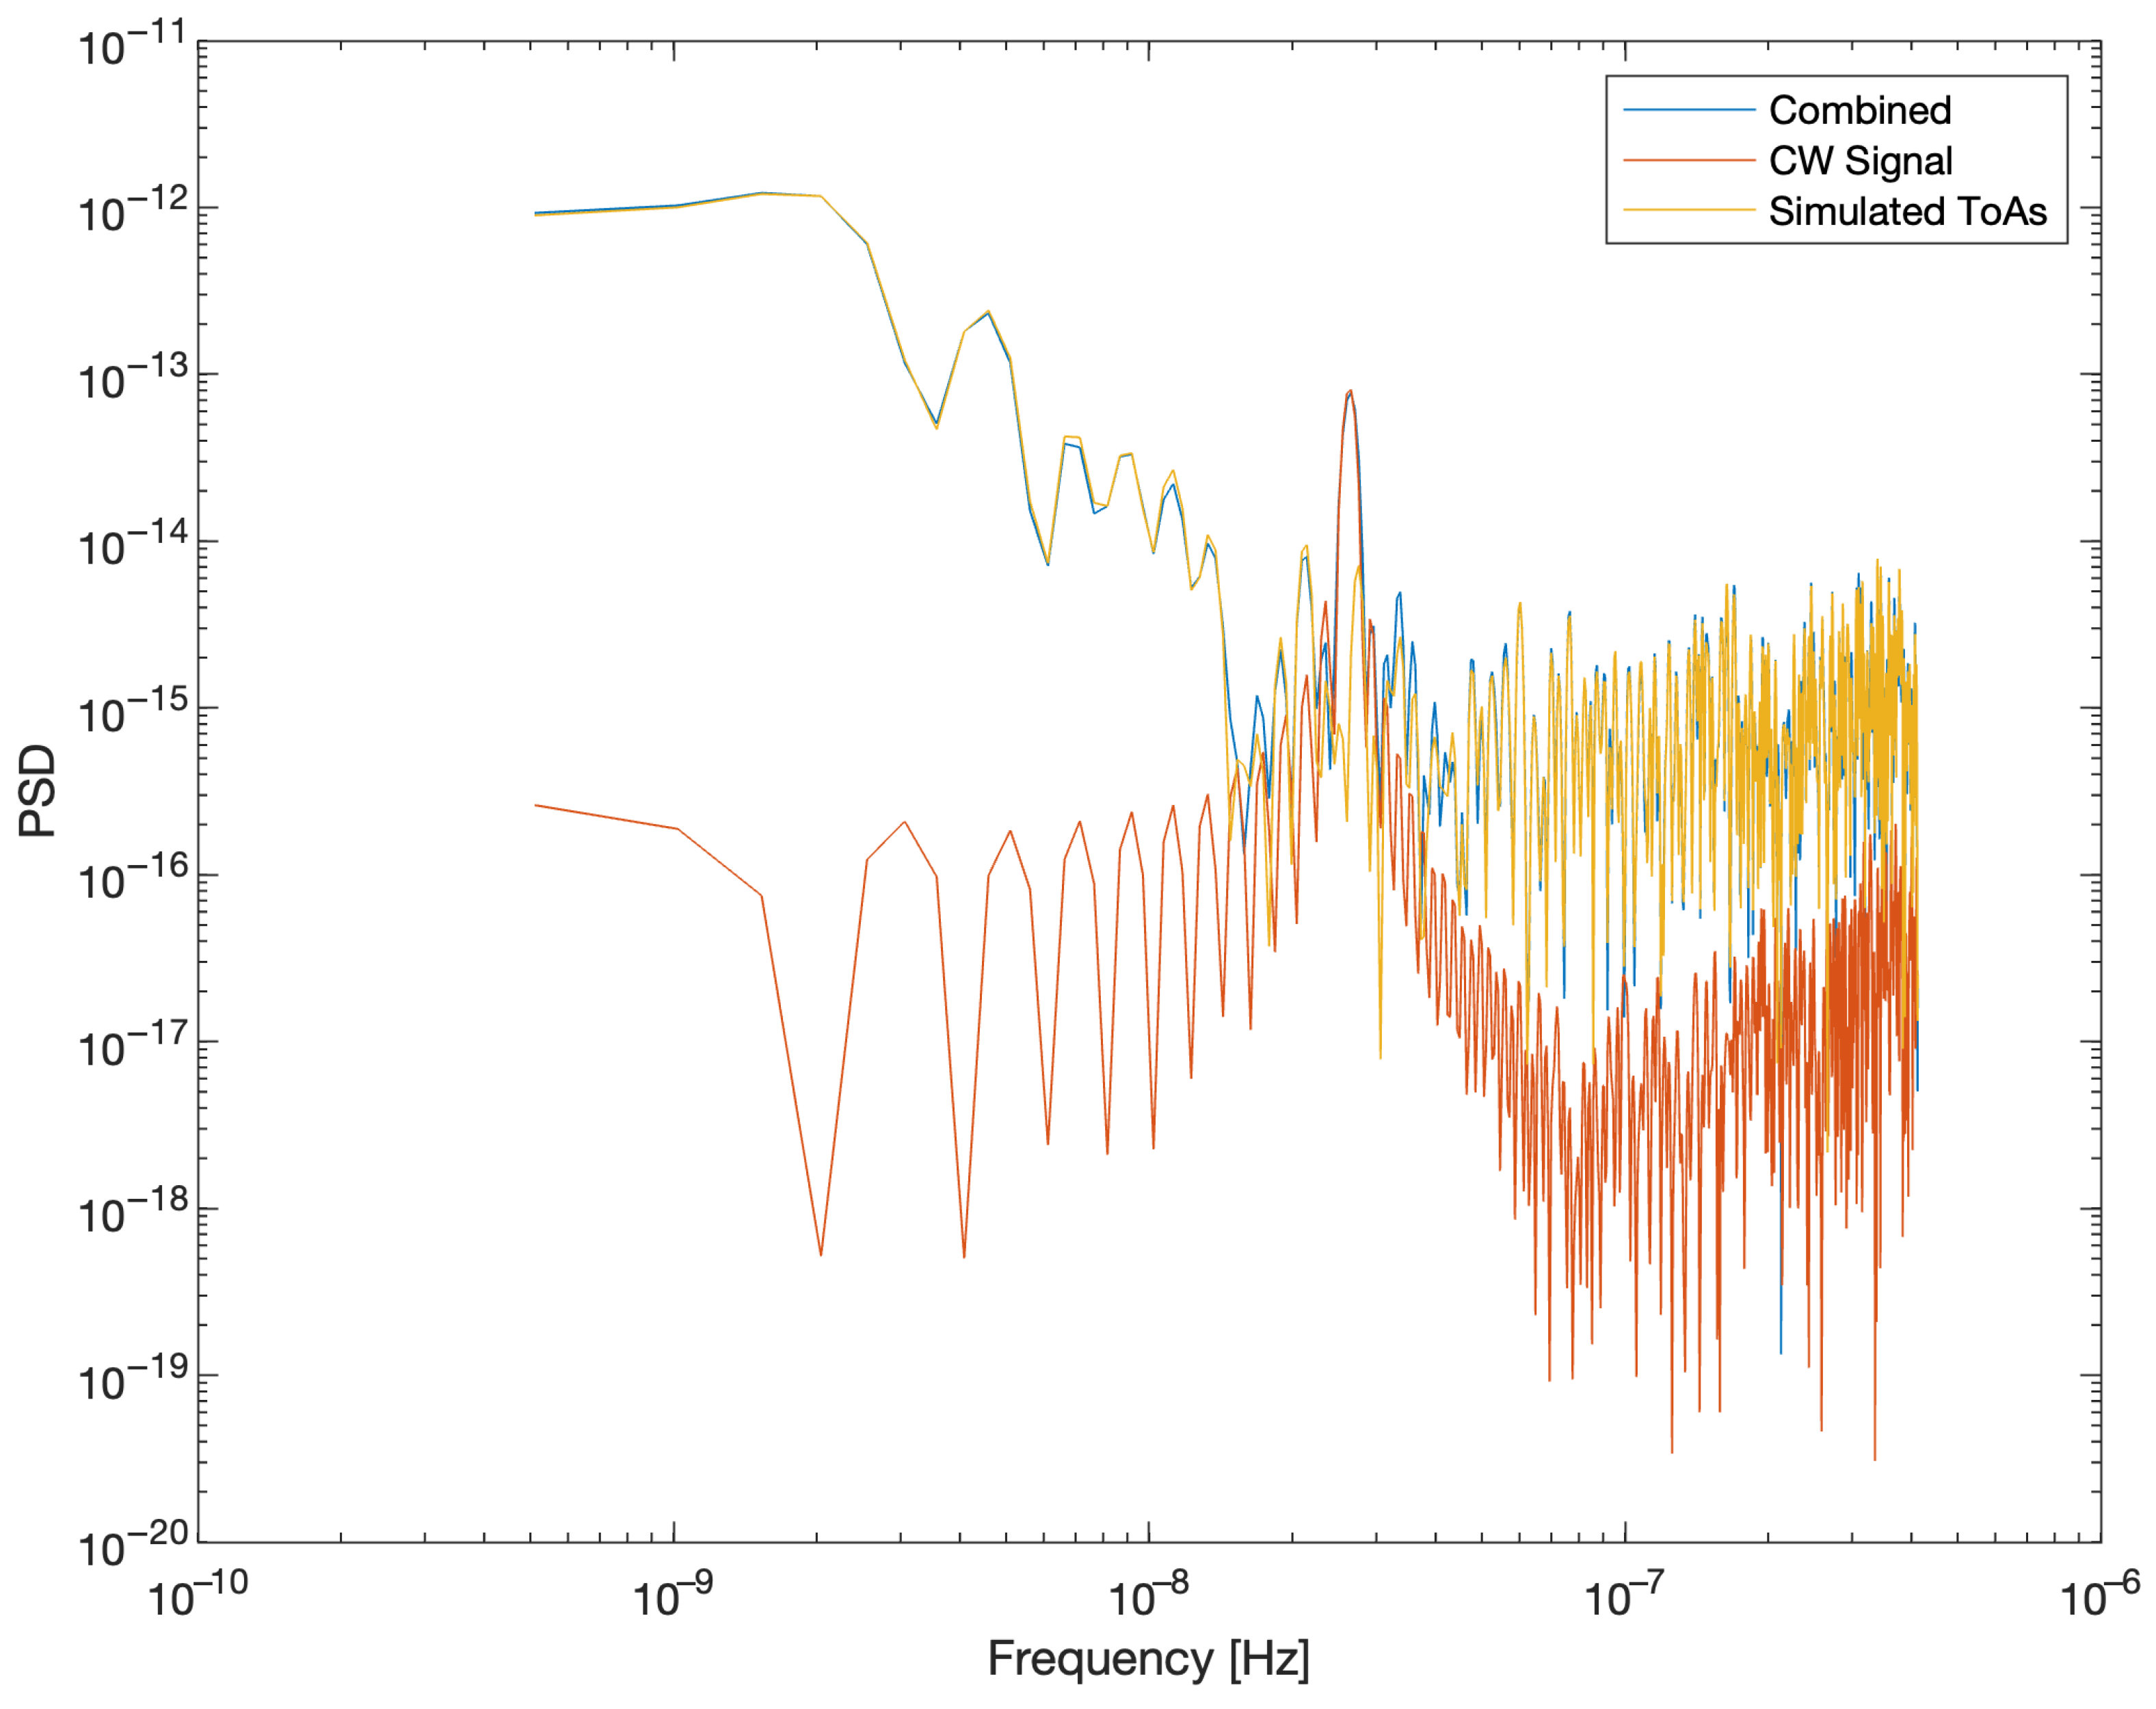
The NG15 data release encompasses timing observations of 68 pulsars, and its total observational baseline spans 15 years, measured from the earliest to the latest observation time across the entire pulsar array. Among these pulsars, 23 exhibit statistically significant red noise. Taking PSR J1909-3744 as an example, Figure 3 shows the simulated timing residuals in which the injected CW signal described above is added to the PINT simulated noise. We also analyze the timing residuals using the LSP as shown in Figure 4. This clearly shows the very strong red noise power in the low frequency range 4 × 10 9  Hz, and the peak arising from the injected signal at 2.63 × 10 8  Hz.
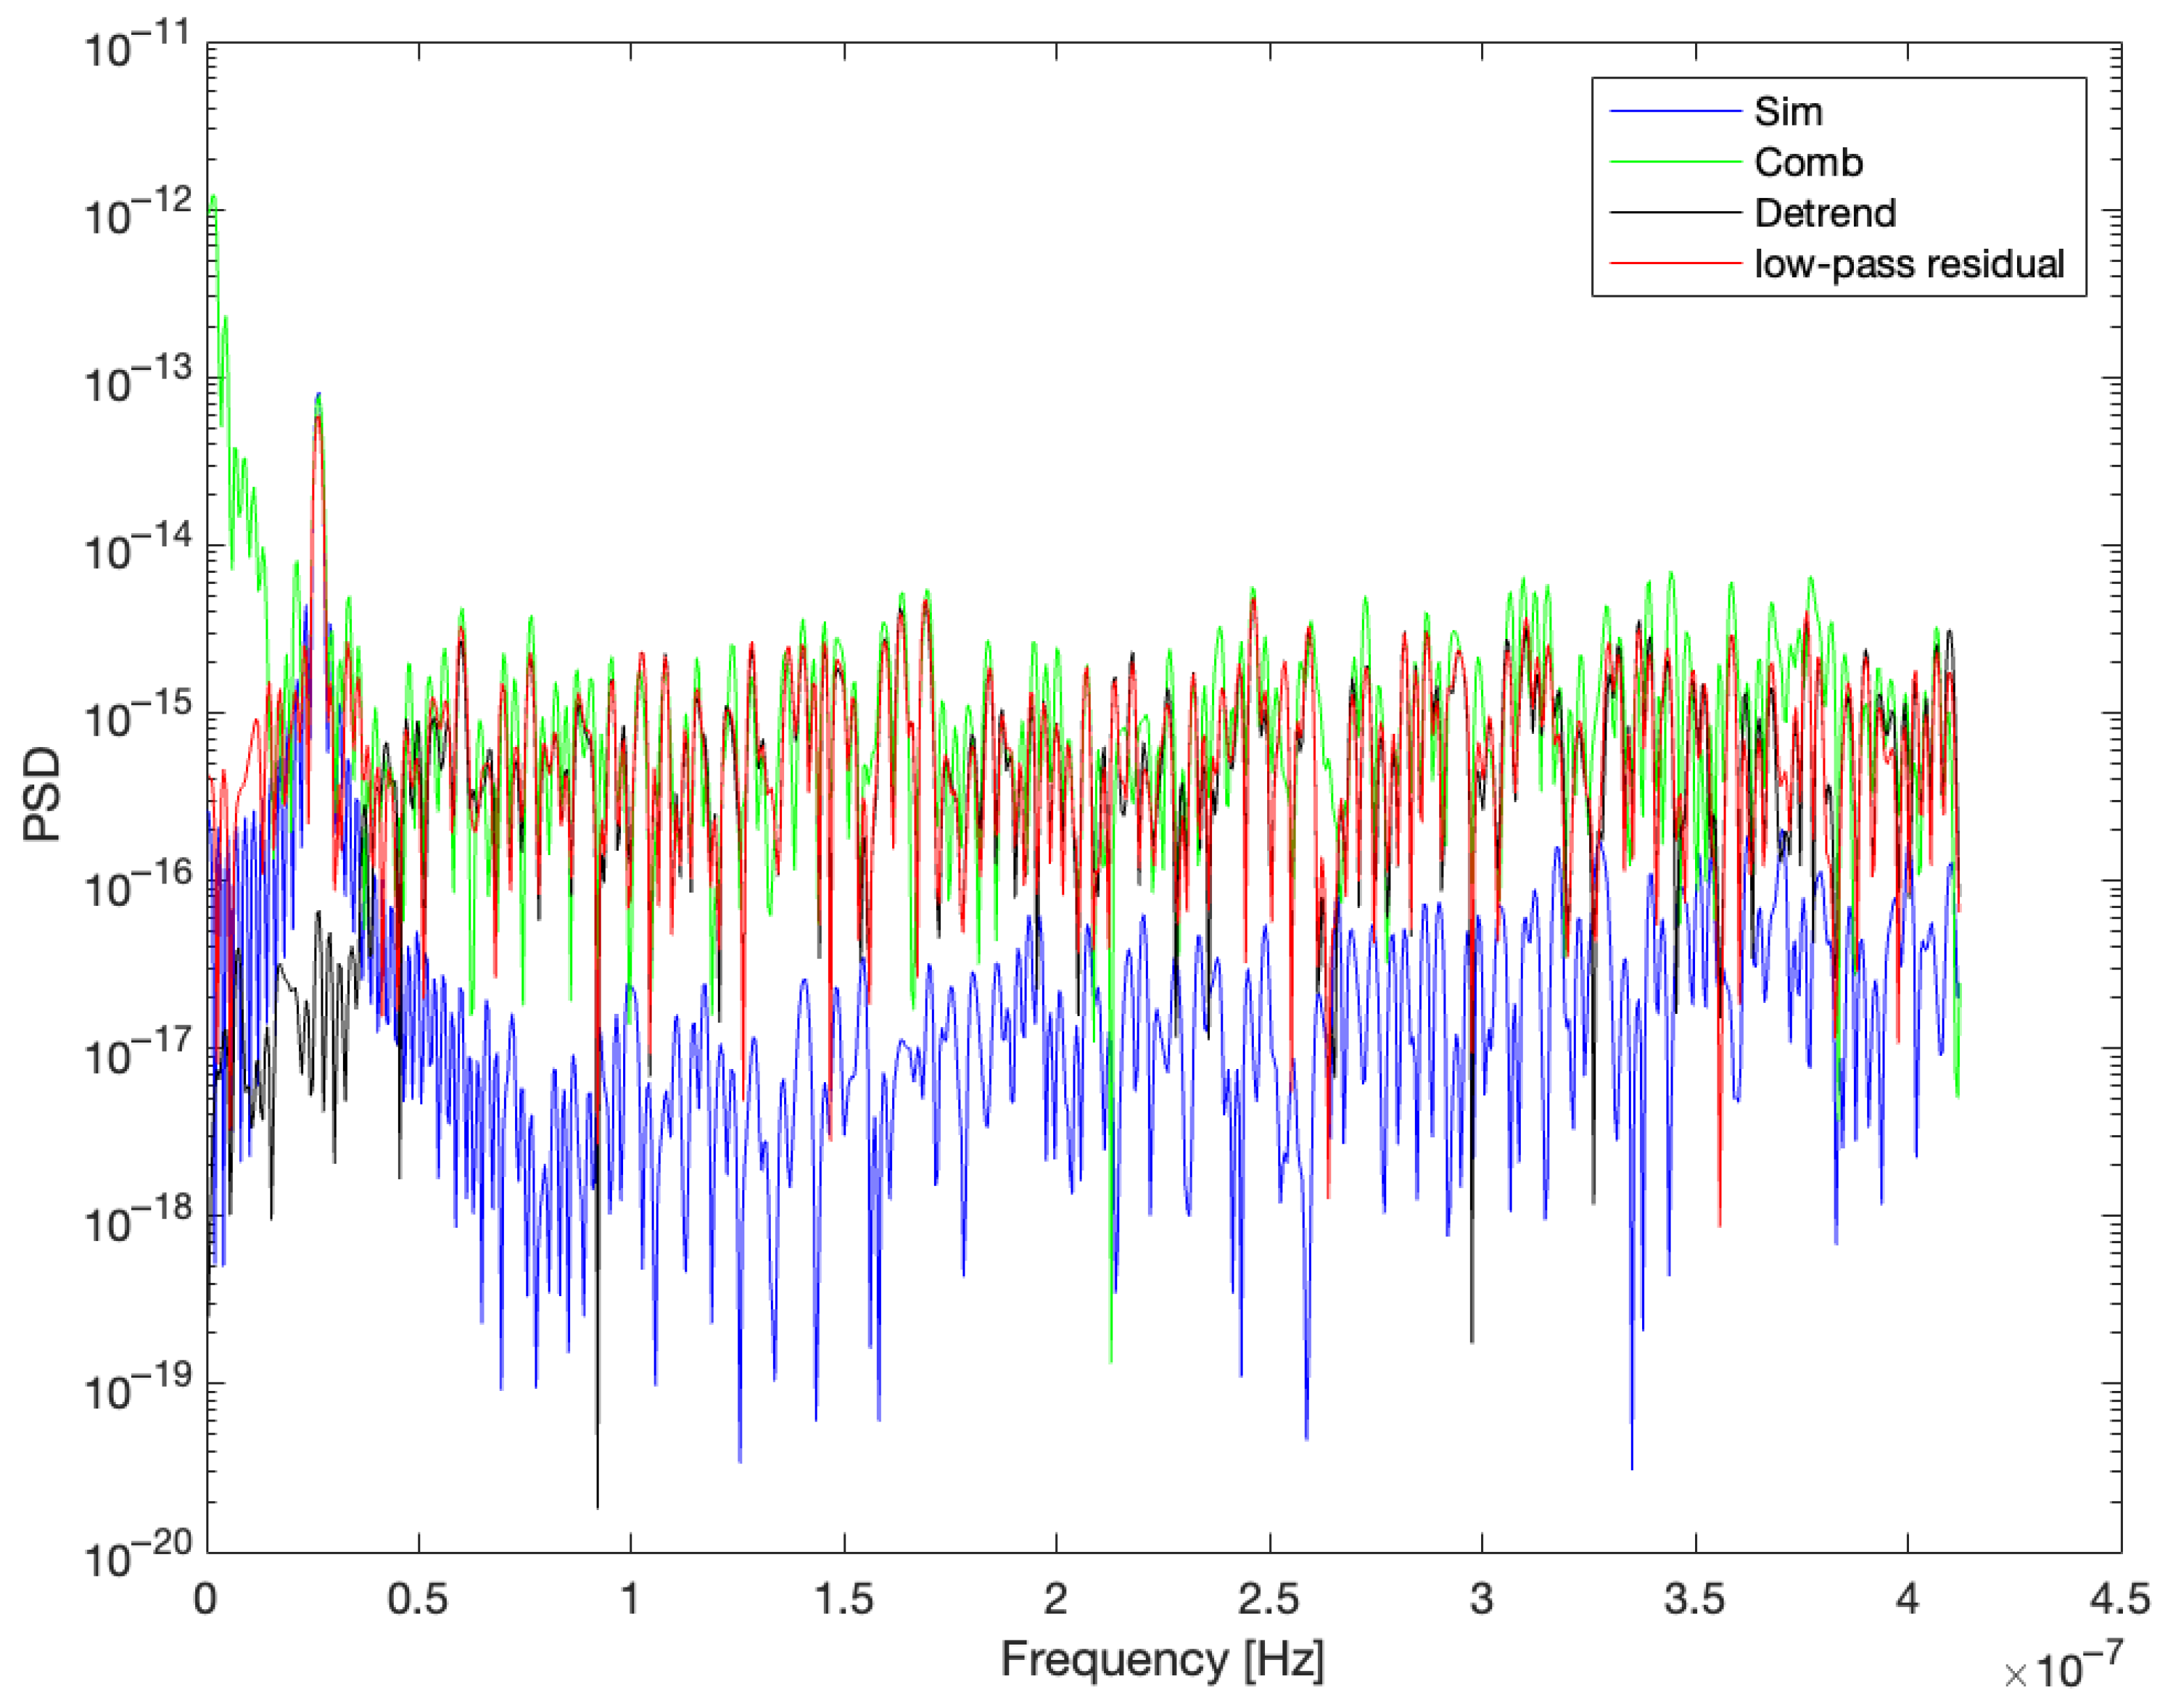
Figure 5 shows the LSP for the injected CW signal, the combined residuals, and the residuals obtained after subtracting the SHAPES estimates from the combined residuals, both with and without low-pass filtering. It demonstrates that subtracting the SHAPES estimates without low-pass filtering may result in a loss of power in the injected signal. If we first low-pass filter the SHAPES estimates with a cutoff frequency slightly below that of the injected CW signal, and then subtract it, we can preserve most of the signal’s power while still achieving effective noise suppression at lower frequencies.
Having prepared the red noise suppressed residuals as described above, we use an algorithm introduced in [42,44,45,46] with a pulsar selection scheme [47] to perform a single source search in our simulated dataset. Here, we briefly review the essential features of the search algorithm. The algorithm uses a likelihood-based approach that fully accounts for both the Earth and pulsar terms in the signal model. For a Pulsar Timing Array, the timing residual data for the I-th pulsar is modeled as y ¯ I = s ¯ I ( θ ) + n ¯ I + e ¯ I , where s ¯ I ( θ ) is the GW-induced signal characterized by the set of parameters θ and n ¯ I is a realization of the noise associated with the ToAs, while e ¯ I is the error rising from fitting ToAs to the timing model, and it is typically expressed as e ¯ I = M I δ p I , where M I is the design matrix used in the fitting procedure, and  δ p I represents the differences between the best-fit and the true parameters [37]. The source parameters θ are divided into 7 intrinsic parameters (GW frequency, sky location (RA, DEC), GW amplitude, inclination angle, GW polarization angle and orbital initial phase) and extrinsic parameters, which are the unknown pulsar phase parameters ϕ I for each pulsar. To efficiently handle these parameters, we utilizes a hybrid method called MaxAvPhase, which combines two complementary algorithms: AvPhase and MaxPhase. First, AvPhase is employed to estimate the intrinsic parameters by maximizing a marginalized likelihood, where the pulsar phases ϕ I have been integrated out. This step is guided by the Marginalized-Maximized Likelihood Ratio Test (MMLRT) statistic, defined as
MMLRT ( Y ) = max λ i ln ( marg λ e Λ ( Y ; λ ) ) .
Subsequently, with the intrinsic parameters fixed to the values found by AvPhase, the extrinsic parameter estimation step of MaxPhase is applied to obtain point estimates for the pulsar phases ϕ I . This combined strategy leverages the robust intrinsic parameter estimation of AvPhase, especially at lower SNR [46], while still providing the complete set of parameter estimates needed to reconstruct the signal waveform. In this study, we inject an SNR 57 CW signal with a frequency of 2.63 × 10 8 Hz, very close to our chosen low-pass filter cutoff frequency of 20 nHz. The signal is detected successfully using our pipeline once the red noise is filtered out using our SHAPES-based method. In terms of parameter estimation, the search achieves a 29.05% relative SNR error and a 0.44% relative frequency error. The SHAPES code will be adapted to irregularly sampled data, thereby eliminating one non-essential step from our method.

4. Conclusions

In this work, we introduced a novel approach for mitigating red noise in individual pulsar ToAs, offering an alternative to computationally expensive Bayesian methods. Our technique employs adaptive spline curve fitting in the time domain to estimate and remove red noise without requiring explicit frequency-domain models or global fitting procedures. We demonstrated the efficacy of this method on the NG15 dataset for PSR J1909-3744 which shows a substantial suppression of the power of red noise below 3 × 10 9 Hz and performed a CW search on a synthetic PTA data based on the NG15 data. Our pipeline successfully suppressed the red noise while preserving the signal, enabling its detection with a relative SNR error of 29.05% and a frequency error of 0.44%.
The computational efficiency of this framework is a key advantage. For context, the analysis presented in this paper required only several hours of processing time, a stark contrast to the 2–3 days typically necessary for a comparable analysis using traditional Bayesian methods. This dramatic speed-up shows significant promise for accelerating searches for continuous gravitational waves in large datasets.
Building on these results, we are preparing a comprehensive follow-up study dedicated to performance benchmarking. This subsequent paper will provide a detailed comparison of the method’s processing times against traditional Bayesian methods. It will also include a rigorous analysis of detection statistics to fully quantify the method’s reliability. While such an extensive analysis is beyond the scope of this introductory paper, we believe it is a crucial next step that will provide a valuable, quantitative resource for researchers at the forefront of gravitational wave astronomy.

Author Contributions

Conceptualization, methodology, software, validation, formal analysis, investigation, Y.-Q.Q., Y.W. and S.D.M.; data curation, writing—original draft preparation, Y.-Q.Q.; writing—review and editing, Y.-Q.Q., Y.W. and S.D.M.; and supervision, Y.W. and S.D.M. All authors have read and agreed to the published version of the manuscript.

Funding

Y.W. gratefully acknowledges support from the National Key Research and Development Program of China (No. 2022YFC2205201 and No. 2023YFC2206702), and Major Science and Technology Program of Xinjiang Uygur Autonomous Region (No. 2022A03013-4).

Data Availability Statement

The data that support the results of this article are openly available at https://zenodo.org/records/15845827.

Acknowledgments

The authors thank the anonymous referees for helpful comments and suggestions. We acknowledge the High Performance Computing Platform at Huazhong University of Science and Technology for providing computational resources.

Conflicts of Interest

The authors declare no conflicts of interest.

Abbreviations

The following abbreviations are used in this manuscript:
PTAPulsar Timing Array
CWContinuous Wave
GWBGravitational Wave Background
HDHellings-Downs Curve
SMBHBSupermassive Black Hole Binaries
MSPMillisecond Pulsar
PTMCMCParallel Tempering Markov Chain Monte Carlo
PSDPower Spectral Density
SHAPESSwarm Heuristics-based Adaptive and Penalized Estimation of Splines
NANOGravNorth American Nanohertz Observatory for Gravitational Waves
PPTAParkes Pulsar Timing Array
EPTAEuropean Pulsar Timing Array
InPTAIndia Pulsar Timing Array
MPTAMeerTime Pulsar Timing Array
CPTAChinese Pulsar Timing Array
SNRSignal-to-Noise Ratio
SSBSolar System Barycenter
LSPLomb–Scargle Periodogram
AICAkaike Information Criterion

References

  1. Burke-Spolaor, S.; Taylor, S.R.; Charisi, M.; Dolch, T.; Hazboun, J.S.; Holgado, A.M.; Kelley, L.Z.; Lazio, T.J.W.; Madison, D.R.; McMann, N.; et al. The Astrophysics of Nanohertz Gravitational Waves. Astron. Astrophys. Rev. 2019, 27, 5. [Google Scholar] [CrossRef]
  2. Demorest, P.B. Measuring the Gravitational Wave Background Using Precision Pulsar Timing. Ph.D. Thesis, University of California, Berkeley, CA, USA, 2007. [Google Scholar]
  3. Lyne, A.; Graham-Smith, F. Pulsar Astronomy, 4th ed.; Cambridge Astrophysics, Cambridge University Press: Cambridge, UK, 2012. [Google Scholar]
  4. Agazie, G.; Anumarlapudi, A.; Archibald, A.M.; Arzoumanian, Z.; Baker, P.T.; Bécsy, B.; Blecha, L.; Brazier, A.; Brook, P.R.; Burke-Spolaor, S.; et al. The NANOGrav 15 Yr Data Set: Detector Characterization and Noise Budget. Astrophys. J. Lett. 2023, 951, L10. [Google Scholar] [CrossRef]
  5. Hellings, R.W.; Downs, G.S. Upper Limits on the Isotropic Gravitational Radiation Background from Pulsar Timing Analysis. Astrophys. J. 1983, 265, L39. [Google Scholar] [CrossRef]
  6. Allen, B. Variance of the Hellings-Downs Correlation. Phys. Rev. D 2023, 107, 043018. [Google Scholar] [CrossRef]
  7. Allen, B.; Romano, J.D. Hellings and Downs Correlation of an Arbitrary Set of Pulsars. Phys. Rev. D 2023, 108, 043026. [Google Scholar] [CrossRef]
  8. Allen, B.; Romano, J.D. Optimal Reconstruction of the Hellings and Downs Correlation. Phys. Rev. Lett. 2025, 134, 031401. [Google Scholar] [CrossRef]
  9. Arzoumanian, Z.; Baker, P.T.; Blumer, H.; Bécsy, B.; Brazier, A.; Brook, P.R.; Burke-Spolaor, S.; Chatterjee, S.; Chen, S.; Cordes, J.M.; et al. The NANOGrav 12.5 Yr Data Set: Search for an Isotropic Stochastic Gravitational-wave Background. Astrophys. J. Lett. 2020, 905, L34. [Google Scholar] [CrossRef]
  10. Agazie, G.; Anumarlapudi, A.; Archibald, A.M.; Arzoumanian, Z.; Baker, P.T.; Bécsy, B.; Blecha, L.; Brazier, A.; Brook, P.R.; Burke-Spolaor, S.; et al. The NANOGrav 15-Year Data Set: Search for Anisotropy in the Gravitational-Wave Background. arXiv 2023, arXiv:2306.16221. [Google Scholar] [CrossRef]
  11. Goncharov, B.; Shannon, R.M.; Reardon, D.J.; Hobbs, G.; Zic, A.; Bailes, M.; Curylo, M.; Dai, S.; Kerr, M.; Lower, M.E.; et al. On the Evidence for a Common-spectrum Process in the Search for the Nanohertz Gravitational-wave Background with the Parkes Pulsar Timing Array. Astrophys. J. Lett. 2021, 917, L19. [Google Scholar] [CrossRef]
  12. Antoniadis, J.; Arumugam, P.; Arumugam, S.; Babak, S.; Bagchi, M.; Nielsen, A.S.B.; Bassa, C.G.; Bathula, A.; Berthereau, A.; Bonetti, M.; et al. The Second Data Release from the European Pulsar Timing Array—III. Search for Gravitational Wave Signals. Astron. Astrophys. 2023, 678, A50. [Google Scholar] [CrossRef]
  13. Reardon, D.J.; Zic, A.; Shannon, R.M.; Hobbs, G.B.; Bailes, M.; Marco, V.D.; Kapur, A.; Rogers, A.F.; Thrane, E.; Askew, J.; et al. Search for an Isotropic Gravitational-wave Background with the Parkes Pulsar Timing Array. Astrophys. J. Lett. 2023, 951, L6. [Google Scholar] [CrossRef]
  14. Xu, H.; Chen, S.; Guo, Y.; Jiang, J.; Wang, B.; Xu, J.; Xue, Z.; Caballero, R.N.; Yuan, J.; Xu, Y.; et al. Searching for the Nano-Hertz Stochastic Gravitational Wave Background with the Chinese Pulsar Timing Array Data Release I. Res. Astron. Astrophys. 2023, 23, 075024. [Google Scholar] [CrossRef]
  15. Miles, M.T.; Shannon, R.M.; Bailes, M.; Reardon, D.J.; Keith, M.J.; Cameron, A.D.; Parthasarathy, A.; Shamohammadi, M.; Spiewak, R.; van Straten, W.; et al. The MeerKAT Pulsar Timing Array: First Data Release. Mon. Not. R. Astron. Soc. 2023, 519, 3976–3991. [Google Scholar] [CrossRef]
  16. Miles, M.T.; Shannon, R.M.; Reardon, D.J.; Bailes, M.; Champion, D.J.; Geyer, M.; Gitika, P.; Grunthal, K.; Keith, M.J.; Kramer, M.; et al. The MeerKAT Pulsar Timing Array: The 4.5-Yr Data Release and the Noise and Stochastic Signals of the Millisecond Pulsar Population. Mon. Not. R. Astron. Soc. 2024, 536, 1467–1488. [Google Scholar] [CrossRef]
  17. Ellis, J.; van Haasteren, R. jellis18/PTMCMCSampler: Official Release. 2017. Available online: https://academic.oup.com/mnras/article/536/2/1467/7912547 (accessed on 6 February 2025).
  18. Agazie, G.; Antoniadis, J.; Anumarlapudi, A.; Archibald, A.M.; Arumugam, P.; Arumugam, S.; Arzoumanian, Z.; Askew, J.; Babak, S.; Bagchi, M.; et al. Comparing Recent PTA Results on the Nanohertz Stochastic Gravitational Wave Background. arXiv 2023, arXiv:2309.00693. [Google Scholar] [CrossRef]
  19. Hobbs, G.; Dai, S. Gravitational Wave Research Using Pulsar Timing Arrays. Natl. Sci. Rev. 2017, 4, 707–717. [Google Scholar] [CrossRef]
  20. Antoniadis, J.; Arumugam, P.; Arumugam, S.; Babak, S.; Bagchi, M.; Nielsen, A.S.B.; Bassa, C.G.; Bathula, A.; Berthereau, A.; Bonetti, M.; et al. The Second Data Release from the European Pulsar Timing Array V. Search for Continuous Gravitational Wave Signals. Astron. Astrophys. 2024, 690, A118. [Google Scholar] [CrossRef]
  21. Falxa, M.; Babak, S.; Baker, P.T.; Bécsy, B.; Chalumeau, A.; Chen, S.; Chen, Z.; Cornish, N.J.; Guillemot, L.; Hazboun, J.S.; et al. Searching for Continuous Gravitational Waves in the Second Data Release of the International Pulsar Timing Array. Mon. Not. R. Astron. Soc. 2023, 521, 5077–5086. [Google Scholar] [CrossRef]
  22. Arzoumanian, Z.; Baker, P.T.; Blecha, L.; Blumer, H.; Brazier, A.; Brook, P.R.; Burke-Spolaor, S.; Bécsy, B.; Casey-Clyde, J.A.; Charisi, M.; et al. The NANOGrav 12.5-Year Data Set: Bayesian Limits on Gravitational Waves from Individual Supermassive Black Hole Binaries. arXiv 2023, arXiv:2301.03608. [Google Scholar] [CrossRef]
  23. Agazie, G.; Anumarlapudi, A.; Archibald, A.M.; Arzoumanian, Z.; Baker, P.T.; Bécsy, B.; Blecha, L.; Brazier, A.; Brook, P.R.; Burke-Spolaor, S.; et al. The NANOGrav 15 Yr Data Set: Bayesian Limits on Gravitational Waves from Individual Supermassive Black Hole Binaries. Astrophys. J. Lett. 2023, 951, L50. [Google Scholar] [CrossRef]
  24. Bécsy, B.; Cornish, N.J.; Digman, M.C. Fast Bayesian Analysis of Individual Binaries in Pulsar Timing Array Data. Phys. Rev. D 2022, 105, 122003. [Google Scholar] [CrossRef]
  25. Bécsy, B.; Cornish, N.J. Joint Search for Isolated Sources and an Unresolved Confusion Background in Pulsar Timing Array Data. Class. Quantum Gravity 2020, 37, 135011. [Google Scholar] [CrossRef]
  26. Mohanty, S.D.; Fahnestock, E. Adaptive Spline Fitting with Particle Swarm Optimization. Comput. Stat. 2021, 36, 155–191. [Google Scholar] [CrossRef]
  27. NANOGrav Collaboration; Johnson, A.D.; Meyers, P.M.; Baker, P.T.; Cornish, N.J.; Hazboun, J.S.; Littenberg, T.B.; Romano, J.D.; Taylor, S.R.; Vallisneri, M.; et al. NANOGrav 15-Year Gravitational-Wave Background Methods. Phys. Rev. D 2024, 109, 103012. [Google Scholar] [CrossRef]
  28. Chen, S.; Caballero, R.N.; Guo, Y.J.; Chalumeau, A.; Liu, K.; Shaifullah, G.; Lee, K.J.; Babak, S.; Desvignes, G.; Parthasarathy, A.; et al. Common-Red-Signal Analysis with 24-Yr High-Precision Timing of the European Pulsar Timing Array: Inferences in the Stochastic Gravitational-Wave Background Search. Mon. Not. R. Astron. Soc. 2021, 508, 4970–4993. [Google Scholar] [CrossRef]
  29. Reardon, D.J.; Zic, A.; Shannon, R.M.; Marco, V.D.; Hobbs, G.B.; Kapur, A.; Lower, M.E.; Mandow, R.; Middleton, H.; Miles, M.T.; et al. The Gravitational-wave Background Null Hypothesis: Characterizing Noise in Millisecond Pulsar Arrival Times with the Parkes Pulsar Timing Array. Astrophys. J. Lett. 2023, 951, L7. [Google Scholar] [CrossRef]
  30. Mohanty, S.D.; Chowdhury, M.A.T. Glitch Subtraction from Gravitational Wave Data Using Adaptive Spline Fitting. Class. Quantum Gravity 2023, 40, 125001. [Google Scholar] [CrossRef]
  31. Kennedy, J.; Eberhart, R. Particle Swarm Optimization. In Proceedings of the ICNN’95—International Conference on Neural Networks, Perth, WA, Australia, 27 November–1 December 1995; Volume 4, pp. 1942–1948. [Google Scholar] [CrossRef]
  32. Bratton, D.; Kennedy, J. Defining a Standard for Particle Swarm Optimization. In Proceedings of the 2007 IEEE Swarm Intelligence Symposium, Honolulu, HI, USA, 1–5 April 2007; pp. 120–127. [Google Scholar] [CrossRef]
  33. De Boor, C. A Practical Guide to Splines; Applied Mathematical Sciences; Springer: New York, NY, USA, 1978. [Google Scholar]
  34. Akaike, H. Information Theory and an Extension of the Maximum Likelihood Principle. In Selected Papers of Hirotugu Akaike; Parzen, E., Tanabe, K., Kitagawa, G., Eds.; Springer: New York, NY, USA, 1998; pp. 199–213. [Google Scholar] [CrossRef]
  35. VanderPlas, J.T. Understanding the Lomb–Scargle Periodogram. Astrophys. J. Suppl. Ser. 2018, 236, 16. [Google Scholar] [CrossRef]
  36. Hobbs, G.; Edwards, R.; Manchester, R. TEMPO2, a New Pulsar Timing Package. I: Overview. Mon. Not. R. Astron. Soc. 2006, 369, 655–672. [Google Scholar] [CrossRef]
  37. Edwards, R.T.; Hobbs, G.B.; Manchester, R.N. Tempo2, a New Pulsar Timing Package. II: The Timing Model and Precision Estimates. Mon. Not. R. Astron. Soc. 2006, 372, 1549–1574. [Google Scholar] [CrossRef]
  38. Hobbs, G.; Jenet, F.; Lee, K.J.; Verbiest, J.P.W.; Yardley, D.; Manchester, R.; Lommen, A.; Coles, W.; Edwards, R.; Shettigara, C. TEMPO2, a New Pulsar Timing Package. III: Gravitational Wave Simulation. Mon. Not. R. Astron. Soc. 2009, 394, 1945–1955. [Google Scholar] [CrossRef]
  39. Agazie, G.; Alam, M.F.; Anumarlapudi, A.; Archibald, A.M.; Arzoumanian, Z.; Baker, P.T.; Blecha, L.; Bonidie, V.; Brazier, A.; Brook, P.R.; et al. The NANOGrav 15 Yr Data Set: Observations and Timing of 68 Millisecond Pulsars. Astrophys. J. Lett. 2023, 951, L9. [Google Scholar] [CrossRef]
  40. Sesana, A.; Vecchio, A. Gravitational Waves and Pulsar Timing: Stochastic Background, Individual Sources and Parameter Estimation. Class. Quantum Gravity 2010, 27, 084016. [Google Scholar] [CrossRef]
  41. Lee, K.J.; Wex, N.; Kramer, M.; Stappers, B.W.; Bassa, C.G.; Janssen, G.H.; Karuppusamy, R.; Smits, R. Gravitational Wave Astronomy of Single Sources with a Pulsar Timing Array: GW Astronomy of Single Sources. Mon. Not. R. Astron. Soc. 2011, 414, 3251–3264. [Google Scholar] [CrossRef]
  42. Wang, Y.; Mohanty, S.D.; Jenet, F.A. A Coherent Method for the Detection and Parameter Estimation of Continuous Gravitational Wave Signals Using a Pulsar Timing Array. Astrophys. J. 2014, 795, 96. [Google Scholar] [CrossRef]
  43. Estabrook, F.B.; Wahlquist, H.D. Response of Doppler Spacecraft Tracking to Gravitational Radiation. Gen. Relativ. Gravit. 1975, 6, 439–447. [Google Scholar] [CrossRef]
  44. Wang, Y.; Mohanty, S.D.; Jenet, F.A. Coherent Network Analysis for Continuous Gravitational Wave Signals in a Pulsar Timing Array: Pulsar Phases as Extrinsic Parameters. Astrophys. J. 2015, 815, 125. [Google Scholar] [CrossRef]
  45. Qian, Y.Q.; Mohanty, S.D.; Wang, Y. Iterative Time-Domain Method for Resolving Multiple Gravitational Wave Sources in Pulsar Timing Array Data. Phys. Rev. D 2022, 106, 023016. [Google Scholar] [CrossRef]
  46. Wang, Y.; Mohanty, S.D.; Qian, Y.Q. Continuous Gravitational Wave Searches with Pulsar Timing Arrays: Maximization versus Marginalization over Pulsar Phase Parameters. J. Phys. Conf. Ser. 2017, 840, 012058. [Google Scholar] [CrossRef]
  47. Speri, L.; Porayko, N.K.; Falxa, M.; Chen, S.; Gair, J.R.; Sesana, A.; Taylor, S.R. Quality over Quantity: Optimizing Pulsar Timing Array Analysis for Stochastic and Continuous Gravitational Wave Signals. Mon. Not. R. Astron. Soc. 2023, 518, 1802–1817. [Google Scholar] [CrossRef]
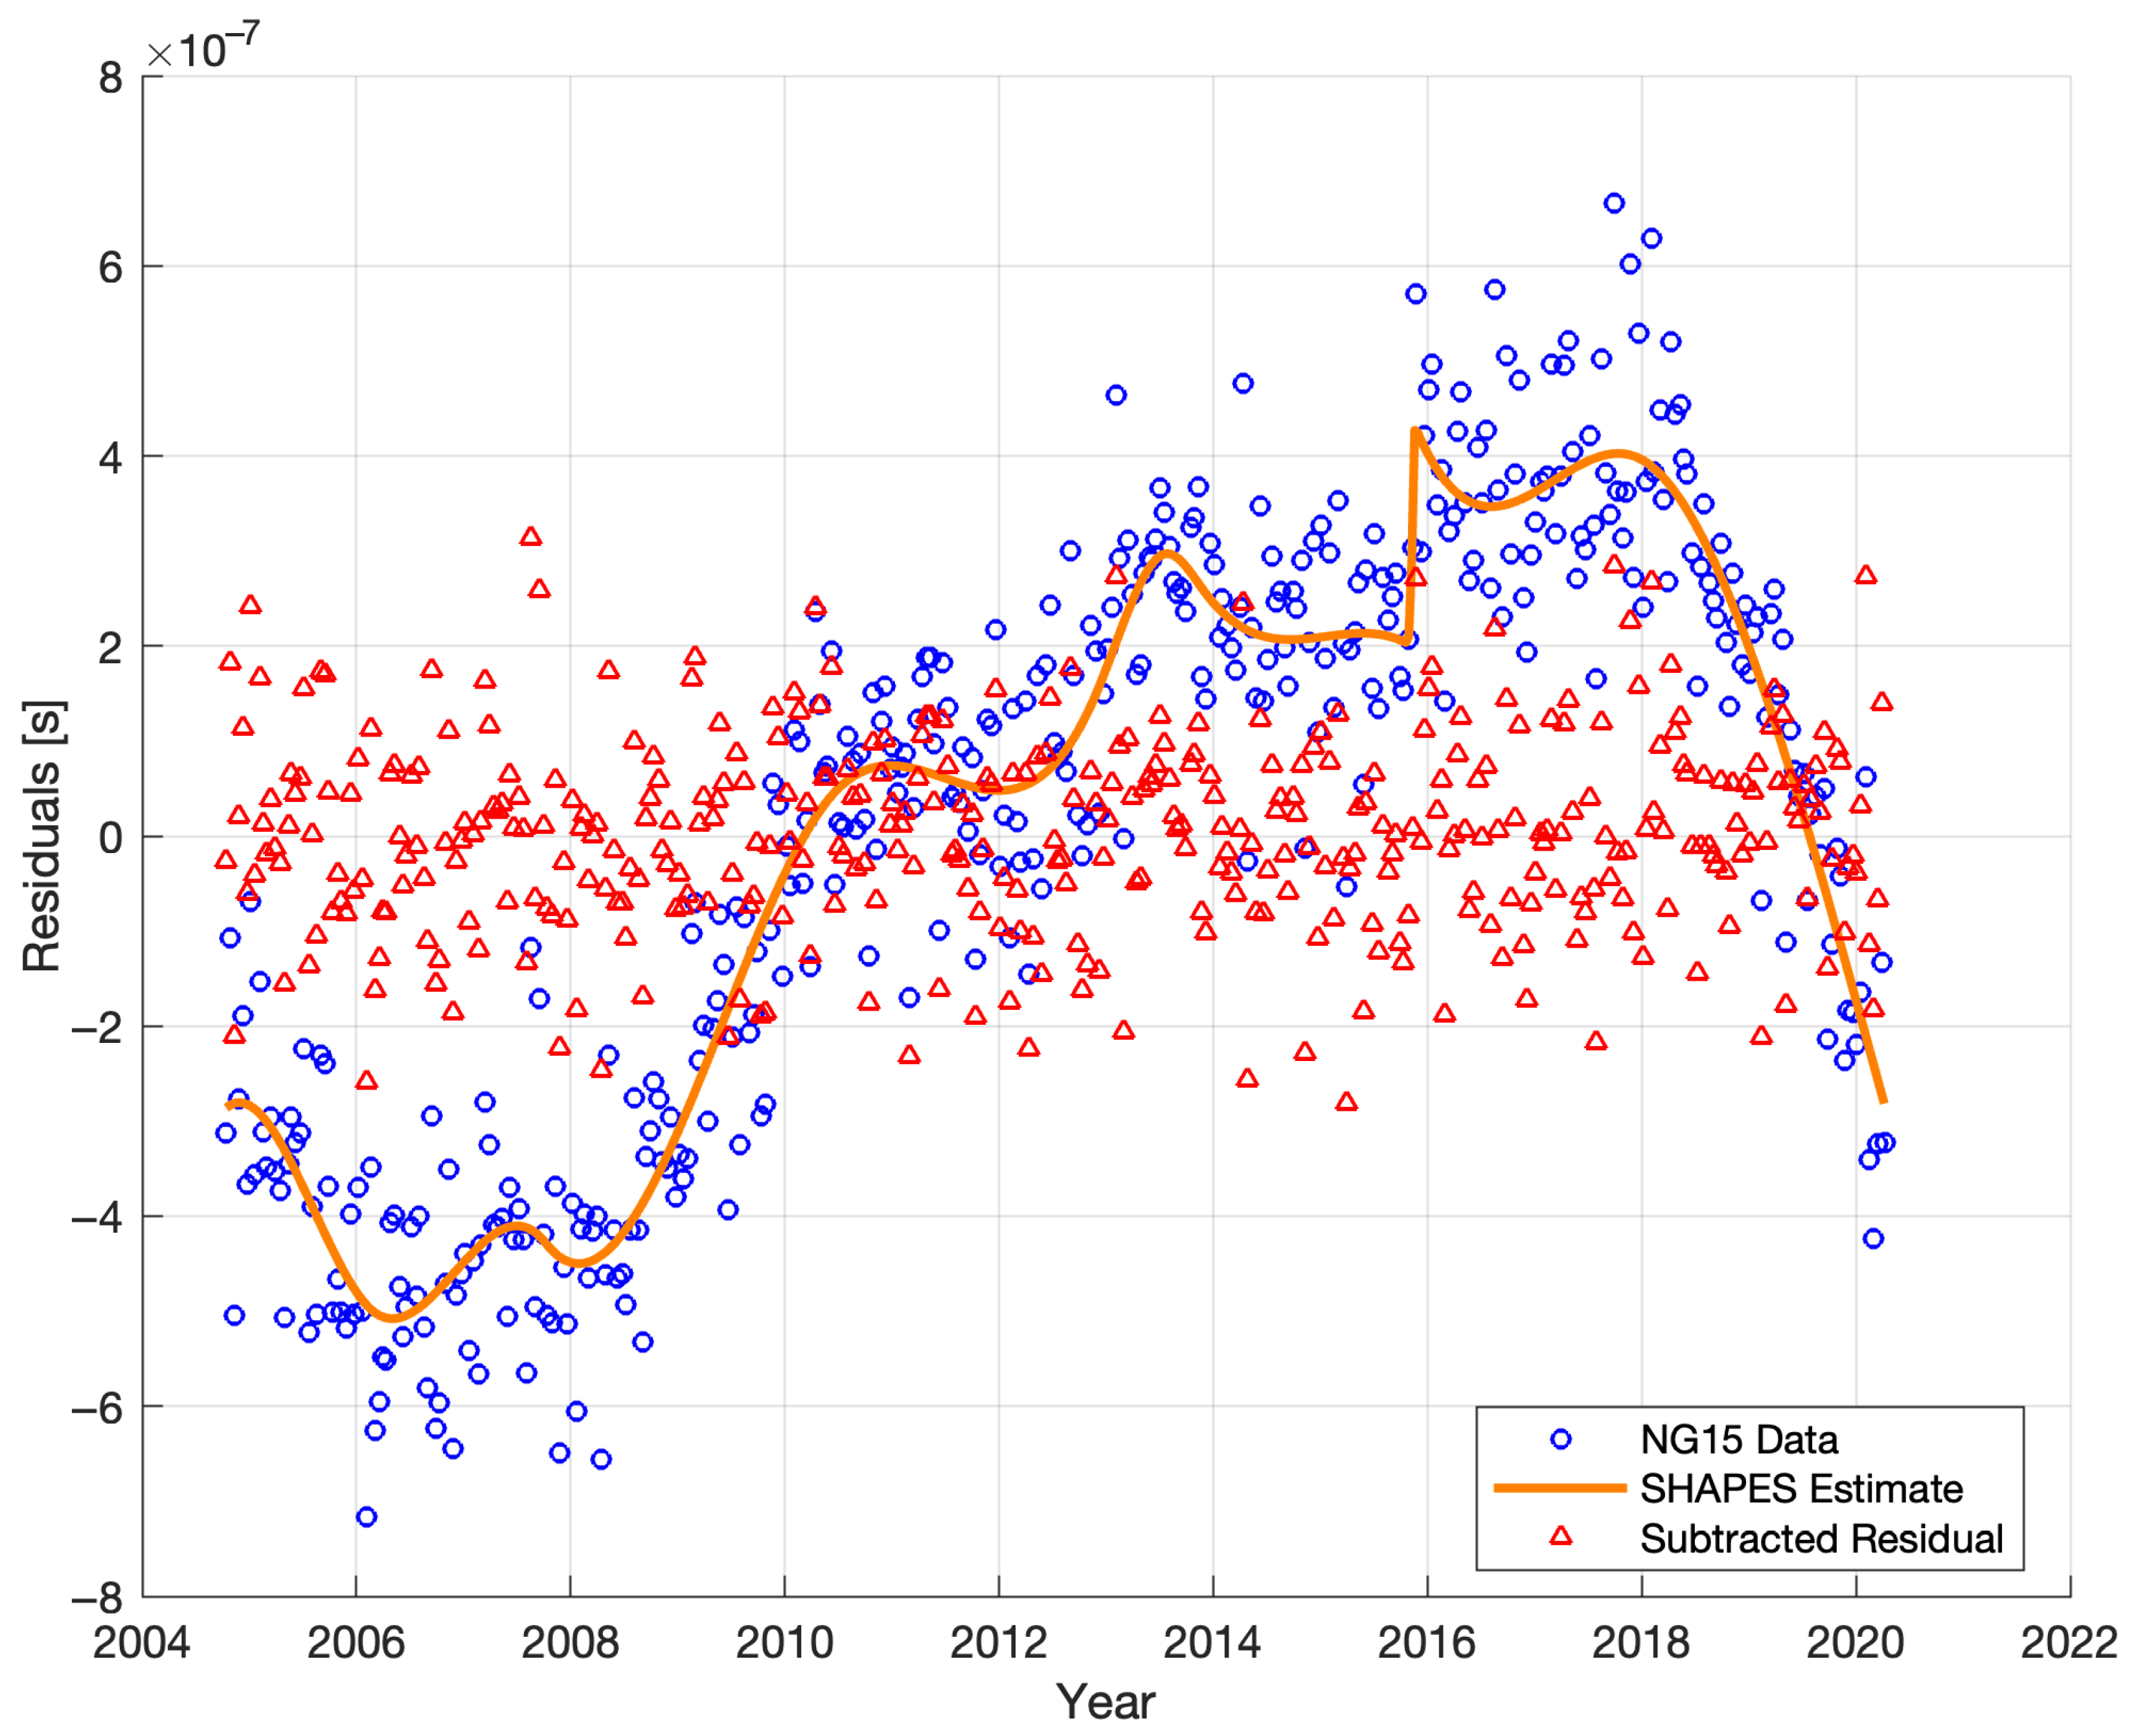
Figure 1. Timing residual comparison between NANOGrav data and SHAPES processed data for PSR J1909-3744. The blue circle represents the original NANOGrav data, and red triangles are the SHAPES processed residuals, while the orange line gives the SHAPES estimates of the NG15 data.
Universe 11 00268 g001
Figure 2. Lomb–Scargle periodogram for NG15 data and SHAPES processed residuals. The blue line is the LSP for the NG15 data, and the red line is the LSP for SHAPES processed residuals.
Universe 11 00268 g002
Figure 3. The combined timing residuals for PSR J1909-3744. The blue curve is the injected CW signal, and light gray dots indicate the PINT simulated residuals with the error bars on these points represent the timing uncertainties. The combination of the two is shown as purple stars.
Universe 11 00268 g003
Figure 4. Lomb–Scargle periodogram for PSR J1909-3744. The red curve is the PSD for the injected signal, the yellow curve is the PSD of the PINT simulated noise, and the blue line is the PSD of the combined residuals.
Universe 11 00268 g004
Figure 5. Lomb–Scargle periodogram for PSR J1909-3744 with SHAPES estimates. The red line indicates the PSD of the low-pass filtered residuals, which will be utilized in the search, while the green line represents the PSD of the combined residuals. Additionally, the blue line also depicts the PSD for the injected gravitational wave signal, and the black line illustrates the PSD for the detrended residuals without low-pass filtering.
Universe 11 00268 g005
Disclaimer/Publisher’s Note: The statements, opinions and data contained in all publications are solely those of the individual author(s) and contributor(s) and not of MDPI and/or the editor(s). MDPI and/or the editor(s) disclaim responsibility for any injury to people or property resulting from any ideas, methods, instructions or products referred to in the content.