Article

Laboratory Magnetoplasmas as Stellar-like Environment for 7Be β-Decay Investigations Within the PANDORA Project

1
National Institute for Nuclear Physics (INFN)-Laboratori Nazionali Del Sud, Via S. Sofia 62, 95123 Catania, Italy
2
National Institute for Nuclear Physics (INFN)-Laboratori Nazionali di Legnaro, Viale dell’Università 2, 35020 Legnaro, Italy
*
Author to whom correspondence should be addressed.
Universe 2025, 11(6), 195; https://doi.org/10.3390/universe11060195
Submission received: 7 April 2025 / Revised: 17 May 2025 / Accepted: 29 May 2025 / Published: 18 June 2025
(This article belongs to the Special Issue Recent Outcomes and Future Challenges in Nuclear Astrophysics)

Abstract

Laboratory magnetoplasmas can become an intriguing experimental environment for fundamental studies relevant to nuclear astrophysics processes. Theoretical predictions indicate that the ionization state of isotopes within the plasma can significantly alter their lifetimes, potentially due to nuclear and atomic mechanisms such as bound-state β-decay. However, only limited experimental evidence on this phenomenon has been collected. PANDORA (Plasmas for Astrophysics, Nuclear Decay Observations, and Radiation for Archaeometry) is a novel facility which proposes to investigate nuclear decays in high-energy-density plasmas mimicking some properties of stellar nucleosynthesis sites (Big Bang Nucleosynthesis, s-process nucleosynthesis, role of CosmoChronometers, etc.). This paper focuses on the case of 7Be electron capture (EC) decay into 7Li, since its in-plasma decay rate has garnered considerable attention, particularly concerning the unresolved Cosmological Lithium Problem and solar neutrino physics. Numerical simulations were conducted to assess the feasibility of this possible lifetime measurement in the plasma of PANDORA. Both the ionization and atomic excitation of the 7Be isotopes in a He buffer Electron Cyclotron Resonance (ECR) plasma within PANDORA were explored via numerical modelling in a kind of “virtual experiment” providing the expected in-plasma EC decay rate. Since the decay of 7Be provides γ-rays at 477.6 keV from the 7Li excited state, Monte-Carlo GEANT4 simulations were performed to determine the γ-detection efficiency by the HPGe detectors array of the PANDORA setup. Finally, the sensitivity of the measurement was evaluated through a virtual experimental run, starting from the simulated plasma-dependent γ-rate maps. These results indicate that laboratory ECR plasmas in compact traps provide suitable environments for β-decay studies of 7Be, with the estimated duration of experimental runs required to reach 3σ significance level being few hours, which prospectively makes PANDORA a powerful tool to investigate the decay rate under different thermodynamic conditions and related charge state distributions.

1. Introduction

For decades several studies were finalized to unravel the cosmic origin of elements, enabling nuclear astrophysics making significant progress in identifying the various nucleosynthesis processes and quantifying elemental abundances. About half of the heavy elements and isotopes beyond Fe and up to Pb and Bi result from s-process nucleosynthesis, which is due to neutron captures (NC) of a preexisting intermediate and heavy nuclei, which are slow in comparison to β-decays (β-D) [1,2]. Stellar nucleosynthesis models designed to calculate s-process branching for heavy nuclei depend on the properties of both these processes, i.e., the NC cross-sections and the β-D lifetimes, and uncertainties in either of them can significantly disrupt the balance between competing processes [3,4], leading to discrepancies between observed and predicted elemental abundances. Understanding the s-process composition can also provide the r-process (based on a rapid NC by the nuclei, so that the NC rates are much faster than those of β-D) abundances [5] by subtracting the s-process component from the total solar abundances for those nuclei which have s- and r-contributions. Nucleosynthesis models still rely on decay half-lives (t1/2) measured in neutral atoms, which may differ significantly from their stellar plasma counterparts. To address this issue, investigations on the modification of decay rates due to changes in the atomic environment of radioactive nuclei in dense plasmas are needed.
The change in a nuclear decay constant, λ, by any external effect has been a subject of investigation for many years since the interesting suggestions reported in [6,7]. Initial studies involved measuring decay rates in extreme physical conditions (i.e., magnetic field up to 80,000 Gauss) but yielded only negligible changes (<0.05%) [8]. Further research revealed somewhat larger (around 3.5% for 7Be) changes when modifying the chemistry of the material containing the decaying nuclei [8]. Variation in the pressure of the sample was also attempted at 99mTc, as it was compressed at a pressure of 100.000 bar, inducing an increase in the decay constant in the order of 10−4 [9]. A much more pronounced effect of the atomic environment on λ was observed in highly charged ions in storage rings. Fully stripped 187Re was investigated and a dramatic reduction in t1/2 (from 42 Gyr in neutral 187Re to 32.9 ± 2 yr in 187Re75+) was measured [10]. Even more relevant was the study about the decay of fully stripped 163Dy66+ ions, since it was discovered that the isotope, which is stable in its neutral form, became unstable via bound state β decay (BSBD)—in which an electron is emitted directly into a vacant atomic orbital—when fully stripped [11].
Decay rates are expected to vary significantly in interiors of stars where nucleosynthesis occurs. A complete theoretical analysis of all in-plasma β-decay processes was conducted by Takahashi and Yokoi [12], who illustrated how local thermodynamic equilibrium (LTE) stellar plasma may enhance or suppress certain transitions. Their formulations were also used to predict BSBD rates in fully ionized nuclei, successfully reproducing observations from storage rings. Possible plasma-induced variations of decay rates in isotopes were investigated in [13,14] to quantify their impact on modelling the abundance of s-process elements. In the recent work of Mishra et al. [15,16], the Takahashi and Yokoi model was generalized for any kind of plasma, including low-density non-LTE (NLTE) laboratory magnetoplasmas.
To theoretically and experimentally study plasma-induced changes in β-decay rates, a new facility called PANDORA (Plasmas for Astrophysics, Nuclear Decay Observations, and Radiation for Archaeometry) is being built at INFN-LNS in Catania, Italy. The PANDORA project [17], financed by the Italian National Institute of Nuclear Physics (INFN) in the frame of an international collaboration, proposes a new experimental approach for studying (for the first time) in-plasma nuclear β-decay rate as a function of thermodynamical conditions of the environment, namely a magnetized plasma obtained via Electron Cyclotron Resonance (ECR) and trapped in strong magnetic fields able to mimic some stellar-like conditions. The in-plasma decay rates of β-decay processes (expected to change dramatically as a function of the ion ionization state in the PANDORA plasma environment emulating some thermodynamics conditions of interiors of stars) will be measured as a function of the charge state distribution (CSD) of the in-plasma ions, varying plasma conditions. The new experimental approach consists in a direct correlation of the plasma environment and the decay itself, and this can be done only by simultaneously identifying and discriminating—through an innovative multi-diagnostic system which will work synergically with a γ-rays detection system—the photons emitted by the plasma (from microwave to hard X-ray) and γ-rays emitted after the isotope β-decay [18,19,20,21,22,23].
PANDORA represents an innovative multidisciplinary project which could add peculiar research capability in Nuclear Astrophysics and Applied Physics fields of research; not only for the above mentioned in-plasma β-decay measurements, but also because it is an unprecedented setup for applications in plasma physics field. It will be the biggest B-minimum magnetic trap with the potentiality to also work as an ion source and as a testbench for magnetic fusion related diagnostics or technologies.
For the first phase of PANDORA, a subset of physical cases was chosen to start the study, as reported in Table 1. The selection was based on scientific relevance to nuclear astrophysics processes (Big Bang Nucleosynthesis, s-process nucleosynthesis, role of CosmoChronometers, etc.), on the expected effects on the lifetime, due to radionuclide in-plasma CSD and on the maximum ionization state that can be reached by the trap design. Moreover, being the identification of the decay products based on the γ−ray detection, only isotopes whose daughter nuclei emit γ−rays were chosen. The selection procedure has given three isotopes as outputs: the 176Lu (which might play a crucial role as cosmo-clock), the 134Cs (involved in s-processes and relevant to produce the s-only isotopes 134Ba and 136Ba), and the 94Nb (relevant for the abundance of 94Mo in single or binary systems of stars).
In this work, we focus on a further physical case for PANDORA—7Be—whose feasibility study is carried out here for the first time. The possibility to investigate the in-plasma decay rate of 7Be has attracted considerable attention within the PANDORA collaboration [24], particularly for the still open question of the so-called Cosmological Lithium Problem—the primordial 7Li abundance predicted by the standard Big-Bang Nucleosynthesis (BBN) model is about three times larger than the observation [25,26,27] and for the physics of neutrino. The 7Li abundance strongly depends on the 7Be production and destruction rate, and there are still various uncertainties; so far, the largest one concerns the processes of bound and free e captures (EC) on 7Be, hence its lifetime. Several works were devoted to study the 7Be(e-e)7Li reaction [28,29]. Recently, an estimate of the 7Be half-life based on ab initio quantum calculations and its consequences on Li nucleosynthesis in low mass AGB stars, was discussed in [30]. Despite several recent experimental progresses, there are still some uncertainties and ambiguities.
The EC decay rate of 7Be strongly depends on its atomic configuration, i.e., its ionization state and its excitation levels. The variation of EC rates in local thermodynamic equilibrium (LTE) stellar plasmas with high density has been studied in detail by Takahashi and Yokoi (TY) [12], while the model discussed by Mishra et al. [31] generalizes their approach to low-density ECR plasmas in NLTE as the ones that will be produced in PANDORA. ECR plasmas confined in magnetic Bminimum structure are, in fact, in NTLE condition due to the low density, with a typical Electron Energy Distribution Function (EEDF) consisting of three different electron populations. In addition, Taioli et al. [29,32] have developed a DHF-based ab initio approach to independently evaluate the half-life of 7Be in plasmas.
In this framework, the PANDORA facility, with its novel experimental approach, could be an excellent testbench to validate the predictions of these decay models and to measure the effect of a plasma on the lifetime of 7Be. The revised in-plasma EC rates could then be used to assess their impact on the solar neutrino flux [27] and given as inputs to BBN network codes for investigating whether any nuclear physics solution to the Li-problem exists at all [26,33].

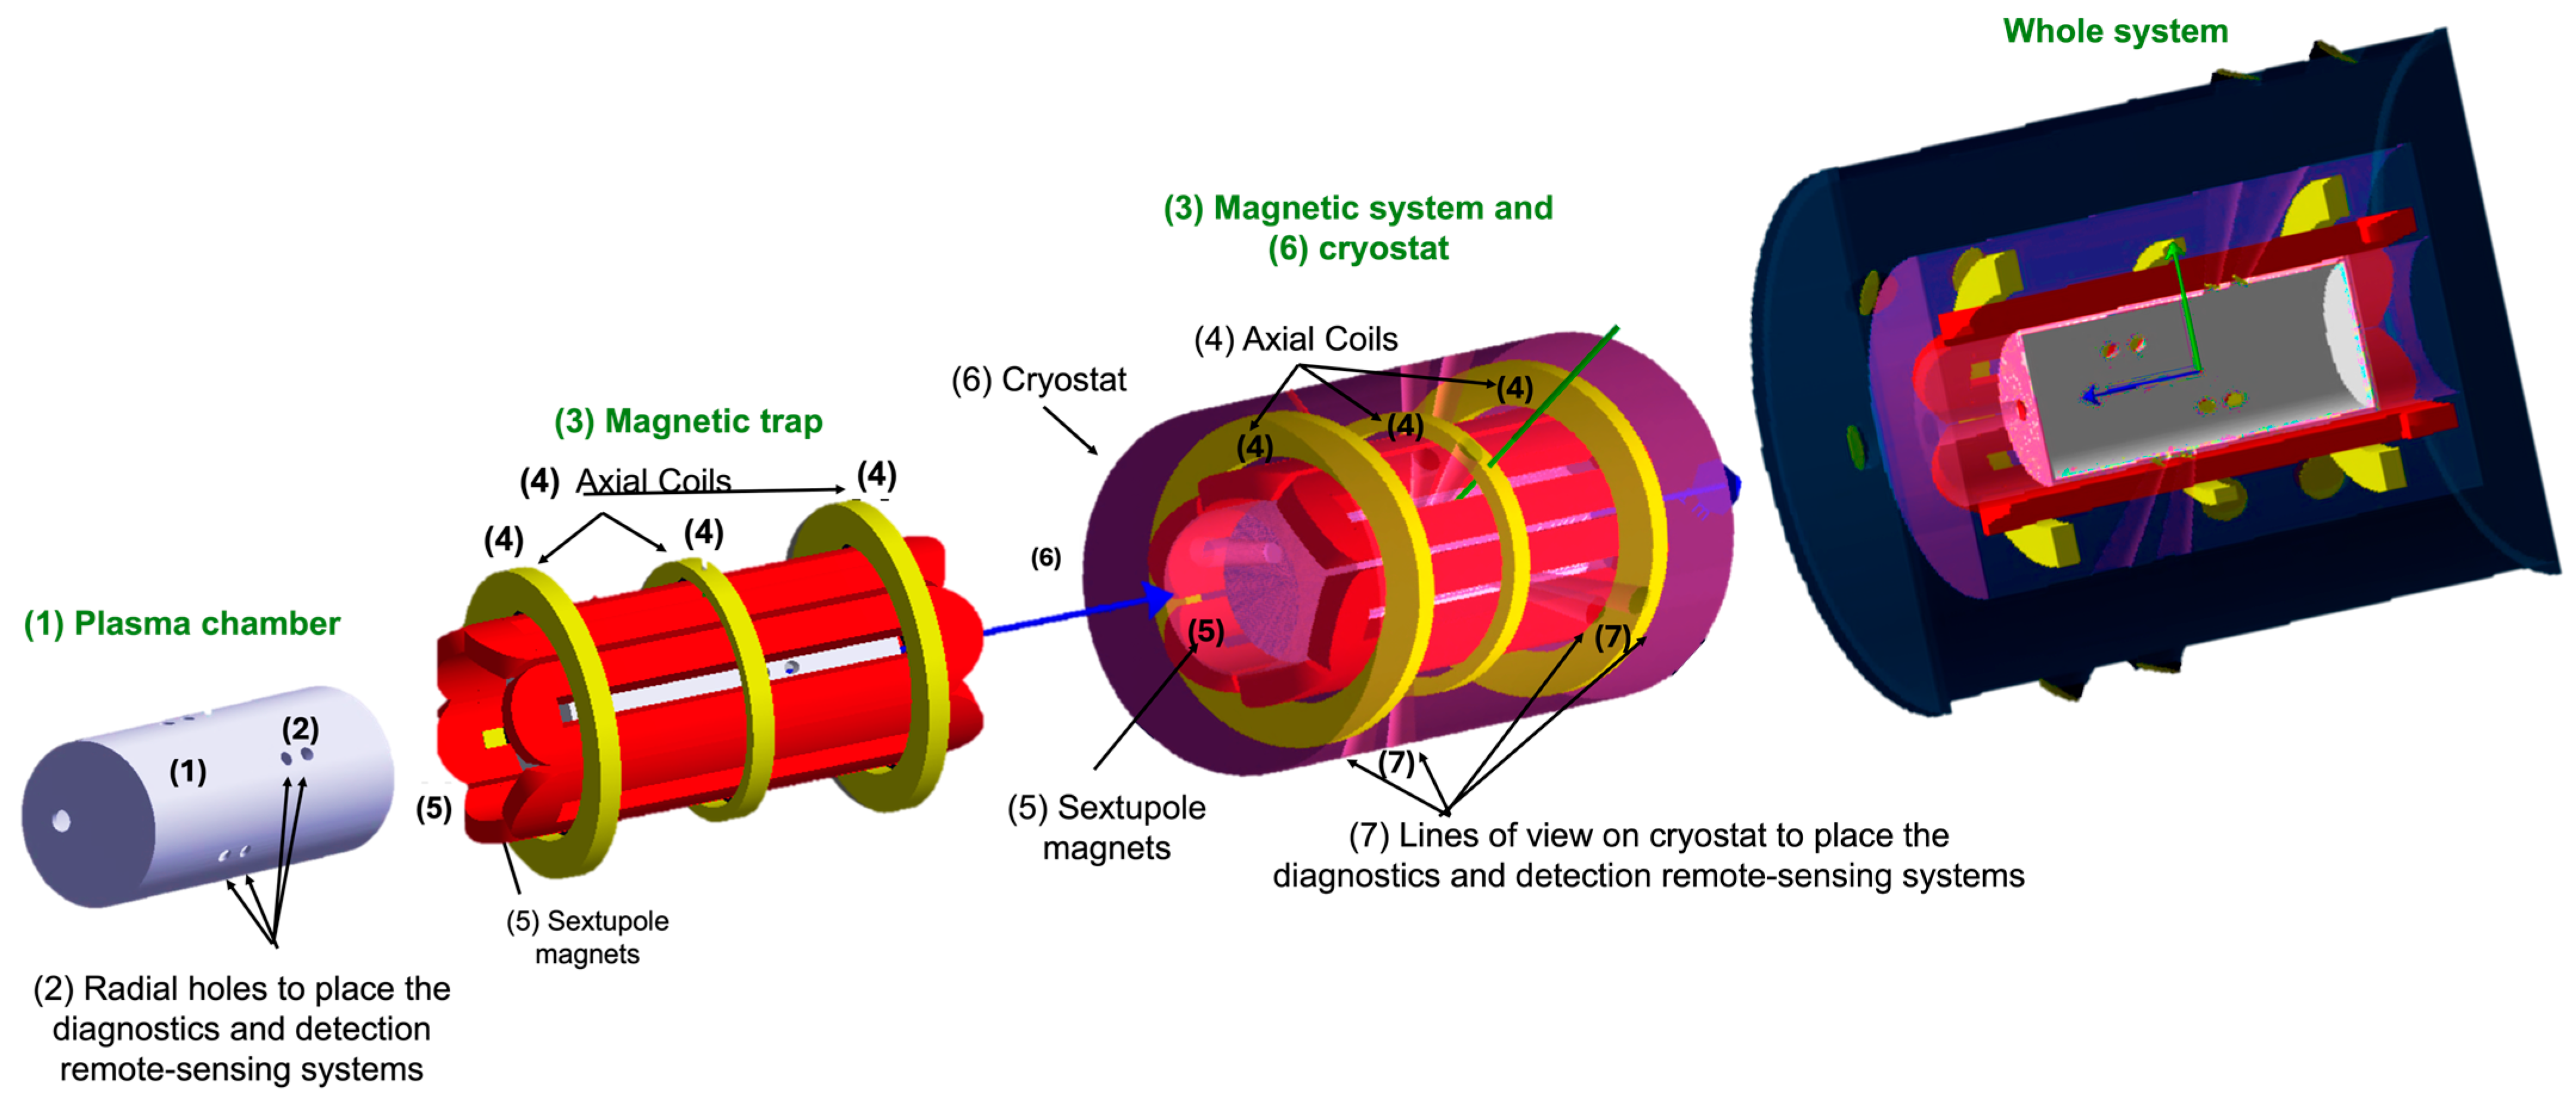
2. The PANDORA Facility: Conceptual Design and the Novel Experimental Approach

The Electron Cyclotron Resonance (ECR) plasmas, generated through the interaction of electromagnetic waves and gases or vapours in a magnetic field, have become increasingly valuable in both fundamental science and applied research. While traditionally used as ion sources (ECRIS) to produce high-intensity beams of highly charged ions, ECR plasmas also offer a compelling experimental environment for studying nuclear astrophysics.
In the PANDORA setup, a dense and hot ECR plasma—made of multicharged ions immersed in a dense cloud of energetic electrons—will be confined by multi-Tesla magnetic fields and resonantly heated by some kWs of microwave power in the 18−21 GHz frequency range. The plasmas can reach ne∼1011−1013 cm−3 and Te∼0.1−100 keV of electron density and temperature, respectively. Thus, the radionuclides can be trapped in a dynamic equilibrium, in a Magneto Hydro Dynamically stable plasma, with an on-average locally stable density, temperature, and CSD, even for weeks.
The PANDORA facility is built around three primary subsystems (see Figure 1a): a superconducting magnetic trap, an array of 14 HPGe detectors, and a plasma multi-diagnostics system. A sketch of the whole system is shown in Figure 1b.
The superconducting magnetic trap [34] is composed of three coils to axially confine the plasma, and a hexapole for radial confinement. This trap has been designed to maximize plasma lifetime while still offering sufficient flexibility and accessibility for diagnostic and detection instruments. Boasting a plasma chamber length of 70 cm and an inner diameter of 28 cm, it stands as one of the largest B-minimum magnetic traps ever designed. This large volume will enable long confinement times, leading to a highly charged state ion distribution that significantly impacts the anticipated changes in in-plasma decay half-life. The trap is designed to operate at 18 and 21 GHz, powered by three klystrons delivering a total of 6 kW. The superconducting magnetic system generates a maximum magnetic field of 3 T.
Non-invasive plasma diagnostics play a relevant role in characterizing the plasma environment properties. A multi-diagnostics system and advanced techniques of analysis aiming to characterize the ECR magnetized plasmas confined in compact traps were properly developed. Thermodynamics plasma parameters can be monitored online through the non-invasive multi-diagnostic system which includes dozens of detections and diagnostics devices, categorized into three main types based on the following techniques employed: (i) transmission techniques that use probing signals passing through the plasma (RF interfero-polarimeter [35], Thomson scattering [36,37]); (ii) emission techniques utilizing devices installed inside the plasma chamber (multi-pin RF probes [38] connected to spectrum analyzers or scopes to detect RF plasma emission); (iii) emission techniques utilizing devices installed outside the plasma chamber (OES [39], soft X-ray imaging and space- and time-resolved spectroscopy [40], volumetric soft and hard X-ray SDD and HPGe detectors [41]) to detect optical, soft and hard X-ray, and γ-ray plasma emission [23,42]. A scheme illustrating the whole multi-diagnostic setup is shown in Figure 2.
A comprehensive overview of each diagnostic tool and technique is presented in Table 2, outlining their most relevant characteristics (sensitive range, resolution, and target electron population), the experimental measurements they enable, the thermodynamic parameters and plasma processes they can probe, and the associated uncertainties.
Within the PANDORA project, a strategic prioritization of diagnostic techniques is essential for effective plasma characterization. Certain measurements emerge as fundamental, identifiable by their green colour designation, as they provide core insights into the plasma’s behaviour. These include precise assessments of thermodynamic parameters—namely, electron density and temperature—across the cold, warm, and hot electron populations. Such measurements are achieved through a combination of optical and X-ray spectroscopy, leveraging spectral line analysis for density and temperature measurement, alongside Thomson scattering and polarimetry techniques. The capacity to resolve these measurements in both space and time is also crucial, allowing for a dynamic understanding of plasma evolution as well as performing X-ray plasma imaging. Furthermore, the quantitative characterization of instabilities is considered quite critical, and that can be done by employing RF probes to capture the nonlinear broadening the of self-emitted plasma spectrum in the microwave range, which is a direct signature of kinetic turbulence [18].
In contrast, a set of complementary techniques, denoted in blue, while useful, are however not strictly mandatory for the initial phase of plasma characterization. These methods serve to improve the understanding gained from the more fundamental measurements, offering more granular detail but not being essential for establishing a baseline understanding. These techniques provide supplementary data that can refine the overall plasma properties characterization.
Finally, certain techniques are marked in yellow and represent methodologies that are still under development or planned for later stages of PANDORA. These may include advanced diagnostic methods to enhance real-time data processing, e.g., the online charge state distribution measurement by very high-resolution optical spectrometry. These techniques represent the forward-looking ambitions of the project, promising to further expand the scope and precision of plasma characterization in subsequent phases even though they are not part of the initial operational focus.
Experimental results have been already collected on downsized testbenches very well emulating the main features of PANDORA, even if at lower energy contents (lower densities and temperatures), and much lower plasma volume, operating at INFN-LNS laboratory in Italy and at ATOMKI-laboratories in Hungary. All the devices will operate simultaneously with each other and with the γ-ray detection system. The array will consist of 14 HPGe detectors (70% of relative efficiency) chosen for their high resolution (0.2% @ 1 MeV). They will surround the magnetic trap and will be placed in specific positions where holes were made in the cryostat structure as well as in the internal plasma chamber to directly look into the plasma through thin aluminum windows. The choice of high-resolution detectors allows to improve the signal-to-noise ratio, which is strongly affected by the harsh-environment (the background in the HPGe detectors comes from the intense plasma self-emission in any range of the electromagnetic (EM) spectrum, including X and γ-rays). The total efficiency of the array, estimated via GEANT4 simulations [23], is 0.2–0.3%, the value being energy dependent.
The experimental methodology of PANDORA relies on maintaining the plasma in a dynamic equilibrium over extended periods, potentially spanning months. To maintain plasma stable for long time, an innovative plasma excitation method—the so called Two-Close-Frequency-Heating (TCFH) [18]—able to damp the plasma instabilities and improving the plasma confinement, will be applied.
PANDORA’s innovative experimental approach unfolds in six key steps:
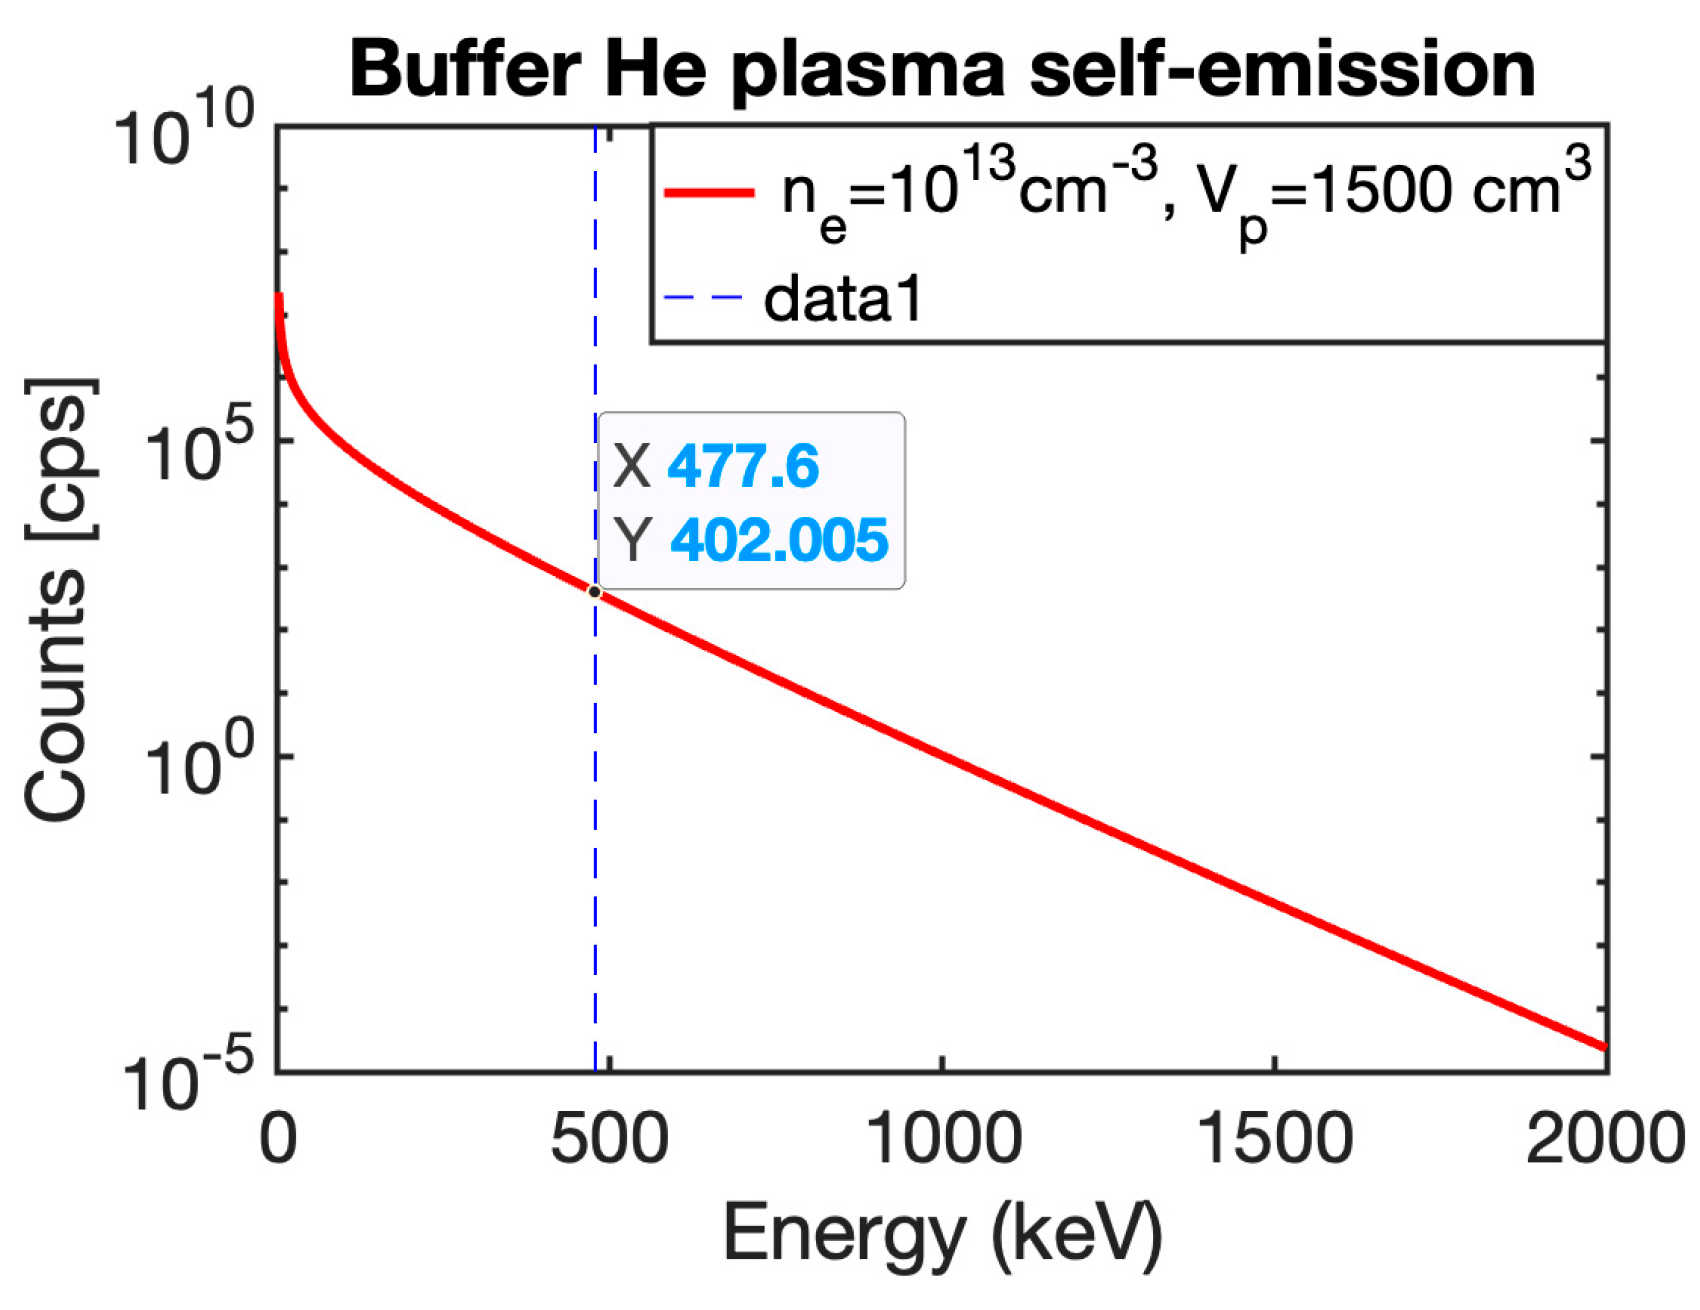
  • A buffer plasma of He, O, or Ar is created using ECR heating, reaching densities up to 1013 cm−3.
  • The plasma trap is designed to accommodate metal injection systems that vaporize metal isotopes (176Lu, 134Cs, 94Nb) to densities ranging from 106 to 1011 cm−3. Simulations have also evaluated the diffusion [43] of these atoms within the plasma chamber, along with plasma interaction and transport phenomena.
  • Other isotope injection solutions have been considered for the case of 7Be, due to its larger activity compared to the other physics cases mentioned. A feasibility study based on the principles of the Charge-Breeder technique and of the ISOL technique has been already performed. The isotope injection in plasma will be based on the construction of an in-flight injection line of radioactive ion beams (RIBs) into the plasma trap. The 7Be nuclei can be produced by an accelerated proton beam hitting a boron nitride compound; fragmentation reaction will produce the isotope from boron. Then, effusing nuclei will be extracted at 1+ charge state and subsequently injected into a radio-frequency quadrupole cooler to optimize the beam envelope properties, longitudinal matching and energy, before entering the plasma potential and penetrate in the plasma core.
  • The plasma can be maintained in magnetohydrodynamic (MHD) equilibrium for extended periods (days). The number of γ-rays emitted from the decay of daughter nuclei produced in the β-decay process can be expressed as Nγ(tm) = λniVptm, where λ is the isotope’s nuclear decay constant, ni is the isotope ion density, Vp is the plasma volume, and tm is the measurement time. Nγ(tm) scales linearly with tm, and once ni and Vp are known, λ can be determined.
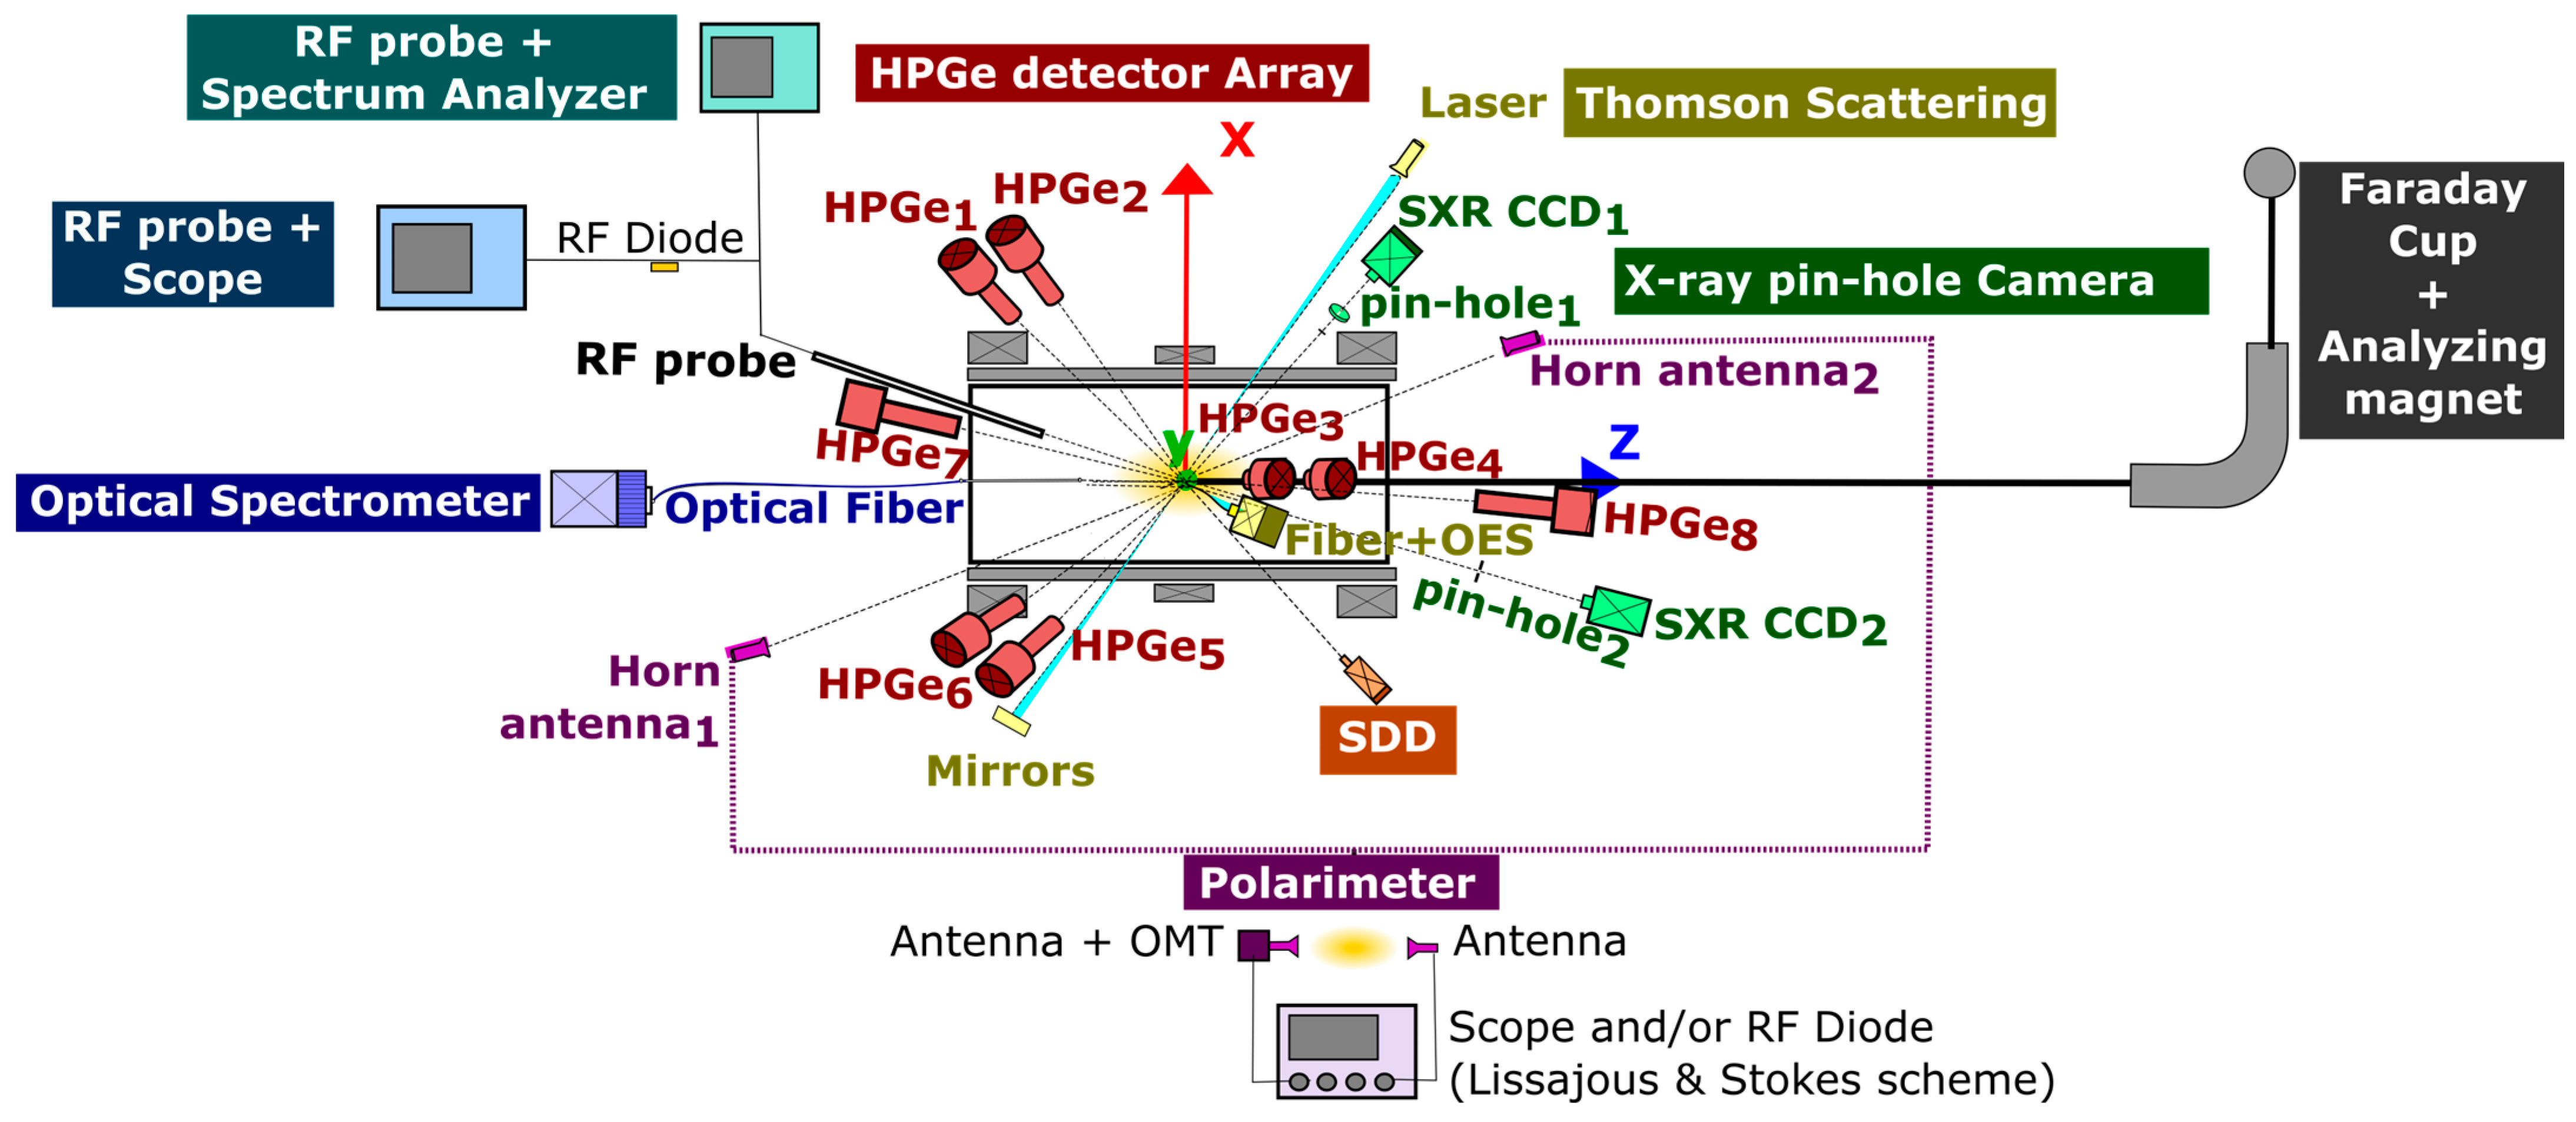
  • The emitted γ-rays are detected by the array of HPGe detectors.
  • The in-plasma radioactivity is correlated with plasma parameters using the non-invasive multi-diagnostic setup able to monitor the plasma parameters online.
Recent activities of the PANDORA collaboration have focused on the design of the magnetic trap for experiments planned in 2026, and on the development of various plasma diagnostic tools [20,22]. R&D efforts are proceeding alongside theoretical models [13,14,44] and simulations [15,45] that support the project’s underlying principles.

3. Methods

Numerical simulations have been performed to assess the feasibility of PANDORA in investigating the modification of 7Be EC rate in laboratory magnetoplasmas. The build-up of the radio-isotope ion CSD and atomic level excitations in a He ECR plasma buffer inside the PANDORA plasma trap have been explored via a combination of Particle-in-Cell (PIC) simulations and population kinetics collision-radiative model (see Section 3.1). The results of these simulations determine plasma-configuration dependent decay-rate calculations based on the generalized decay model described in [31]. For a given in-plasma decay rate, the related γ emission map from daughter nuclei is then modelled for further analysis including the γ-detection system.
Monte-Carlo GEANT4 simulations have been performed to determine the γ-detection efficiency (see Section 3.2) of the PANDORA detection system. Finally, the sensitivity of the measurement has been evaluated through a virtual experimental run aimed to estimate the duration of experimental runs required to reach 3σ significance level. Although similar studies were performed for the other physical cases 176Lu, 134Cs, and 94Nb [23], here, for the first time, local investigations have been carried out by considering the 3D map of 7Be ions within the PANDORA plasma chamber, differentiated by their ion charge states, and thus resulting in local 3D efficiency maps.

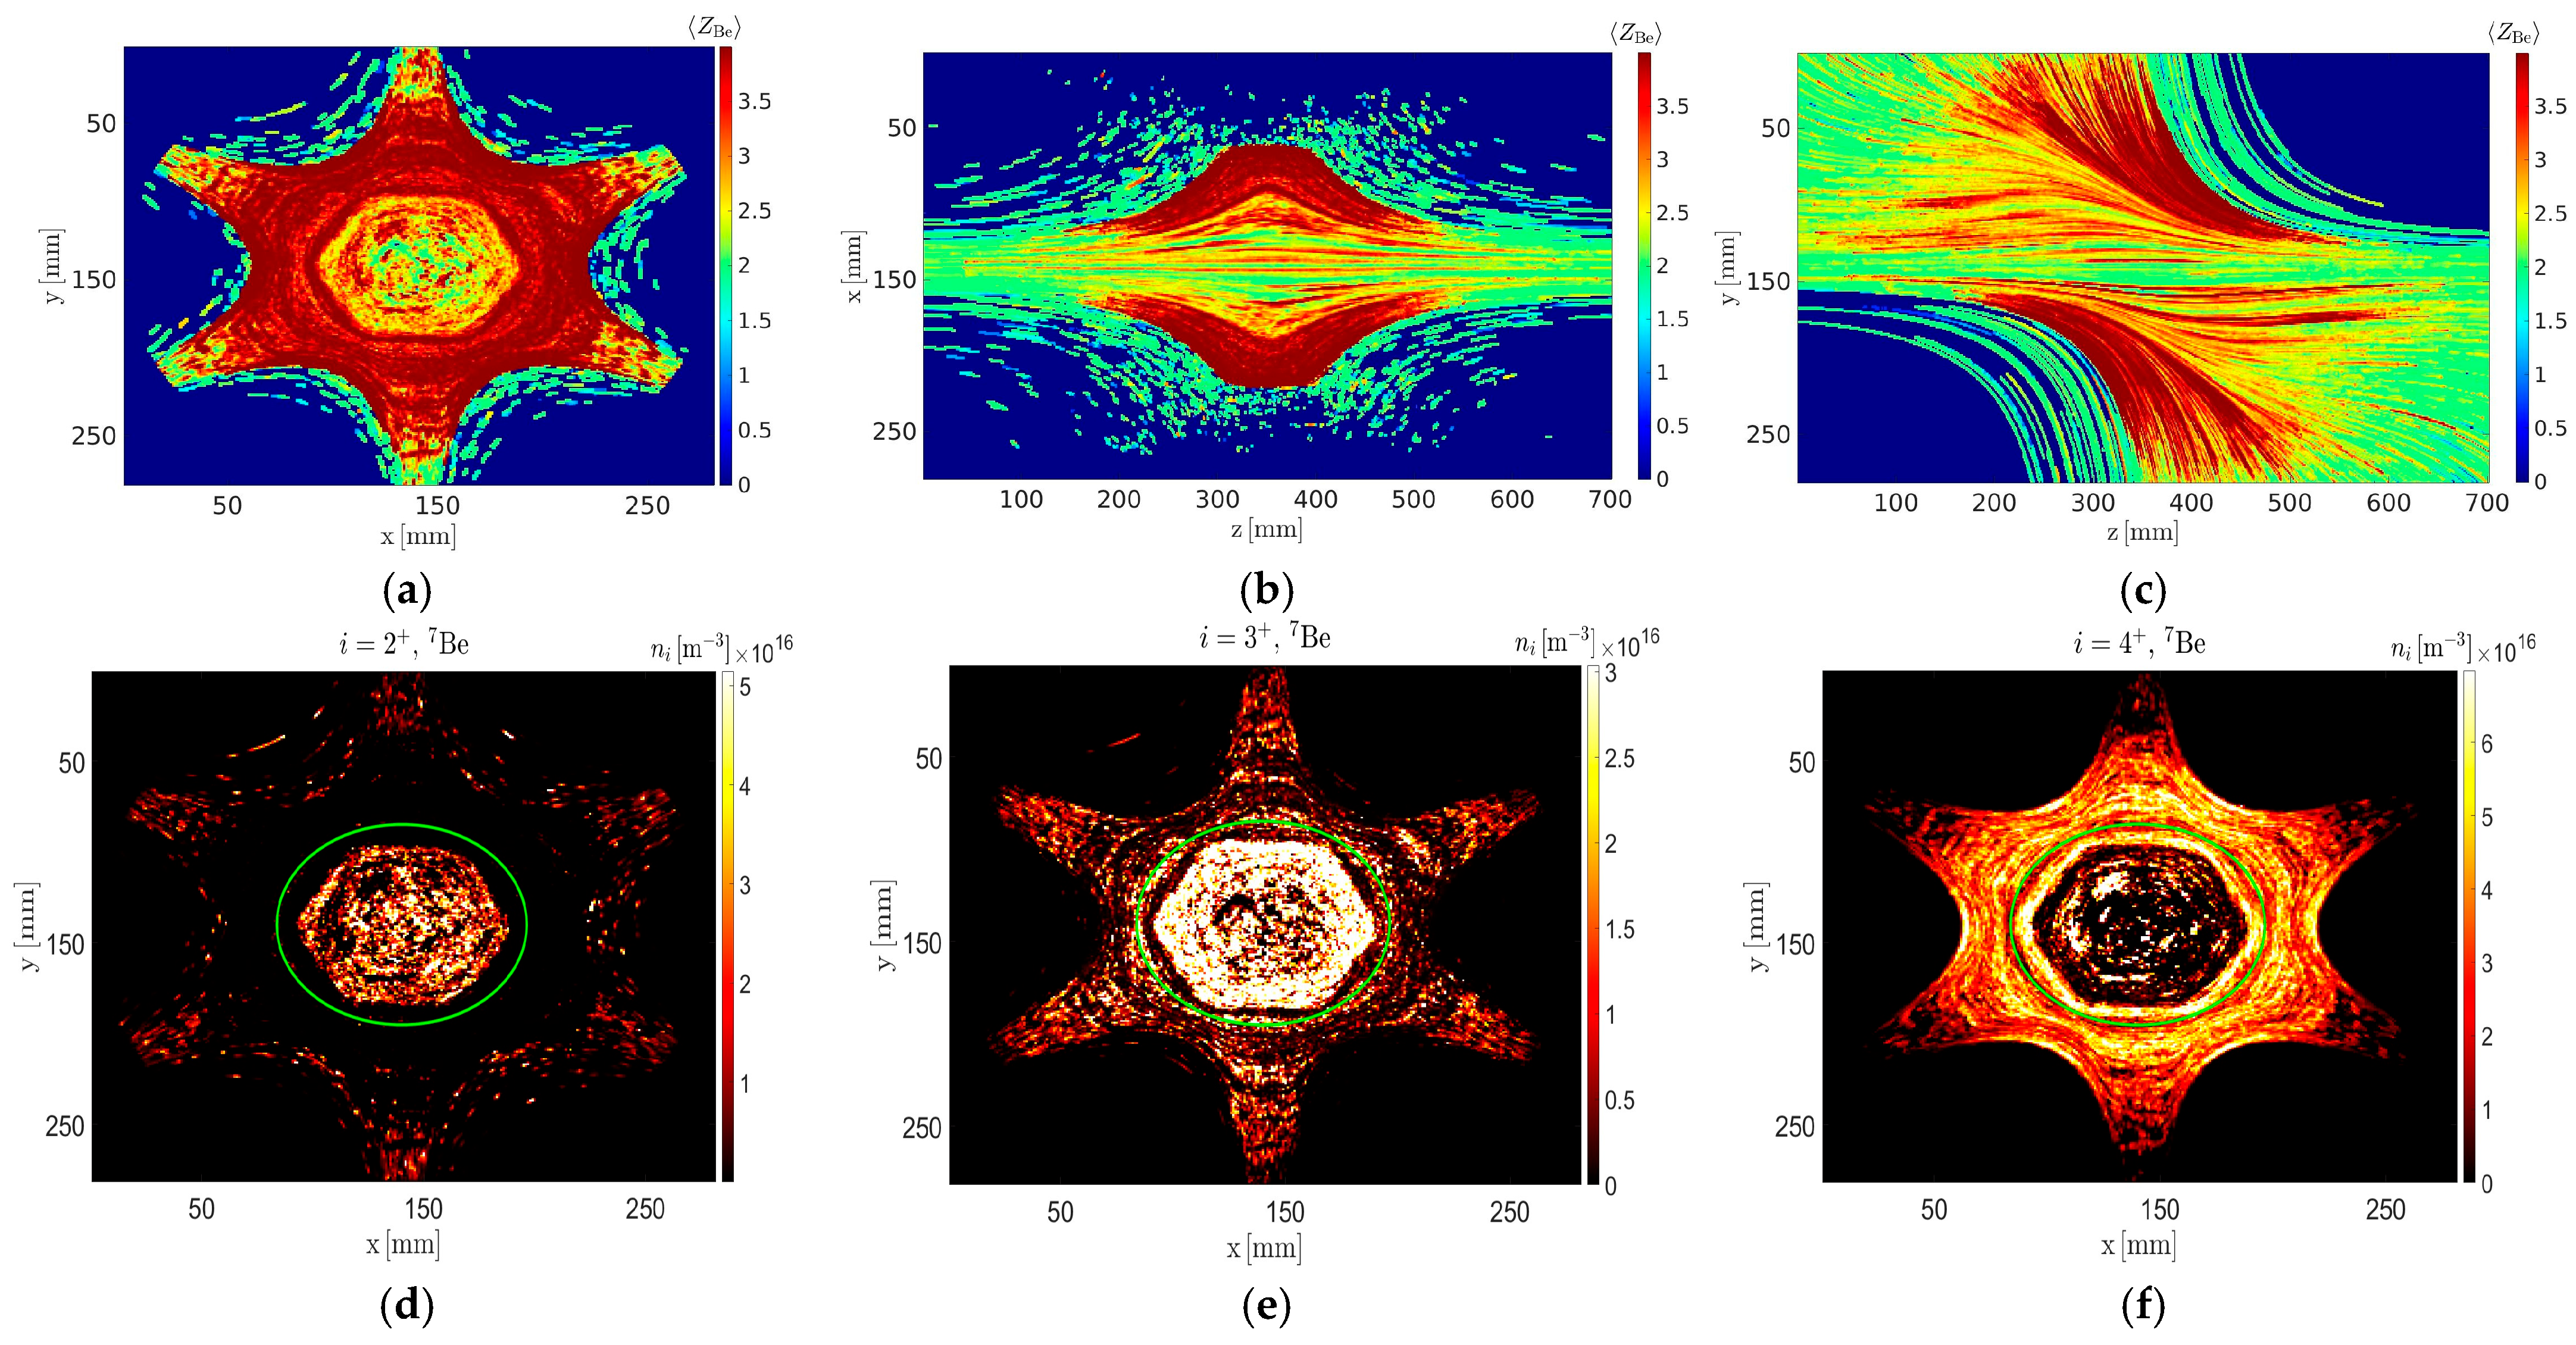
3.1. Spatial Distribution of 7Be CSD

The morphology of an ECR plasma is determined by the interplay between the frequency of the injected microwaves, the magnetostatic field profile, the geometry of the plasma chamber, and the gas pressure. Broadly speaking, the resonance heating process concentrates the bulk of electron thermal energy into a small, ellipsoidal core called the plasmoid, surrounded by a cool, rarified region called the halo. The plasmoid is mostly composed of warm and hot electrons which carry out the sequential ionization of buffer and radio-isotope atoms. Therefore, to quantify the feasibility of studying decay dynamics of any isotope in PANDORA, it is necessary to understand the spatial distribution of plasma density and energy, estimate the degree of variation expected, and confirm whether said variation occurs in a region visible to the g-ray detector array.
To simulate the spatial characteristics of an ECR plasma, a set of full-wave Particle-in-Cell (PIC) codes which can generate 3D maps of electron density ne, and energy density Ee, consistent with the electromagnetic field of the injected microwaves, was properly developed [45,46]. The codes take the operating parameters of the plasma as input—microwave frequency, RF power, and magnetostatic field—together with the chamber geometry to run an iterative scheme where electrons are first moved by a particle pusher in the electromagnetic (EM) field defined by the empty chamber, and then the field is updated according to the new positions of the electrons. The iteration continues till a convergence between ne, Ee, and EM field is reached. In their current formalism, the electron PIC codes assume no explicit dependence of the operating parameters on the buffer element. The former are, in fact, the independent quantities which determine ne and Ee, and the buffer ion densities adjust themselves to the resultant electron maps keeping the quasineutrality condition. The concentration of the isotope, c, can be maintained by varying the amount of material fluxed proportionally with RF power.
The PIC codes were applied to the PANDORA trap, and the projections of ne and Ee along various planes are shown in Figure 3.
The electron density and energy projections accurately reproduce the physics of resonance interaction in ECR plasmas. As can be noted from Figure 3a, the plasma ellipsoid concentrates most of the density, which peaks around 8 × 10¹⁸ m−3, which is the cutoff limit corresponding to the microwave frequency used (see [45] for more details). The extended traces along the axial and radial directions seen in Figure 3b,c mirror the magnetostatic field lines which are generated by the solenoid and sextupole and along which the electrons move in the plasma. The hexagonal structure shown in Figure 3a is the projection of a tri-cuspid rotated by 120°, characteristic of the radial magnetic field in an ECR ion source. The rotation can also be appreciated in Figure 3c—the density lines switch directions on crossing the mid-plane to coincide with the sextupoles. Similar features can be observed in Figure 3d–f which plot the electron energy density instead. The bright regions with Ee ~ 400 eV are the resonance layers where the energy transfer between microwaves and electrons occur.
The PIC codes can also be used to simulate the space-dependent CSD of buffer and 7Be ions in the plasma. These studies are ongoing, but in the meantime, the spatial profile of the CSD is approximated using a simpler approach. Assuming the electrons follow a Maxwell distribution, a spatial map of temperature can be defined through the expression Ee = (3/2) Te. The CSD and density of buffer and 7Be ions can then be locally calculated in each simulation cell using a suitable collision-radiative model. The locality assumption implies that the ion population kinetics are completely defined by the electron properties in that cell and are independent of ion transport in the plasma. While this is a strong assumption, it suffices for the objective of this work, which is to provide a first of its kind sensitivity study based on quasi-realistic dynamics of ECR plasmas.
The 3D maps of CSD were generated using the collision-radiative model employed by FLYCHK [47]. FLYCHK is a population kinetics code developed for accurately predicting atomic spectra in different kinds of plasma, under (non) local thermodynamic equilibrium [(N)LTE] conditions. The code takes ne and kBTe as input, and the atomic number of the ion, and calculates the CSD that would be consistent with the inputs. For this work, a grid of 70 electron temperatures (from 1 eV to 200 keV) and five densities (from 1016 to 1020 m−3) was generated and passed as input to FLYCHK. The code was run for two atomic species in NLTE mode—the buffer ion He, and Be, the isotope of interest. The code calculated the probability of each charge state of each species pi corresponding to each parameter grid point. For ne < 1028 m−3, pi is density-independent.
The CSD calculated by FLYCHK was fit with spline interpolation functions of the form:
p i y = n = 1 4 a n y y 1 n 1
where y stands for kBTe and y1 = 1 eV, the lower bound of the temperature interval. The fitting procedure furnished the coefficients an. The an was then applied to the energy density of each simulation cell, resulting in 3D maps of He and 7Be CSD (hereafter denoted as piHe and piBe). To ensure the correctness of the approach, ΣpiHe and ΣpiBe were calculated in each cell and it was confirmed that the interpolated CSD summed to unity.
We used piHe and piBe to then calculate the respective ion density niHe and niBe, assuming total charge neutrality in each plasma cell. The CSD was converted to the ion density (in m−3) through the following expressions:
K = n e i = 1 2 i p i H e + c i = 1 4 i p i B e
n i H e = K p i H e
n i B e = c K p i B e
where K is a scale factor with the same units as density, and c is the concentration of 7Be relative to He. Equation (2) is essentially a charge balance equation which calculates the scale factor in such a way that the total positive charge (generated by He and 7Be) is countered by the total negative charge of electrons in that cell. We generated ion density maps for a set of different concentrations c = 5 × 10⁻², 1 × 10⁻², 5 × 10⁻³, 5 × 10⁻⁴, 5 × 10⁻⁵, and 5 × 10⁻⁶ to investigate the best conditions under which an in-plasma decay measurement of 7Be could be performed, optimizing on measurement time, uncertainty in experimental values and minimizing radioactivity below permissible levels. The results of the analysis are discussed in detail in Section 4.2 and Section 5.
The three-dimensional maps of 7Be CSD, consistent with the simulated ne and Ee, are shown in Figure 4. The top row shows 2D projections of the mean charge <ZBe>, which is indicative of the spatial distribution of the charge states. Regions with higher mean charge denote a larger presence of more ionized species. It can be noted that inside the effective plasma volume (marked by non-zero values of ne and Ee, see Figure 3), <ZBe> varies between two and four, meaning that most of the Be ions are present in charge states i = 2+, 3+, and 4+. In fact, we calculate that the density of 7Be1+ is merely 3.76% of the total isotope density. It can also be observed that <ZBe> is low deep inside the plasmoid and along the axis but is higher near the resonance surface and along the magnetic branches. This indicates that 7Be2+ is primarily formed in the plasma core where the electron energy density is lower, while 7Be3+ and 7Be4+ populate the outer regions where Ee peaks.
The bottom three panels of Figure 4 each show a projected view of niBe on the x-y plane for single charge states, i = 2+, 3+, and 4+. The images refer to the highest concentration considered in this paper, c = 5 × 10⁻². The maps are consistent with our explanation above. They also show that while the peak densities of each of the charge states is comparable, i = 2+ is more sparsely distributed; whereas, the higher charges are more uniform and even in their spatial profile.
The green ellipse is intended to depict the boundary of the plasmoid. Our calculations show that roughly 70% of the total 7Be density is located inside the plasmoid, as can also be evinced in Figure 4d–f. The 30% outside the plasmoid is mostly in the form of 7Be4+, which extends along the energetic magnetic branches. It should be underlined here that these estimates are obtained in the absence of important plasma effects such as the electrostatic double layer which is self-generated during ion transport and prevents excessive loss outside the plasmoid. The complete PIC-MC simulations of ions are expected to show a higher confinement inside the plasmoid.

3.2. GEANT4 Simulations for the Evaluation of the 3D Array Efficiency Map

To measure in-plasma β-decays, a γ-ray detector array has been designed using GEANT4 simulations (GEANT4-10-06-Patch-02 version and reference physics list QBBC) as described in detail in [23], in order to count the number of β-decays by measuring the subsequently emitted γ-ray from the excited states of the daughter nuclei.
These simulations allowed to optimize the detector array configuration and materials, including collimation systems, to ensure accurate measurement of β-decay rates within the plasma environment. The simulated setup (shown in Figure 5) incorporates a detailed model of the ECR plasma trap, including the plasma chamber and the detector array.
The main elements are the vacuum chamber (shown in grey and labelled as (1)), the whole magnetic system (labelled as (3) with axial coils represented in yellow (4) and hexapole magnets in red (5)), the cryostat (labelled as (6) shown in purple), and the external iron yoke (in dark grey). Several holes have been designed both in the plasma chamber (labelled as (2)), in the cryostat structure (labelled as (7)), and in the external yoke to be collinear and have lines-of-sight to place both diagnostics and detection systems, as sketched in Figure 1b and Figure 2.
A total of 4.1 × 10⁹ events were simulated, assuming an isotropic homogeneous volumetric cylindrical source corresponding to the volume of the PANDORA plasma chamber. We fixed the emission energy at Eγ = 477.6 keV, which is the energy of the 7Li emitted γ-rays after the 7Be β-decay (as reported in Table 1).
In Figure 6a–c, the 2D maps of the total number of γ-ray tracks which impact on the 14 HPGe detector array are shown. They are 1.44 × 10⁶ in total. Different views of the 3D maps are also shown in Figure 7. The photopeak events, which impact on the 14 HPGe detector array releasing their whole energy, are instead 3.9 × 10⁵, and their corresponding 2D maps are shown in the Figure 6d–f.
These simulations clearly also show the volume under investigation by the combined lines-of-sight for each of the detectors. It is evident that the array has been configured in such a way the detection regards especially the γ-emission occurring the in-plasma core, where we expect to have larger intensities of γ-ray emission considering the overall contribution of all the 7Be charge states, as confirmed from results shown in Section 4.1

4. Results

In this section, we use the numerically simulated CSD and density maps of 7Be discussed in Section 4.1 to obtain 3D maps of secondary γ-rays emitted during the isotope decay.
Furthermore, the results obtained from Monte-Carlo GEANT4 simulations for determining the γ-detection efficiency of the HPGe detector array will be presented (see Section 4.2). Additionally, a sensitivity study evaluated through a virtual experimental run will be discussed.

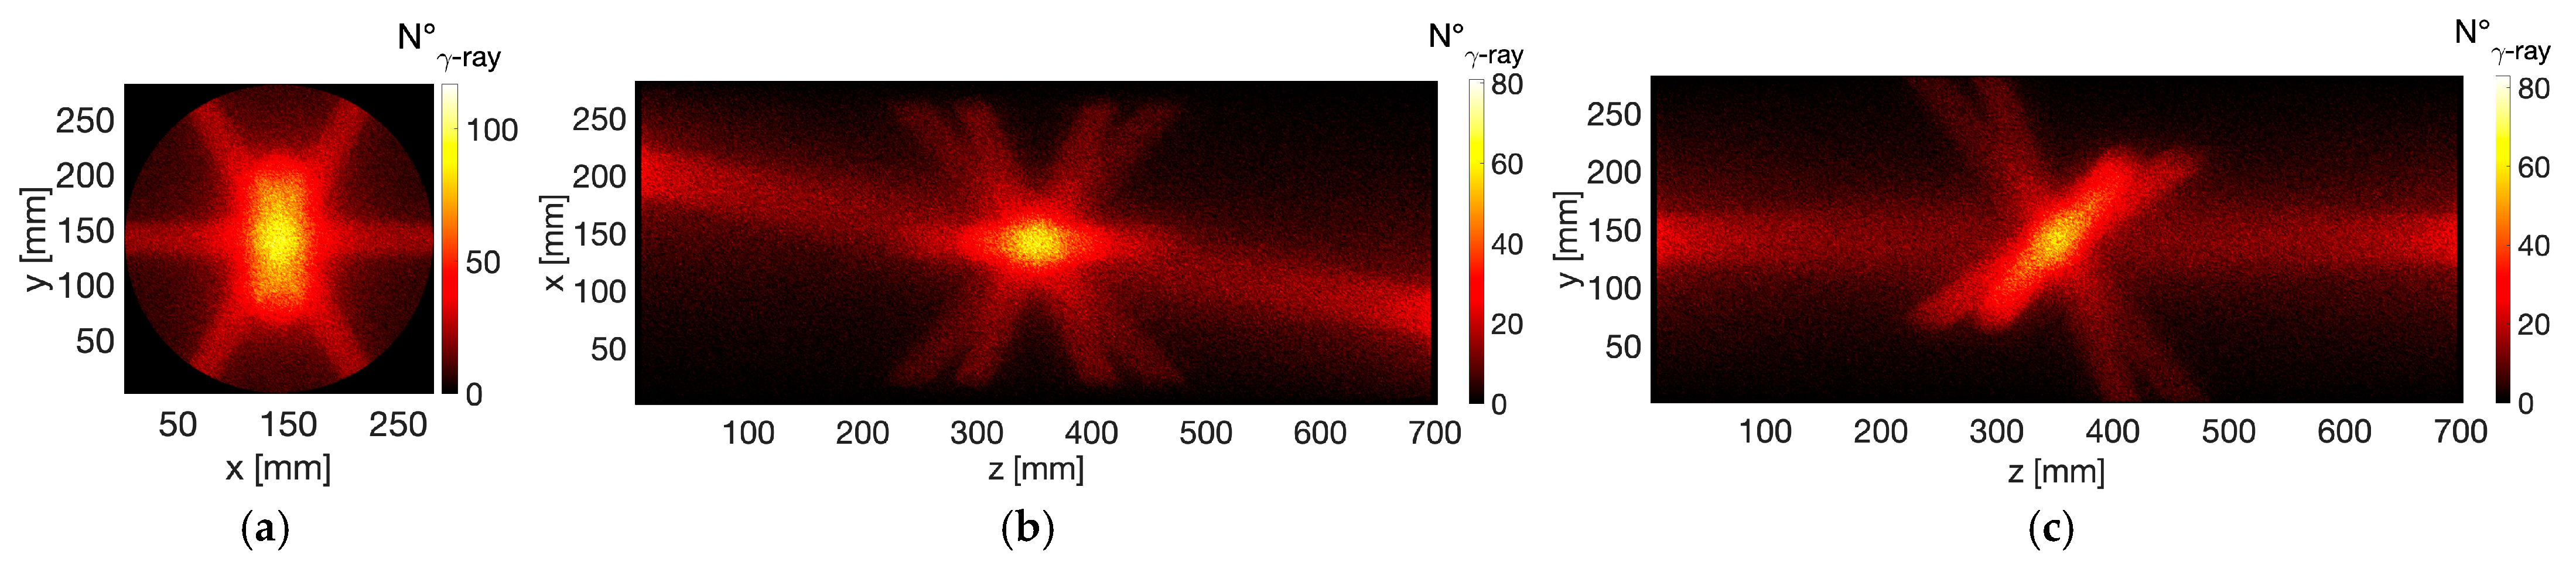
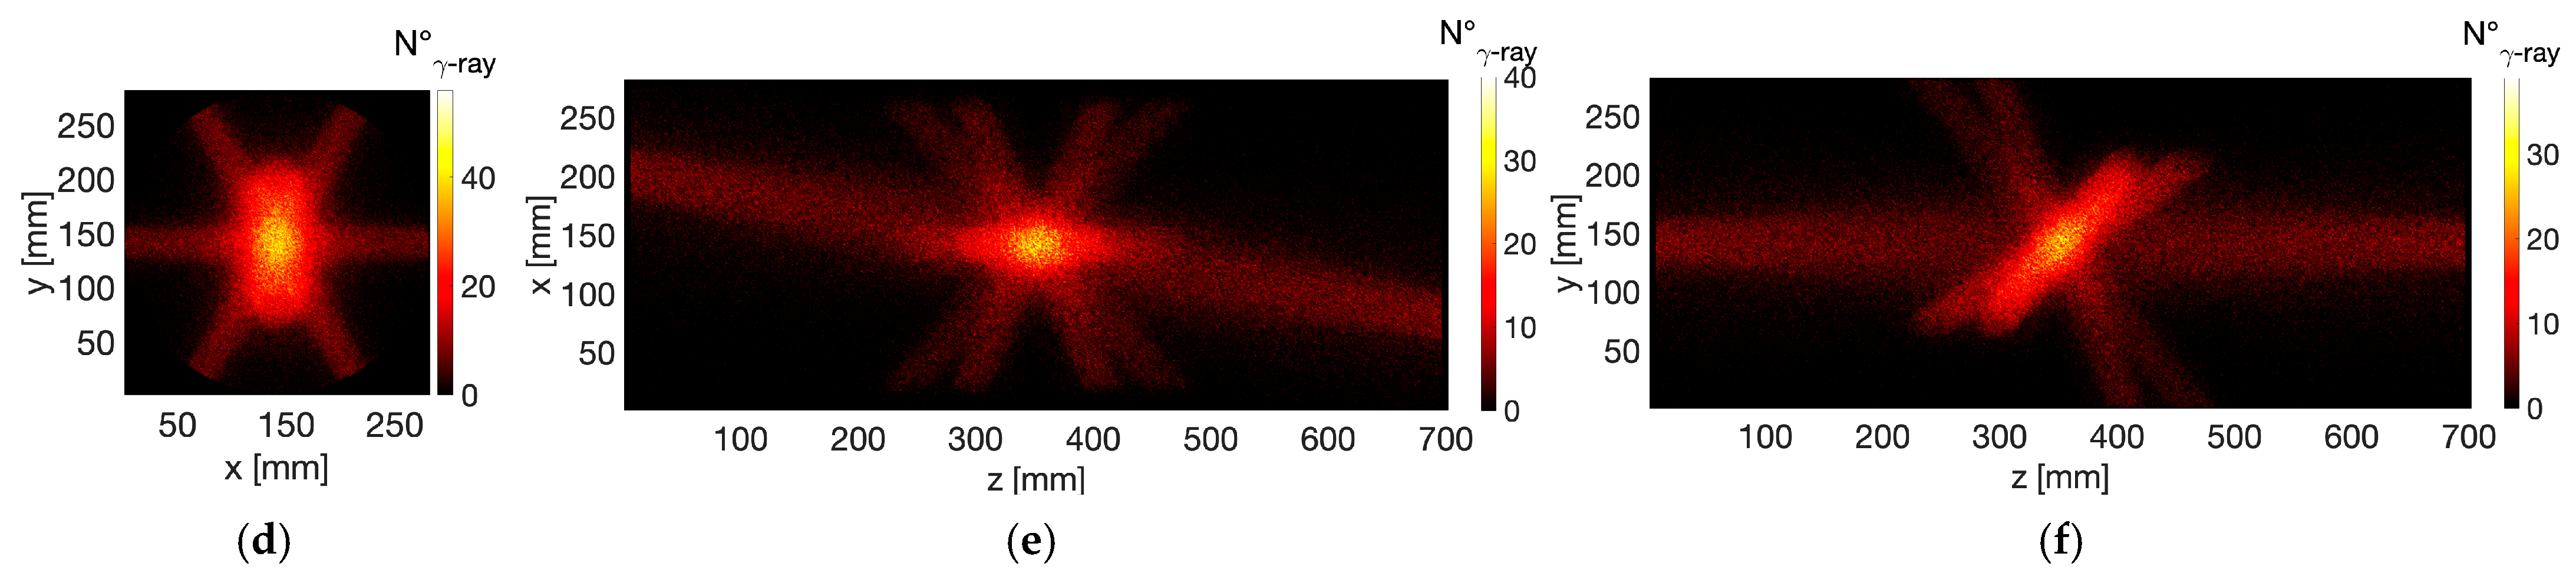
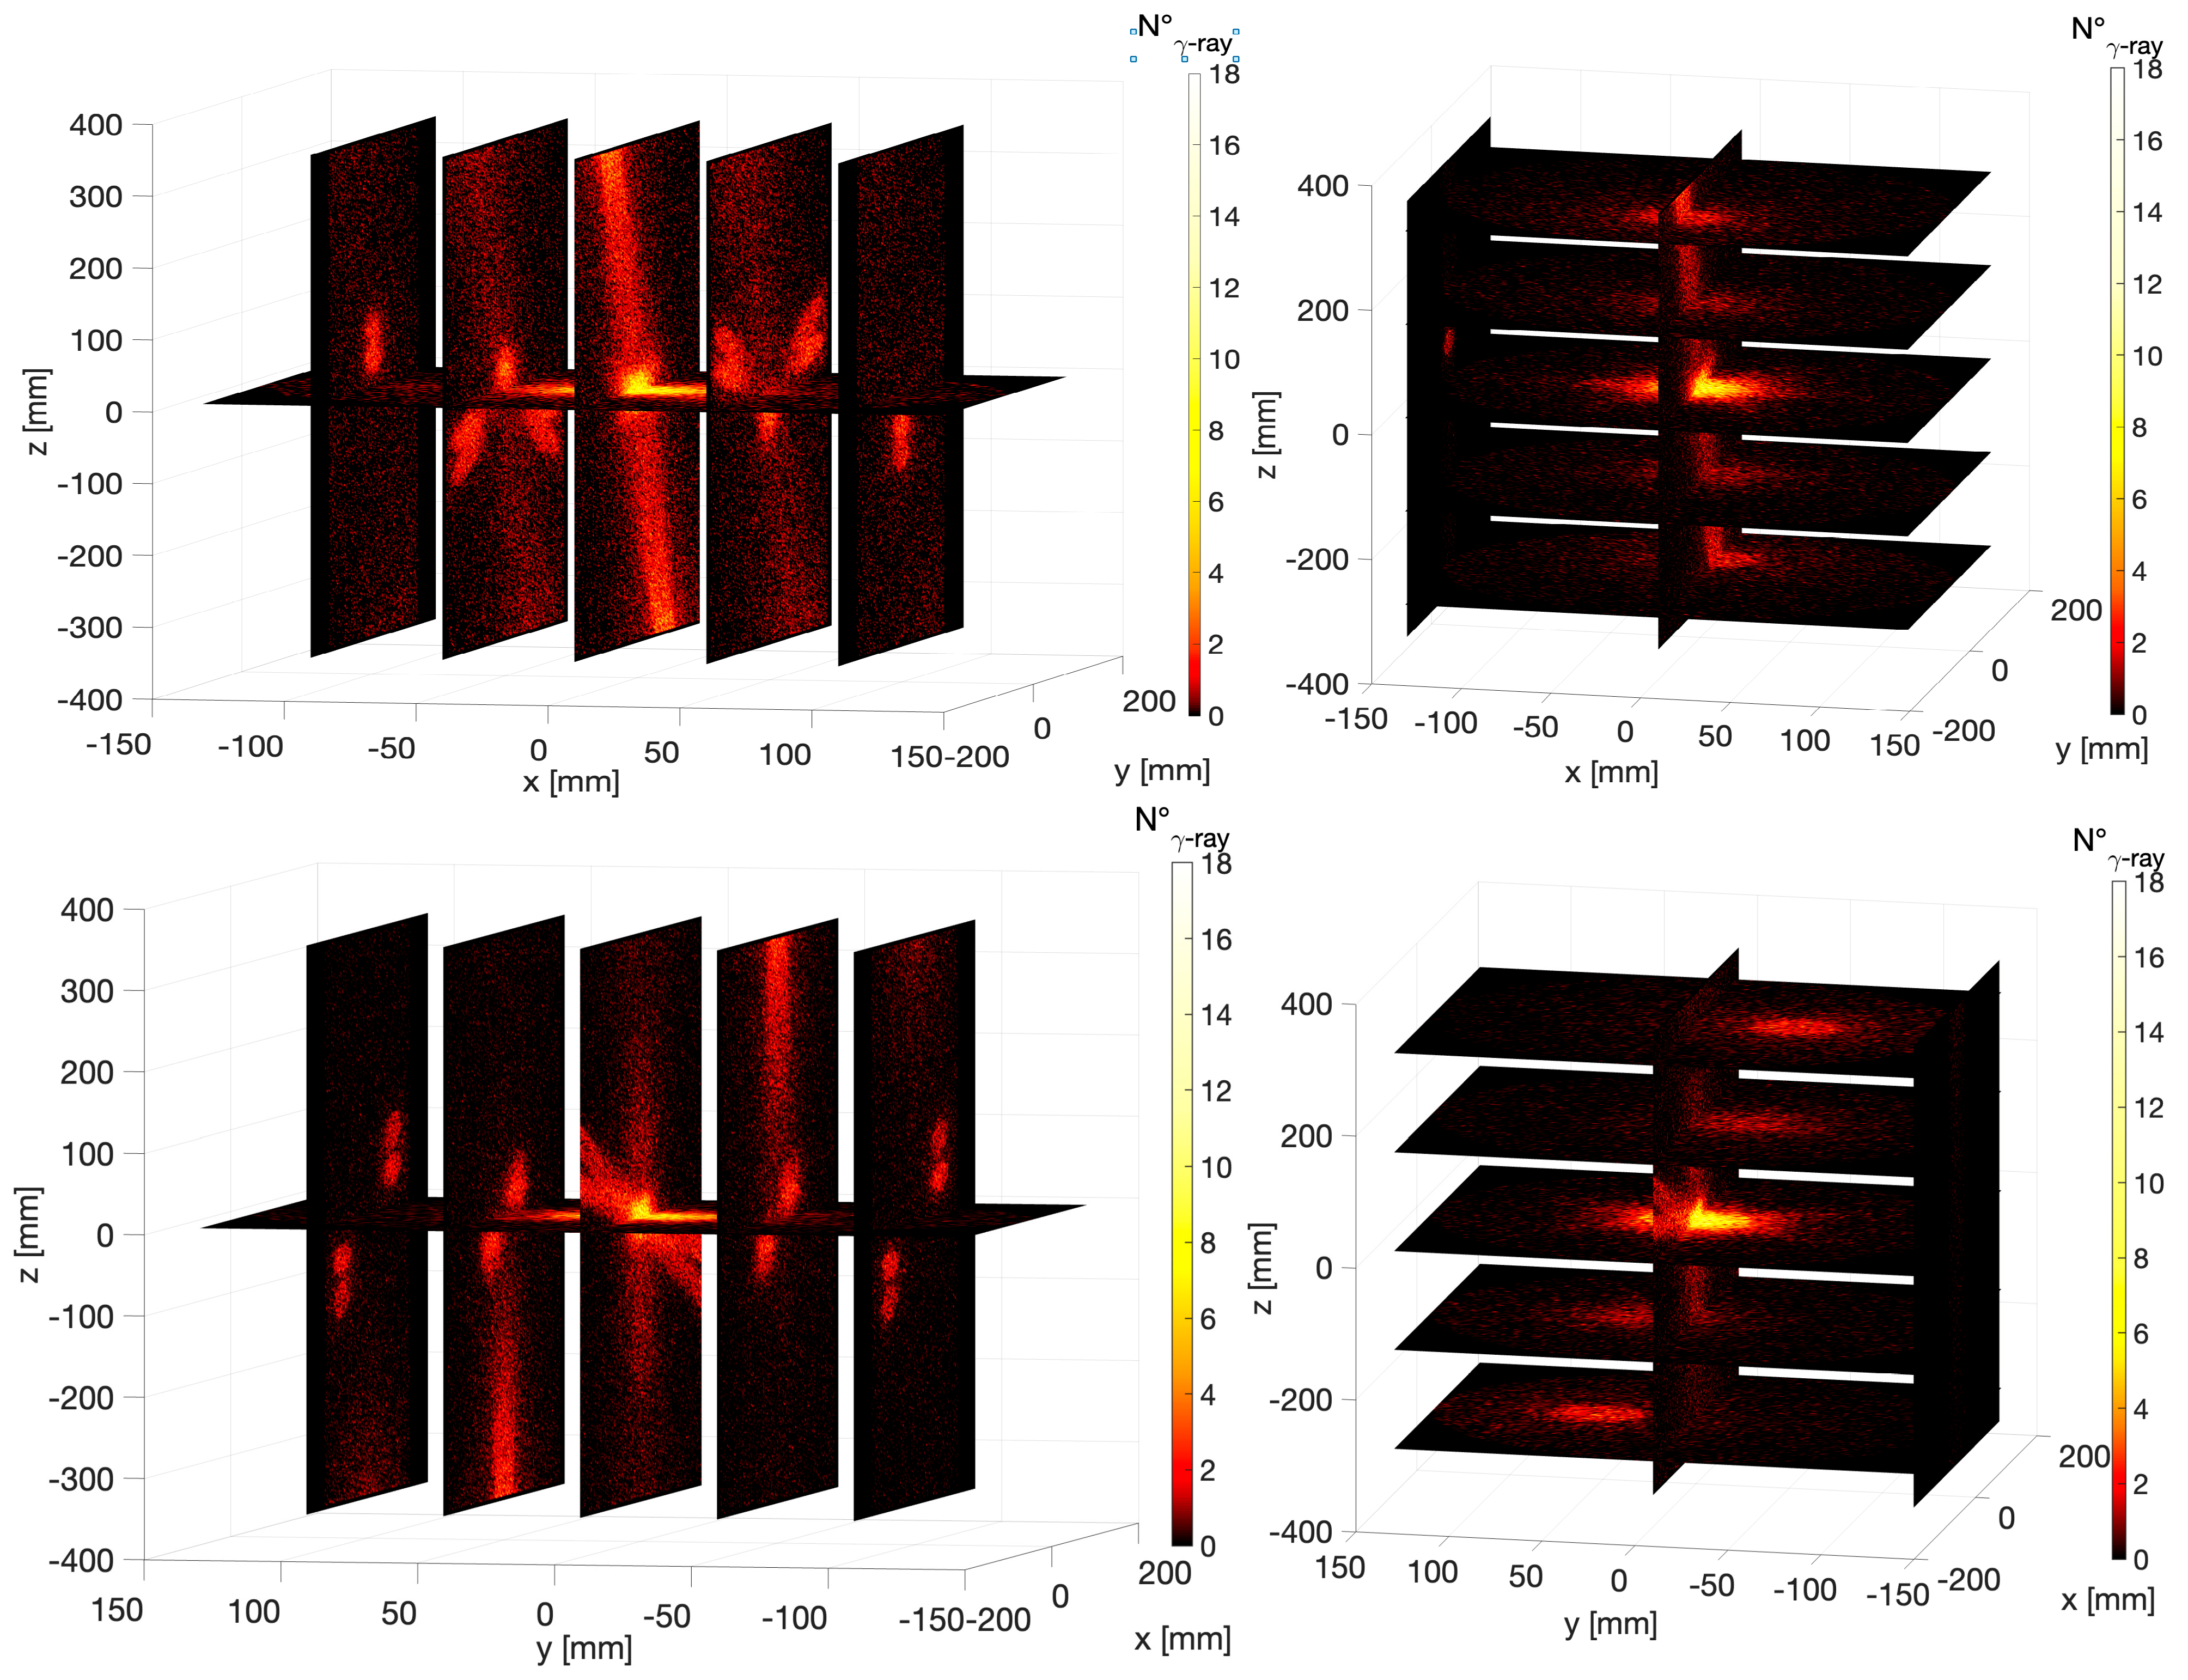
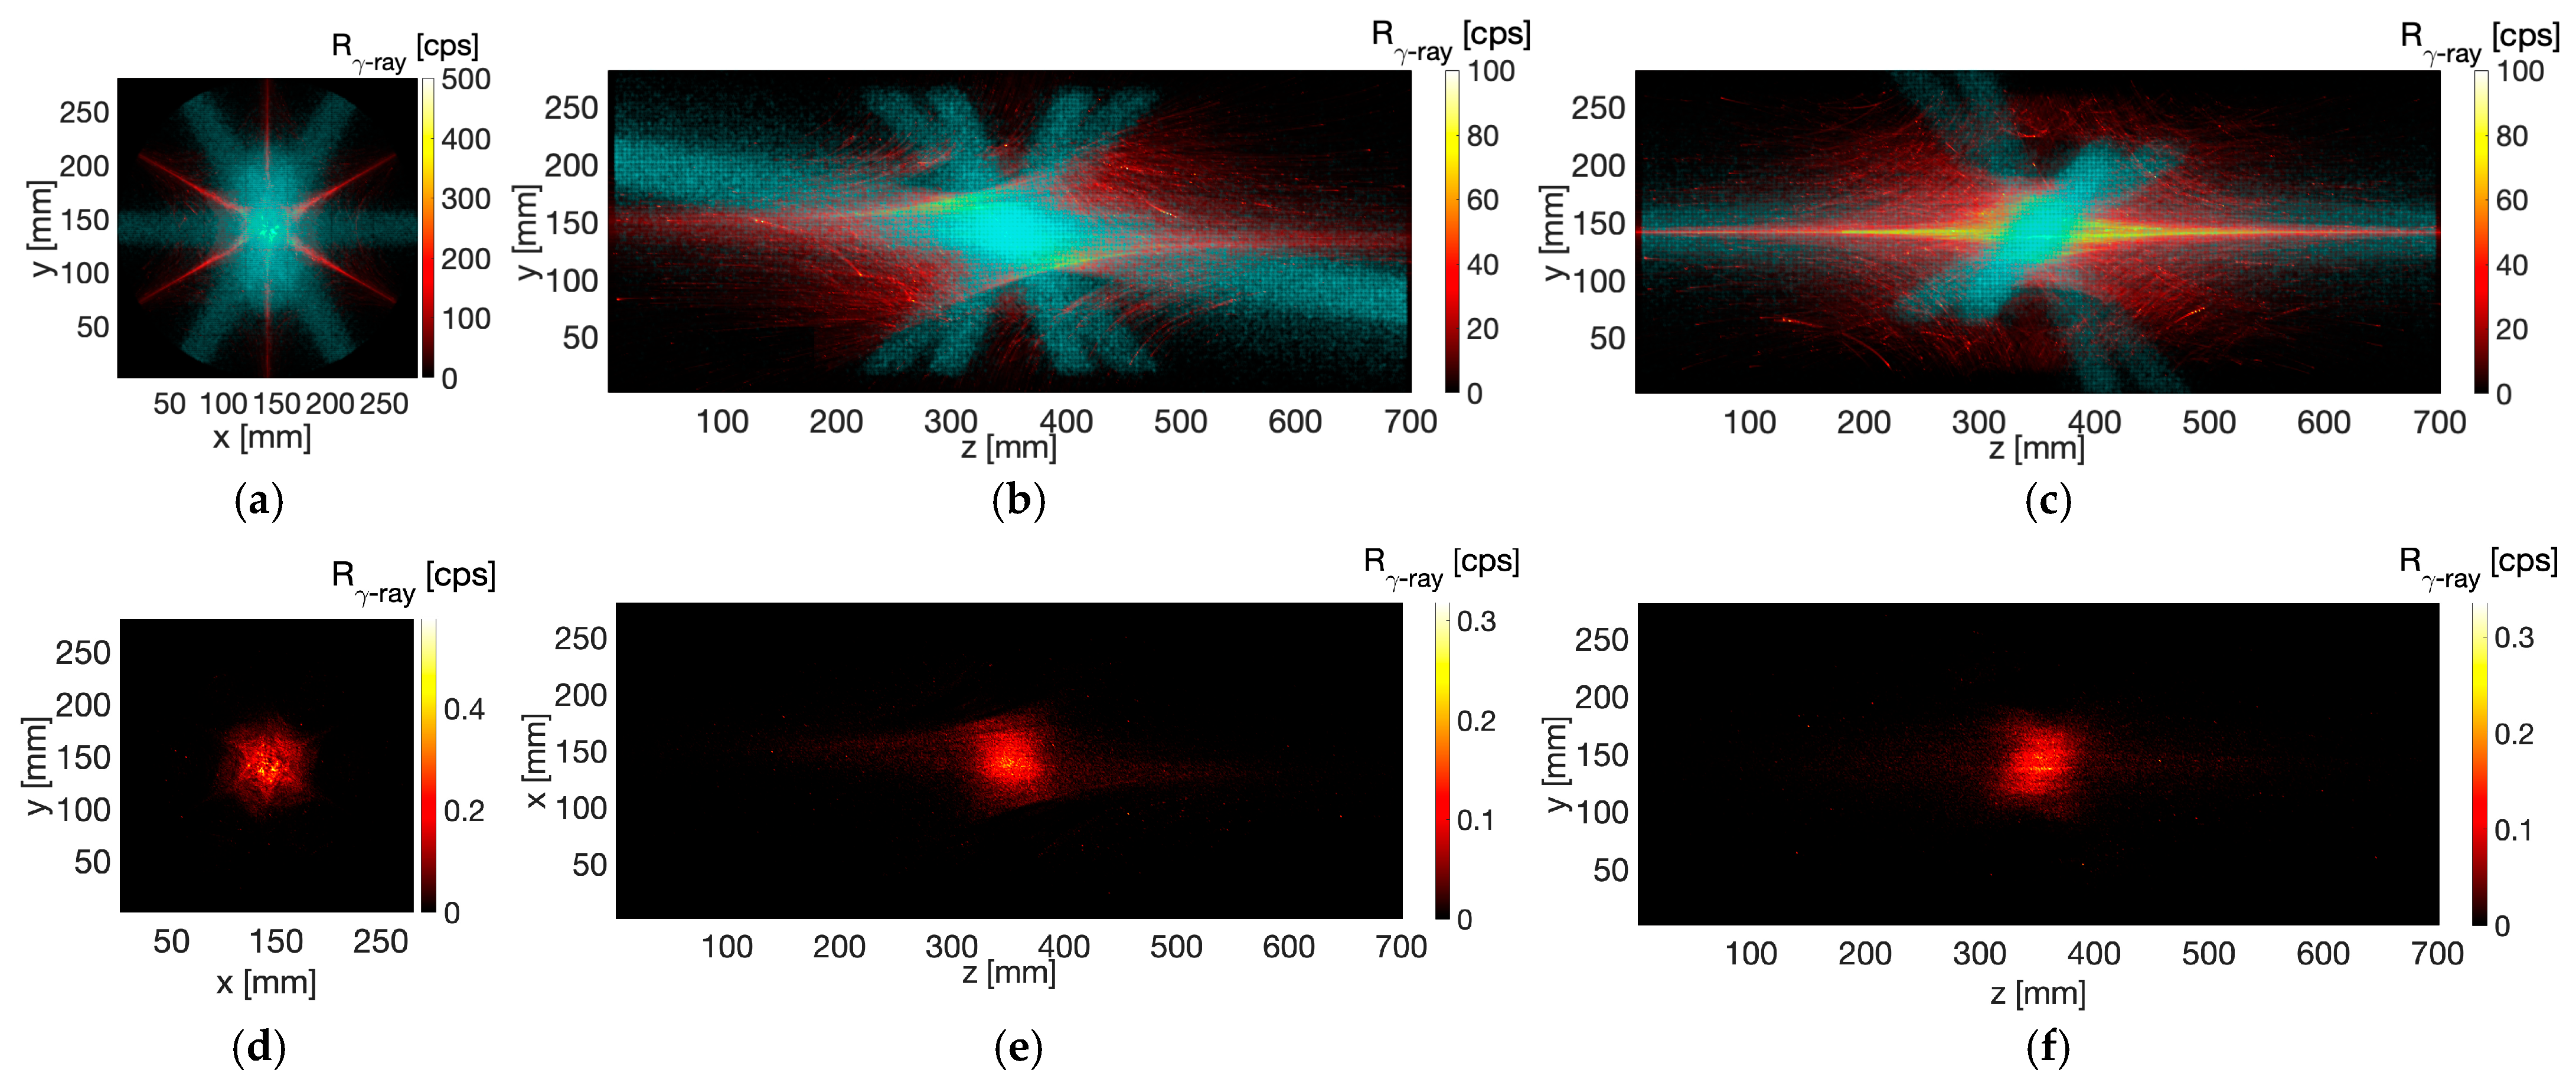
4.1. Spatial Distribution of Secondary γ-Emission

The spatial distribution of emissivity rate (in counts per second) of secondary γ-rays produced by the decay of 7Be can be calculated using the following expression:
N O n γ B e 0 , i + = i = 0 4 n i B e λ i * V p
where λ i * is the decay rate of each charge state, i, and Vp is the emissivity volume. niBe refers to the ion density as calculated in Section 4.1. We consider γ-emission from each simulation cell, Vp = 10−9 m3, corresponding to a cubic cell of edge 1 mm which is the resolution of our matrices used in the PIC codes.
7Be undergoes electron capture to 7Li populating two different states, the 7Li ground state J π = 3 / 2 and the excited state J π = 1 / 2 at 477.6 keV. It is the transition from this state back to ground that generates the secondary γ. Since there is no change in the parity of the daughter nucleus and the total change in spin Δ I 1 , these transitions are allowed decays and their corresponding log ft values are 3.324 and 3.556, respectively [48]. Following the prescription in Takahashi–Yokoi [12] and Ref. [32], λ i was calculated as follows:
λ i * = ln 2 f 1 * f t 1 + f 2 * f t 2
where the two terms in the summation refer to the two transitions (denoted m from hereafter) and (ft)1,2 = 10log (ft). The term f* is the lepton phase volume of the decay, calculated as follows:
f m = x σ x π 2 β x 2 Q x , m m e c 2 2 S x , m
In Equation (7), x refers to the atomic orbital from which the capture occurs, σx is the occupancy of that orbital, βx is the Coulomb amplitude, Qx,m is the energy associated with the capture from the orbital and for the transition m, and Sm,x is the shape factor. These quantities have been extensively studied in Ref. [31] and hence only the results are discussed here.
Table 3 reports the EC rate for each charge state, assuming that the ions remain at their atomic ground level. The electronic configurations are also reported. As can be seen, the decay rates do not change much from neutral to doubly ionized 7Be because the decay primarily proceeds through capture of electrons from the K-shell which remains full till i = 2+. In hydrogen-like ions, the occupancy of the K-shell drops by 50% and consequently, the decay rate, while it completely vanishes in fully stripped 7Be. Since a large part of ions are expected to be in i = 3+ and 4+ states (Figure 4b,c), it can be foreseen that Nγ will be significantly lower inside the plasma than if the same total number of ions were to remain in the neutral state. This statement forms the basis of the sensitivity study presented in Section 4.2 and Section 5.
Figure 8 shows the projection of N O n γ B e 0 , i + on the x-y, x-z, and y-z planes, calculated using Equation (5), and the values reported in Table 3, corresponding to c = 5 × 10⁻² (5% of He density). The plots show the total in-plasma emission rate—it is the sum of emission from ionized 7Bei+ decaying at an effective rate λ*, and from residual 7Be0+ which are nevertheless present in the plasma as part of the ion CSD. Since the objective of the experiment is to detect and measure ionization-induced decay rate modifications, N O n γ B e 0 , i + can be used to separate the two contributions and furnish data on λ* alone within a certain uncertainty range (see Section 5).

4.2. Local g-Ray Detector Array Efficiency
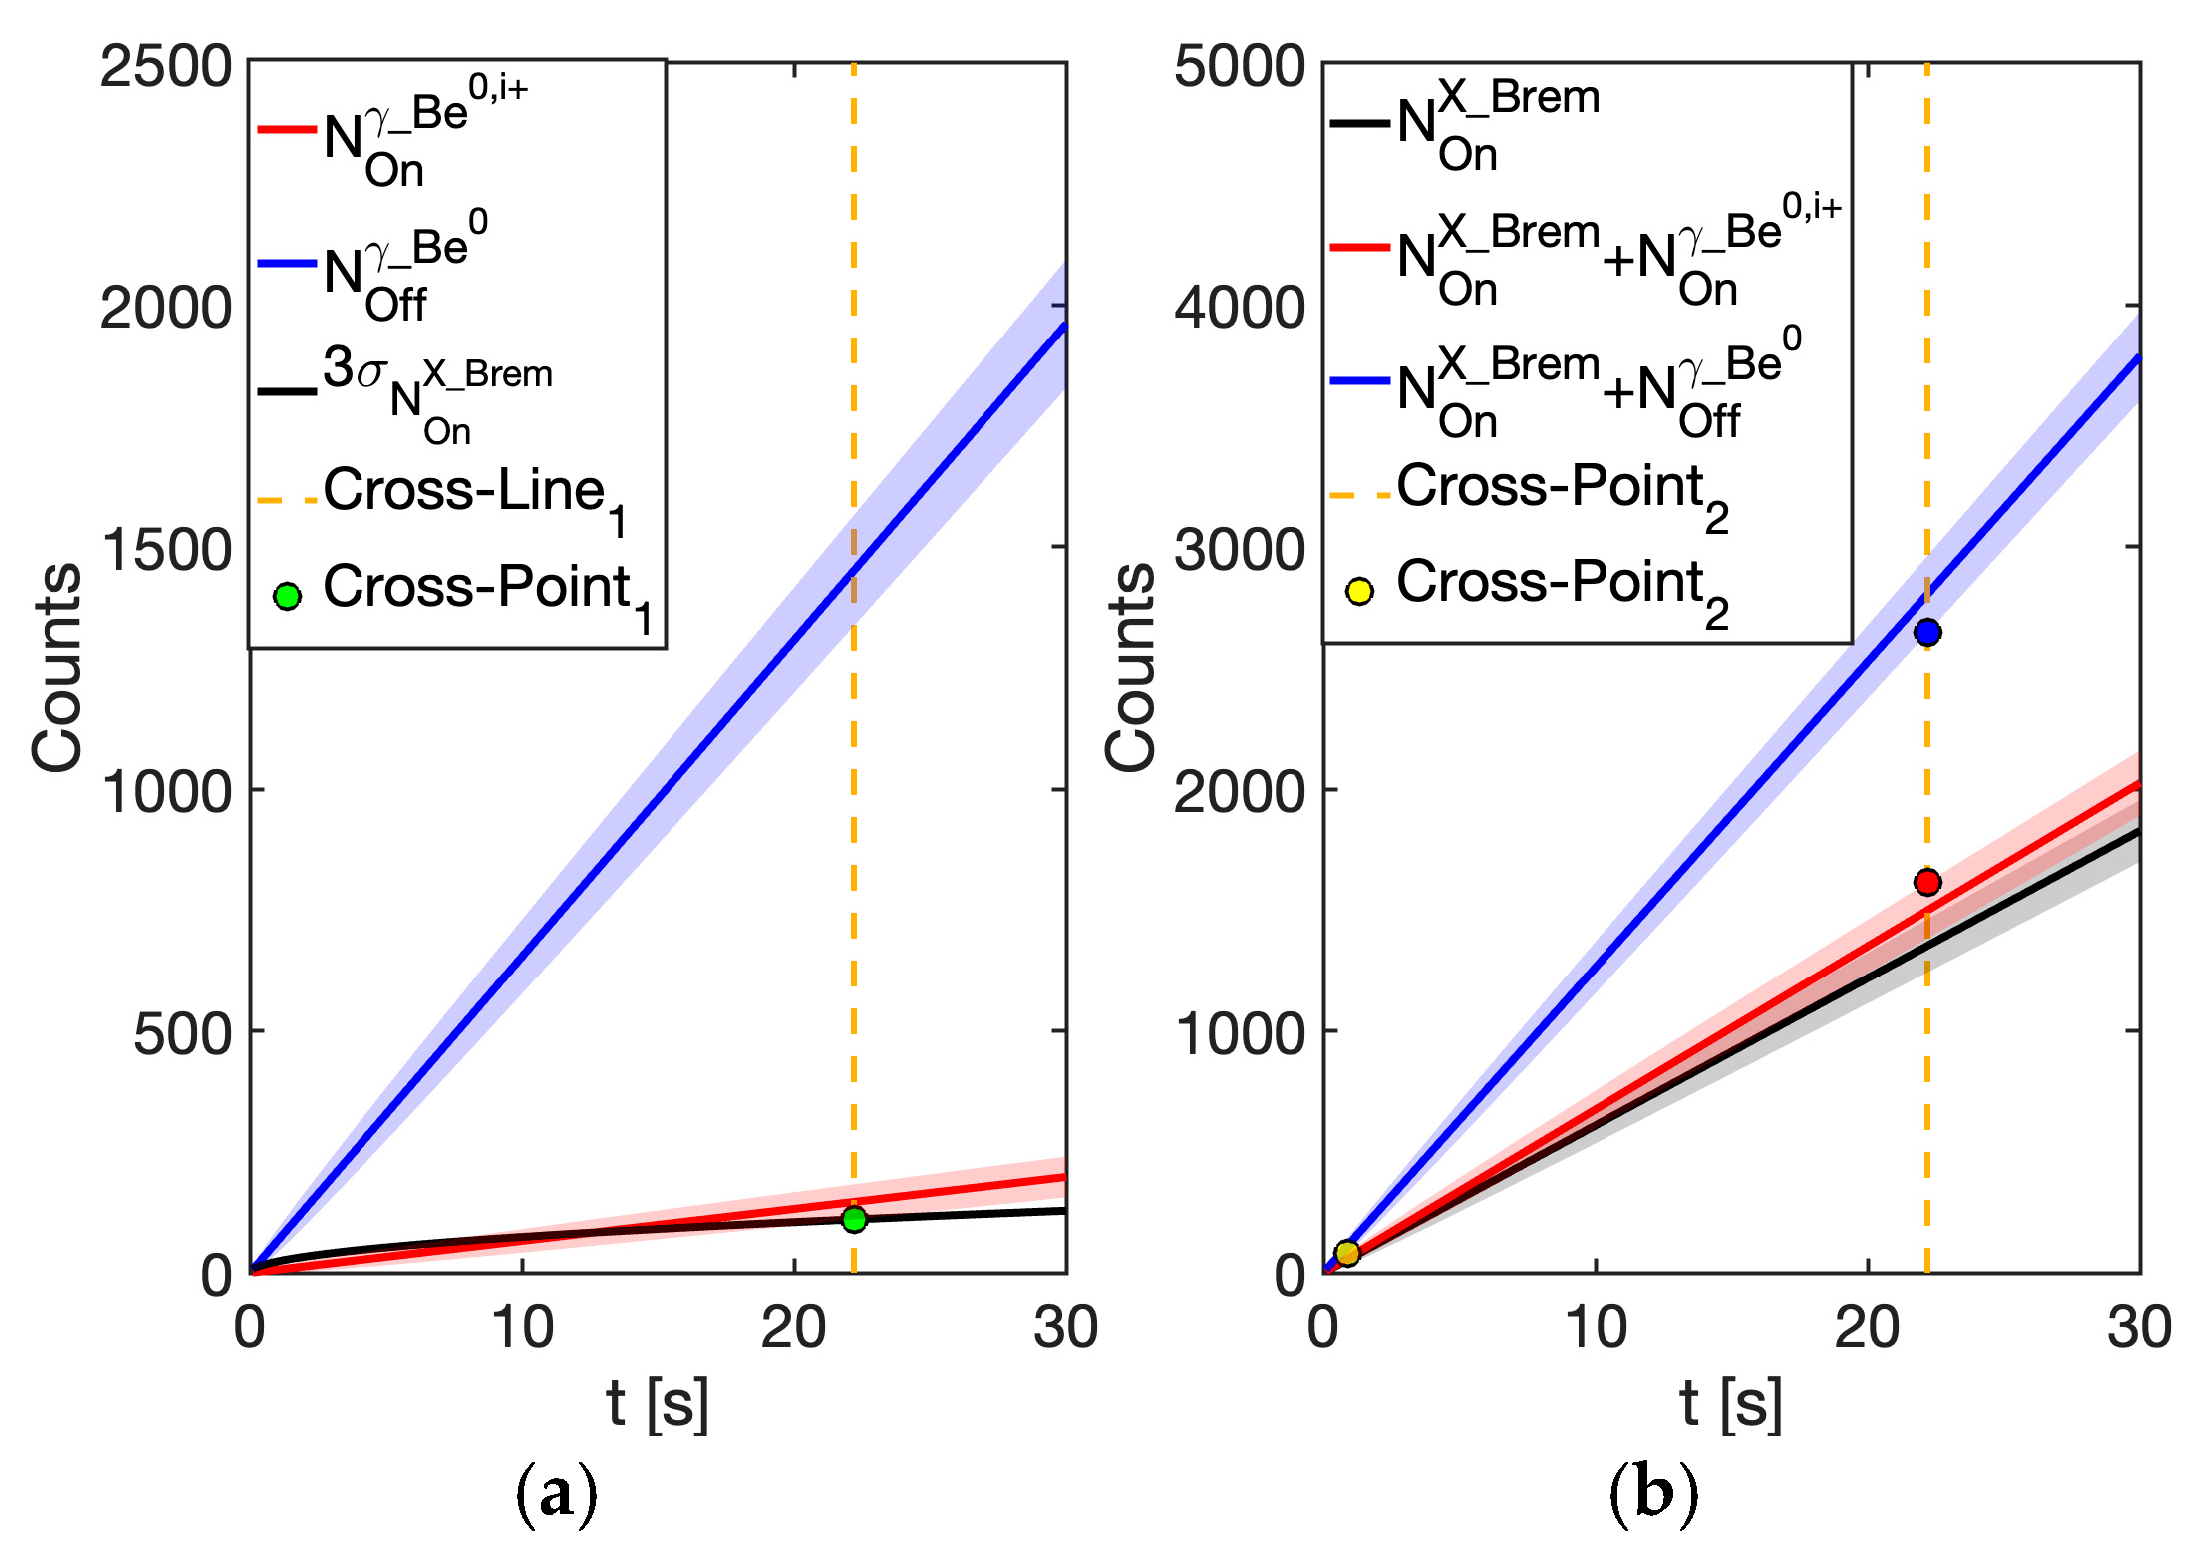
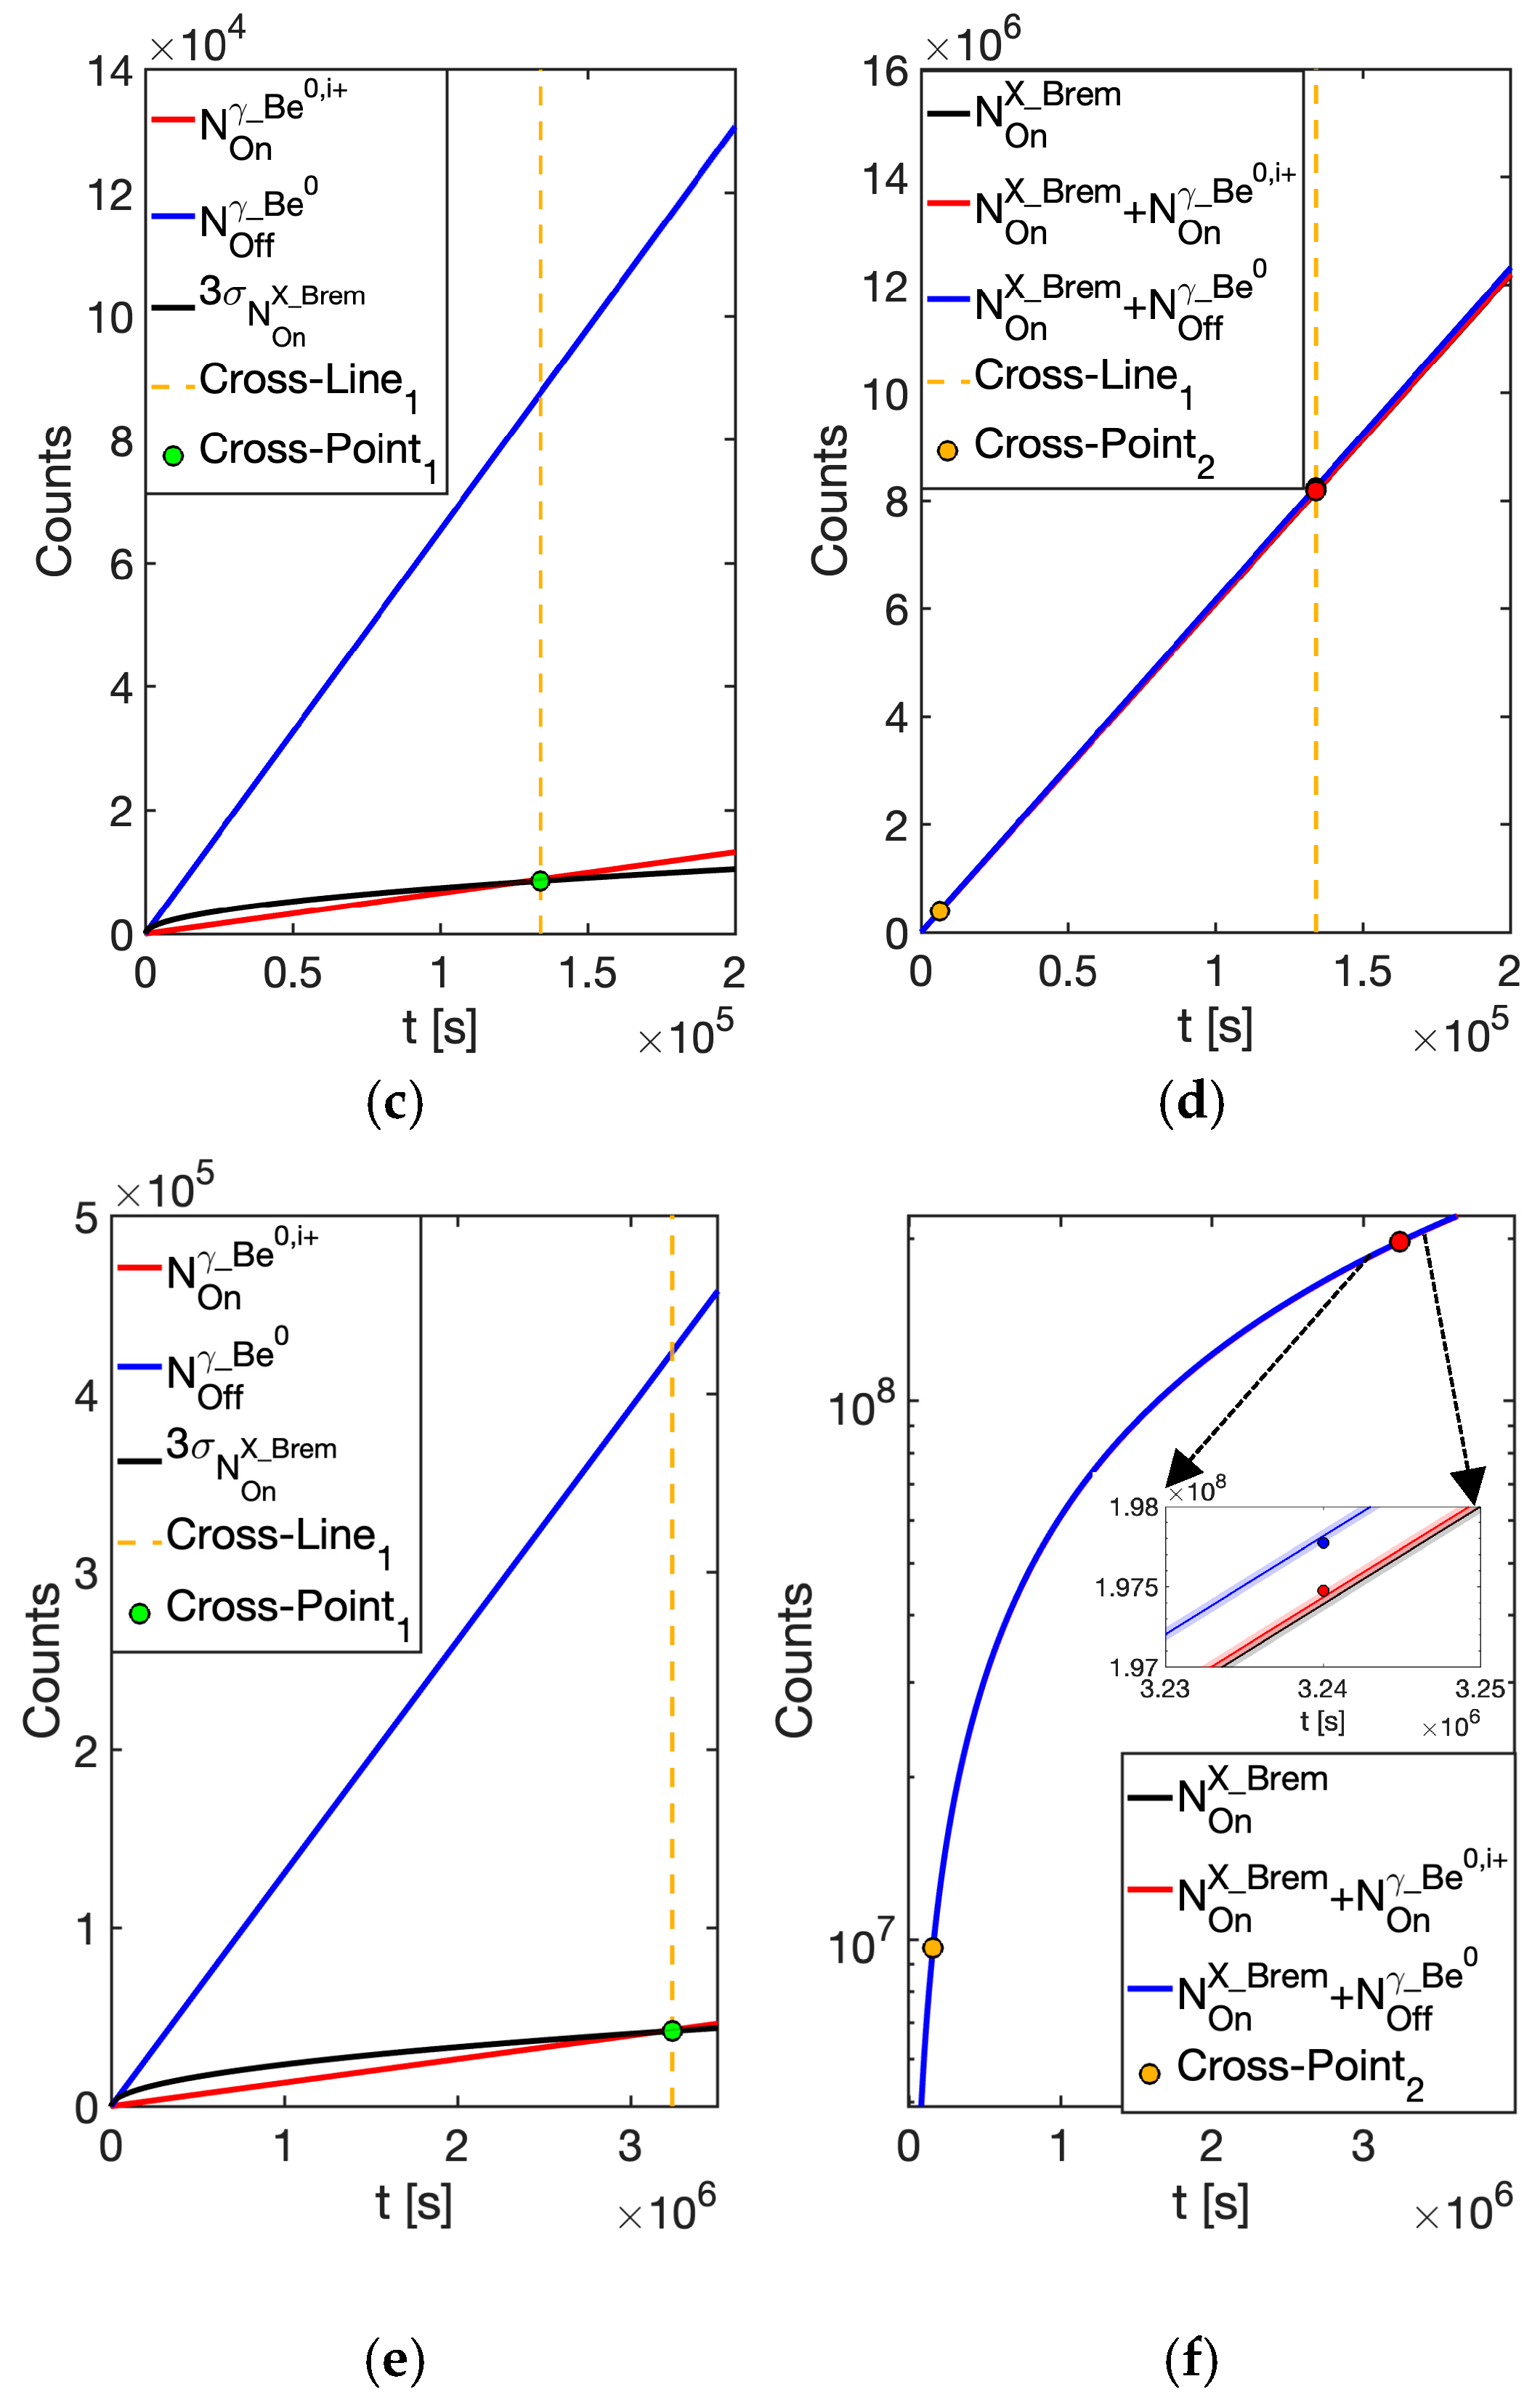
The results of the GEANT4 simulations are presented in Figure 9a–c, showing 2D spatially resolved maps of the geometrical detection efficiency (εgeom) of the γ-ray detector array. This represents the first instance of estimating volumetric, space-resolved efficiency using voxels of 1 mm3 in size. Additionally, the total detection efficiency (εTot) maps, which account for both geometrical and photopeak efficiencies, are displayed in Figure 9d–f.
The analysis begins with 2D γ-rays emission rate maps of the PANDORA experimental configuration (Figure 8 in Section 4.1). By combining these spatial distributions with the total detection efficiency of the HPGe array, we quantified the detectable γ-rays rate. Figure 10a–c show the superposition of γ-ray emission rate maps with the total efficiency εTot map (cyan and arbitrary units), highlighting key design features of the detection system.
A notable characteristic is that the detection system’s cones of view avoid regions where deconfined ions are present, corresponding to the positions of the most peripherical γ-rays. This design choice stems from the strategic placement of apertures for the γ-ray detectors, which were carefully positioned to avoid the so-called magnetic branches. These branches represent regions within the magnetic trap where the magnetic field lines are more intense. In such areas, background radiation due to intense fluorescence and Bremsstrahlung X-rays—arising from axial and radial electron losses impacting on the plasma chamber walls—is expected to be significantly higher. In fact, as happens for ions, hot electrons are deconfined as well, and they tend to concentrate along the magnetic branches, impacting on the metallic walls of the plasma chamber and emitting strong fluorescence X-ray radiation. This radiation is not included in the current background analysis. Nevertheless, the space-resolved efficiency maps shown in Figure 9 confirm that such a contribution should be negligible, as it cannot be detected, lying outside the HPGe detector’s lines of sight.
The product of the two maps (total array efficiency and emission rate) is shown in Figure 10d–f, representing the detection efficiency weighted by the effective number of photons emitted by the daughter nuclei following the β-decay of neutral and ionized 7Be across the entire volume of the PANDORA plasma chamber. A large fraction of the γ-rays is emitted (or deconfined) outside the ECR plasmoid and thus cannot be detected by the detector array. Consequently, all γ-rays which are not overlapped with the cyan maps represented in Figure 10a–c cannot be detected. For this reason, the total efficiency result is to be lower than the previous estimation where, in contrast, all photons were instead assumed to be distributed entirely within the plasma core region.
To assess the feasibility of achieving a 3σ significance level in measurement, we analyzed the Signal-to-Background (S/B) ratio. The main background sources are as follows:
  • Bremsstrahlung X-rays ( N O n X _ B r e m ): these originate from plasma self-emission and are particularly intense in loss-cone regions caused by axial and radial losses impinging on the plasma chamber walls.
  • γ-rays from excited 7Li nuclei following the β-decay of neutral 7Be ( N γ _ B e 0 ): these result from the γ-decay of daughter 7Li nuclei following the β-decay of neutral 7Be continuously injected into the plasma trap. This contribution cannot be experimentally distinguished from the γ-decay of ionized nuclei within the plasma ( N O n γ _ B e i + , where i is a given ionization state), which constitutes the signal of interest. This overlap undermines and limits the accuracy of in-plasma β-decay rate measurements attributed solely to ionized nuclei.
For both background contributions, we assumed and uniform spatial distribution within the ellipsoidal plasmoid volume. The diffusion and deposition of nuclei on the plasma chamber walls are being neglected, and, thus, also the corresponding background contribution due to their accumulation on the walls. Nonetheless, we are confident that this contribution—which would require more detailed simulations of plasma diffusion dynamics, as conducted in [39]—is not affecting the conclusions of this work. This is due to the lines of view of HPGe detectors that are optimized (as already discussed in Section 4.2) to detect merely the plasmoid, avoiding magnetic branches, and thus deposited materials on the plasma chamber walls whose main contribution would be limited to the areas in front of the lines of sight where HPGe are placed.
The first background contribution arises from self-emission of the He buffer plasma, an example of background spectrum characterized by an electron density of ne = 1013 cm−3 and a volume Vp = 1500 cm3, is shown in Figure 11. It was derived from measurements on existing traps and rescaled using an emissivity model [49] for the higher densities and volume of PANDORA plasmas.
For the γ-rays of interest (477.6 keV), the background rate was evaluated by integrating the spectrum within the detector’s intrinsic resolution window (0.59 keV at 477.6 keV), yielding N O n X _ B r e m = 4.7 × 10 4   c p s . Any environmental background contribution is negligible compared to the typical noise spectrum arising from the expected plasma self-emission shown in Figure 11.
The second background component stems from γ-rays emitted after the decay of neutral 7Be nuclei having a lifetime (decay constant) of t0 (l0) and its rate yields N O f f γ _ B e 0 = 5 × 10 3   c p s , assuming a concentration of 5 × 10⁻⁵ of 7Be relative to the He. By combining both background contributions under the assumption of uniform spatial distribution within the ellipsoidal plasmoid volume, and applying the total volumetric detection efficiency ( εTot = 0.0013) previously estimated in [23], the two background components of X-rays/γ-rays detected by the HPGe array are, respectively, N O n X _ B r e m = 61.1 cps and N O f f γ _ B e 0 = 6.5 cps.
The rate of the γ-rays emitted in the plasma-on scenario is N O n γ _ B e 0 , i + = 1990 cps, as derived in Equation (5) in Section 4.1. When accounting for the space-resolved efficiency derived via GEANT4 simulations (see Section 4.2), the detected signal rate becomes the following: N O n γ _ B e 0 , i + = 0.66 cps. This scenario aligns with theoretical models of the PANDORA plasma’s thermodynamic properties, assuming 7Be concentration of 5 × 10⁻⁵ in the He buffer (see Section 3.1).
The signal includes contributions from, (i) neutral 7Be0  ( N O n γ _ B e 0 ), i.e., the short-lived component and (ii) ionized 7Bei+  ( N O n γ _ B e i + ), i.e., the longer-lived component, per theoretical predictions, so that:
N O n γ B e 0 , i + = N O n γ B e 0 + N O n γ B e i +
Uncertainties were calculated as the square root of counts within the detector’s energy resolution window.
Figure 12a illustrates the trend of the background rate due to neutral 7Be0 nuclei (blue curve) in the “plasma-off” scenario N O f f γ _ B e 0 and the in-plasma signal rate (red curve) in the “plasma-on” scenario N O n γ _ B e 0 , i + . Each curve is plotted with the corresponding 3σ error bands, while the three times the square root of the Bremsstrahlung background rate is also shown (black curve). To evaluate the feasibility of the measurement, the 3σ Bremsstrahlung background rate was compared to the γ-signal rate in plasma to determine the minimum time required for a statistically significant measurement. The goal is to identify the crossover point between the signal curve (including its lower error band) and the 3σ background curve. The intersection (green dot) marks where the signal exceeds the 3σ background level, with the corresponding abscissa indicating the measurement time t 3 σ P l a s m a required to achieve 3σ significance, highlighted by a dashed yellow line.
As shown in Figure 12a, a 3σ significance is attainable after approximately 25 min for a 7Be concentration of 5 × 10⁻⁵. The next step involves verifying that the “in-plasma” signal contribution is significantly different (lower) from the “plasma-off” contribution (when only neutral 7Be0 is considered). Only under this condition, any observed difference could be attributed to ionized 7Be nuclei, which causes a reduction in γ-ray rate due to their longer lifetime as predicted by theoretical models. This distinction is critical for experimentally measuring the β-decay rate of ionized 7Be for the first time in PANDORA.
In order to do this, we compared the following X/γ-ray rates (shown, respectively, in blue and in red in Figure 12b):
N O f f X , γ = N O n X B r e m + N O f f γ B e 0 3 σ N O n X B r e m + N O f f γ B e 0
N O n X , γ = N O n X B r e m + N O n γ B e 0 , i + + 3 σ ( N O n X B r e m + N O n γ B e 0 , i + )
By considering their values at the time t 3 σ P l a s m a , shown, respectively, as blue and red dot, it is evident that these contributions are distinguishable, differing by more than 3σ significance. Their intersection (yellow dot) marks where this difference becomes statistically significant at 3σ, with the corresponding abscissa indicating the measurement time t 3 σ c h e c k required to reach this threshold. The N O n X _ B r e m is shown in black with its 3σ uncertainty. The final experimental measurement time needed to achieve 3σ significance is given by t 3 σ = min ( t 3 σ P l a s m a , t 3 σ c h e c k ).
This procedure was repeated for various 7Be concentrations ranging from 5 × 10⁻⁴ to 10−6 (normalized to a reference He density of one) to determine the minimum concentration required for a statistically significant measurement. The results are presented in Figure 13.
The expected measurement times needed to achieve 3σ significance range from tens of seconds (for a concentration of 5 × 10⁻⁴, Figure 13a,b) to approximately 37 days (for a concentration of 10−6, panel e–f). Such a difference is connected to the short lifetime of 7Be non ionized present in the trap, whose contribution to the total counting rate increases with measurement time and has to be compared to the signal coming from the EC in ionized 7Be, which induces the expected variation in decay rate. For each concentration value, we evaluated the required material quantity (micrograms) and the corresponding activity (MBq), considering the half-life of neutral 7Be0 (53.3 days).
Table 4 summarizes the obtained values, including the results obtained by simulations ( N O f f γ B e 0 , N O n X B r e m , and detected N O n γ B e 0 , i + ). The expected activity ranges from tens of GBq (for a concentration of 10−6) to less than hundreds of MBq (for a concentration of 5 × 10⁻⁴). The corresponding required material quantity varies from 2 mg to 6 ng, respectively.
To estimate the required quantities and doses, the efficiency of the plasma generation technique from a given material injected inside the plasma trap was conservatively assumed to be 1%. It is important to note that this “non-plasmizated” contribution is being considered for the total material quantity calculation reported in Table 4, although its diffusion and deposition on the plasma chamber walls are being neglected in the computation of the overall background, as already discussed in Section 4.2 (we only considered the background noise under the assumption that it is concentrated within the plasmoid volume).

5. Discussion

The results indicate that laboratory ECR plasmas within PANDORA trap provide a suitable environment for β-decay studies of 7Be. The estimated duration of experimental runs required to achieve 3σ significance level ranges from tens of seconds to slightly over a month, depending on the concentration of 7Be relative to the buffer helium gas. This concentration impacts the quantity of material required, its feasibility, and dose-handling constraints.
It is therefore crucial to identify the optimal tradeoff for achieving 3σ statistical, balancing the following:
  • Reasonable measurement durations;
  • Manageable material quantities and doses (considering cost, availability, and handling limitations for radioprotection issues);
  • The dependency of the uncertainty in the decay constant of ionized atoms on measurement time.
Regarding the measurement time, the most favourable condition corresponds to minimizing the duration required for data acquisition in which the plasma must be monitored and maintained stable, which is achievable with a concentration of 5 × 10⁻⁴.
In terms of material quantities, the maximum expected activity and required material are approximately 22 GBq and 2 mg, respectively, for a concentration of 10−6. It, however, results to be feasible [50,51,52,53].
The production of the 7Be isotope can be carried out starting from a lithium sample and then exploiting a proton-induced (p,n) reaction. At ATOMKI laboratory its preparation involves slicing a segment from a 7Li rod and pressing it into a specialized copper holder under an argon atmosphere to prevent oxidation. The prepared sample is then mounted in a cooled target holder within a vertical beamline. Irradiation is performed using the ATOMKI cyclotron via a proton-induced nuclear reaction (p,n), employing an 11 MeV proton beam at 20 mA with a beam area of approximately 1 cm² on a rotating vertical beamline. This procedure has been conducted for several years at ATOMKI laboratories, requiring approximately one week (100 h of beamtime) to yield several GBq doses of 7Be. Notably, the beryllium-to-lithium ratio remains significantly low at less than 1:1 million. After irradiation, short-lived isotopes decay over several days, enhancing the lithium-to-beryllium ratio for subsequent applications.
The proposed structure for 7Be isotope production appears applicable to the PANDORA experiment, especially if the required dose is below 1 GBq. In such cases, irradiation would not pose significant challenges due to its relatively short duration. However, preparatory and post-irradiation activities—including sample preparation, placement in the beamline, removal after irradiation, activity measurement, packaging, and transportation—remain complex. For these reasons, the most suitable condition appears to be at a concentration of 5 × 10⁻⁴, requiring only 6 ng of material and yielding an expected dose of 80 MBq for the total experimental measurement.
Finally, considerations regarding uncertainty in decay constant measurements are necessary and highlight that shorter measurement durations can increase uncertainties. In the following, we describe the mathematical framework for analyzing the decay constant of 7Be in both plasma-off and plasma-on scenarios.
Plasma-Off Scenario:
The number of γ-rays (β-decays) in the plasma-off scenario—where only the neutral 7Be0 atoms are considered—is given by Equation (4):
N O f f γ _ B e 0 t = λ 0 N 0
Here, λ 0 is the decay constant of neutral 7Be, and N0 is the total number of 7Be atoms, assumed constant under dynamic equilibrium in ECR plasmas [17].
Plasma-On Scenario:
In the plasma-on scenario, the γ-ray counts include contributions from both neutral ( N 0 B e 0 ) a n d i o n i z e d ( N 0 B e i + ) atoms:
N O n γ _ B e 0 , i + t = N O n γ _ B e 0 t + N O n γ _ B e i + t = λ 0 N 0 B e 0 + λ * N 0 B e i +
Here, λ * is the decay constant of ionized 7Be, which we aim to experimentally investigate in PANDORA. The total number of atoms is as follows:
N 0 = N 0 B e 0 + N 0 B e i +
Then, the Equation (12) can be rewritten as follows:
N O n γ _ B e 0 , i + t = λ 0 ( N 0 N 0 B e i + ) + λ * N 0 B e i + = λ 0 N 0 1 N 0 B e i + N 0 + λ * N 0 N 0 B e i + N 0
The ionization ratio F is defined as follows:
F = N 0 B e i + N 0
Substituting F into Equation (14) gives the following:
N O n γ _ B e 0 , i + t = λ 0 N 0 1 F + λ * N 0 F = λ 0 1 F + λ * F N 0 = λ 0 F ( λ 0 λ * ) N 0
Integrating the Equations (11) and (16) over the measurement period t m , the total γ-ray counts are the following, respectively:
N O f f γ _ B e 0 = λ 0 N 0 t m
N O n γ _ B e 0 , i + = λ 0 F ( λ 0 λ * ) N 0 t m
In the plasma-off scenario, the angular coefficient of γ-ray counts versus time directly corresponds to λ 0 (being known N0). In the plasma-on scenario, this coefficient depends on both the ionization ratio (F) and the decay constant of ionized atoms ( λ * ) .
The two coefficients are equal only under specific (asymptotic) conditions, where either F = 0 (no ionization) or λ 0 = λ * (no change in decay constant, which would imply invalid theoretical predictions).
This framework provides a basis for experimentally determining λ * , which has never been measured before. It also highlights how ionization impacts decay rates and measurement uncertainties in ECR plasmas.
It is worth pointing out that the definitions of F and λ * refer to values averaged over the effects of individual charge states i+ of 7Be according to the following relations:
F = i = 1 4 F i + λ * = i = 1 4 λ i + *
As discussed in Section 3.1, theoretical predictions highlight significant variations in the lifetimes of different charge states of 7Be, particularly for 7Be³⁺ and 7Be⁴+, making their relative weights in the relation 18 substantially higher compared to the low charge states 7Be¹⁺ and 7Be²⁺.
To emulate the real experimental measurement by the virtual experiment, we have to consider that the total measured counts N O n X , γ _ has to include also the X-ray Bremsstrahlung contribution ( N O n X _ B r e m _ ), and it will be affected by the total detection efficiency of the HPGe array ( e T o t ) . This ( N O n X _ B r e m _ ) is more specifically intended as the number of counts in the energy resolution window of the detectors array, with its own efficiency. The detected quantities, considering ε T o t , are highlighted with an underscore:
N O n X , γ _ = N O n γ _ B e 0 , i + _ + N O n X _ B r e m _ = λ 0 F ( λ 0 λ * ) N 0 _ t m + N O n X _ B r e m _
Leading to the following expression for the decay constant of ionized atoms λ * :
λ * = 1 F N O n X , γ _ N O n X _ B r e m _ N 0 _ t m λ 0 1 F
This requires careful error propagation to determine uncertainty Δ λ * in λ * . Error in F propagates into λ * , as well as N O n X , γ _ , N 0 _ , a n d   N O n X _ B r e m _ that introduce additional variance, especially for low 7Be activities.
The total uncertainty Δ λ * is derived using the error propagation formula for multivariable functions, substituting partial derivates and simplifying, results in the following:
Δ λ * = 1 N 0 _ t m F Δ N O n X , γ _ 2 + 1 N 0 _ t m F Δ N O n X _ B r e m _ 2 + N O n X , γ _ N O n X , B r e m _ F t m N 0 _ 2 2 Δ N 0 _ 2 + N O n X , γ _ N O n X , B r e m _ N 0 _ F t m 2 2 Δ t m 2 + λ 0 N O n X , γ _ N O n X , B r e m _ N 0 _ t m F 2 2 Δ F 2
Tradeoffs between measurement duration and uncertainty are needed. The advantages of shorter measurement durations are the reduced material quantities/doses, lowering logistical and safety constraints, and an improved plasma stability due to shorter operational windows. On the other hand, the disadvantage is a hugely increased statistical uncertainty in λ * . As it is possible to observe from the Table 5, which reports the typical expected uncertainties (assuming F = 0.87), the statistical uncertainty of N O n γ _ B e 0 , i + dominates at lower measurement time (for a given concentration), and the Bremsstrahlung background noise starts to become significant only for higher concentration.
For each concentration, the typical uncertainties, the activities and the material quantities are reported both for the minimum exposure time case estimated in Section 4.2 (columns with labels coloured in blue), and for higher measurement times in order to reduce the λ * uncertainty.
The optimal concentration seems to be 5 × 10⁻⁴ for a measurement time of approximately 5 min, as it balances material requirements (below 100 ng) and moderate dose (1 GBq) with manageable uncertainty (18.8%). This result is illustrated in Figure 14, which shows the activity (yellow bar plot) and the relative error of the decay constant (red dots) versus measurement times for concentrations: (a) 10−6, (b) 5 × 10⁻⁶, (c) 5 × 10⁻⁵, and (d) 5 × 10⁻⁴. As observed, relative uncertainty decreases with increasing exposure time, leading to higher activity. The tradeoff between uncertainty and activity enables identification of optimal experimental condition.
The results obtained are promising, as they have allowed, for the first time, the feasibility of studying the β-decay of ⁷Be in plasma within PANDORA to be assessed, evaluating whether a significant measurement can be obtained within reasonable measurement time, with manageable doses and with quantities of material that can be produced in laboratories worldwide.
Of course, these estimates are based on simulation results, which, while serving as a valuable tool for designing the setup, diagnostic systems, evaluate needed material and production technique, radioprotection issues, etc., leave some aspects undefined that can only be clarified by the future experiment once the facility is installed at INFN-LNS and becomes operational.
In addition, the use of HPGe detectors minimize the detected N O n X _ B r e m , and repeated measurements will constrain systematic errors. The precision in ionization ratio F can improve with online characterization of charge state distribution by optical spectroscopy. Finally, it is important to point out that the angular coefficient of Equation 18 can be derived by linear fit, reducing the corresponding uncertainty and optimizing the accuracy of measurement.
The trap is currently under construction, with installation expected in August 2026 and the site acceptance tests until the end of 2026. Although achieving the experimental conditions described by PANDORA facilities can face technical challenges, the collaboration has extensive expertise in the field of ECR plasmas. The plasma diagnostics are the result of long-term R&D and related training. Several experimental campaigns have been dedicated to improving plasma monitoring techniques, using the multi-diagnostic system [54], as well as innovative plasma heating techniques capable of damping instabilities and improving both plasma stability and confinement [55,56]. Experience shows that ECR plasmas have the advantage of remaining stable for days or even weeks, thanks to the magnetohydrodynamic equilibrium that can be guaranteed, and high ion charge state can be produced [57,58,59]. Various measurement protocols, metallic isotope injection techniques, plasma tuning, as well as long term plasma stability, are well-established within the community and fall within the collaboration’s expertise.

6. Conclusions

In this study, we explored the feasibility of measuring the decay rate of 7Be in an ECR plasma within the PANDORA project. Through numerical simulations, we assessed the impact of ionization and atomic excitation of 7Be on its electron capture decay rate in a He buffer plasma. The results of GEANT4 Monte-Carlo simulations represents the first instance of estimating volumetric, space-resolved efficiency using voxels of 1 mm3 in size. They indicate that the HPGe detector array of the PANDORA setup is adequate for detecting the γ-rays emitted from 7Be decay. The analysis of the measurement sensitivity, obtained through a “virtual experimental run” based on simulated plasma-dependent γ-ray production rate maps, indicate that laboratory ECR plasmas in compact traps offer a promising environment for β-decay studies of 7Be. Notably, the estimated duration of experimental runs required to reach a 3σ significance level varies from tens minutes to few hours. Tradeoffs between measurement duration, activity, and uncertainty of the decay constant was determined. Shorter measurement durations reduce material quantities/doses, lowering logistical, and safety constraints, but the disadvantage is a hugely increased statistical uncertainty in λ * . The optimal concentration seems to be approximatively 5 × 10⁻⁴ for a measurement time of about 5 min, as it balances material requirements (below 100 ng) and moderate dose (1 GBq) with manageable uncertainty (18.8%).
These preliminary results indicate that PANDORA has the potential to be an effective tool for studying the decay rate of 7Be under different thermodynamic conditions and charge state distributions. Future measurements could provide important insights to address the Cosmological Lithium Problem and to better understand solar neutrino physics. Furthermore, PANDORA’s innovative approach, combining plasma production with an advanced diagnostic system and γ-ray detection, opens new avenues for studying nuclear processes in astrophysical environments.

Author Contributions

Conceptualization, E.N., D.M., B.M. and A.P.; methodology, E.N., D.M., B.M. and A.P.; software, E.N., D.M., B.M., A.P., A.G. and G.S.M.; validation E.N., D.M., B.M., A.P., A.G., G.T., G.S.M. and D.S.; formal analysis, E.N., D.M., B.M. and A.P.; investigation, E.N., D.M., B.M. and A.P.; resources, E.N., D.M., B.M., A.P., A.G., G.T., G.S.M. and D.S.; data curation, E.N., D.M., B.M. and A.P.; writing—original draft preparation, E.N.; writing—review and editing, E.N., D.M., B.M. and A.P.; visualization, E.N., D.M., B.M., A.P., A.G., G.T., G.S.M. and D.S.; supervision, D.M., D.S. and A.G.; project administration, D.M. and D.S.; funding acquisition, D.M., D.S., A.G. and G.T. All authors have read and agreed to the published version of the manuscript.

Funding

This research was partially funded by the Italian Ministry of University and Research (MUR) through the PRIN 2022 project, grant number: PRIN 2022THRKMK amd CUP I53C24002400006. The authors wish also to thank INFN for the support through the project PANDORA_Gr3 funded by third Nat. Sci. Comm. This work has been moreover partially funded by European Union (NextGeneration EU), through the MUR-PNRR project SAMOTHRACE (ECS00000022) and through the MUR-PNRR Project PE0000023-NQSTI.

Data Availability Statement

Data are available upon request.

Conflicts of Interest

The authors declare no conflicts of interest.

References

  1. Käppeler, F.; Mengoni, A. Nuclear input for the s process: Progress with experiments and theory. Nucl. Phys. A 2006, 777, 291–310. [Google Scholar] [CrossRef]
  2. Kolbe, E.; Langanke, K.; Martinez-Pinedo, G.; Vogel, P. Neutrino-nucleus reactions and nuclear structure. J. Phys. G Nucl. Part. Phys. 2003, 29, 2569. [Google Scholar] [CrossRef]
  3. Langanke, K.; Thielemann, F.-K.; Wiescher, M. Nuclear Astrophysics and Nuclei Far from Stability. Lect. Notes Phys. 2004, 651, 383. [Google Scholar]
  4. Käppeler, F.; Thielemann, F.-K.; Wiescher, M. Current quests in nuclear astrophysics and experimental approaches. Annu. Rev. Nucl. Part. Sci. 1998, 48, 175–251. [Google Scholar] [CrossRef]
  5. Thielemann, F.-K.; Frohlich, C.; Hirschi, R.; Liebendorfer, M.; Dillmann, I.; Mocelj, D.; Rauscher, T.; Martinez-Pinedo, G.; Langanke, K.; Farouqi, K.; et al. Production of intermediate-mass and heavy nuclei. Prog. Part. Nucl. Phys. 2007, 59, 74–93. [Google Scholar] [CrossRef]
  6. Daudel, R. Alteration of radioactive periods of the elements with the aid of chemical methods. Rev. Sci. 1947, 85, 510. [Google Scholar]
  7. Segré, E.; Wiegard, C.E. Experiments on the Effect of Atomic Electrons on the Decay Constant of Be7. Phys. Rev. 1949, 75, 39. [Google Scholar] [CrossRef]
  8. Emery, G.T. Perturbation of Nuclear Decay Rates. Annu. Rev. Nucl. Part. Sci. 1972, 22, 165–202. [Google Scholar] [CrossRef]
  9. Mazaki, H.; Nagatomo, T.; Shimizu, S. Effect of Pressure on the Decay Constant of 99mTc. Phys. Rev. C 1972, 5, 1718. [Google Scholar] [CrossRef]
  10. Bosch, F.; Faestermann, T.; Friese, J.; Heine, F.; Kienle, P.; Wefers, E.; Zeitelhack, K.; Beckert, K.; Franzke, B.; Klepper, O.; et al. Observation of Bound-State β Decay of Fully Ionized 187Re: 187Re−187Os Cosmochronometry. Phys. Rev. Lett. 1996, 77, 5190. [Google Scholar] [CrossRef]
  11. Jung, M.; Bosch, F.; Beckert, K.; Eickhoff, H.; Folger, H.; Franzke, B.; Gruber, A.; Kienle, P.; Klepper, O.; Koenig, W.; et al. First observation of bound-state β decay. Phys. Rev. Lett. 1992, 69, 2164. [Google Scholar] [CrossRef] [PubMed]
  12. Takahashi, K.; Yokoi, K. Nuclear β-Decays of Highly Ionised Heavy toms in Stellar Interiors. Nucl. Phys. A 1983, 404, 578–598. [Google Scholar] [CrossRef]
  13. Palmerini, S.; Busso, M.; Vescovi, D.; Naselli, E.; Pidatella, A.; Mucciola, R.; Cristallo, S.; Mascali, D.; Mengoni, A.; Simonucci, S.; et al. Presolar grain isotopic ratios as constraints to nuclear and stellar parameters of asymptotic giant branch star nucleosynthesis. Astrophys. J. 2021, 921, 7. [Google Scholar] [CrossRef]
  14. Busso, M.M.; Kratz, K.-L.; Palmerini, S.; Akram, W.; Antonuccio-Delogu, V. Production of solar abundances for nuclei beyond Sr: The s- and r-process perspectives. Front. Astron. Space Sci. 2022, 9, 956633. [Google Scholar] [CrossRef]
  15. Mishra, B.; Galatà, A.; Pidatella, A.; Biri, S.; Mauro, G.S.; Naselli, E.; Rácz, R.; Torrisi, G.; Mascali, D. Modeling space-resolved ion dynamics in ECR plasmas for predicting in-plasma β-decay rates. Front. Phys. 2022, 10, 932448. [Google Scholar] [CrossRef]
  16. Mishra, B. Electron Captures and Bound-State β-Decays in Ions and Plasma. Phys. Rev. C, 2025; under review. [Google Scholar]
  17. Mascali, D.; Santonocito, D.; Amaducci, S.; Andò, L.; Antonuccio, A.; Biri, S.; Bonanno, A.; Bonanno, V.P.; Briefi, S.; Busso, M.; et al. A Novel Approach to β-Decay: PANDORA, a New Experimental Setup for Future In-Plasma Measurements. Universe 2022, 8, 80. [Google Scholar] [CrossRef]
  18. Naselli, E. Experimental study of ECR plasmas in stationary versus turbulent regimes for in-plasma β-decay investigations. Eur. Phys. J. Plus 2023, 138, 599. [Google Scholar] [CrossRef]
  19. Naselli, E.; Santonocito, D.; Amaducci, S.; Celona, L.; Galatà, A.; Mauro, G.S.; Mazzaglia, M.; Mishra, B.; Pidatella, A.; Torrisi, G.; et al. GEANT4 simulations for γ-ray detector array design for in plasma β-decays studies of nuclear astrophysics interest. EPJ Web Conf. 2023, 279, 13006. [Google Scholar] [CrossRef]
  20. Naselli, E. Laboratory magnetoplasmas as an ideal experimental environment for nuclear astrophysics β-decay studies. EPJ Web Conf. 2023, 275, 02008. [Google Scholar] [CrossRef]
  21. Mascali, D.; Santonocito, D.; Busso, M.; Celona, L.; Galatà, A.; La Cognata, M.; Mauro, G.S.; Mengoni, A.; Naselli, E.; Odorici, F.; et al. A new approach to β-decays studies impacting nuclear physics and astrophysics: The PANDORA setup. EPJ Web Conf. 2023, 279, 06007. [Google Scholar] [CrossRef]
  22. Mascali, D.; Naselli, E.; Torrisi, G. Techniques for electron cyclotron resonance plasma diagnostics. Rev. Sci. Instrum. 2022, 93, 033302. [Google Scholar] [CrossRef] [PubMed]
  23. Naselli, E.; Santonocito, D.; Amaducci, S.; Celona, L.; Galatà, A.; Goasduff, A.; Mauro, G.S.; Mazzaglia, M.; Mishra, B.; Napoli, D.R.; et al. Design study of a HPGe detector array for β-decay investigation in laboratory ECR plasma. Front. Phys. 2022, 10, 935728. [Google Scholar] [CrossRef]
  24. Mascali, D.; Musumarra, A.; Leone, F.; Romano, F.P.; Galatà, A.; Gammino, S.; Massimi, C. PANDORA, a new facility for interdisciplinary in-plasma physics. Eur. Phys. J. A 2017, 53, 145. [Google Scholar] [CrossRef]
  25. Adelberger, E.G.; Balantekin, A.B.; Bemmerer, D.; Bertulani, C.A.; Chen, J.-W.; Costantini, H.; Couder, M.; Cyburt, R.; Davids, B.; Freedman, S.J.; et al. Solar fusion cross sections. II. The pp chains and CNO cycles. Rev. Mod. Phys. 2011, 83, 195. [Google Scholar] [CrossRef]
  26. Broggini, C.; Canton, L.; Fiorentini, G.; Villante, F.L. The cosmological 7Li problem from a nuclear physics perspective. J. Cosmol. Astropart. Phys. 2012, 2012, 030. [Google Scholar] [CrossRef]
  27. Vescovi, D.; Piersanti, L.; Cristallo, S.; Busso, M.; Vissani, F.; Palmerini, S.; Simonucci, S.; Taioli, S. Effects of a revised 7Be e-capture rate on solar neutrino fluxes. Astron. Astrophys. 2019, 623, 7. [Google Scholar] [CrossRef]
  28. Quarati, P.; Scarafone, A.M. Nuclear electron capture rate in stellar interiors and the case of 7Be. J. Phys. G Nucl. Part. Phys. 2008, 36, 025203. [Google Scholar] [CrossRef]
  29. Simonucci, S.; Taioli, S.; Palmerini, S.; Busso, M. Theoretical estimates of stellar e− captures. I. The half-life of 7Be in evolved stars. Astrophys. J. 2013, 764, 118. [Google Scholar] [CrossRef]
  30. Palmerini, S.; Busso, M.; Simonucci, S.; Taioli, S. Lithium abundances in AGB stars and a new estimate for the 7Be life-time. J. Phys. Conf. Ser. 2016, 665, 012014. [Google Scholar] [CrossRef]
  31. Mishra, B.; Pidatella, A.; Taioli, S.; Simonucci, S.; Mascali, D. Plasma Induced Variation of Electron Capture and Bound-State β Decays. arXiv 2024, arXiv:2407.01787. [Google Scholar]
  32. Morresi, T.; Taioli, S.; Simonucci, S. Relativistic Theory and Ab Initio Simulations of Electroweak Decay Spectra in Medium-Heavy Nuclei and of Atomic and Molecular Electronic Structure. Adv. Theory Simul. 2018, 1, 11. [Google Scholar] [CrossRef]
  33. Gupta, D. The 7Be destruction reactions and the cosmological lithium problem. Eur. Phys. J. Spec. Topics. 2024, 233, 2823–2829. [Google Scholar] [CrossRef]
  34. Mauro, G.S.; Celona, L.; Torrisi, G.; Pidatella, A.; Naselli, E.; Russo, F.; Mazzaglia, M.; Galatà, A.; Maimone, F.; Lang, R.; et al. An Innovative Superconducting Magnetic Trap for Probing β-decay in Plasmas. Front. Phys. 2022, 10, 931953. [Google Scholar] [CrossRef]
  35. Torrisi, G.; Naselli, E.; Mascali, D.; Di Donato, L.; Sorbello, G. Mm-wave polarimeter and profilometry design study for retrieving plasma density in the PANDORA experiment. Front. Astron. Space Sci. 2022, 9, 949920. [Google Scholar] [CrossRef]
  36. Tsikata, S.; Maunoury, L.; Ducret, J.-E. Incoherent Thomson scattering: Future implementation and measurement capabilities on the PANDORA experiment. Front. Astron. Space Sci. 2022, 9, 936532. [Google Scholar] [CrossRef]
  37. Vincent, B. Incoherent Thomson Scattering Investigations in Hall Thruster, Planar Magnetron and ECR Ion Source Plasmas. Ph.D. Thesis, Plasma Physics Université d’Orléans, Orléans, France, 2019. [Google Scholar]
  38. Torrisi, G.; Mascali, D.; Sorbello, G.; Castro, G.; Gammino, S. Numerical and Experimental Characterization of RF Waves Propagation in Ion Sources Magnetoplasmas. IEEE Trans. Antennas Propag. 2019, 67, 2884807. [Google Scholar] [CrossRef]
  39. Pidatella, A.; Mascali, D.; Bezmalinovich, M.; Emma, G.; Mazzaglia, M.; Mishra, B.; Finocchiaro, G.; Galatà, A.; Marletta, S.; Mauro, G.S.; et al. Experimental and numerical investigation of magneto-plasma optical properties toward measurements of opacity relevant for compact binary objects. Front. Astron. Space Sci. 2022, 9, 931744. [Google Scholar] [CrossRef]
  40. Biri, S.; Rácz, R.; Perduk, Z.; Pálinkjás, J.; Naselli, E.; Mazzaglia, M.; Torrisi, G.; Castro, G.; Celona, L.; Gammino, S.; et al. Innovative experimental setup for X-ray imaging to study energetic magnetized plasmas. J. Instrum. 2021, 16, P03003. [Google Scholar] [CrossRef]
  41. Mascali, D.; Castro, G.; Altana, C.; Caliri, C.; Mazzaglia, M.; Romano, F.P.; Leone, F.; Musumarra, A.; Naselli, E.; Reitano, R.; et al. Electromagnetic diagnostics of ECR-Ion Sources plasmas: Optical/X-ray imaging and spectroscopy. J. Instrum. 2017, 12, C12047. [Google Scholar] [CrossRef]
  42. Goasduff, A.; Santonocito, D.; Menegazzo, R.; Capra, S.; Pullia, A.; Raniero, W.; Rosso, D.; Toniolo, N.; Zago, L.; Naselli, E.; et al. A high resolution γ-ray array for the Pandora plasma trap. Front. Phys. 2022, 10, 936081. [Google Scholar] [CrossRef]
  43. Pidatella, A.; Mascali, D.; Galatà, A.; Mishra, B.; Naselli, E.; Celona, L.; Lang, R.; Maimone, F.; Mauro, G.S.; Santonocito, D.; et al. Metal evaporation dynamics in electron cyclotron resonance ion sources: Plasma role in the atom diffusion, ionisation, and transport. Plasma Phys. Control. Fusion 2024, 66, 035016. [Google Scholar] [CrossRef]
  44. Taioli, S.; Vescovi, D.; Busso, M.; Palmerini, S.; Cristallo, S.; Mengoni, A.; Simonucci, S. Theoretical Estimate of the Half-Life for the Radioactive 134Cs and 135Cs in Astrophysical Scenarios. Astrophys. J. 2022, 933, 158. [Google Scholar] [CrossRef]
  45. Galatà, A.; Mascali, D.; Mishra, B.; Naselli, E.; Pidatella, A.; Torrisi, G. On the Numerical Determination of the Density and Energy Spatial Distributions relevant for in-Plasma β-Decay Emission Estimation. Front. Phys. 2022, 10, 947194. [Google Scholar] [CrossRef]
  46. Mascali, D.; Torrisi, G.; Neri, L.; Sorbello, G.; Castro, G.; Celona, L.; Gammino, S. 3D-Full Wave and Kinetics Numerical Modelling of Electron Cyclotron Resonance Ion Sources Plasma: Steps Towards Self-Consistency. Eur. Phys. J. D 2015, 69, 27. [Google Scholar] [CrossRef]
  47. Chung, H.-K.; Chen, M.H.; Morgan, W.L.; Raichenko, Y.; Lee, R.W. FLYCHK: Generalized population kinetics and spectral model for rapid spectroscopic analysis for all elements. High Energy Density Phys. 2005, 1, 3–12. [Google Scholar] [CrossRef]
  48. Tilley, D.R.; Cheves, C.M.; Godwin, J.L.; Hale, G.M.; Hofmann, H.M.; Kelley, J.H.; Sheu, C.G.; Weller, H.R. Energy levels of light nuclei A=5, 6, 7. Nucl. Phys. A 2002, 708, 3–163. [Google Scholar]
  49. Gumberidze, A.; Trassinelli, M.; Adrouche, N.; Szabo, C.I.; Indelicato, P.; Haranger, F.; Isac, J.-M.; Lamour, E.; Le Bigot, E.-O.; Mérot, J.; et al. Electronic temperatures, densities, and plasma X-ray emission of a 14.5 GHz electron-cyclotron resonance ion source. Rev. Sci. Instrum. 2010, 81, 033303. [Google Scholar] [CrossRef]
  50. Di Leva, A. Reducing experimental uncertainties on production and destruction of 7 Be in hydrogen burning. In Proceedings of the XII International Symposium on Nuclei in the Cosmos, Vol. NIC XII, Cairns, Australia, 5–12 August 2012; p. 112. [Google Scholar]
  51. Limata, B.N.; Gialanella, L.; Di Leva, A.; De Cesare, N.; D’Onofrio, A.; Gyurky, G.; Rolfs, C.; Romano, M.; Rogalla, D.; Rossi, C.; et al. 7Be radioactive beam production at CIRCE and its utilization in basic and applied physics. Nucl. Instrum. Methods Phys. Res. B 2008, 266, 2117–2121. [Google Scholar] [CrossRef]
  52. Tóth, Á.; Gyürky, G.; Papp, E.; Szücs, T. Experimental 7Be production cross section from the Li7(p,n)7Be reaction at Ep=3.5−13 MeV. Nucl. Phys. A 2024, 1041, 122778. [Google Scholar] [CrossRef]
  53. Cosentino, L.; Musumarra, A.; Barbagallo, M.; Pappalardo, A.; Colonna, N.; Damone, L.; Piscopo, M.; Finocchiaro, P.; Maugeri, E.; Heinitz, S.; et al. Experimental setup and procedure for the measurement of the 7Be(n,α)α reaction at n_TOF. Nucl. Instrum. Methods Phys. Res. Sect. A Accel. Spectrometers Detect. Assoc. Equip. 2016, 830, 197–205. [Google Scholar] [CrossRef]
  54. Mascali, D.; Naselli, E.; Biri, S.; Finocchiaro, G.; Galatà, A.; Mauro, G.S.; Mazzaglia, M.; Mishra, B.; Passarello, S.; Pidatella, A.; et al. The Multi-Detectors System of the PANDORA Facility: Focus on the Full-Field Pin-Hole CCD System for X-ray Imaging and Spectroscopy. Condens. Matter 2024, 9, 28. [Google Scholar] [CrossRef]
  55. Tarvainen, O.; Izotov, I.; Mansfeld, D.; Skalyga, V.; Golubev, S.; Kalvas, T.; Koivisto, H.; Komppula, J.; Kronholm, R.; Laulainen, J.; et al. Beam current oscillations driven by cyclotron instabilities in a minimum-B electron cyclotron resonance ion source plasma. Plasma Sources Sci. Technol. 2014, 23, 025020. [Google Scholar] [CrossRef]
  56. Naselli, E.; Mascali, D.; Mazzaglia, M.; Biri, S.; Rácz, R.; Pálinkás, J.; Perduk, Z.; Galatá, A.; Castro, G.; Celona, L.; et al. Impact of two-close-frequency heating on ECR ion source plasma radio emission and stability. Plasma Sources Sci. Technol. 2019, 28, 085021. [Google Scholar] [CrossRef]
  57. Li, L.X.; Li, J.B.; Ma, J.D.; Guo, H.; Guo, B.; Hitz, D.; Feng, Y.C.; Lu, W.; Guo, J.W.; Fang, X.; et al. Production of intense pulsed beams of highly charged ions from a superconducting electron cyclotron resonance ion source. Phys. Rev. Accel. Beams 2022, 25, 063402. [Google Scholar] [CrossRef]
  58. Leitner, D.; Lyneis, C.M.; Abbott, S.R.; Collins, D.B.; Dwinell, R.D.; Galloway, M.L.; Leitner, M.; Todd, D.S. Next generation ECR ion sources: First results of the superconducting 28 GHz ECRIS - VENUS. Nucl. Instrum. Methods B 2005, 235, 486–493. [Google Scholar] [CrossRef]
  59. Zhao, H.W.; Sun, L.T.; Guo, J.W.; Lu, W.; Xie, D.Z.; Hitz, D.; Zhang, X.Z.; Yang, Y. Intense Highly Charged Ion Beam Production and Operation with a Superconducting Electron Cyclotron Resonance Ion Source. Phys. Rev. Accel. Beams 2017, 20, 094801. [Google Scholar] [CrossRef]
Figure 1. (a) Summary of the PANDORA facility subsystems. (b) Sketch of the PANDORA system including the superconductive magnetic system (sextupole magnets in red, three coils in yellow, cryostat in pink, and iron yoke in cyan) and the diagnostics and detection systems surrounding the trap.
Universe 11 00195 g001
Figure 2. Sketch of the whole multi-diagnostics and detection system which will surround the PANDORA plasma trap. The most relevant characteristics of each diagnostic tool are reported in Table 2.
Universe 11 00195 g002
Figure 3. (ac) Two-dimensional projections of ne (in m−3) on planes at z = 0, y = 0, x = 0, respectively. (df) Two-dimensional projections of Ee (in eV) as obtained from PIC simulations [45] to planes at z = 0, y = 0, x = 0, respectively.
Universe 11 00195 g003
Figure 4. (ac) Two-dimensional projections of mean charge of 7Be in the PANDORA plasma trap and niBe (in m−3) on the x-y plane for (d) i = 2+, (e) i = 3+, and (f) i = 4+. The green ellipse in each image shows the boundary of the plasmoid. The plots of niBe correspond to a concentration c = 5 × 10⁻².
Universe 11 00195 g004
Figure 5. Sketch of the simulation setup incorporates a detailed model of the PANDORA plasma trap. The main elements are the vacuum chamber (grey), the whole magnetic system (with axial coils in yellow and hexapole in red), the cryostat (purple), and the external iron yoke (dark grey). The holes are designed in the whole structure as lines-of-sight for diagnostics and detection systems.
Universe 11 00195 g005
Figure 6. (ac) Two-dimensional maps of the total number of γ-rays which impact on the 14 HPGe detector array. (df) Two-dimensional maps of the photopeak events which impact and release all energy on the array.
Universe 11 00195 g006aUniverse 11 00195 g006b
Figure 7. Different views of the 3D maps of the γ-rays impacting on γ array.
Universe 11 00195 g007
Figure 8. Different views of the 2D maps (for the xy, xz, and yz planes respectively for (ac)) of the space resolved γ-rays emission rate (cps) in the PANDORA trap for the “in-plasma” ionized + neutral 7Be scenario.
Universe 11 00195 g008
Figure 9. Two-dimensional maps of the geometrical (ac) and total (df) detection efficiency of the γ-rays detector array for the xy, xz, and yz planes.
Universe 11 00195 g009
Figure 10. (ac) The γ-ray emission of the daughter nuclei after the β-decay of the 7Be superimposed onto the total efficiency map (in cyan and in arbitrary unit). (df) Merging between the total efficiency and the emission rate maps for the “in-plasma” ionized + neutral 7Be scenario.
Universe 11 00195 g010
Figure 11. An example of the rate of the buffer He plasma self-emission in the whole volume as a function of the energy of the radiation (the width of the bin in the x axis corresponds to 10 eV). The energy of γ-rays of interest is highlighted by the blue dashed curve.
Universe 11 00195 g011
Figure 12. (a) Trend of the background rate due to neutral 7Be0 nuclei (blue) and the in-plasma signal rate (red). The three times square root of the Bremsstrahlung background rate is shown in black. (b) Trend of N P l O f f (blue) in the “plasma-off” scenario, N P l O n (red) in the “plasma-on” scenario, and N X b k g , B r e m . Each curve is plotted with its corresponding 3σ error bands.
Universe 11 00195 g012
Figure 13. Trend, for a concentration of 7Be of 5 × 10⁻⁴ (a), 5 × 10⁻⁶ (c), and 10−6 (e), of the background rate due to neutral 7Be0 nuclei (blue) and the in-plasma signal rate (red). The three times square root of the Bremsstrahlung background rate is shown in black. (b) Trend of N O f f X , γ (blue) in the “plasma-off” scenario, N O n X , γ (red) in the “plasma-on” scenario, and N O n X _ B r e m . Each curve is plotted with the corresponding 3σ error bands. A zoom-in in the range t = [3.23–3.25] × 106 s is shown.
Universe 11 00195 g013aUniverse 11 00195 g013b
Figure 14. Activity (yellow bar) and relative uncertainty of decay constant (red dot) versus the measurement time for concentration: 10−6 (a), 5 × 10⁻⁶ (b), 5 × 10⁻⁵ (c), and 5 × 10⁻⁴ (d).
Universe 11 00195 g014
Table 1. Physical cases of PANDORA reporting the isotope of nuclear astrophysics interest, the half-life in the neutral state, the type of decay, and the daughter nuclei including the energy of the emitted γ-rays after the decay. The physical cases selected for the PANDORA phase-1 are highlighted in pink, while the additional physical case for the PANDORA phase-2 is highlighted in yellow.
Physical CasesIsotopet1/2Type of DecayDaughter NucleiEγ [keV]
PANDORA Phase-1176Lu3.78 · 1010 [yr]β-176Hf202.88 & 306.78
134Cs2.06 [yr]β-134Ba795.86
94Nb2.03 · 104 [yr]β-94Mo871.09
PANDORA Phase-27Be53.2 [days]EC7Li477.60
Table 2. The types of experimental measurements that can be performed with each diagnostic tool, along with their typical uncertainties, are summarized by highlighting the most relevant characteristics, such as sensitive range and resolution. Here, ε denotes the typical (empirically estimated) errors, for ne (electron density) and Te (electron temperature). ΔE represents the energy resolution in the relevant environment (i.e., measurements done on a plasma with similar characteristics as the PANDORA one). The measurements emerged as fundamental are identifiable by their green colour designation, the complementary techniques that are useful but not strictly mandatory are denoted in blue, and the methodologies that are still under development or planned for later stages of PANDORA are marked in yellow.
SDDCCD Pin-Hole SystemHPGe Detector ArrayOptical SpectrometerRF Probe + Spectrum AnalyzerRF Probe + ScopePolarimeterMicrowave Imaging ProfilometryThomson ScatteringAnalyzing Magnet + Faraday Cup
1–30 keV
(Soft X-Ray)
0.4–20 keV
(soft X-Ray)
30–2000 keV
(Hard X, g-Ray)
1–12 eV
(Visible)
10–26.5 GHz
(RF)
10–26.5 GHz
(RF)
90–100 GHz
(mm-Wave)
60–100 GHz
(mm-Wave)
1–1000 eV
(vis., UV, EUV)
//
Warm ElectronsWarm
Electrons
Hot
Electrons
Cold
Electrons
// // Whole ElectronsWhole ElectronsCold Electrons
Electron density neVolumetricene∼7%
∆E∼120 eV @ 8 keV
ene∼15–20%
∆E∼260 eV @ 8 keV
ene∼7%
∆E∼2.4 keV @ 1.3 MeV
ene∼10%
Δλ = 0.035 nm, R = 13,900
ene∼28% ene∼10%
∆E∼0.009/1.24 eV @ 4.67/608 eV
Space-resolved & Imaging ene∼15–20%
∆s∼460 mm
ene∼1–13%
Electron temperature TeVolumetriceTe∼5%
∆E∼120 eV @ 8 keV
eTe∼15–20%
∆E∼260 eV
eTe∼5%
∆E∼2.4 keV @ 1.3 MeV
eTe∼25–30%
Δλ = 0.035 nm, R = 13,900
eTe∼10%
∆E∼0.009/1.24 eV @ 4.67/608 eV
Space- resolved & Imaging eTe∼15–20%
∆s∼460 mm
Instable vs. stable regimesMonitoring Instability strengh, RBW 3 MHz, ∆t ≲ msInstability strengh,
80 Gs, ∆t ≲ ns
Other infosoft X-ray burstsplasma losses vs. core emissionshard X-ray burstsvisible light burstsRF burstsRF bursts
b-decay taggingTechnique By g-ray tagging (sensitivity 3 s) By mass spectrometry dq/dm = 1/200
CSDDetails Online Δλ = 0.003 nm R = 164,000 By beam
extraction dq/dm = 1/200
Other infoDetails plasma structure, dynamics of losses and confinement Local EM field intensity, e∼0.07–0.14 dB EEDF, electron drift velocity
Table 3. λ i * for each 7Bei+. The 4+ state is void of electrons and does not contribute to capture.
Charge State (i)Electronic ConfigurationElectron Capture Decay Rate [s−1]
0+1s22s21.51 × 10−7
1+1s22s11.51 × 10−7
2+1s21.46 × 10−7
3+1s16.53 × 10−8
4+-0
Table 4. Summary of the results obtained by simulations ( N O n X B r e m , N O f f γ B e 0 , and detected N O n γ B e 0 , i + ) for four different concentration values of 7Be and values of required material quantity (mg) and corresponding activity (MBq).
7Be
t0 [days]53.3
Concentration10−65 × 10−65 × 10−55 × 10−4
N O f f γ _ B e 0 , [cps]100500501050,039
A [MBq]22,311468355580
M [mg]17200.3610.0430.006
N γ P l a s m a [cps]40199199019,900
Detected N γ P l a s m a [cps]0.0070.0660.6566552
Table 5. Typical uncertainties, activities, and material quantities reported, for each concentration (columns coloured in yellow, green, orange and blue respectively for 10−6, 5 × 10⁻⁶, 5 × 10⁻⁵, 5 × 10⁻⁴), both for the minimum exposure time case (columns with labels coloured in blue), and for higher measurement times.
Concentration1 × 10−65 × 10−65 × 10−55 × 10−4
tm37.04 days100 days1.6 h15 days1600 s1 day23 s5 min1 h
R e l a t i v e   Δ N O n γ _ B e 0 , i + 47%28%46%15%42%6%36%10%3%
Relative  Δ N O n X _ B r e m 0.01%0.004%0.03%0.01%0.32%0.04%2.7%0.7%0.2%
R e l a t i v e   Δl*62.6%39.6%61.3%23.5%56.7%15.46%49.2%18.76%14.03%
A [GBq]22.3160.244.6845.090.5529.970.081.0412.49
M [mg]1.724.640.363.480.0432.310.0060.080.96
R e l a t i v e   Δ F10%
R e l a t i v e   Δ N010%
Δtm1 s
Disclaimer/Publisher’s Note: The statements, opinions and data contained in all publications are solely those of the individual author(s) and contributor(s) and not of MDPI and/or the editor(s). MDPI and/or the editor(s) disclaim responsibility for any injury to people or property resulting from any ideas, methods, instructions or products referred to in the content.

