Communication

Strength Ratios of Diffuse Interstellar Bands in Slightly Reddened Objects

1
Nicolaus Copernicus Superior School, College of Astronomy and Natural Sciences in Toruń Gregorkiewicza 3, Pl-87-100 Toruń, Poland
2
International Center for Astronomical and Medico-Ecological Research, Zabolotnoho Str. 27, 03143 Kyiv, Ukraine
*
Author to whom correspondence should be addressed.
Universe 2025, 11(6), 181; https://doi.org/10.3390/universe11060181
Submission received: 31 March 2025 / Revised: 30 May 2025 / Accepted: 4 June 2025 / Published: 6 June 2025
(This article belongs to the Section Galaxies and Clusters)

Abstract

:
The disk of the Milky Way fills the interstellar medium in the form of discrete clouds, many (∼30) light-years across. The average density of this medium is 1 hydrogen atom per cm3 (Oort limit), in the clouds—several dozen atoms, and between the clouds about 0.01 atoms per cm3. It is well documented that physical properties of individual interstellar clouds are evidently different using high-resolution spectroscopic observations of slightly reddened stars. We prove here that the 5780/5797 strength ratio is nearly constant for all slightly reddened targets. The reason for this phenomenon remains unknown. All optically thin clouds are apparently of σ-type. The question of at which value of color excess one may expect a ζ-type cloud remains unanswered. For some (unknown) reason ζ-type clouds are always relatively opaque and contain a lot of molecular species. In all slightly reddened objects we always observe σ-type intervening clouds, almost free of simple molecules.

1. Introduction

The interstellar space in our galaxy is composed of many diffuse clouds ( n H ∼50 cm−3) that modify spectra of reddened stars. These clouds cause continuous extinction and polarization (both likely carried by dust grains) as well as spectral features such as optical line absorptions (atomic and molecular ones being identified). However, the carriers of a vast majority of the observed absorptions, namely of the diffuse interstellar bands (DIBs) [1,2], are still of unknown origin, though likely molecular [3,4]. All the above-mentioned spectral features contribute to the spectrum of the interstellar medium—ISM.
Any reliable chemical modelling of interstellar clouds requires selected physical parameters (like kinetic and rotational temperature of the identified molecules or estimated UV flux) constrained by the mutual abundance ratios of as many detected atomic lines and simple molecular bands as possible. These constraints can be yielded from intensities and profile shapes of interstellar spectral features, their mutual strength ratios, and so on.
The strength ratio (SR) of the two major diffuse bands at λ 5780 and 5797 Å (the ratio of their equivalent widths: SR = EW(5780)/EW(5797))—proved to be variable many years ago [5,6]. This ratio demonstrates significant scatter towards different sightlines (e.g., in [7]), due to variations in the local physical conditions, and it could be used as a tester of the intensity of UV radiation in interstellar clouds, see e.g., [3,8]; though Lai et al. [9] disprove this possibility. According to the above-mentioned ratio, interstellar clouds are usually divided into σ -type (after HD147165— σ Sco)—the high ratio and ζ -type (after HD149757— ζ Oph)—the low ratio, though there are intermediate types of clouds in interstellar space, see e.g., [10,11]. This ratio decreases together with the fraction of molecular hydrogen (H2) in interstellar clouds. It is so because the intensity of DIB 5797 is better correlated with column density of H2 (N(H2)) while that of DIB 5780 with N(H1) [12,13].
The phenomenon of σ and ζ clouds was described in several more recent papers; the last one being by [14]. It is of importance to mention that mutual correlations plots are very uncertain in cases of very shallow (noisy) DIBs. Ref. [14] extracted several ‘families’ of DIBs, being likely of the same origin, i.e., sharing the same (molecular) carriers. It is, however, necessary to include that the suggested ‘families’ also have very weak (shallow) DIBs. The measurements of the latter cannot be done with a proper precision due to the noise inside such (shallow) profiles.
Profiles of interstellar atomic lines clearly demonstrate that along any sightline to a reddened star, one can observe several Doppler components (of different radial velocities) revealing the presence of several separate interstellar clouds [15]. The latter are likely of different physical parameters, which is demonstrated by the variable strength ratios of diffuse interstellar bands (and likely — another interstellar absorption). The majority of distant OB stars are observed through several clouds, strung on a respective line of sight (e.g., [16]).
In such cases, one observes some ill-defined averages as absorption spectra of the ISM. Such badly defined averages resemble likely each other. Any physical interpretation of them is hardly possible. The most interesting cases are ‘peculiar’ spectra––most likely originating in single clouds. In such spectra one should not expect any Doppler splitting either in atomic or molecular features, providing the recorded spectra are of sufficiently high resolution. If the S/N ratio is also sufficiently high, one can detect and measure a number of very weak (shallow) diffuse bands. Their rapidly growing number (4 in 1934 [17] and 559 in 2019 [2]) clearly illustrates that a vast majority of DIBs are very weak features.
To avoid dealing with the above-mentioned ill-defined averages, one must deal with spectra of relatively nearby, bright stars, which should be only slightly reddened. In such cases we most likely observe spectra of single and optically relatively thin clouds. Such environments are as homogeneous as possible. Their analysis seems to be relatively simple. However, the spectral features, originated in single clouds which cause little of reddening, cause also very shallow absorption features, which makes their analysis rather difficult due to low S/N ratios (SNR) inside their profiles.

2. Sample Selection and Spectra

Our measurements, listed in Table 1, are based on both our own and ESO archive’s spectra (processed by us from scratch) collected using the following high-resolution echelle spectrographs:
  • UVES (Ultraviolet and Visual Echelle Spectrograph) fed by the 8-m Kueyen VLT mirror [18]. The spectral resolution is up to R = λ / Δ λ = 80,000 in the blue range.1 The telescope size allows us to obtain high SNR spectra of even pretty faint stars. Some of the selected spectra have been collected in the frame of the Large Program EDIBLES (ESO Diffuse Interstellar Bands Large Exploration Survey).
  • ESPRESSO—Echelle Spectrograph for Rocky Exoplanets and Stable Spectroscopic Observations [19] is a highly-stabilized fiber-fed echelle spectrograph that can be fed with light from either a single or up to four unit telescopes (UTs) simultaneously.2 The instrument is installed at the incoherent combined Coudé focus (ICCF) of the VLT. The spectrograph is fed by two fibers, one for the scientific target and the other one for simultaneous reference (either the sky or a simultaneous drift reference, the Fabry–Pérot). The light from the two fibers is recorded onto a blue (380–525 nm) and a red (525–788 nm) CCD mosaic. The spectral resolution is either 190,000, 140,000 or 70,000 and does not influence the spectral range covered.
  • MIKE spectrograph [20] fed by 6.5-m Magellan telescope at Las Campanas Observatory (Chile). Spectra were observed with a 0.35 × 5 arcs slit. We estimated the resolving power using the solitary Thorium lines. The resolution is ∼56,000 ( Δ v∼5.4 km s−1) in the blue branch (3600–5000 Å) of the spectrograph.
  • FEROS spectrograph, which is fed by the 2.2-m ESO La Silla telescope [21]. It allows to record in a single exposure the spectral range from 3600 to 9200 Å, divided into 39 Echelle orders. The resolution of Feros spectra is R = 48,000. We used the ESO archive as well as data of our own runs. If having a choice we used our own observations because of the higher SNR.
  • ESPaDOnS—Echelle Spectropolarimetric Device for the Observation of Stars3, is a bench-mounted high resolving power echelle spectrograph/spectropolarimeter, attached to the 3.58-m Canada-France-Hawaii telescope at Mauna Kea (Hawaii, USA). It is designed to obtain a complete optical spectrum in the range of 3700 to 10,050 Å [22]. The whole spectrum is divided into 40 echelle orders. The resolving power is about 81,000.
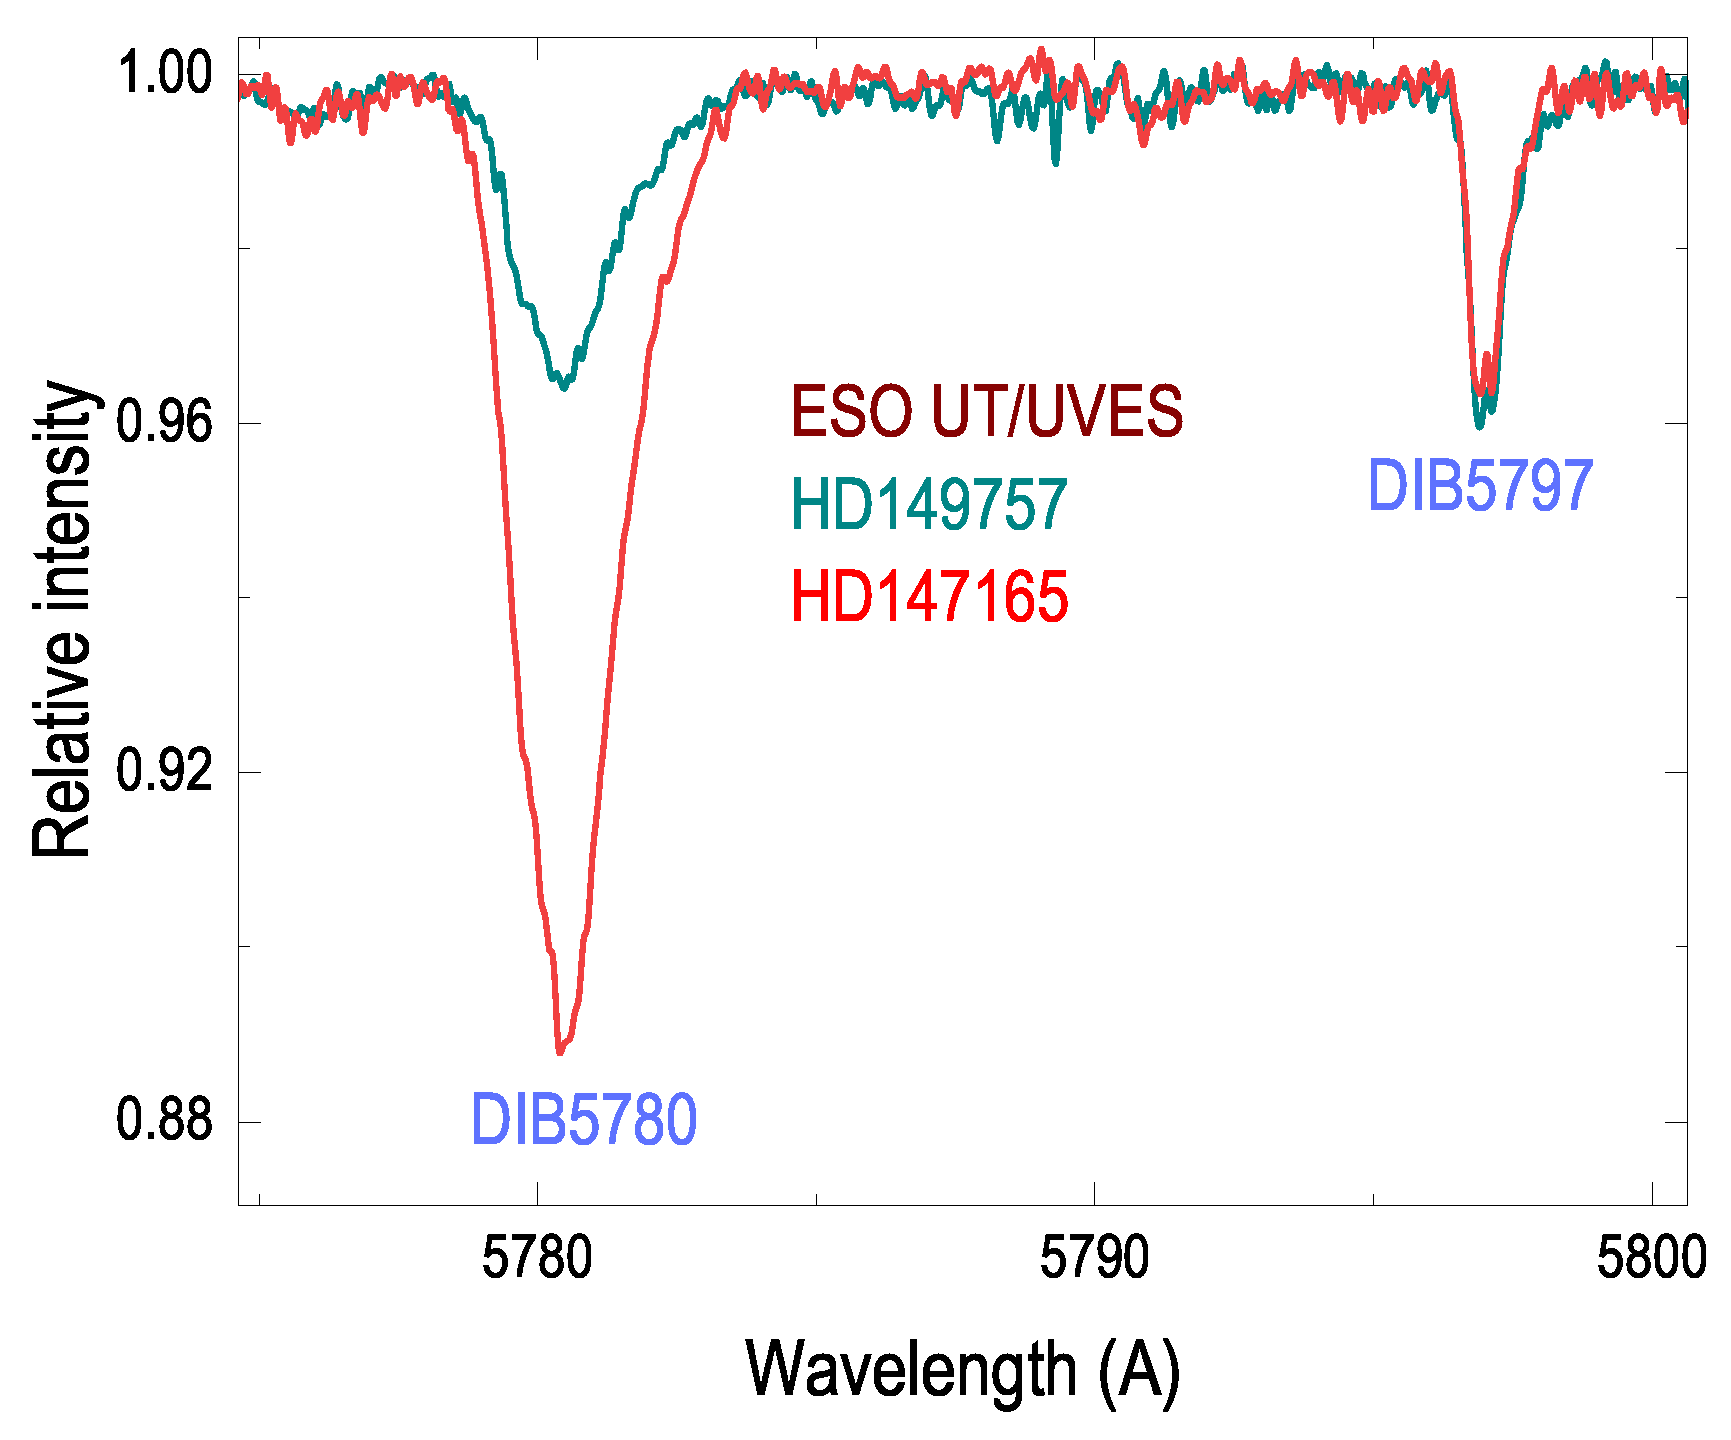
The fact that the 5780/5797 strength ratios are variable was demonstrated in two papers: [5]—using the stars HD 24398 ( ζ Per) vs. HD 40111 and [6]—using the targets HD 147165 ( σ Sco) vs. HD 149757 ( ζ Oph). Let us demonstrate here the diffuse bands’ ratio for the two latter objects. The color excesses for these stars are 0.34 and 0.30, respectively, i.e., nearly identical.
The different strength ratios of the two major diffuse bands, presented in Figure 2, is so evident that we do not need any measurements to make sure the effect is real. Interstellar atomic lines, as well as those of two-atom molecules, are free of the Doppler splitting, and thus one can be convinced we observe these two targets through single interstellar clouds being thus of different physical parameters. Let us also mention that the shapes of the extinction curves derived from both spectra, especially in the far-UV, are seriously different [23]. The UV extinction is relatively (in relation to E(B-V)) much stronger in the spectrum of ζ Oph.
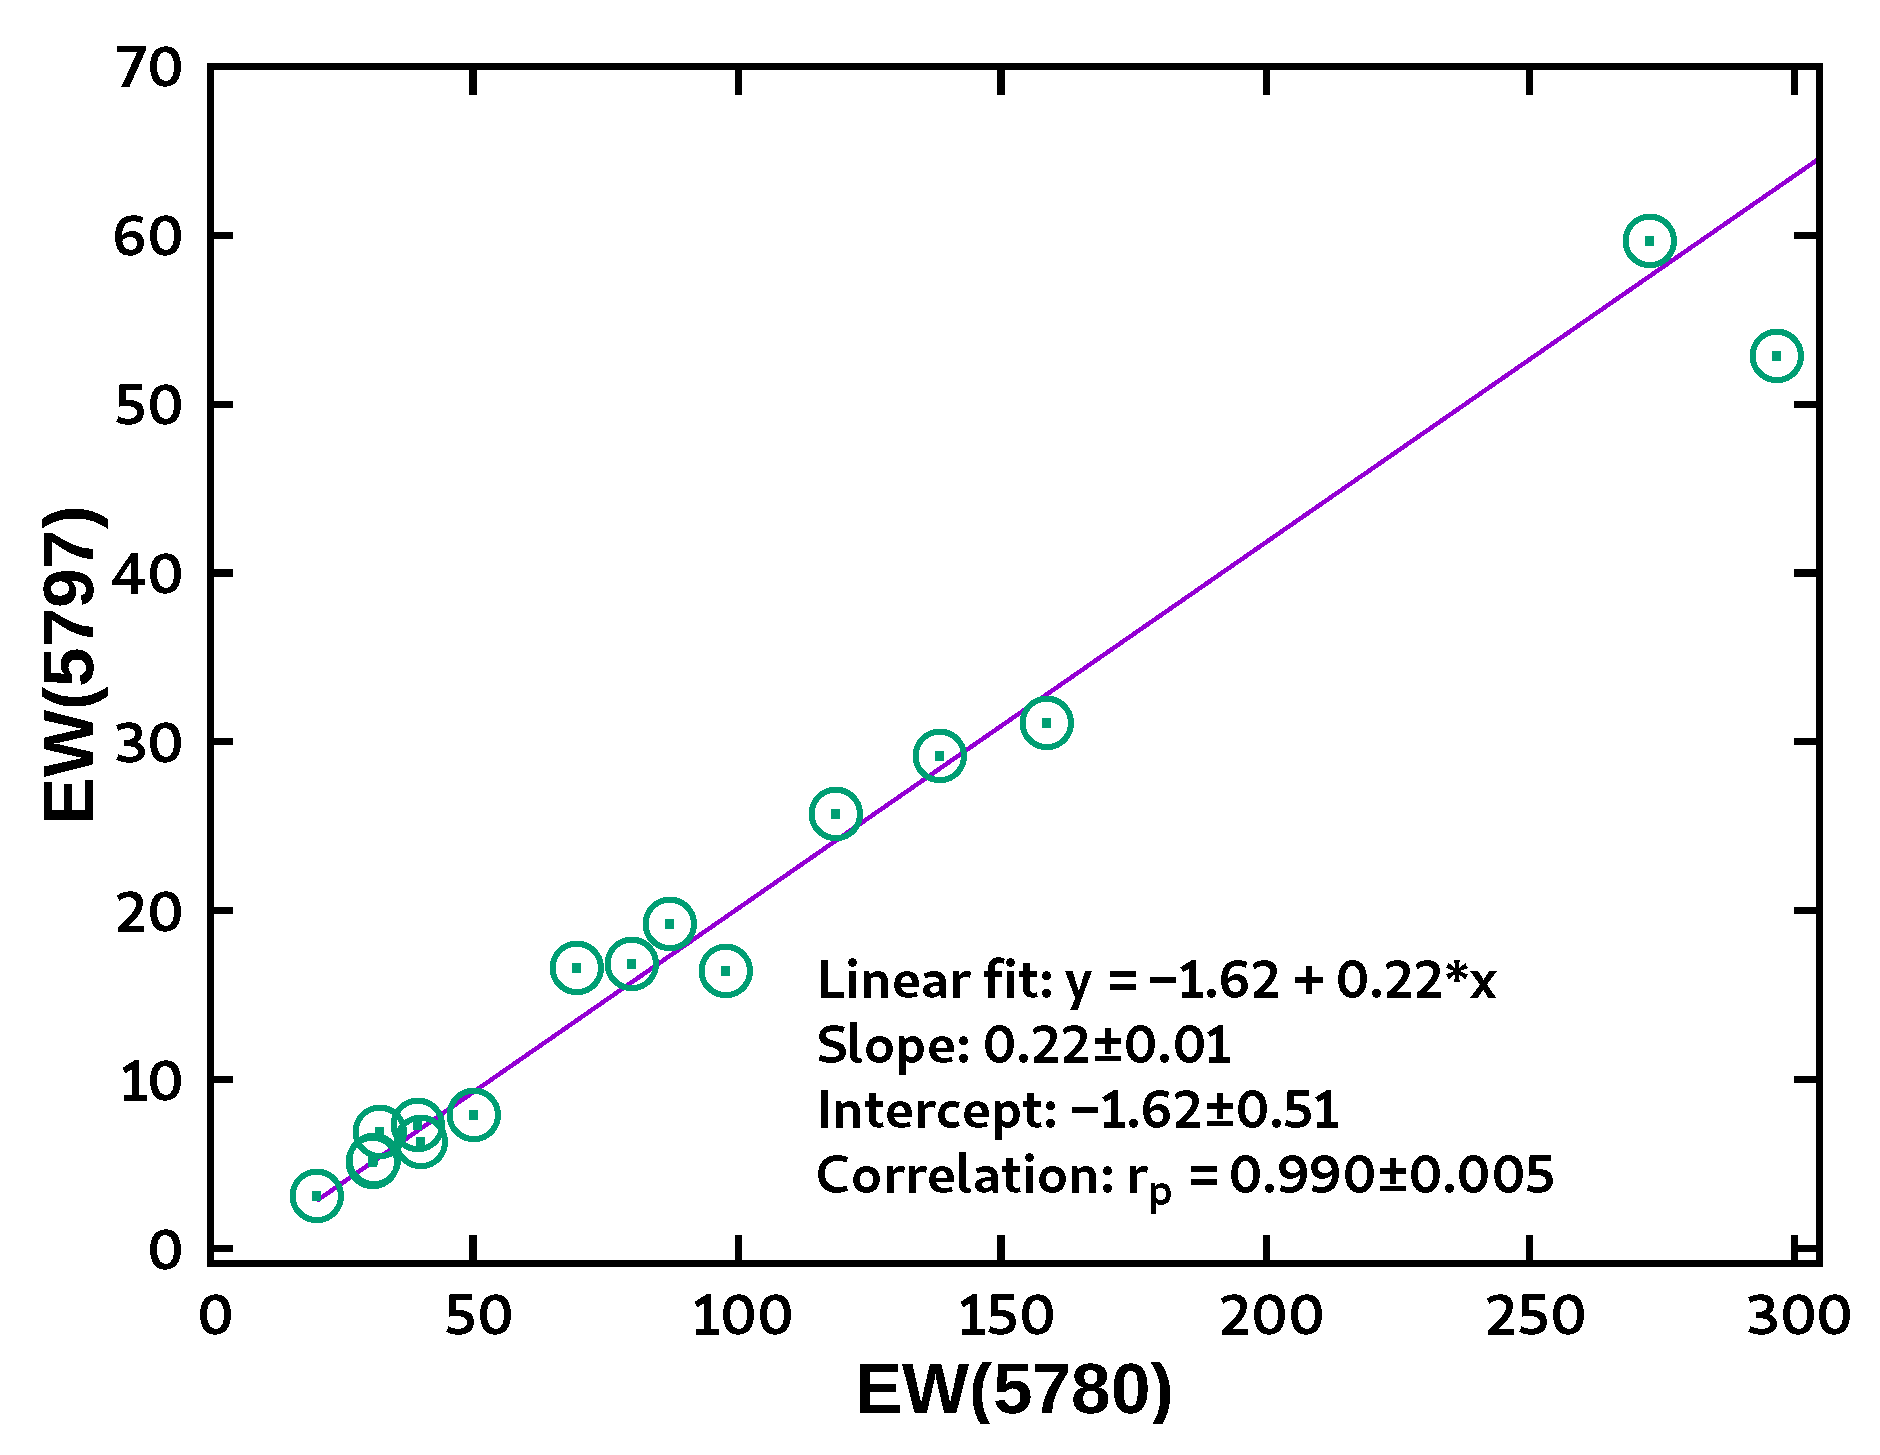
Figure 1. The relation between strengths of the major diffuse bands in slightly reddened targets.
Universe 11 00181 g001
Figure 2. The major diffuse bands in the UVES spectra of σ Sco and ζ Oph—the objects of very similar reddening. Note the identity of the narrow 5797 diffuse band and the evident difference of the strength of the broad 5780 DIB.
Universe 11 00181 g002

3. Results

Initially, the spectra of five objects from Table 1 (shown in italic font) were selected to build Figure 3. It is important that color excesses of these objects are similar (Table 1). However, the strengths of the major DIBs differ by a factor of 6! Thus, the DIB intensities are not simply related to the color excess—caused by the dust grains.
On the other hand, the strength ratio of the two major DIBs, as seen in Figure 3 and from Table 1 seem very similar, independently of their intensities. It covers the range between 4.1–6.1. All the objects look like σ -type ones. Thus, we have selected more slightly reddened stars, extending the Table 1 to 17 objects. All of them are slightly reddened, but the strengths of DIBs are far from identical in this sample.
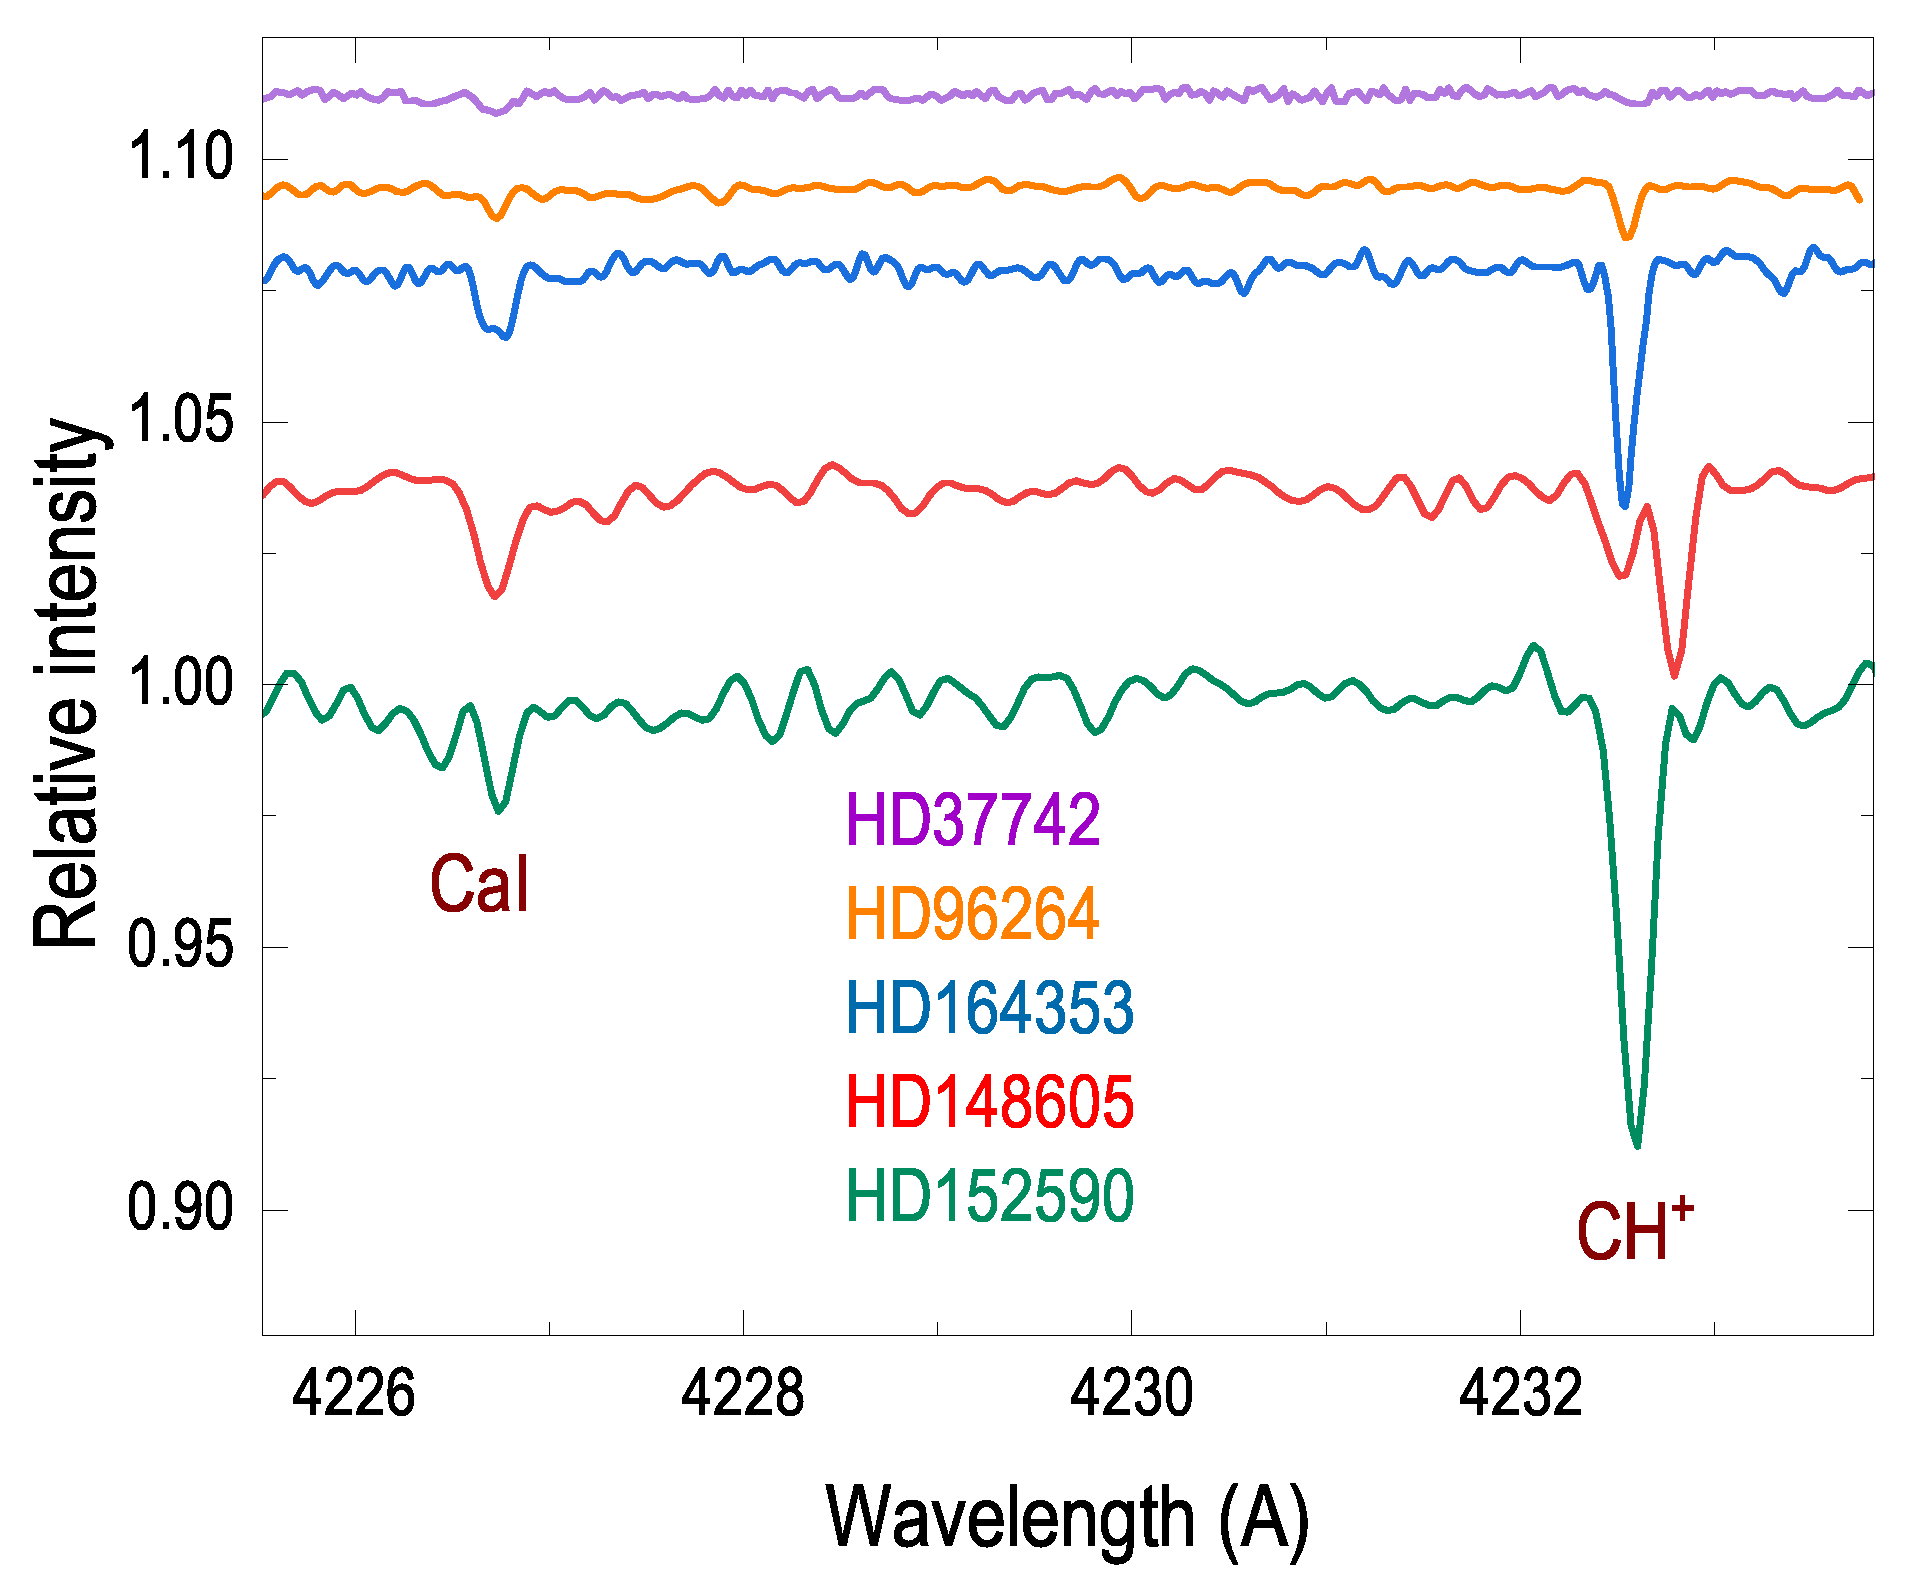
Thus, we found a very interesting effect: seemingly the clouds in front of slightly reddened stars are the σ -type objects! It is important to check what about atomic/molecular lines in their spectra. We have investigated the short range of wavelengths, containing the Ca i line near 4227 Å and that of CH+ near 4232 Å. These spectral ranges are depicted in Figure 4.
It is of importance to note that the central wavelength of the CH+ line is clearly variable while that of Ca i remains apparently constant. Unfortunately, it is not possible to do a similar comparison for the CH 4300 Å line since this spectral range is too noisy in most cases. Figure 4 demonstrates that in most of cases there are not less than two clouds along any sightline and their physical parameters differ seriously.
It is evident that the 5780/5797 strength ratio is nearly constant for all slightly reddened targets, Table 1. The reason for this phenomenon remains unknown. All optically thin clouds are apparently of σ -type. The question at which value of color excess one may expect a ζ cloud remains unanswered. In ζ -type objects one observes relatively strong molecular features, such as CH, CH+, CN and/or C2. This is another proof that physical properties of ζ and σ -type clouds are seriously different.
Figure 1 demonstrates the relation between strengths of the major diffuse bands in the selected targets. As it is seen, the equivalent widths of these two DIBs in spectra of slightly reddened stars are quite well correlated, with Pearson correlation coefficient rp ≈ 0.99.

4. Conclusions

One may conclude that physical parameters of individual clouds may evidently differ. For some (unknown) reason ζ -type clouds are always relatively opaque and contain a lot of molecular species. In all slightly reddened objects we always observe σ -type intervening clouds, almost free of simple molecules (like CH, CN, CH+, C2…) and of the carriers of several, relatively narrow, diffuse bands 6196, 6379 and so on). One needs more high resolution and very high S/N ratio spectral observations of slightly reddening objects. The existing spectra do not allow us to relate most of the interstellar features observed in such objects.

Author Contributions

Conceptualization, J.K.; methodology, J.K.; software, A.B.; validation A.B.; investigation, J.K. & A.B.; data curation A.B.; writing—original draft preparation, J.K.; writing—review and editing, A.B. All authors have read and agreed to the published version of the manuscript.

Funding

This research received no external funding.

Data Availability Statement

The original contributions presented in this study are included in the article. Further inquiries can be directed to the corresponding author.

Acknowledgments

This research has made use of the services of the ESO Science Archive Facility and the SIMBAD database, operated at CDS, Strasbourg, France [24]. The Authors are very indebted to G. Galazutdinov for his essential help in collecting and reducing the data.

Conflicts of Interest

The authors declare no conflicts of interest.

Notes

1
For details see https://www.eso.org/sci/facilities/paranal/instruments/uves.html; accessed on 6–10 October 2014.
2
3

References

  1. Herbig, G.H. The Diffuse Interstellar Bands. Annu. Rev. Astron. Astrophys. 1995, 33, 19. [Google Scholar] [CrossRef]
  2. Fan, H.; Hobbs, L.M.; Dahlstrom, J.A.; Welty, D.E.; York, D.G.; Rachford, B.; Snow, T.P.; Sonnentrucker, P.; Baskes, N.; Zhao, G. The Apache Point Observatory Catalog of Optical Diffuse Interstellar Bands. Astrophys. J. 2019, 878, 151. [Google Scholar] [CrossRef]
  3. Cami, J.; Sonnentrucker, P.; Ehrenfreund, P.; Foing, B.H. Diffuse Interstellar Bands in single clouds: New families and constraints on the carriers. Astron. Astrophys. 1997, 326, 822. [Google Scholar]
  4. Herbig, G.H. The Diffuse Interstellar Bands. IX. Constraints on the Identification. Astrophys. J. 1993, 407, 142. [Google Scholar] [CrossRef]
  5. Krełowski, J.; Walker, G.A.H. Three Families of Diffuse Interstellar Bands? Astrophys. J. 1987, 312, 860. [Google Scholar] [CrossRef]
  6. Krełowski, J.; Westerlund, B.E. High-resolution profiles of diffuse interstellar bands as functions of the structure of the interstellar medium. Astron. Astrophys. 1988, 190, 339. [Google Scholar]
  7. Fan, H.; Welty, D.E.; York, D.G.; Sonnentrucker, P.; Dahlstrom, J.A.; Baskes, N.; Friedman, S.D.; Scott, D.; Hobbs, L.M.; Jiang, Z.; et al. The Behavior of Selected Diffuse Interstellar Bands with Molecular Fraction in Diffuse Atomic and Molecular Clouds. Astrophys. J. 2017, 850, 194. [Google Scholar] [CrossRef]
  8. Vos, D.A.I.; Cox, N.L.J.; Kaper, L.; Spaans, M.; Ehrenfreund, P. Diffuse interstellar bands in Upper Scorpius: Probing variations in the DIB spectrum due to changing environmental conditions. Astron. Astrophys. 2011, 533, A129. [Google Scholar] [CrossRef]
  9. Lai, T.S.Y.; Witt, A.N.; Alvarez, C.; Cami, J. Are the carriers of diffuse interstellar bands and extended red emission the same? Mon. Not. R. Astron. Soc. 2020, 492, 5853. [Google Scholar] [CrossRef]
  10. Fan, H.; Schwartz, M.; Farhang, A.; Cox, N.L.J.; Ehrenfreund, P.; Monreal-Ibero, A.; Foing, B.H.; Salama, F.; Kulik, K.; MacIsaac, H.; et al. Families and clusters of diffuse interstellar bands: A data-driven correlation analysis. Mon. Not. R. Astron. Soc. 2022, 510, 3546. [Google Scholar] [CrossRef]
  11. Krełowski, J.; Galazutdinov, G.; Bondar, A. On the σ and ζ type translucent interstellar clouds. Mon. Not. R. Astron. Soc. 2019, 486, 3537. [Google Scholar] [CrossRef]
  12. Friedman, S.D.; York, D.G.; McCall, B.J.; Dahlstrom, J.; Sonnentrucker, P.; Welty, D.E.; Drosback, M.M.; Hobbs, L.M.; Rachford, B.L.; Snow, T.P. Studies of Diffuse Interstellar Bands V. Pairwise Correlations of Eight Strong DIBs and Neutral Hydrogen, Molecular Hydrogen, and Color Excess. Astrophys. J. 2011, 727, 33. [Google Scholar] [CrossRef]
  13. Weselak, T. The relation between 5780 and 5797 diffuse interstellar bands, CH/CH+ molecules, and atomic or molecular hydrogen. Astron. Astrophys. 2019, 625, A55. [Google Scholar] [CrossRef]
  14. Ebenbichler, A.; Smoker, J.V.; Lallement, R.; Farhang, A.; Cox, N.L.J.; Joblin, C.; van Loon, J.T.; Linnartz, H.; Przybilla, N.; Ehrenfreund, P.; et al. The EDIBLES Survey. VIII. Band profile alignment of diffuse interstellar bands. Astron. Astrophys. 2024, 686, 50. [Google Scholar] [CrossRef]
  15. Merrill, P.W.; Sanford, R.F.; Wilson, O.C.; Burwell, C.G. Intensities and Displacements of Interstellar Lines. Astrophys. J. 1937, 86, 274. [Google Scholar] [CrossRef]
  16. Hobbs, L.M. A comparison of interstellar Na I, Ca II, and K I absorption. Astrophys. J. 1974, 191, 381. [Google Scholar] [CrossRef]
  17. Merrill, P.W. Unidentified Interstellar Lines. Publ. Astron. Soc. Pac. 1934, 46, 206. [Google Scholar] [CrossRef]
  18. Dekker, H.; D’Odorico, S.; Kaufer, A.; Delabre, B.; Kotzlowski, H. Design, construction, and performance of UVES, the echelle spectrograph for the UT2 Kueyen Telescope at the ESO Paranal Observatory. Proc. SPIE 2000, 4008, 534. [Google Scholar]
  19. Pepe, F.; Molaro, P.; Cristiani, S.; Rebolo, R.; Santos, N.C.; Dekker, H.; Mégevand, D.; Zerbi, F.M.; Cabral, A.; Di Marcantonio, P.; et al. ESPRESSO: The next European exoplanet hunter. Astron. Nachr. 2014, 335, 8. [Google Scholar] [CrossRef]
  20. Bernstein, R.; Shectman, S.A.; Gunnels, S.M.; Mochnacki, S.; Athey, A.E. MIKE: A Double Echelle Spectrograph for the Magellan Telescopes at Las Campanas Observatory. Proc. SPIE 2003, 4841, 1694. [Google Scholar]
  21. Kaufer, A.; Stahl, O.; Tubbesing, S.; Nørregaard, P.; Avila, G.; Francois, P.; Pasquini, L.; Pizzella, A. Commissioning FEROS, the new high-resolution spectrograph at La-Silla. The Messenger 1999, 95, 8. [Google Scholar]
  22. Donati, J.-F.; Catala, C.; Landstreet, J.D.; Petit, P. ESPaDOnS: The New Generation Stellar Spectro-Polarimeter. Performances and First Results. Astron. Soc. Pac. Conf. 2006, 358, 362. [Google Scholar]
  23. Fitzpatrick, E.L.; Massa, D. An Analysis of the Shapes of Interstellar Extinction Curves. V. The IR-through-UV Curve Morphology. Astrophys. J. 2007, 663, 320. [Google Scholar] [CrossRef]
  24. Wenger, M.; Ochsenbein, F.; Egret, D.; Dubois, P.; Bonnarel, F.; Borde, S.; Genova, F.; Jasniewicz, G.; Laloë, S.; Lesteven, S.; et al. The SIMBAD astronomical database. The CDS reference database for astronomical objects. Astron. Astrophys. Suppl. Ser. 2000, 143, 9. [Google Scholar] [CrossRef]
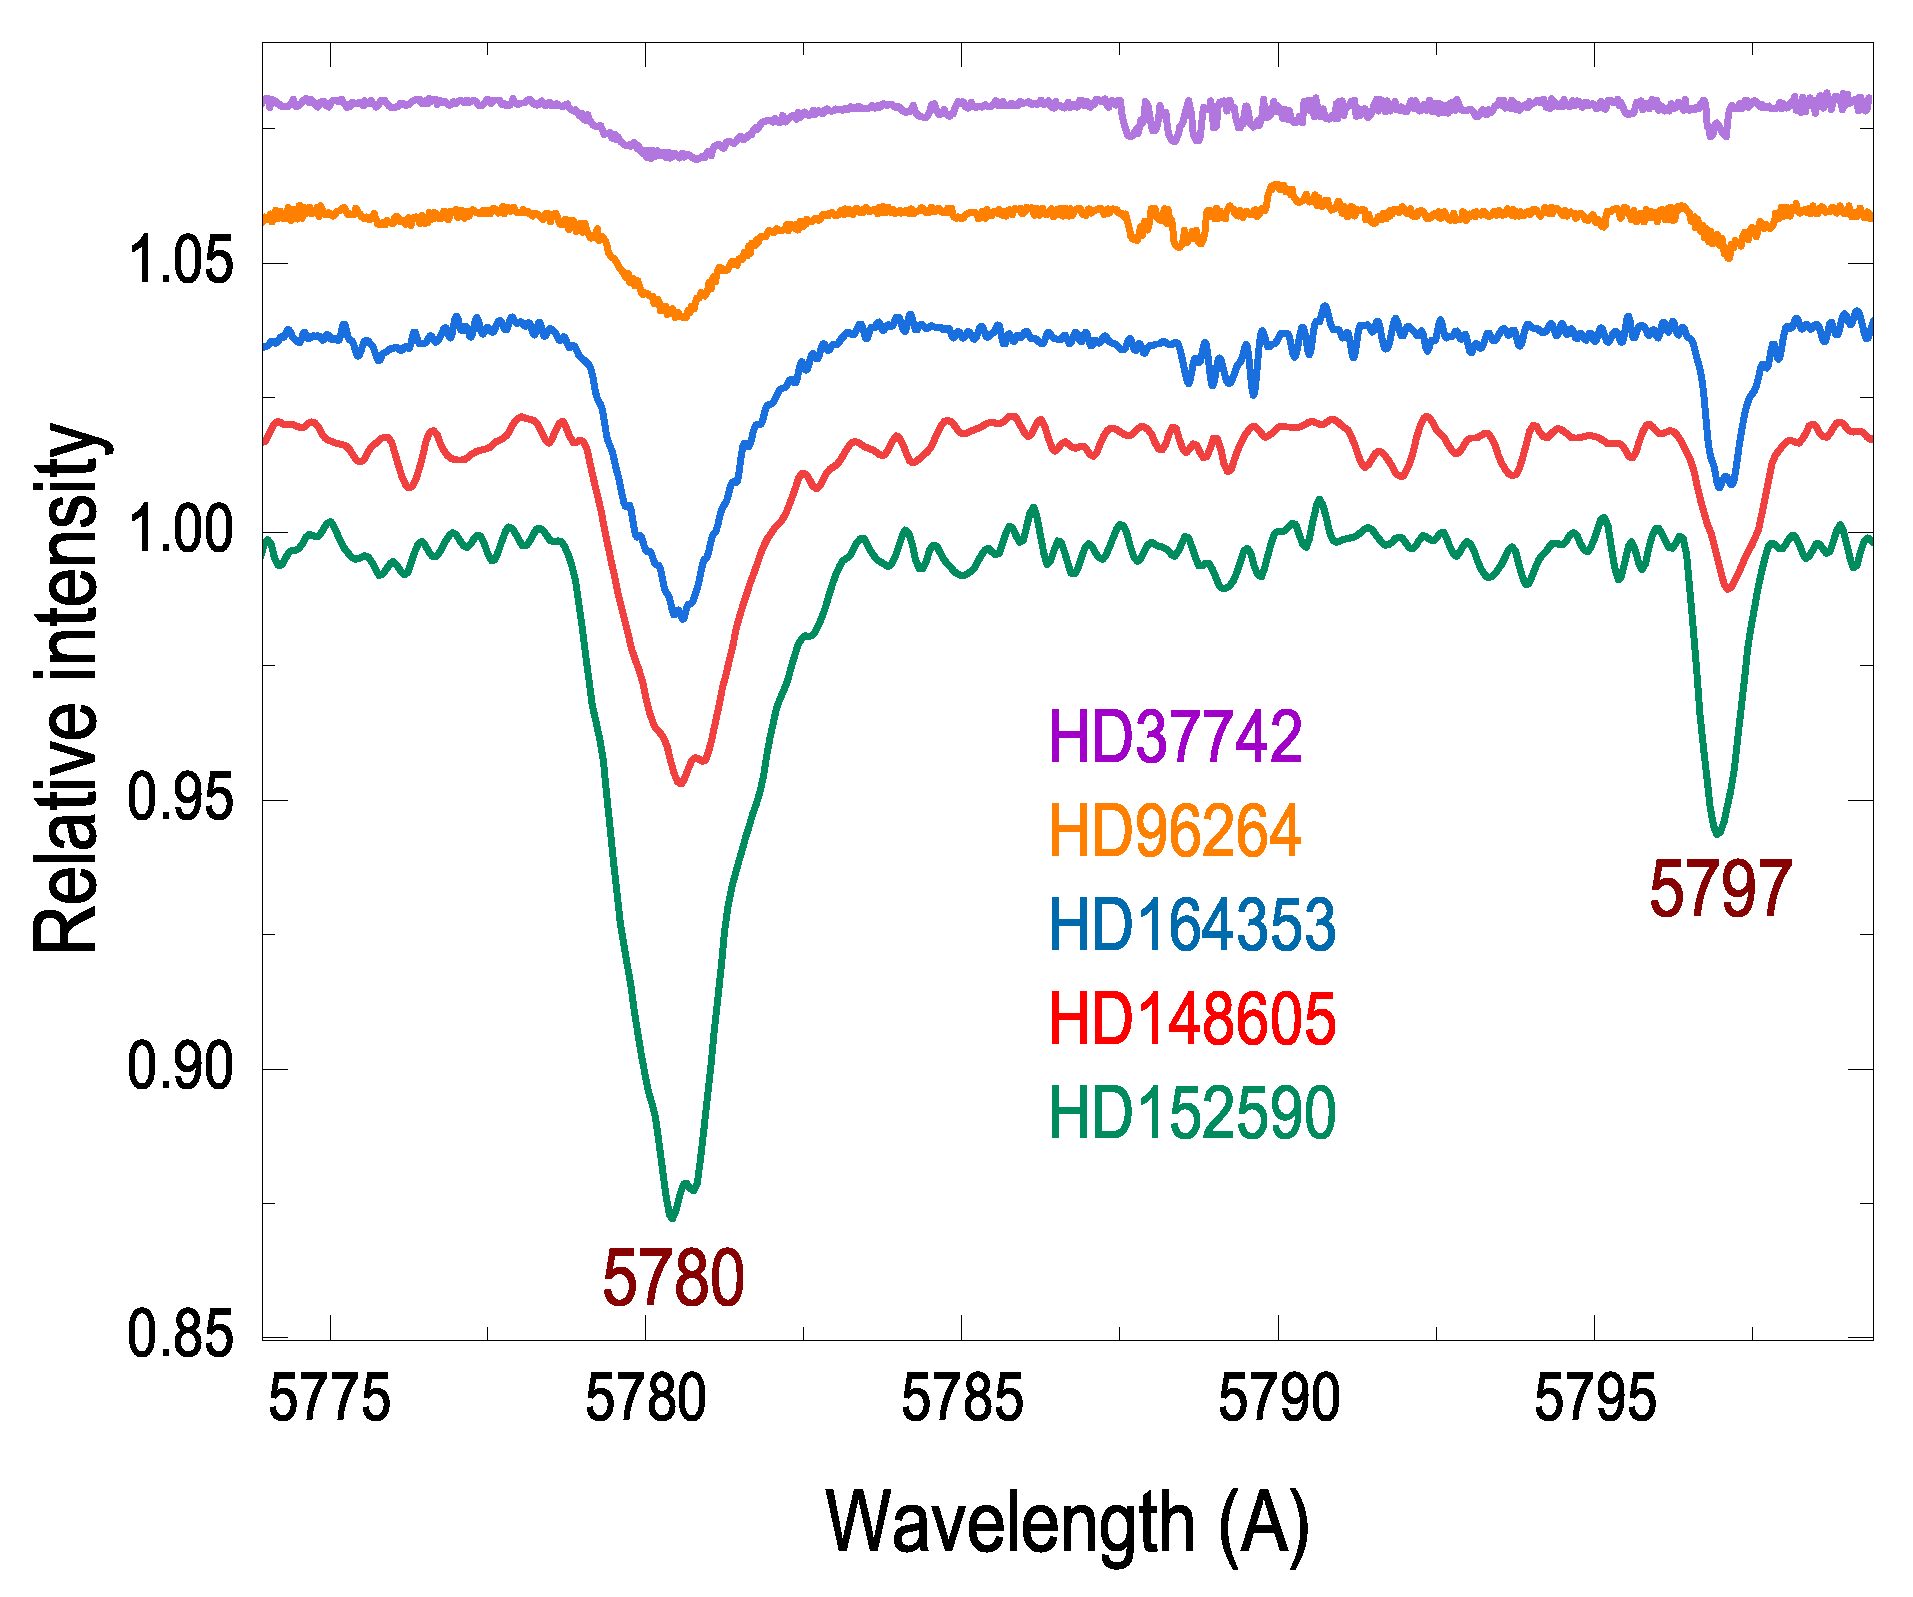
Figure 3. The major diffuse bands in the spectra of five slightly reddened targets. Note their similar strength ratio while the intensities of the bands differ by a factor of 6.
Universe 11 00181 g003
Figure 4. Interstellar Ca i and CH+ lines in the same targets as in Figure 3. Note the wavelength variations of the CH+ feature.
Universe 11 00181 g004
Table 1. Basic targets’ data; the equivalent widths (mÅ) and the strength ratios of the DIBs at λ λ 5780 and 5797 Å.
ObjectSpLVB-VE (B-V)EW (5780)EW (5797)SRInstr.
HD 23441A0V6.42−0.020.0831.1 ± 6.65.4 ± 2.65.8 ± 3.0mike
HD 23850B8III3.63−0.090.0339.5 ± 6.97.6 ± 3.85.2 ± 2.8mike
HD 36486O9.5II2.4120.5 ± 13.93.4 ± 3.66.0 ± 7.6UVES
HD 36822B0III4.41−0.150.0897.8 ± 23.216.7 ± 7.95.9 ± 3.1UVES
HD 37128B0Ia1.69−0.180.0431.3 ± 18.55.5 ± 5.05.7 ± 6.2UVES
HD 37742 aO9.2Ib1.90−0.110.1221.1 ± 14.51.1 ± 1.4ESPR
HD 38771B0.5Ia2.06−0.180.0232.4 ± 16.77.2 ± 4.44.5 ± 3.6UVES
HD 55879O9.7III6.30−0.180.0580.1 ± 21.717.1 ± 8.74.7 ± 2.7Feros
HD 57061O9II4.40−0.150.0950.2 ± 18.38.2 ± 6.06.1 ± 5.0UVES
HD 57682O9.2IV6.43−0.190.0887.3 ± 23.319.5 ± 9.54.5 ± 2.5Feros
HD 93632O5I9.10296.8 ± 41.753.1 ± 17.75.6 ± 2.0UVES
HD 96264O9.5III7.62−0.080.16138.3 ± 19.229.4 ± 8.44.7 ± 1.5Feros
HD 141318B2III5.77−0.010.18158.6 ± 24.731.4 ± 10.25.1 ± 1.8UVES
HD 148605B3V4.79−0.070.1140.2 ± 3.66.6 ± 1.26.1 ± 1.2UVES
HD 152590O7.5V9.29−0.180.11272.8 ± 23.459.9 ± 11.54.6 ± 1.0Feros
HD 164353B5Ib3.930.030.11118.7 ± 18.226.0 ± 6.44.6 ± 1.3UVES
HD 214680O9V4.88−0.210.0769.7 ± 18.116.9 ± 5.64.1 ± 1.7ESPaDOnS
a— the spectrum with the weakest major DIBs, especially DIB 5797. Thus their EWs are uncertain and not included in the fit shown at Figure 1. ‘⋯’ — data are very uncertain and thus no presented in the table.
Disclaimer/Publisher’s Note: The statements, opinions and data contained in all publications are solely those of the individual author(s) and contributor(s) and not of MDPI and/or the editor(s). MDPI and/or the editor(s) disclaim responsibility for any injury to people or property resulting from any ideas, methods, instructions or products referred to in the content.