Review

THEMIS Vector Magnetograph in Canary Islands

by
Brigitte Schmieder
1,2,*,
Véronique Bommier
1 and
Bernard Gelly
3
1
Observatoire de Paris, LIRA, UMR8254, F-92195 Meudon, France
2
KU Leuven, CmPA, 3001 Leuven, Belgium
3
THEMIS, 38660 Tenerife, Canary Islands, Spain
*
Author to whom correspondence should be addressed.
Universe 2025, 11(5), 153; https://doi.org/10.3390/universe11050153
Submission received: 8 April 2025 / Revised: 26 April 2025 / Accepted: 29 April 2025 / Published: 7 May 2025

Abstract

:
The Télescope Héliographique pour l’Etude du Magnétisme et des Instabilités Solaires (THEMIS) has been operating in the Canary Islands since 1998. A total of 187 publications are listed in the THEMIS database. The telescope was upgraded in 2019 with adaptive optics and was fully operational in 2024. When operated in polarimetric mode, the telescope is calibration-free and has a high polarimetric sensitivity, which enables important results to be obtained. We will summarize a few of these results, obtained mainly during coordinate campaigns with the multi-spacecraft, outlined as follows: the horizontal magnetic field in prominences, the existence of flux rope in flare regions, and the magnetic field interchange reconnection between jets and filaments.

1. Introduction

THEMIS is a French solar telescope accessible to an international community that has been in operation since 1998. A list of publications is available at https://ui.adsabs.harvard.edu/public-libraries/BtvRn9YcT6Oce2FhoORYJw (accessed on 26 April 2025). The THEMIS telescope spectrograph was originally operated in two modes as follows: the “Multi Raies” (MTR) mode [1] and the Multi-Subtractive Double-Pass Spectrograph (MSDP) mode [2,3]. This paper is not an exhaustive review of publications using those two modes, as they can be consulted in earlier publications produced by the Italian, Spanish, Swiss, Greek, Chinese, and French communities. We shall limit our presentation to the main themes addressed by the three authors of this article. In Section 2, we will describe THEMIS in its early version, as well the inversion methods used for the THEMIS data to retrieve the components of the magnetic field in the solar structures. In Section 3, we present THEMIS in its second life (starting in 2019), with many new technical features, including adaptive optics (AO).

2. THEMIS Between 1998–2014

2.1. Instrument

The Telescope Héliographique pour l’ Etude du Magnétisme et des Instabilités Solaires (THEMIS: [1,2]) belongs to the French Centre National de la Recherche Scientifique (CNRS), and is a solar telescope located within the Spanish Observatorio del Teide of the Instituto de Astrofisica de Canarias (IAC) on the island of Tenerife. The elevation of the site is 2400 m, the latitude is 28° north, offering good daytime seeing conditions for solar observations. The telescope itself stands on top of a 25 m height tower and features a Ritchey–Chretien primary mirror 92 cm in diameter. The front and rear sections of the telescope are sealed with BK7 glass plates to allow for the primary and secondary mirrors to stay within an atmosphere of low pressure of helium, in order to prevent turbulence above the main pupil. An 8 m diameter dome protects the instrument from weather. The dome design is quite specific with a small 1m diameter round window opening, which snugly fits the telescope aperture and is driven by a pseudo-elevation assembly. The temperature inside the dome and internal tower is carefully controlled to avoid the build-up of internal seeing in the transfer optics or in the spectrographs.
The polarization analyzer is installed at the prime focus of the Ritchey-Chrétien telescope before any oblique reflection, which could create spurious polarization Rayrole [4]. In the original 1998 setup, the polarimeter consisted of two quarter-wave achromatic plates and a polarizing beam splitter. This analyzer required a F1 field mask to allow for dual beam polarimetry. The four Stokes parameters were first obtained in three successive measurements, becoming six measurements when using beam exchange possibility. The temperature of the quarter-wave plates was precisely defined to maintain constant birefringence properties. To this end, considering the environment of a solar image at f/16.7, the plates were immersed in oil whose temperature was stabilized to within 0.1 °C. This temperature control effort later proved to be unnecessary and was abandoned from 2002 onwards. The focus F1 was followed by transfer optics routing the beam to the first spectrograph entrance, where an f/63 F2 focus was formed with a 2 × 2 field. Between the F1 and F2 focus, a steerable M5 mirror was used to scan the field across the spectrograph slit. Further down, a field derotator was compensating for the image rotation on the spectrograph’s entrance slit.
From 2004 to 2015, a piezo-tip-tilt mirror worked immediately before the F2 slit to stabilize the field on the spectrograph slit and correct for image motions [5]. This device was driven by a correlation tracker running at 300 Hz. The tip-tilt performed well when the telescope was in an open field configuration, e.g., in a non-polarimetric configuration or for planetary (Mercury) observations. The field limitations induced by the F1 field mask to enable dual-beam polarimetry represented a serious hindrance to the proper correction of the image motions, and the device was performing well only in a limited number of situations.
Below the F2 focus, the telescope is equipped with a high dispersion spectrograph that enables the simultaneous observation of several spectral ranges that can be distributed over a 2500 Å bandwidth, following the scientific requirements from observers. This (still unique) observing capability is made possible by the setup of a low-dispersion grating predisperser followed by a high-dispersion (R = 10 6 ) echelle spectrograph. Those two spectrographs are housed in a vertical cylindrical tank (attached to the telescope’s azimuth mount) and are suspended inside THEMIS’s internal tower. The first spectrograph is a long predisperser with three different gratings that can be swapped following the requirements. Several masks can be installed in the plane of the intermediate focus (Sl) at the output of the first spectrograph to select different sets of spectral lines. The second spectrograph is an echelle spectrograph producing high-dispersion spectra. Up to ten spectral regions, dispersed across the entire spectral range from 4500 Å to 9000 Å, can be observed simultaneously.
Data from the first full sun, as well as MTR spectra (with a limited number of spectral ranges for the time being), were obtained during the summer of 1997. The scientific use of THEMIS resumed in the summer of 1998, for a limited percentage of time (25%), and increased to 75% in the following years, by which time all THEMIS observing modes reached their nominal performance levels [1,6].
Bommier and Rayrole [6] tested the level of polarimetric sensitivity in observations of the Fe I 5576 Å line made with the THEMIS MTR spectropolarimetric mode on 23 August 1998. This line, being insensitive to the Zeeman effect, allows the calibration of the polarization. As a result, the observed line turns out to be unpolarized, and a sensitivity of σ = 2–4 × 10⁻⁴ (value of the ratio between the standard deviation of the continuum intensity at one wavelength for 300 maps and the continuum intensity) has been found for the degree of polarization in the nearby continuum. This demonstrated the high polarimetry quality of the THEMIS vector magnetograph.

2.2. Inversion Method—Zeeman Effect

The measurement of magnetic fields in solar atmosphere is based on the polarimetry of atomic lines emitted or absorbed in solar atmosphere, prominences, and filaments. Two atomic effects are responsible for changes in spectral line polarization due to magnetic fields—the Zeeman effect and the Hanle effect. The complete theory of these two effects is detailed in the book of Landi Degl’Innocenti [7]. The Zeeman effect plays an important role for strong magnetic fields, such as in sunspot, while the Hanle effect is used to determine weak magnetic fields, such as in prominence.
In the solar atmosphere, the principal effect tha changes the spectra is the Zeeman effect. The solar magnetic field is measured by interpreting the Zeeman effect, which divides a spectral line into several components. However, in the visible wavelength range, the width of the line (Doppler width) is usually too large to observe separate components, which would enable the field strength to be determined directly by measuring the splitting. The atomic lines used to measure the depolarization, have different sensitivity to the magnetic field. The value of the Landé factor (g), which scales the Zeeman splitting, must be taken into account to assess the line’s sensitivity. In the first years of THEMIS MTR operation, two lines were observed simultaneously as fikkiws: Fe I 6302.5 Å and Fe I 5250.2 Å. As both lines are recorded simultaneously, no alignment of the spectra is required. The theory is then able to predict the polarization profile, given the magnetic field vector. We measure with a polarimeter the Stokes parameters (I, Q, U, V). Interpreting the observations requires an inversion process. Bommier et al. [8] uses the inversion code UNNOFIT [9]. The theory is based on the Unno–Rachkowsky theory, supplemented by magneto-optical effects, which express the polarization profile in analytical form by integrating the transfer equation in a Milne–Eddington atmosphere, supposing that Planck’s function behaves linearly as a function of optical depth (local thermodynamic equilibrium is assumed). The inversion code, UNNOFIT (for a normal triplet Zeeman line), is based on the Levenberg–Marquardt algorithm for fitting the theoretical profile to the observed profile. UNNOFIT2 is also available for lines that are not normal Zeeman triplets [8].
Bommier [10] showed that observations in two different lines, which belong to the same multiplet, have an advantage for resolving the azimuth ambiguity resulting from the Zeeman signal interpretation. For example, Fe I 6302.5 Å and 6301.5 Å, belonging to the same multiplet, are a good choice because they have different absorption coefficients so they are formed at two different depths [11], permitting us to estimate | d i v B | . | d i v B | in the 3D data is minimized to resolve the 180 fundamental ambiguity [12].
These two lines, Fe I 6302.5 Å and 6301.5 Å are particularly interesting because their formation depths exhibit a strikingly parallel behavior, and they have different Landé factors.

2.3. Inversion Method—Hanle Effect

The Zeeman effect occurs when magnetic splitting is larger than or equal to the natural line width, while the Hanle effect occurs when the magnetic splitting of the spectral line is less than or comparable to the natural line width.
The first measurements of magnetic fields in prominence were performed by the introduction of the Hanle effect by Leroy et al. [13], Bommier et al. [14,15]. The successful measurements made by them confirmed that magnetic fields are essentially horizontal and of inverse polarity with respect to the photospheric magnetic polarities below the prominence. The averaging field strength they measured was in the range 10–20 G. After exploring 296 prominences, observed at Pic du Midi Observatory during the ascending solar cycle 21 between 1974 and 1982, synoptic maps have been produced showing the global solar organization. In each hemisphere, alternating field directions can be observed from one neutral line to the next. Second, a general field alignment is found along each polarity inversion line. This is interpretable by the action of the differential rotation [16].
Prominences are illuminated by the photosphere a few thousand kilometers below, and the light is scattered by the prominence atoms. All scattering processes lead to polarization if the incoming scatterings are not isotropically distributed. Magnetic fields modify the atomic coherences in the atom and consequently the amount of polarization emitted. Diagnosing magnetic fields using the Hanle effect requires inversion codes capable of handling all this multidimensional quantum information appropriately. Bommier et al. [14], Sahal-Brechot et al. [17] computed the formalism and produced diagrams used to derive the Hanle effect. Between theory and observations, the work is not so simple. One needs to compare each theoretical profile and each observational profile with an inversion algorithm. However, we do not know how to solve the inverse problem and deduce the magnetic, thermodynamic, and radiative field from these spectral data. This inverse problem is actually ill-posed.
The first inversion method used for the prominence polarimetry was the development of the Hanle diagrams proposed by [18], which are still operational. The ambiguity can then be resolved either by statistics [19], by using two lines of different optical thickness [15], or by observation on two consecutive days as described below for a THEMIS observation [20]. The magnetic field vector is measured by the interpretation of the Hanle effect observed in the He I D3 5875.6 Å line, within the horizontal field vector hypothesis for simplicity. The ambiguity was first solved by comparing the two pairs of solutions obtained for a “big pixel” determined by averaging the observed Stokes parameters in a large region at the prominence center. Each pixel was then disambiguated by selecting the closest solution in a propagation from the prominence center to the prominence boundary. However, this method is based on time-consuming computations.
Another solution is to create a database of different cases computed under known conditions of the magnetic field and the rest of the model parameters. one such method being Principal Component Analysis (PCA) [21,22]. The PCA method starts by computing a basis, in the algebraic sense, of the expected profiles. Another method is the more common least-squares fitting codes. Presently, the most important least-squares algorithm for the inversion of polarization profiles of the He lines in prominences taking into account the Zeeman and Hanle effects is Hazel [23]. The use of inversion codes allows us to carefully analyze errors and biases in the measurements.
The Hanle effect is also used to explore the weak magnetic field of the second spectrum observed at the limb in Sr I, Ba II, and the molecular lines [11,24,25,26,27] (see Section 3.1).

3. Science in Progress

As we mentioned in the introduction, we limit our discussion to the main topics approached by the three authors of this paper and some of their colleagues observing at THEMIS. The observations have been obtained during multi-wavelength campaigns coordinated with space instruments. From the analysis of the published papers, we try to derive some guidelines for the future.

3.1. Second Solar Spectrum

The first observations during the 2000 campaign were obtained by Bommier and Rayrole [6]. They concern the second solar spectrum measuring the resonance polarization at the limb of the following series of lines: Sr I 4607 Å, Na I D1 5896 Å and D2 5890 Å, Ba II D1 4934 Å and D2 4554 Å, C I 4932 Å. The observations have been devoted to the measurement of the scattering polarization that is a linear polarization observed near the limb of the Quiet Sun, eventually modified by a weak magnetic field (the Hanle effect, Section 2.3). They concluded that the strength of the polarization signal depends on the solar cycle. Using 4607 Å Sr I line and several molecular lines around 5159 Å [25,26], the presence of a weak turbulent magnetic field with an average strength between 20 G and 30 G in the upper solar photosphere was found. The question of long-term variation in the turbulent photospheric magnetic field with the activity cycle was again raised [24]. The dependence of the polarization was later confirmed using Hinode/SOT data [28].

3.2. Active Regions

3.2.1. Maps

In the Bommier’s web page, active region maps can be retrieved, with 36 maps of Hinode/SOT and 86 THEMIS maps treated by UNNOFIT2 [8,9,10]. (https://lesia.obspm.fr/perso/veronique-bommier/index.php?page=observations.php&instrument=1 (accessed on 26 April 2025)).
An example of an active region is shown in Figure 1. This region is complex and shows an intense electric current density going across the polarity inversion line (see arrows in the middle panel). Many X-ray C-class flares occurred during that day. In this active region, the magnetic energy could not be stored for a long time and only small flares were observed.
The dynamics of the chromosphere have been investigated with the MSDP [29], and with the MTR mode [30]. The former authors observed Ellerman bombs and jet spectra near a sunspot. The H α spectra revealed high velocity and twist in the jet spectra. The MSDP allows us to have simultaneously spectra and images of the Sun after opening the slit to 30 arcsec and has permitted us to particularly study the dynamics of the cool jets also called surges [29].

3.2.2. Magnetic Configuration

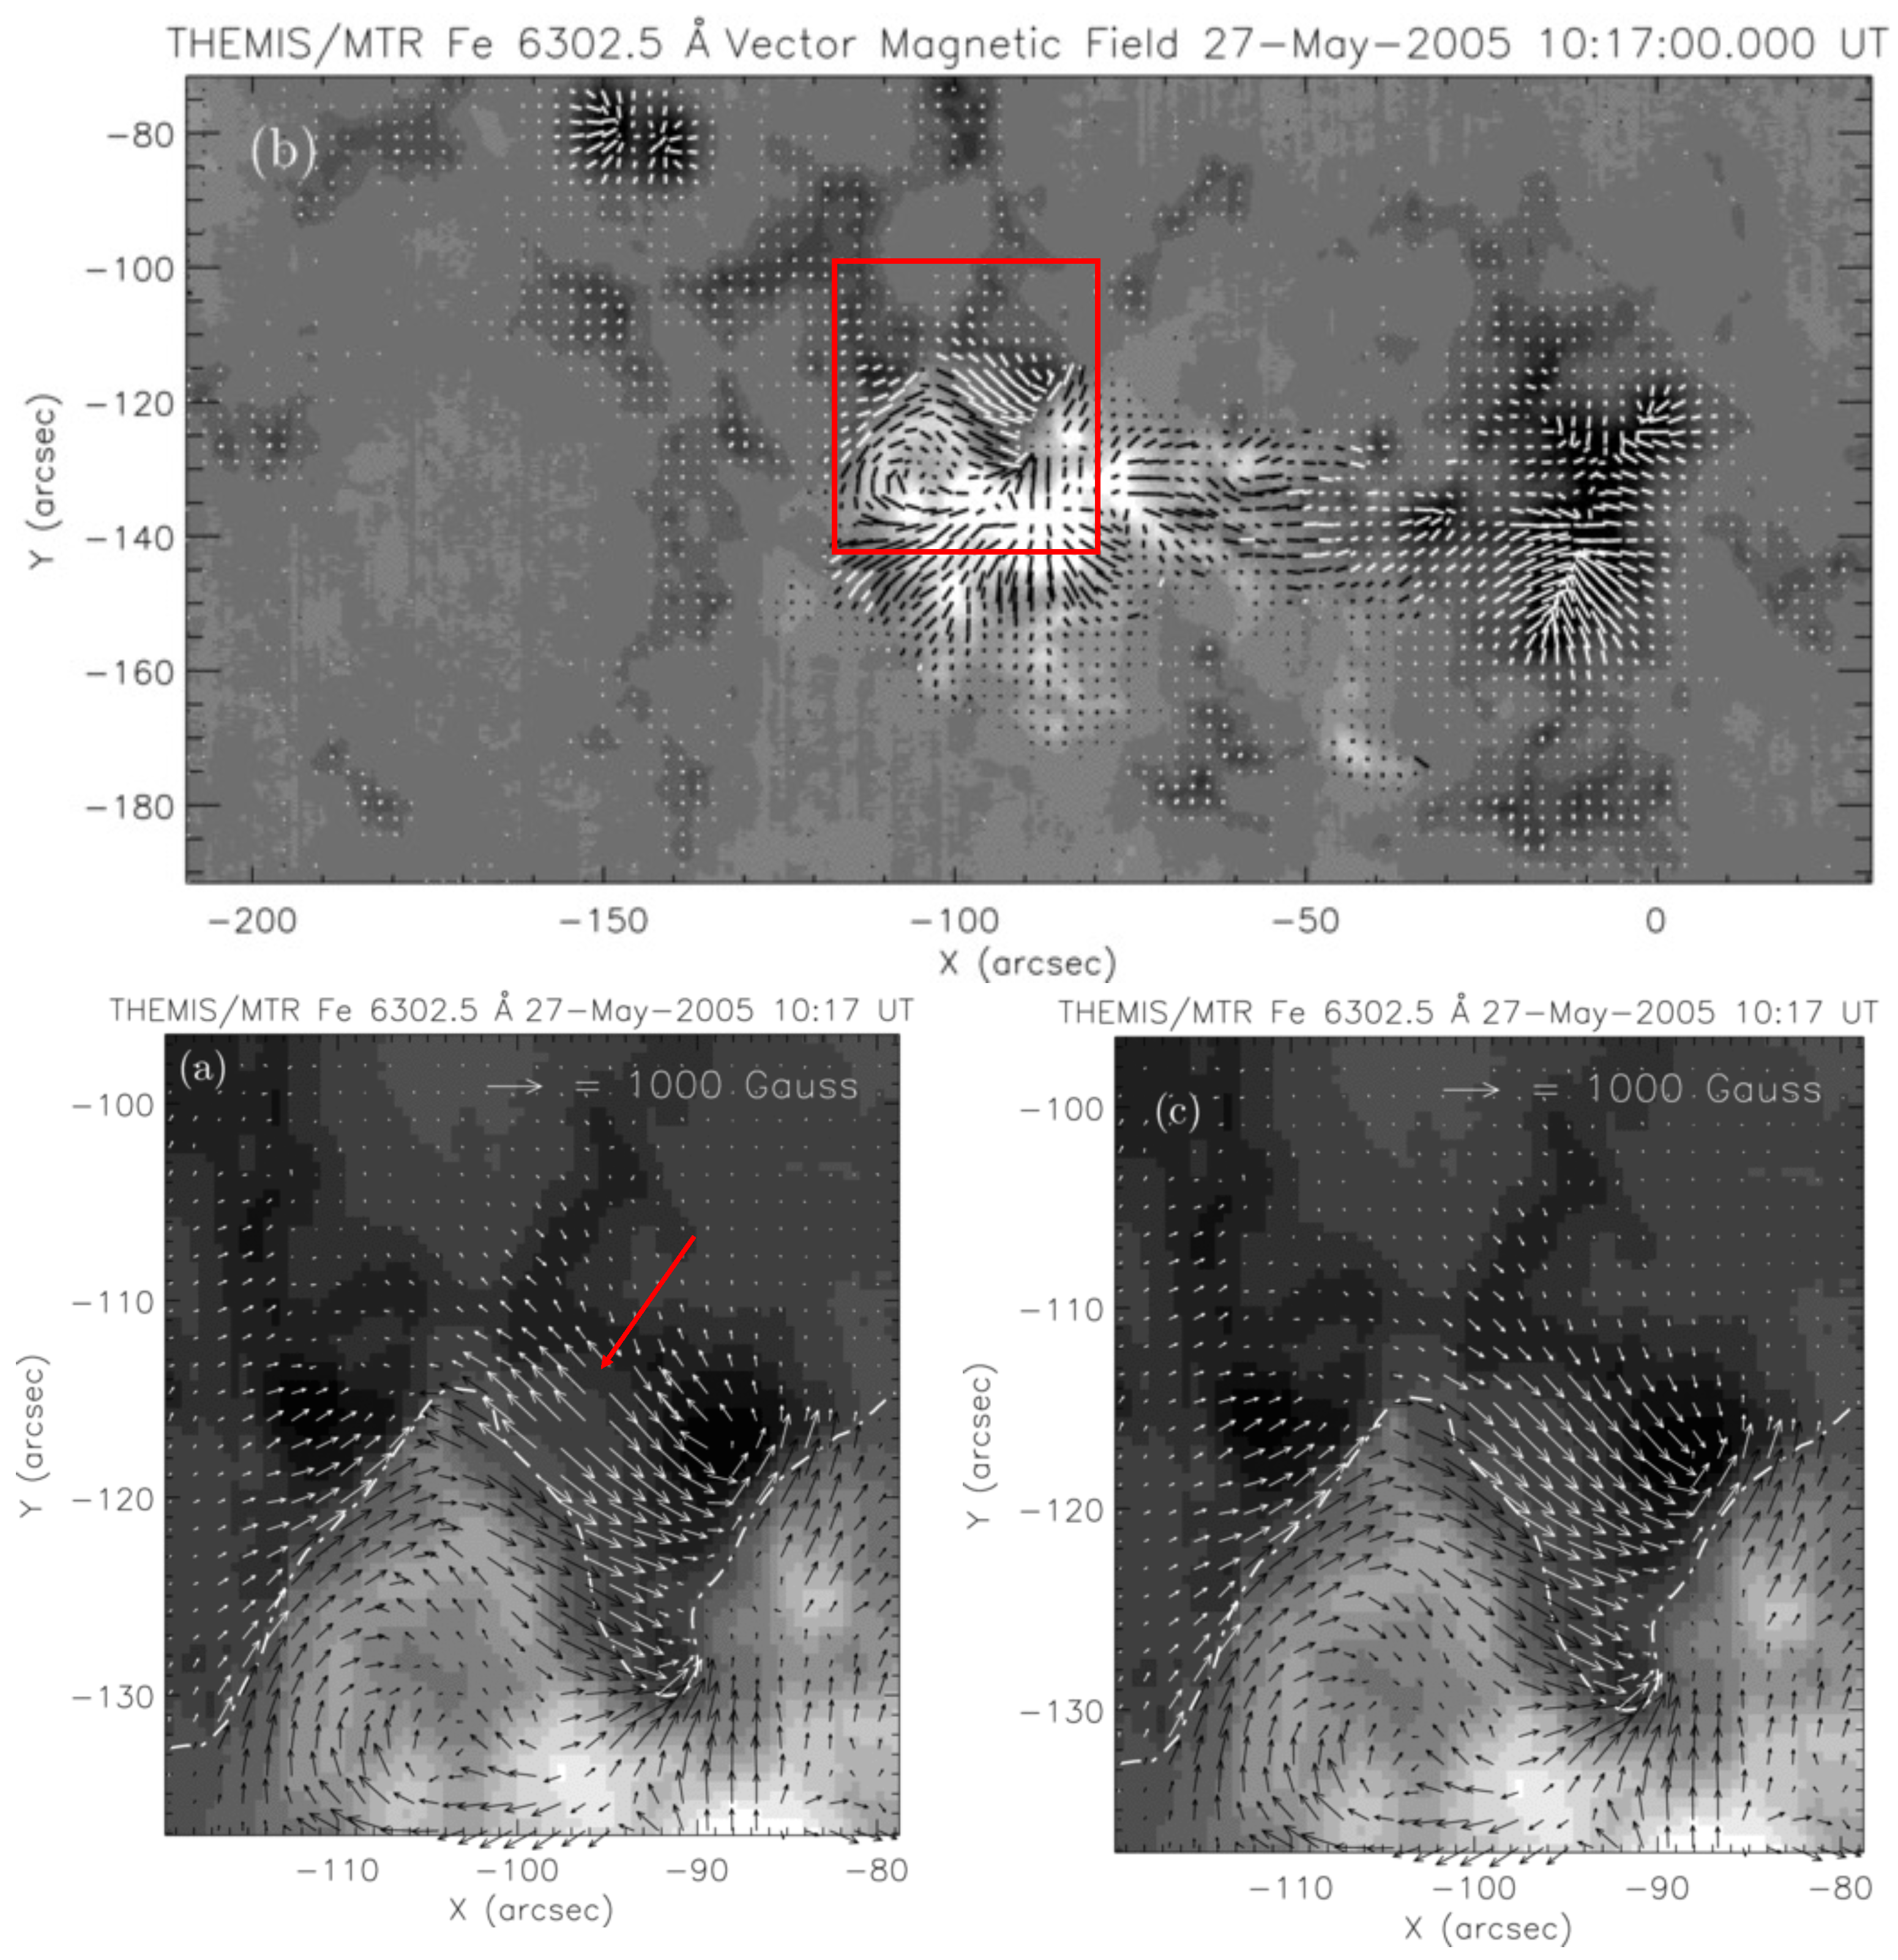
THEMIS/MTR observed on 27 May 2005 the active region NOAA 10767 crossed by a filament [31,32]. THEMIS/MTR scanned the solar surface from east to west by a 0.5 × 120 arcsec slit with a step size of 0.8 arcsec. The Stokes profiles were observed for five spectral lines; however, only the profiles of the Fe 6302.5 Å and H α 6562.8 Å lines were used. The I, Q, U, and V profiles were obtained by adding and subtracting the calibrated I ± S profiles. The authors adopted the inversion code UNNOFIT [8,9] to fit the Stokes profiles around the Fe 6302.5 Å line. Other algorithms were also tested to resolve the 180 ambiguity. Each of them created some discontinuous borders separating two smooth solution domains, while there was no observational evidence showing that there existed such discontinuous borders (Figure 2). To solve this ambiguity problem, Guo et al. [31] developed an interactive code, adopting the assumption that the magnetic fields change as smoothly as possible in the whole active region, which implies that the LOS electric current density, Jz, has to be minimized in regions of abrupt changes of the transverse field. They could yield maps of the three magnetic field components of the active region. After this procedure, they have demonstrated for the first time that a filament could partly be a flux rope and partly a sheared arcade. Since their discovery, many filaments have been found to have a similar magnetic configuration.

3.2.3. Triggering Mechanisms of Eruptions

Guo et al. [32] used the THEMIS data of 27 May 2005 once more. They show that the filament part with a magnetic flux rope present in the source region shortly before the eruption was responsible for the eruption. Observations of the Stokes profile for the Fe 6302.5 Å line of the region at 10:17 UT were used to perform a nonlinear force-free field (NLFFF) extrapolation employing a manual optimization method by testing the influence of the resolution of the grid. The NLFFF extrapolation showed that the eastern part of the filament was a flux rope. They could estimate the flux rope twist. Next, with a potential field extrapolation, they estimated the decay index of the external magnetic field. The decay index was found to be below the threshold for the torus instability for a significant height range above the erupting flux rope [33,34]. This provides a possible explanation for the confinement of the eruption to the low corona.

3.3. Filaments

Before an eruption, the data provided by THEMIS allowed us to highlight the presence of a twisted flux rope (TFR) located above the emerging δ spot in the AR NOAA 10808 [35]. This result may represent the first case of quantitative evidence of the existence of a TFR in the corona associated with an emerging pair of spots. Since the presence of magnetic tongues observed in the photospheric magnetogram represents evidence for the emergence of a TFR, these results build a bridge between the sub-photospheric TFR structure and the coronal configuration which is also a TFR. Moreover, TFRs have been shown to be good candidates for explaining large-scale eruptive events in the context of magnetohydrodynamic (MHD) mechanisms [35]. The theoretical MHD model computed with OHM software, developed by Aulanier [36], shows a flux rope in the form of a sigmoid with two hooks at the ends. This kind of observation inclined the modelers to introduce a flux rope in their filament eruption simulations [37,38,39].
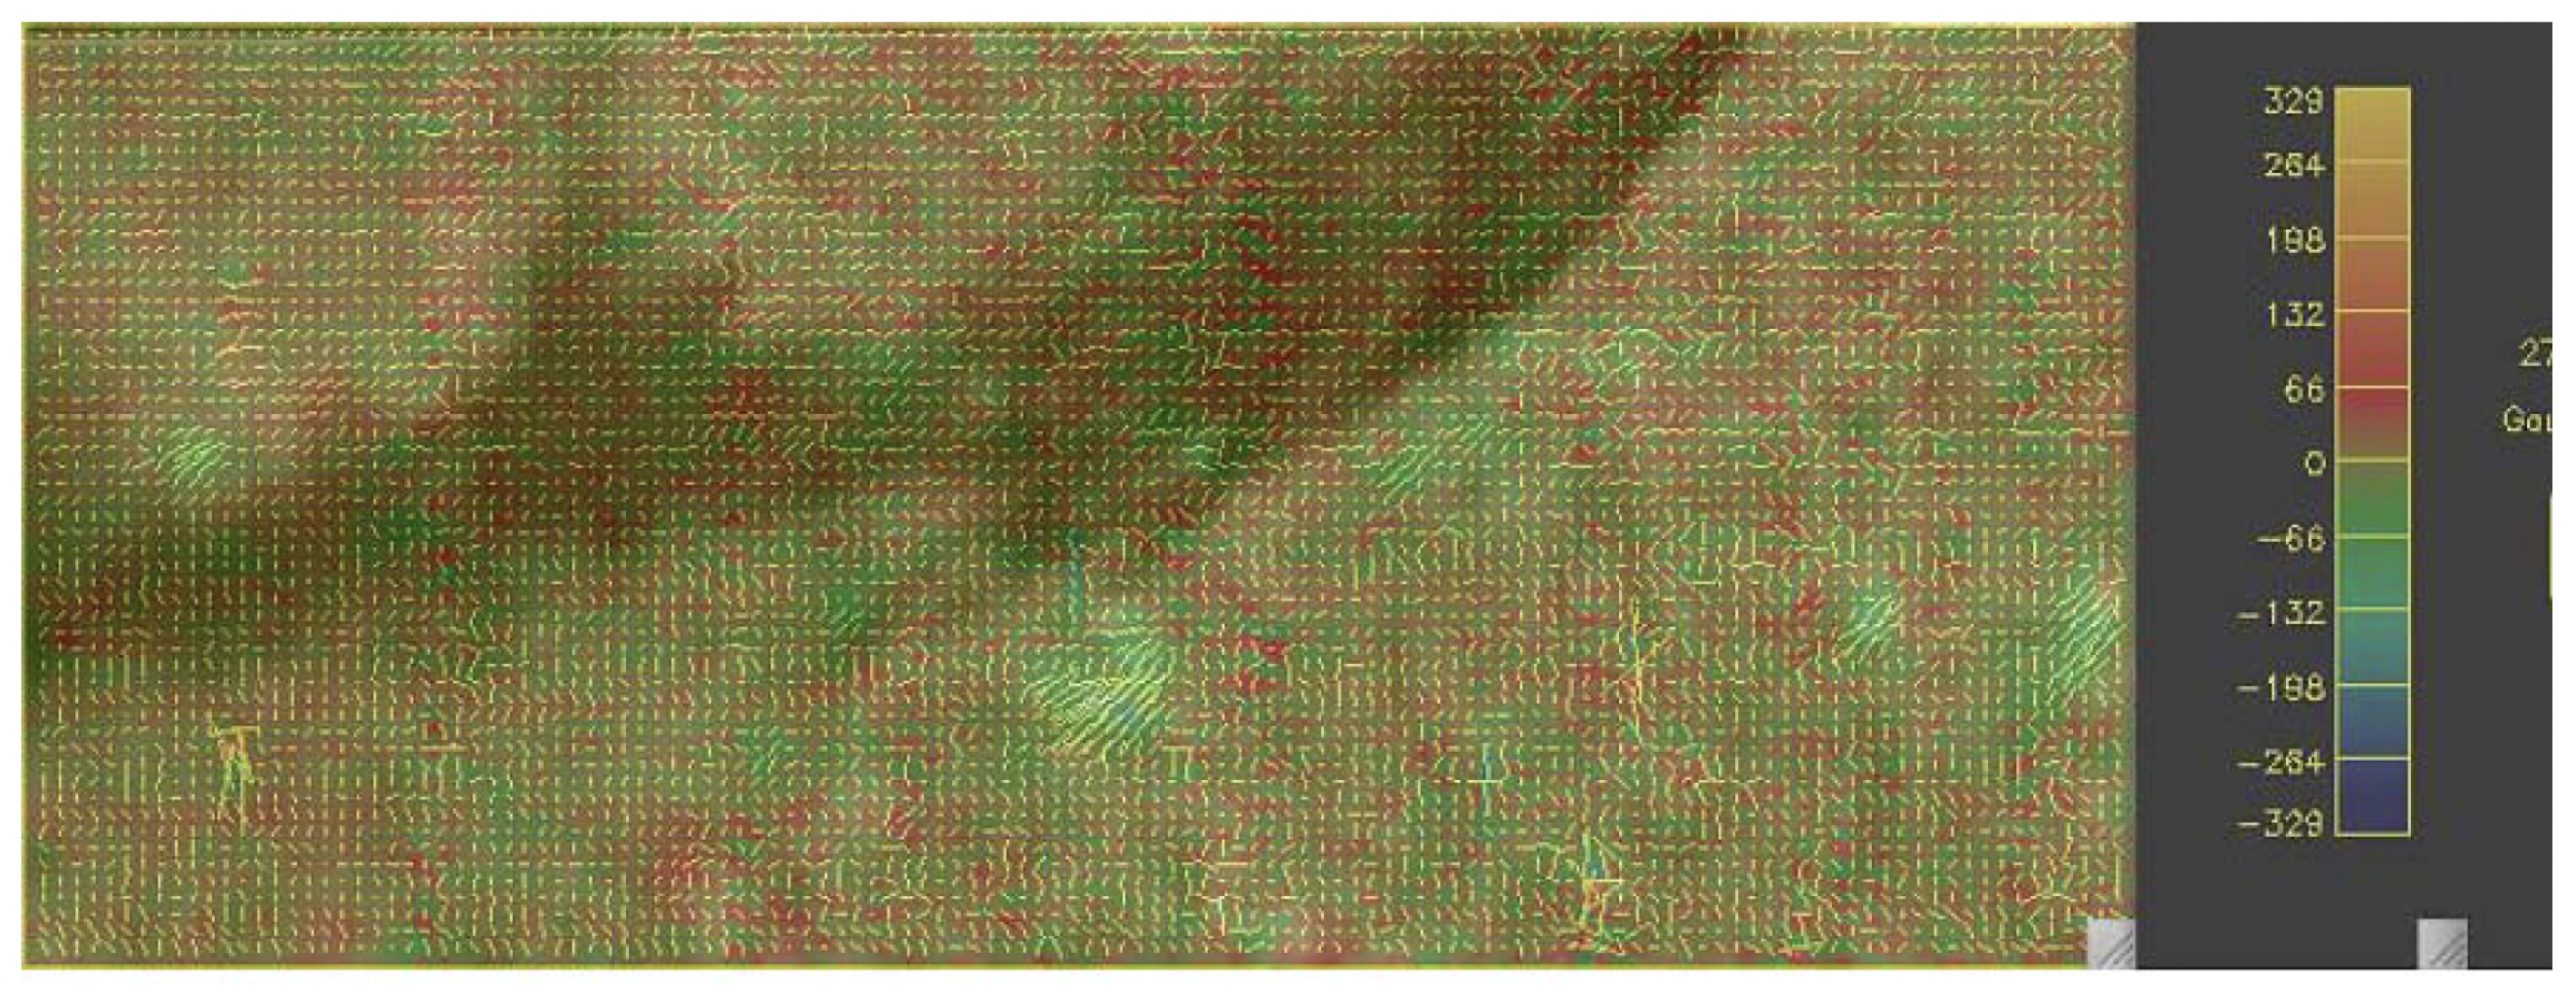
During a THEMIS campaign with spacecraft (TRACE, SOHO/LASCO), a long filament was observed in August 2006. Counter-streaming flows (+/−10 km s−1) in the filament were detected more than 24 h before its eruption [40]. A slow ascent of the overall structure began during this period, with an estimated speed of around 1 km s−1. In the hour preceding the eruption (26 August 2006 around 09:00 UT), the speed reached 5 km s−1. The filament eruption is suspected to be responsible for the slow coronal mass ejection (CME) observed by LASCO around 10:00 UT on August 26. No brightening in H α or in the coronal lines was detected, and no new emerging polarity in the filament channel was detected, even with the high polarimeter sensitivity of THEMIS. They measured a relatively large decrease in the intensity of the photospheric magnetic field (from 400 G to 100 G) (Figure 3) [40]. Initially, it relates to coronal magnetic tension oriented downward, ensuring the stability of the filament underlying these arcade magnetic fields. According to some MHD models based on turbulent photospheric diffusion, this slight decrease in magnetic force (tension) could act as the destabilizing mechanism that first leads to the slow filament rise and its fast eruption. This discovery was possible due to the observation campaign managed around THEMIS with space instruments. Furthermore, the slow rise of a filament long time before an eruption has been recently demonstrated in MHD modeling [41].
During a campaign with SOHO/SUMER and THEMIS/MSDP. a filament was observed [42]. After the treatment of radiative transfer for the Lyman series and H α line, they concluded that the optical thickness of the Lyman continuum is larger quantity than that of the H α line from one to two orders of magnitude. This could be of great importance for filament formation modeling, if we consider that more cool material exists in filament channels but is optically too thin to be visible in H α images [42]. This was confirmed by MHD modeling [43].

3.4. Prominences

The magnetic field in prominences is generally very weak. Therefore, for polarimetry studies, the Hanle effect is the main important effect. However, both effects are included in the inversion codes.
THEMIS is a unique instrument that can observe the Stokes parameters in these years and even now, in 2025. Prominence magnetic fields at THEMIS have been studied using Helium lines by Kalewicz and Bommier [20], Schmieder et al. [44], Orozco Suárez et al. [45], Levens et al. [46], Koza et al. [47]. With THEMIS, the four spectral lines strong enough to observe prominences are H α , H β , the He I at 10,830 Å and He D3 lines.
The ambiguity in magnetic field orientation is difficult to resolve both with the He I 1083 Å triplet and with the He D3 lines. However, a general conclusion confirms that the magnetic field in prominence is mainly horizontal, as suggested by the extrapolation models [48].
The He D3 at 5673.6 Å is a well-studied line with THEMIS because it is a multiplet with two lines of different Landé factors and allows us to compute the magnetic field in prominences. Koza et al. [47] established the characteristics of the large profiles observed in a quiescent prominence for the He D3 line. Through statistics over a large number of pixels, they could fit the profiles with two Gaussians, one in the blue wing and the other one in the red wing. The full-width half-maximum (FWHM) distributions of each Gaussian have medians at 0.31 Å and 0.29 Å for the blue and red components, respectively. Their maximum intensities have a ratio between 6 and 8. This has important implications for the interpretation of He I D3 spectropolarimetry using current inversion codes, when one line signal is too weak.
The classical mode of THEMIS/MTR for prominence in He D3 was to achieve scanning of around 88 × 50 arcsec. The cycle of the three polarization states and the repetition of the observations 5 to 10 times to increase the signal-to-noise means that it takes one to two hours to perform a scan. With such a long time of scanning, seeing could not stay stable. The polarimetric results of the Stokes I, Q, U, and V show an amplitude of the signal between 0.4% and 4% [49].
Multi-wavelength studies were performed with SDO/AIA during several campaigns with THEMIS in October 2012 and with IRIS in September 2013 [44,50]. The acquisition of THEMIS/MTR data was as described above, but the signal had a larger amplitude. The raw data was reduced with the DeepStokes procedure [51] and the Stokes profiles were fed to an inversion code based on Principal Component Analysis (PCA) [21,52]. Initially, the observed profiles were compared with those in a database containing 90,000 profiles. They are generated with known models of the polarization profiles of the He D3, taking into account the Hanle and Zeeman effects [21]. The most similar profile of the database is kept as the solution, and the parameters of the model used in the computation are taken, as well the inferred vector magnetic field height above the photosphere and the scattering angle. Other models which are sufficiently similar to the observed ones are also kept, as well as an error bar.
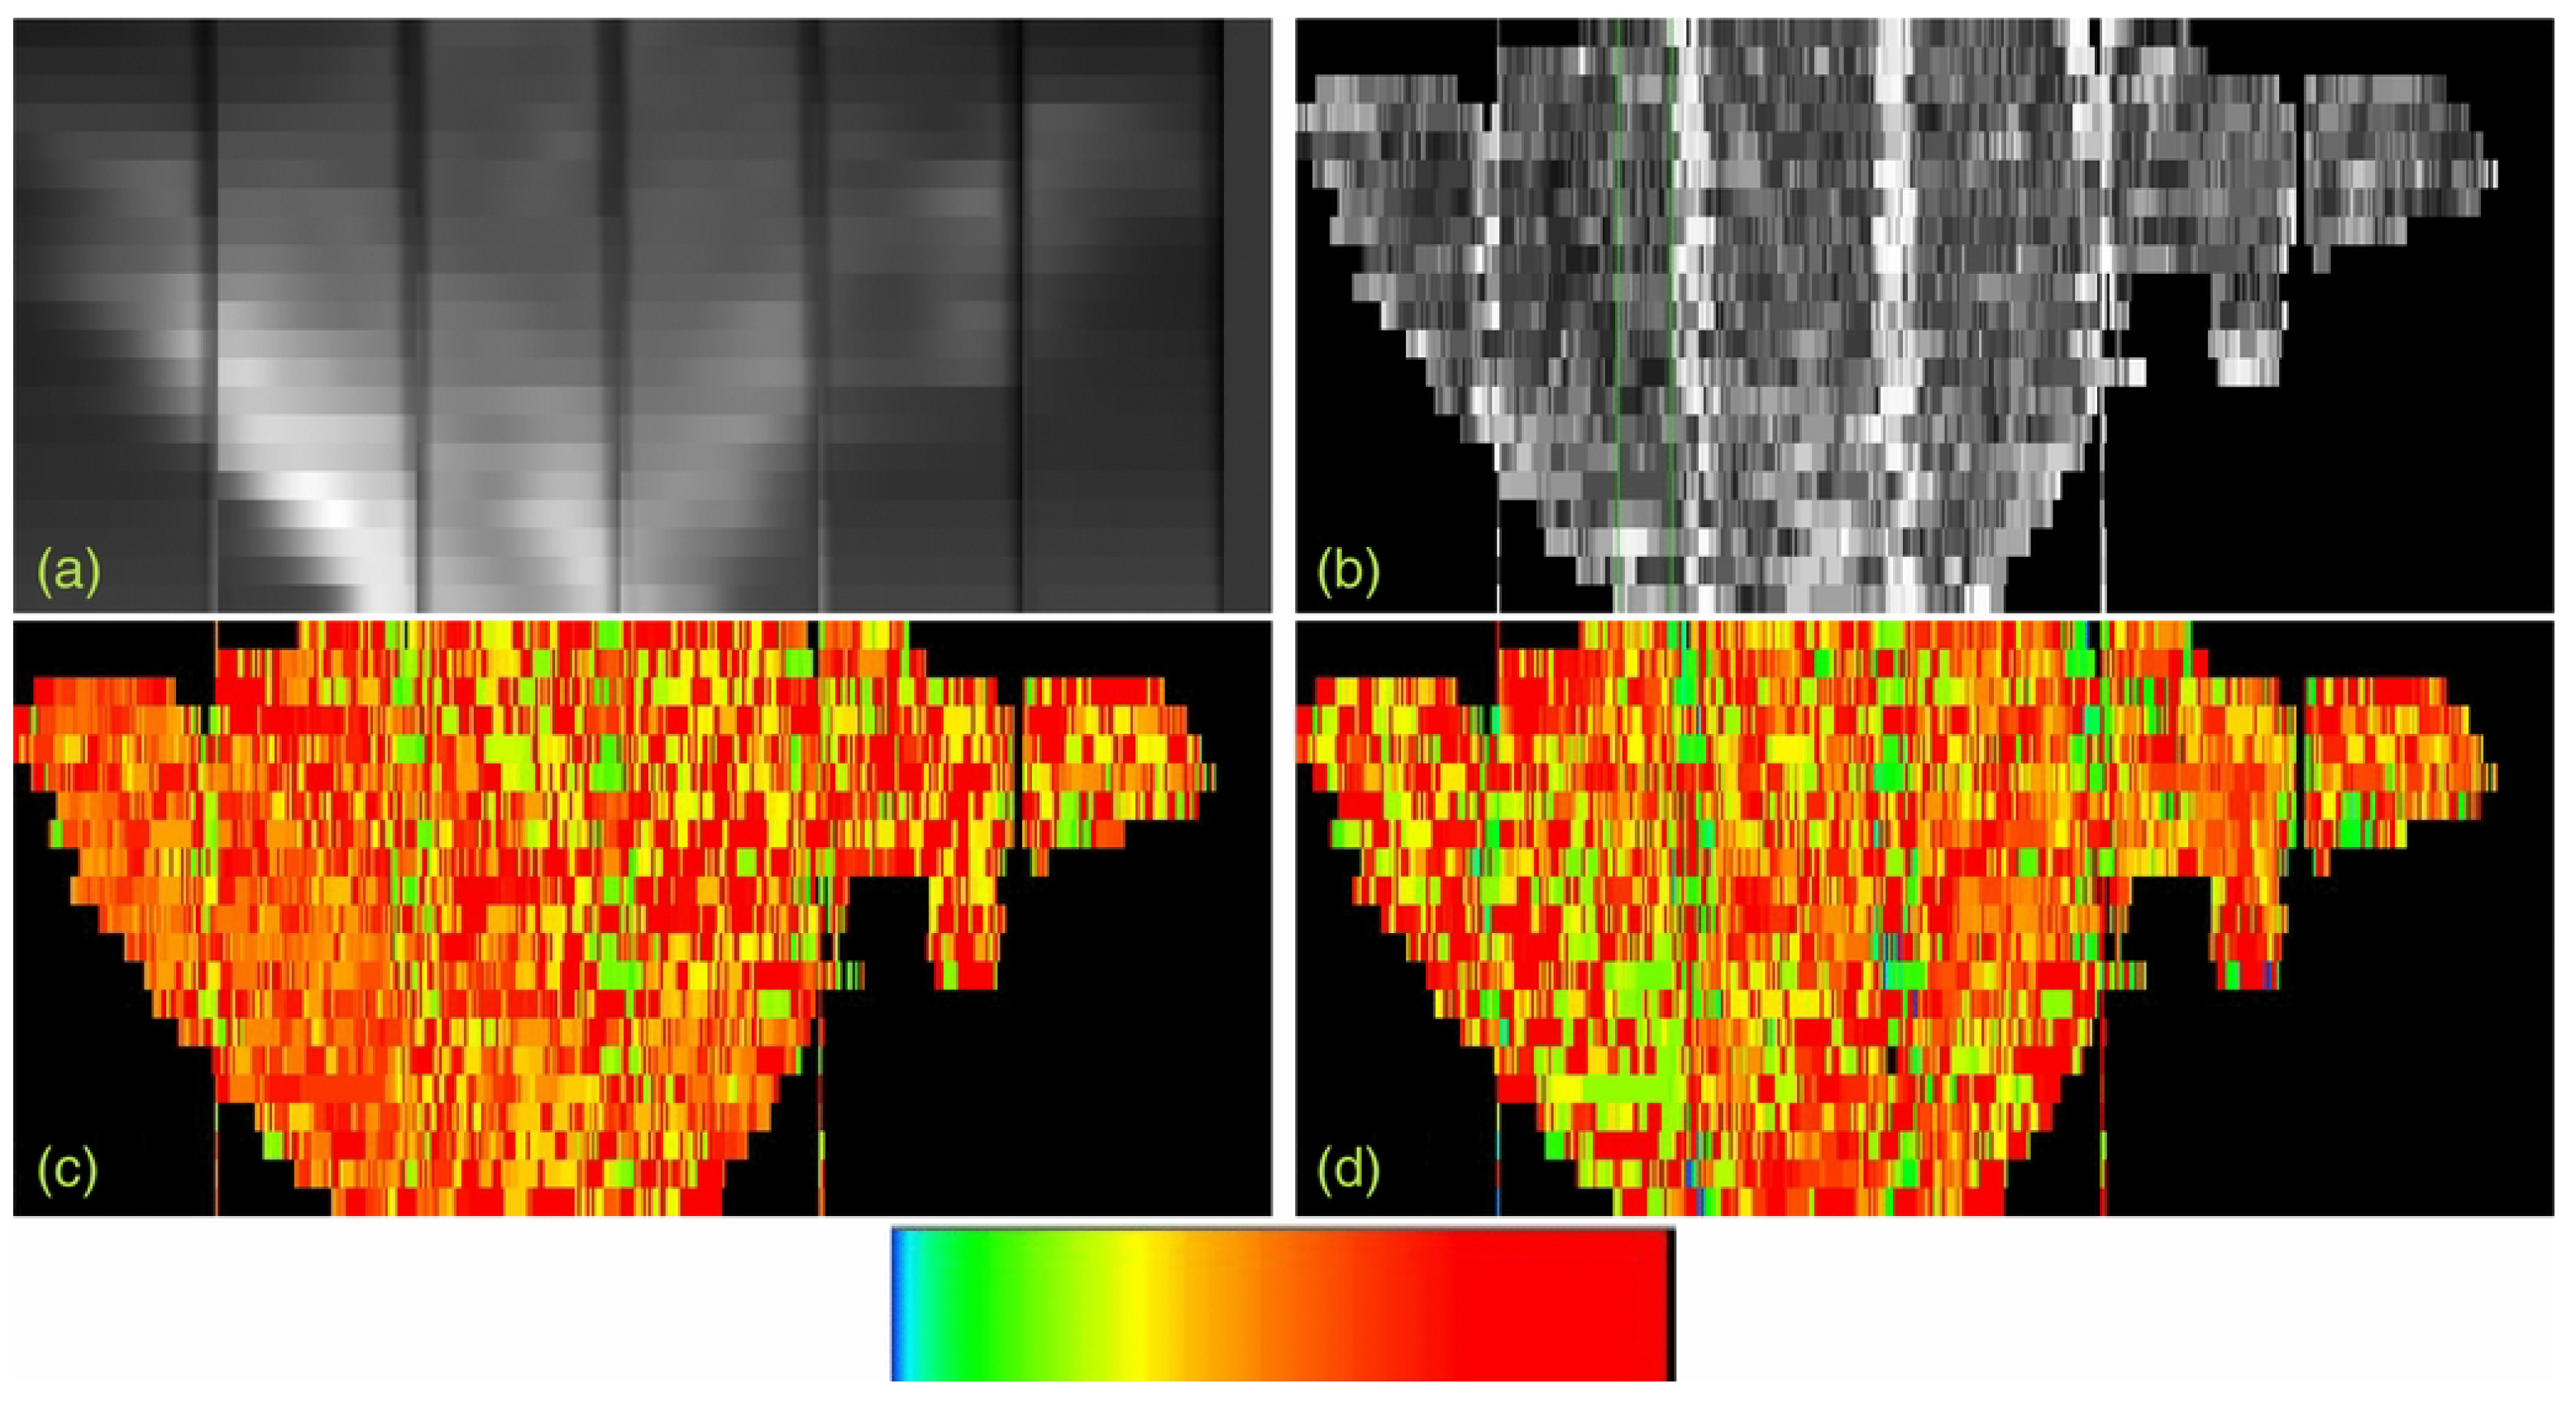
Figure 4 presents the maps obtained after the inversion of the Stokes parameters recorded in the He D3 line: intensity, magnetic field strength, inclination, and azimuth. The origin of the magnetic field’s inclination is the local vertical, and the origin of the azimuth is the LOS in a plane containing the LOS and the local vertical.
We see that the brightest parts of the prominence have a mean inclination of 90°, which means that the magnetic field in the brightest oblique structure is clearly horizontal. However, there is a large dispersion of the values (±30°) from one pixel to the next in the lateral parts of the prominence. The field strength is in the range of 5–15 G.
Finally, the azimuth is close to 90° has once more a large dispersion (±50°). This means that the magnetic field vector is mainly perpendicular to the plane of the sky with a large dispersion of values. However the dispersion of the values of the inclination and the azimuth could be due to the foreground transient structures of the large arch seen in the front of the prominence in AIA/304 Å. The brightest part of the prominence where the magnetic field is directed horizontally is located mainly within a foot of the prominence. This confirms some previous results [18,52]. Within the prominence feet observed on the disk, it was found that the field lines are tangent to the photosphere [44,53]. Their shapes have been reliably represented by linear force-free field extrapolations [48,54,55].
Other studies of prominences have been performed with THEMIS/MTR and using either the techniques of PCA or based directly on the Hanle effect diagrams. Ariste [56] studied the inclination of the magnetic fields for 58 prominences observed in He D3 with THEMIS. The distribution of magnetic field inclinations has three characteristic peaks at roughly 60°, 90°, and 120° with respect to the local vertical. Horizontal fields cluster around 90°, while the two other peaks represent non-horizontal fields. However, the error computation indicates that these two peaks have very large errors. Inclined fields are present and must be important in the dynamics of prominences.
During the multi-spacecraft-THEMIS coordinated campaigns from 2014 to 2016, the prominence program was used once more. Levens et al. [46] observed a tornado and concluded on the horizontality of the magnetic field in the column-tornado. After a review of all the papers on tornadoes detected by spectroscopy or MHD models, Gunár et al. [57] concluded that it is an illusion to see tornado-prominence observed at the limb. This is mainly due to the perspective effects and fast movements of Hinode/SOT and SDO/AIA [58]. Levens et al. [59] provided a discussion in another paper about the bubbles and plumes detected by Berger with Hinode/SOT [60], and concluded that the existence of bubbles is due to the magnetic field and not the hot temperature inside the bubbles like ordinary convection. A model by Dudík et al. [55] with separatrices surrounding parasitic polarities in the filament channel was proposed to explain bubble formation.

3.5. Plasma Threads in Prominence

Among all prominence studies, an important remark about the measurement of magnetic field in prominences has to be made. The observations need a long exposure time; they are obtained with limited spatial resolution due to the fact that adaptive optics cannot be used by ground-based telescopes like THEMIS and SST. In space, it has not been possible to observe the polarimetry of prominences up to now. Therefore, we should be very careful in the interpretation of the results.
It is clear that prominences contain different threads, which are obviously not resolved. Using Dopplershift maps, it has been shown that quiescent prominences are formed by multi-threads with counter-streaming [40,61]. The cross section of the fine threads is found to be progressively smaller, as we use instruments with increasingly higher spatial resolution, actually reaching less than one arcsec.
A new idea has been tested which consists of the existence of a possible kind of turbulence inside the plasma of flux rope as suggested by Schmieder et al. [50]. They analyzed the polarimetric observations of THEMIS again, joined with IRIS observations. IRIS detected fine threads with velocities up to 70 km/s and counterstreaming. The classical turbulence would have led to Stokes parameters U and V equal to zero. This kind of turbulence was rejected. However, tests have been made by introducing a turbulent field on the Stokes Q parameter mixed with a macroscopic magnetic field component weighted by a filling factor; this makes it possible to obtain similar profiles to the observed profiles. In this picture, the prominence would be made up of an organized horizontal and relatively weak magnetic field supporting the densest cores of the plasma, plus some other regions with stronger horizontal fields in addition to a turbulent field responsible for most of the rapid dynamics of the plasma.
In some thermodynamics studies, it appears that the magnetic field can be neglected in prominences, for example, with the Rayleigh–Taylor instability in prominence plumes. In a hedgerow prominence, which looks to be in the plane of the sky like a hanging, the inclination was constant and did not depend on the magnetic field; they concluded that condensation could occur without considering the magnetic field [45].
All these works contribute in showing that, on a micro-scale, the magnetic field could be less important. Schmieder et al. [50] have shown that many of the measured magnetic fields may actually correspond to unresolved fields made of a macroscopic horizontal field plus an unresolved turbulent field. The addition of both fields could explain the observed profiles, although it has yet to be demonstrated that such model is robust for inversion Schmieder et al. [50]. New MHD models for prominences have been developed and are encouraging in this direction [62,63].

4. THEMIS After 2019

4.1. New Generation Instrument

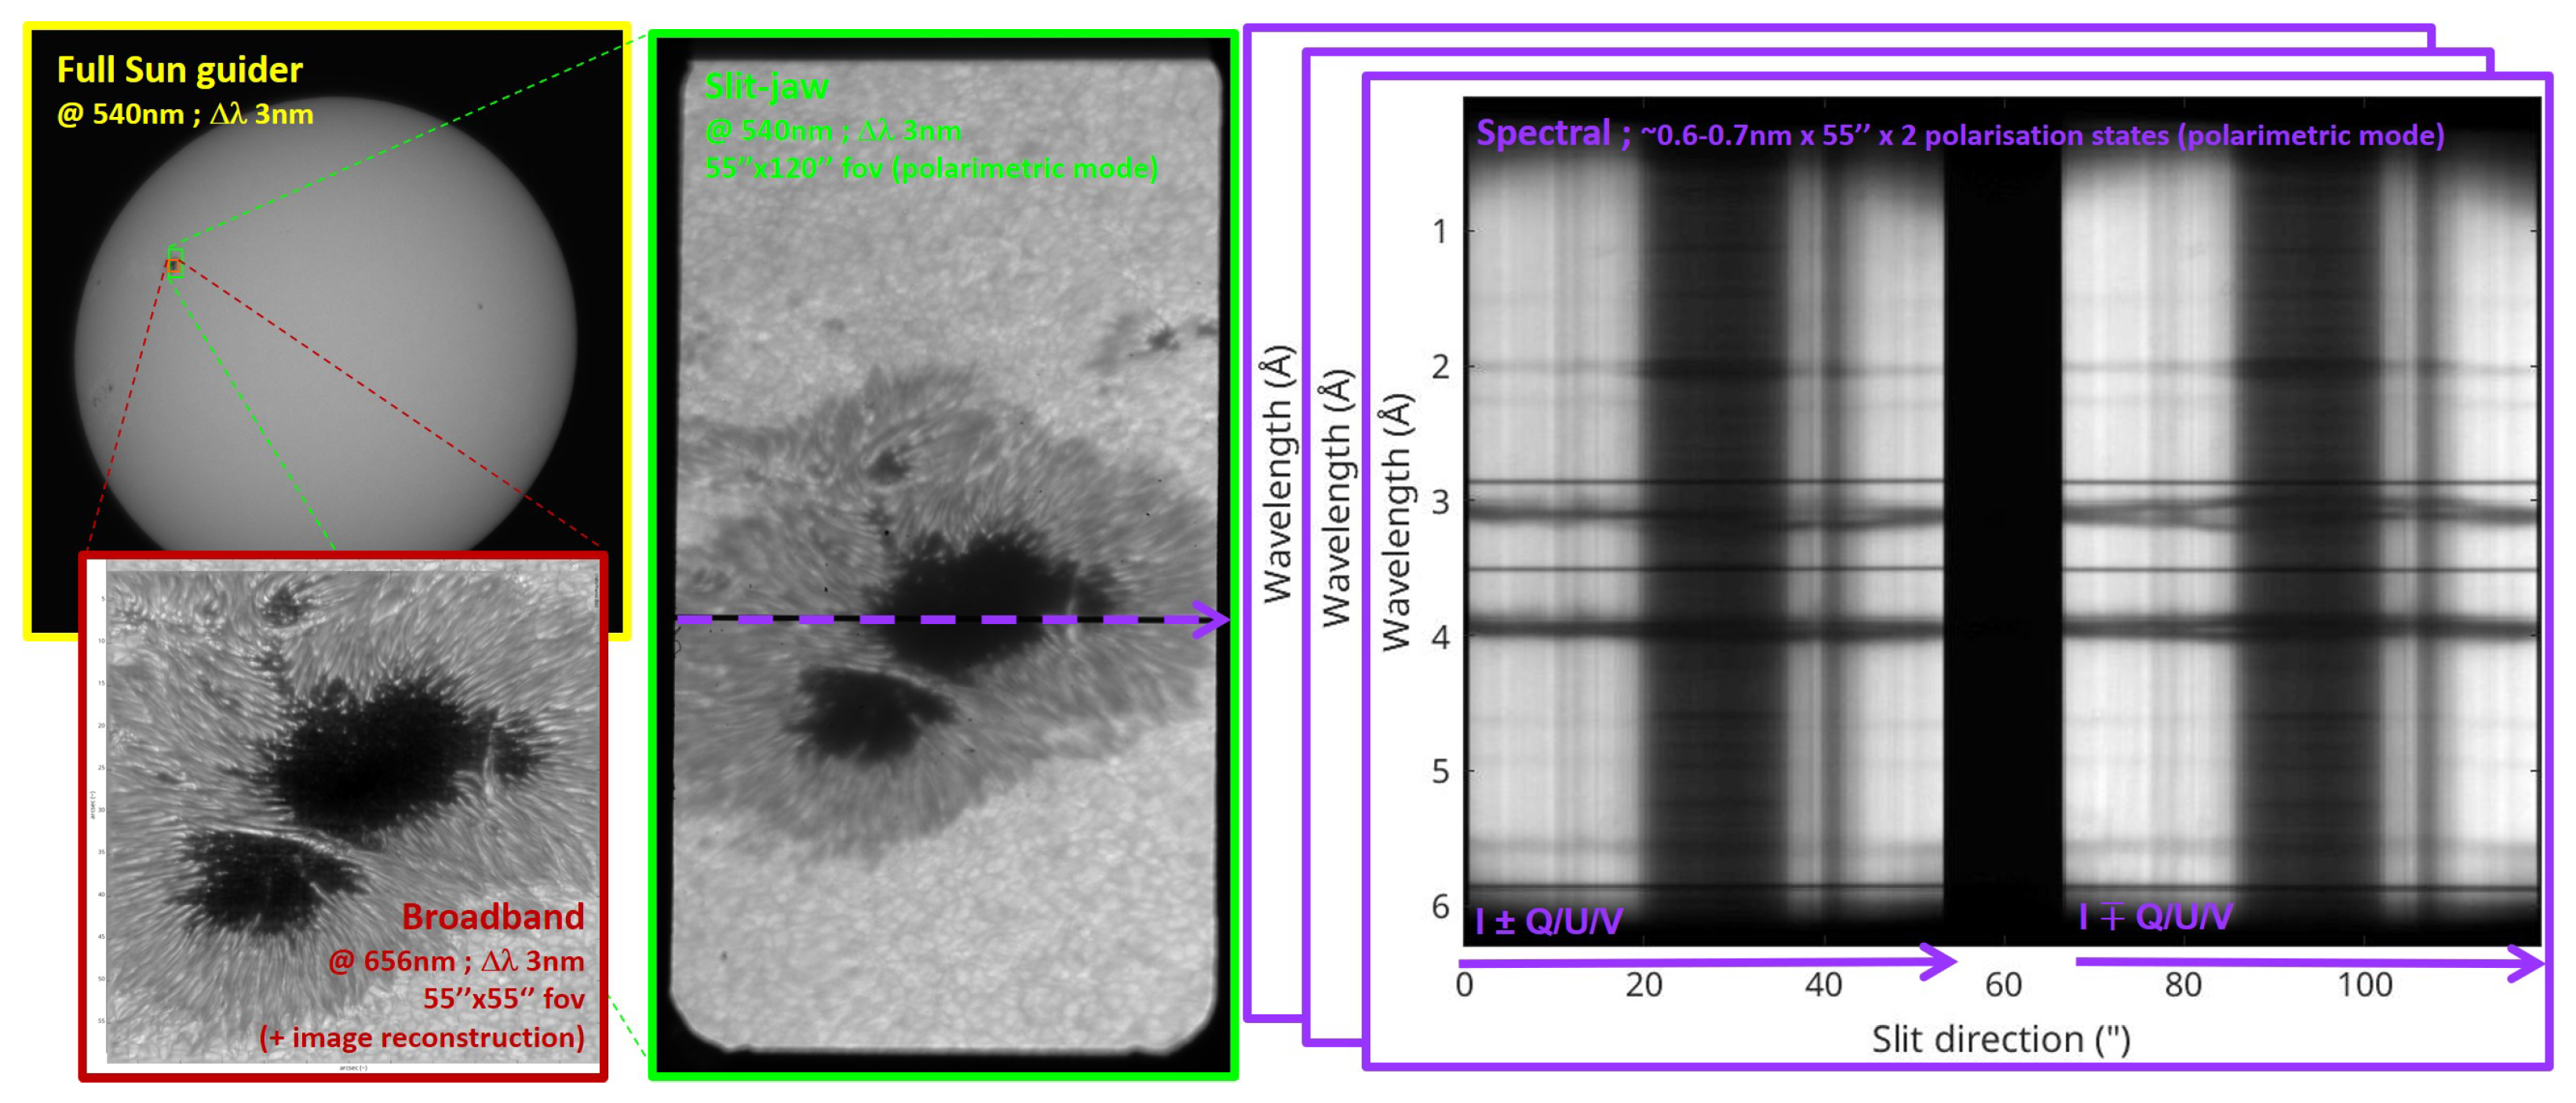
In 2016 it was decided to perform a general overhaul and modernization of the telescope optical system in order to allow for the installation of an adaptive optics and improve, if possible, the polarimetric quality (Gelly et al. [64]). From 2017 to 2019, the optical train was redesigned and changed from (and including) the secondary mirror down to the spectrograph entrance. Novel optical solutions were introduced to enhance the polarization neutrality of the elevation axis path and of the field de-rotator. The new elevation axis is made of 4 × 22.5 ° mirrors (instead of 2 × 45 ° ), and the derotator is an innovative design made from 2 Crova prisms and one flat mirror, whose Mueller matrices compensate each other. The prime focus dual beam polarimetric analysis has been kept, but the two analyzed beams are now optically superimposed, and the full 2 × 2 (non-polarimetric) (or 1 × 1 (polarimetric) field is always available without further limits. The net result is a much brighter telescope which is also very much “polarization friendly”, with a total Mueller matrix almost essentially diagonal and pretty constant along the day. The superimposition of the two analyzed beams is actually accurate down to the telescope PSF dimension, and this allows the installation of a classic “single deformable mirror” adaptive optics that performs well [65]. An example of all the capacities of THEMIS is shown in Figure 5.
After the COVID-19 period, the telescope could be re-opened to observers, and the first campaigns took place in 2022.
The THEMIS adaptive optics (TAO) [65] demonstrated that it is performing very well on the solar disk and can work over granulation starting with seeing of r 0 = 4 cm (Figure 6). TAO cannot currently lock on off-disk targets like prominences, but a provision exists to offset the TAO FOV to the solar limb when observing prominences; however, this has not yet been implemented. Use of TAO allows obtaining high-resolution data in spectropolarimetry and when scanning the solar field across the spectrograph slit. The new polarimetric analysis was first calibrated in the lab in winter 2023 and then on the telescope in spring 2024, finally becoming available to observers starting fall 2024.
During August 2023, a large wildfire on the mountain in Tenerife endangered the telescope for many hours, reaching a few meters from the building (Figure 7). Thanks to the presence and action of firemen from the Tenerife Cabildo Insular and Spanish UME, the telescope could survive unharmed.
As of March 2025, THEMIS can be used in the simultaneous imaging and spectroscopic modes (BBI + nopolar MTR2) of simultaneous imaging and spectropolarimetric modes (BBI + MTR2). TAO is available for on-disk targets in unstable mode from r 0 = 4 cm and in stable (unlimited duration) mode from r 0 = 7 cm. Field scanning over 80 arcsec (TAO compatible) is also available. Spectra can currently be acquired either using recent scientific CMOS cameras (2 k × 2 k) and/or three older EMCCD cameras (512 × 512), with a maximum of five spectral ranges allowed. Yearly campaigns are being organized and observing time is open to the French and Spanish communities by right, and to the international community through the CCI international time allocation mechanism.

4.2. Spectroscopy and Imaging

4.2.1. Imaging

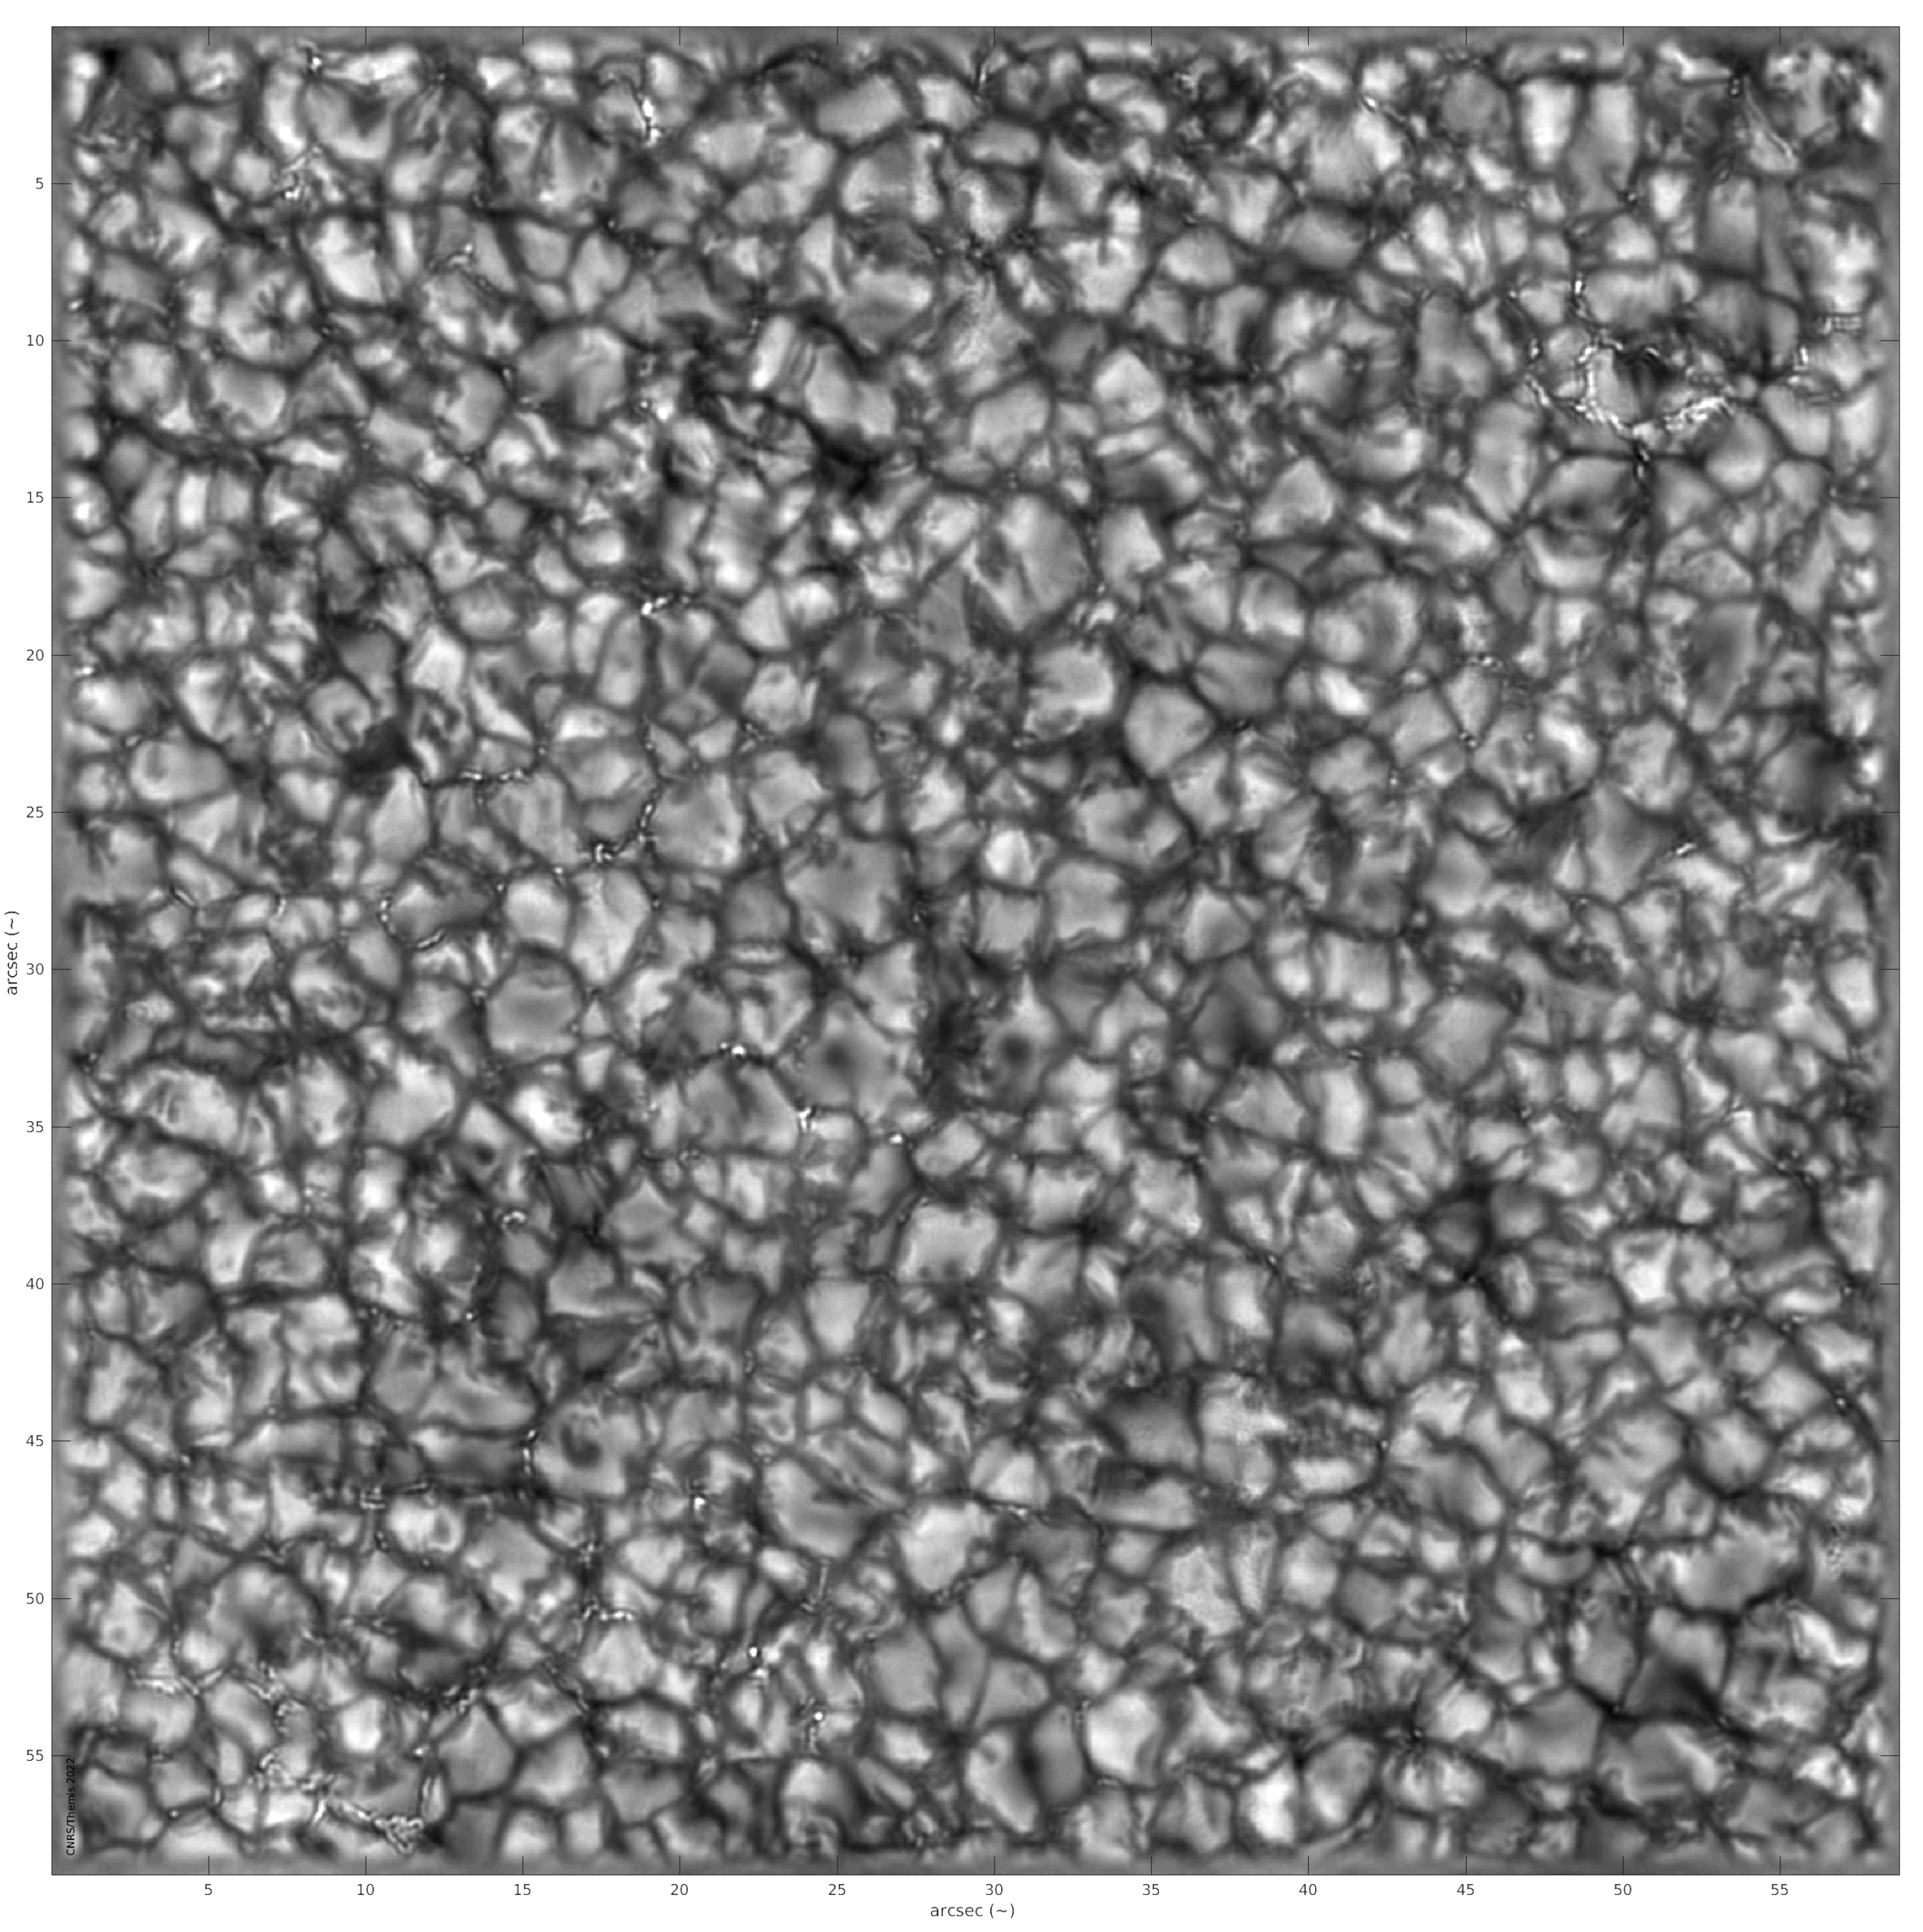
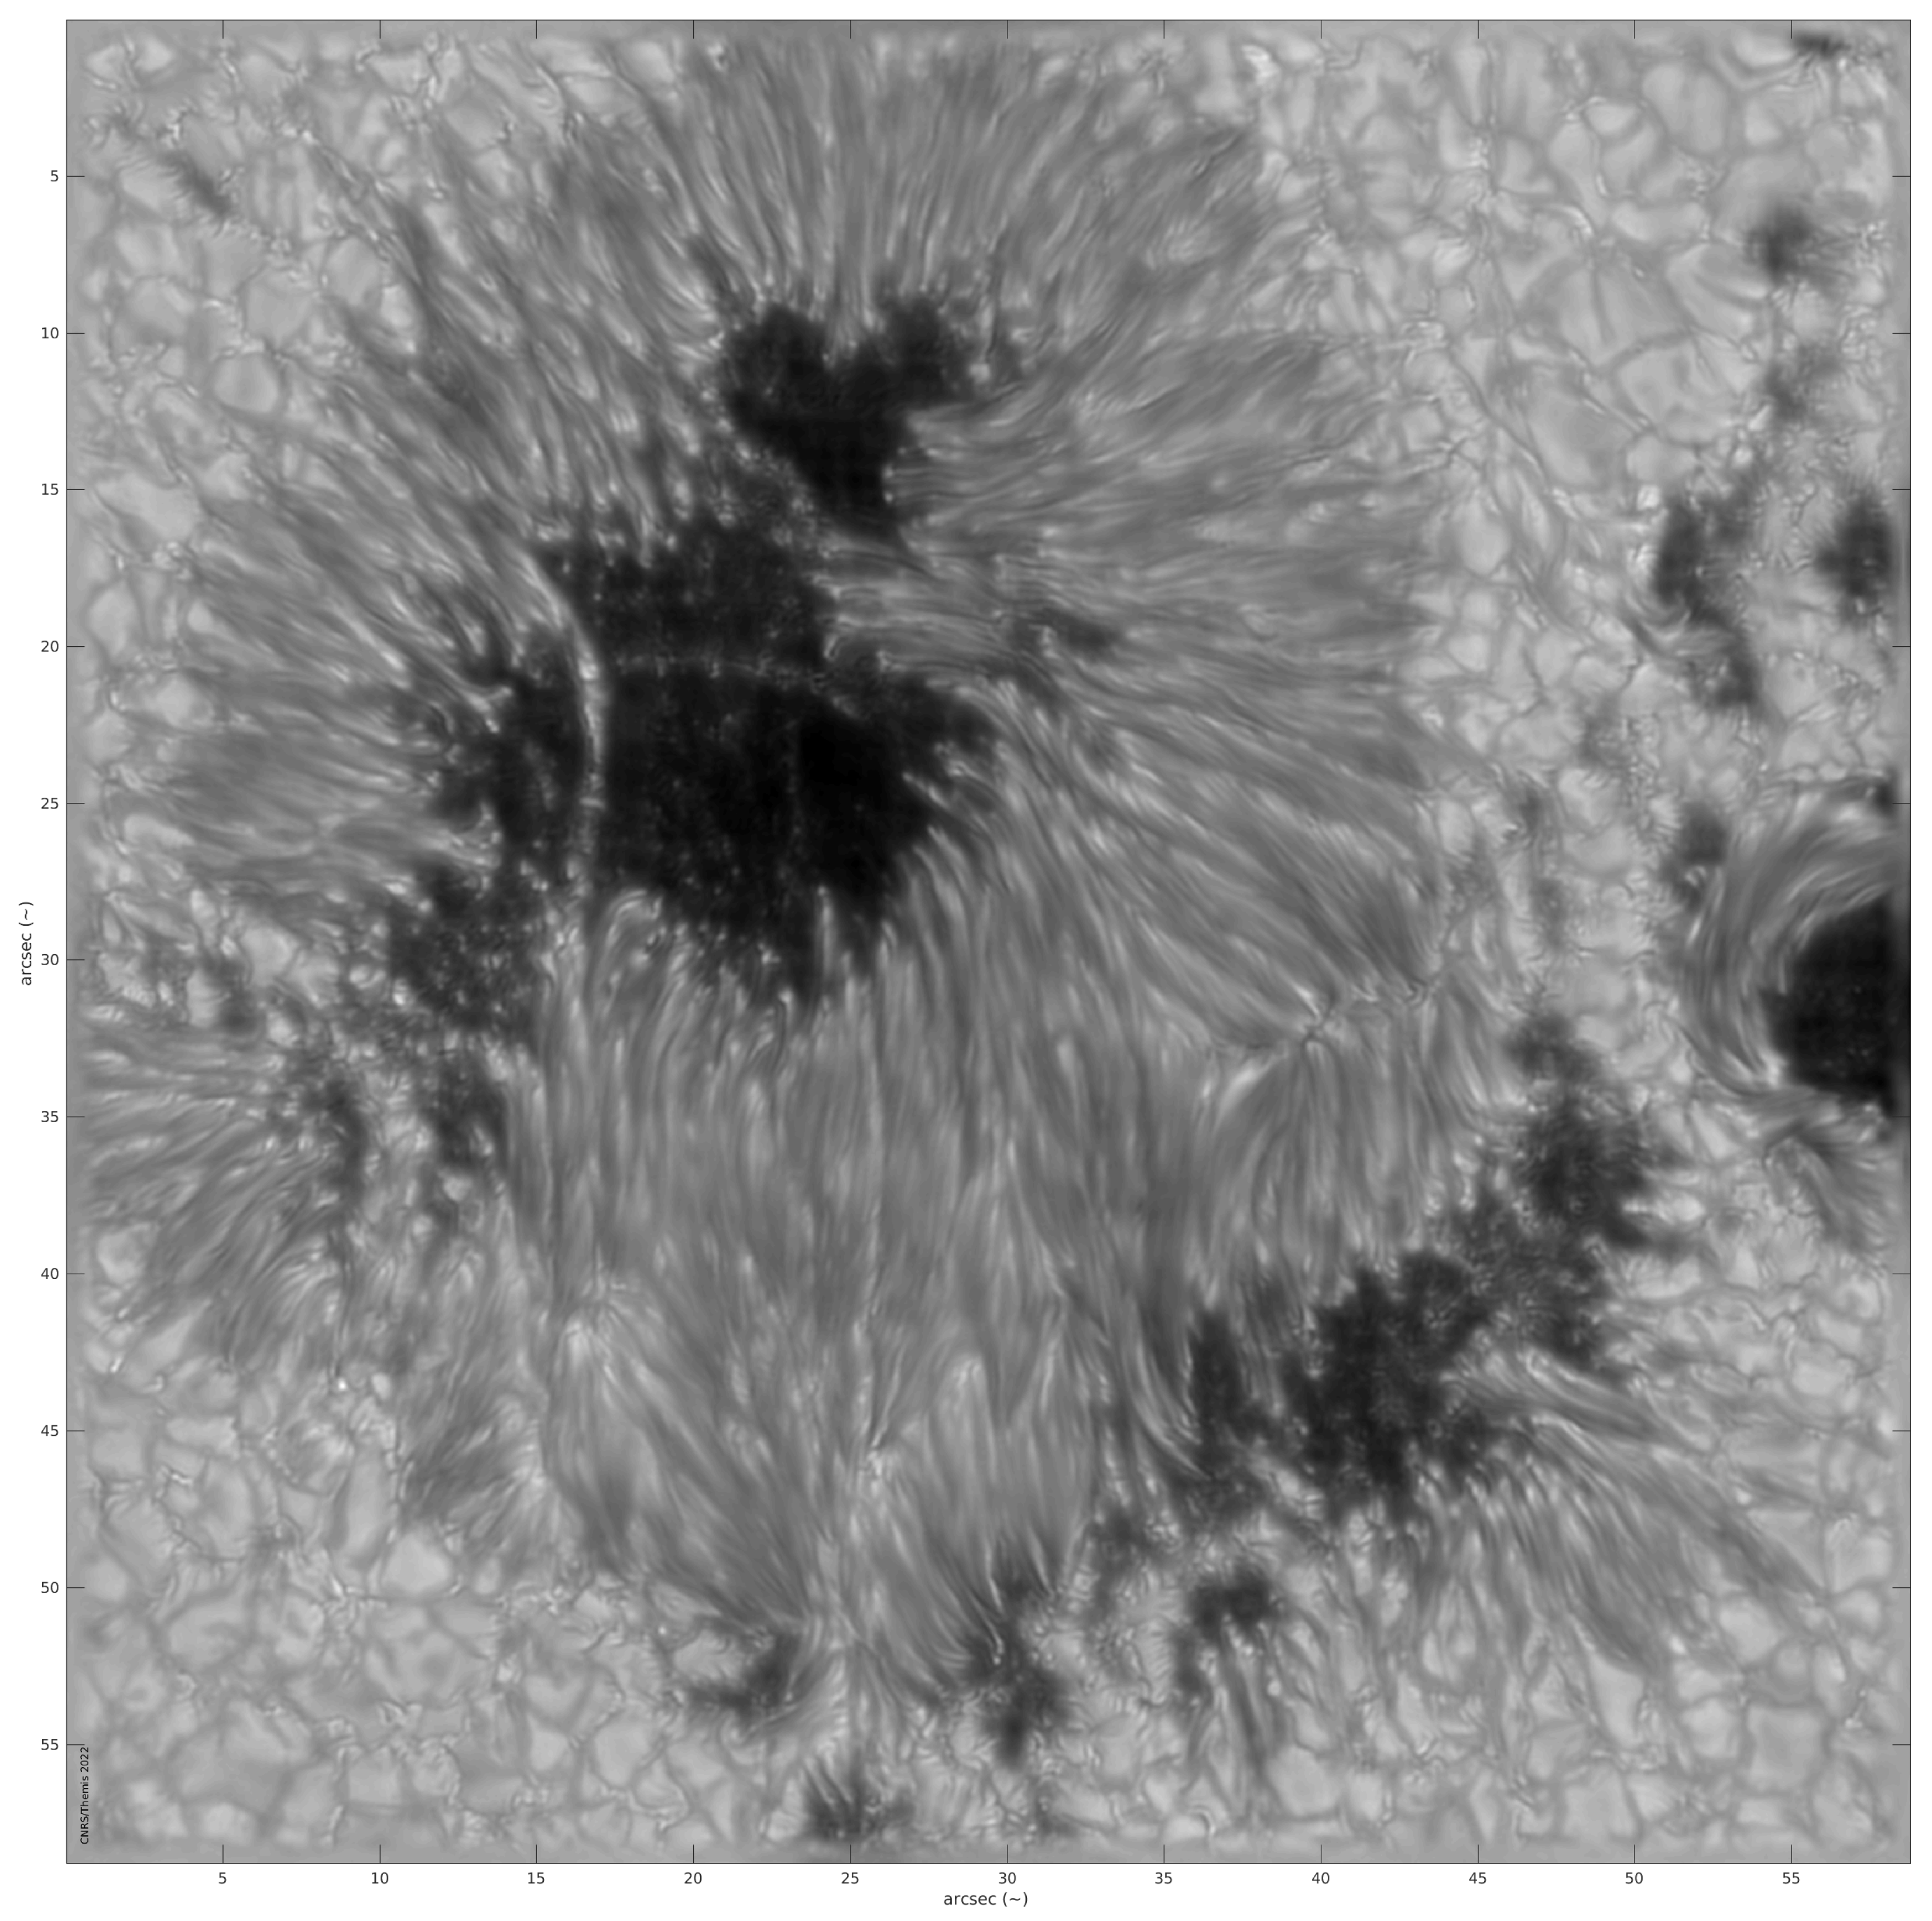
The first images with the new generation instrument were obtained in 2019 without TAO (TAO operation first started in December 2020). TAO corrected images are now routinely obtained, and the beam is distributed to both the spectrograph and an imaging branch through a 80–20 beamsplitter. The imaging branch is fitted with a red filter centered in the continuum at 656 Å with a bandwidth of 30 Å, and a broadband camera (BBI) Andor Zyla sCMOS 2 k × 2 k. The red filter can be easily changed to any other wavelength. We report here images of granulation and sunspot obtained in 2022 at a high spatial resolution (camera pixel of 0.0275 arcsec) (Figure 6 and Figure 8).
Those images are the results of 100 acquired snapshots processed with a Knox Thompson image reconstruction method. Using this setup, Roudier et al. [66] show results on exploding granules in the photosphere obtained with this new set-up of THEMIS. They observed the granulation at the disk center at λ = 6500 Å. The temporal evolution of the mean expansion velocity that they observed is consistent with the physical evolution of a granule proposed by the theory. The granule explodes with a vertical velocity in a first phase; then, the area of the granule decreases and plumes with downflows appear. The excess pressure of the exploding granule decelerates the upflow, reduces the energy transport to the surface, and changes the evolution of the horizontal flow of neighbor granules. Such energetic convective elements clearly influence the properties of the photosphere during network formation. A sub-surface flow study in the photosphere could help to detect the emergence of magnetic flux before its appearance in magnetograms.

4.2.2. Spectroscopy

In 2023, the THEMIS polarimeter was not yet operational, and MTR2 observed four lines in spectroscopy alone (H α , H β , He D3, and Fe 6302 Å). Different programs were performed, particularly on jets [67], on counter-streaming flows in filaments (Karki in preparation), and on tornado-prominence (Peat in preparation).
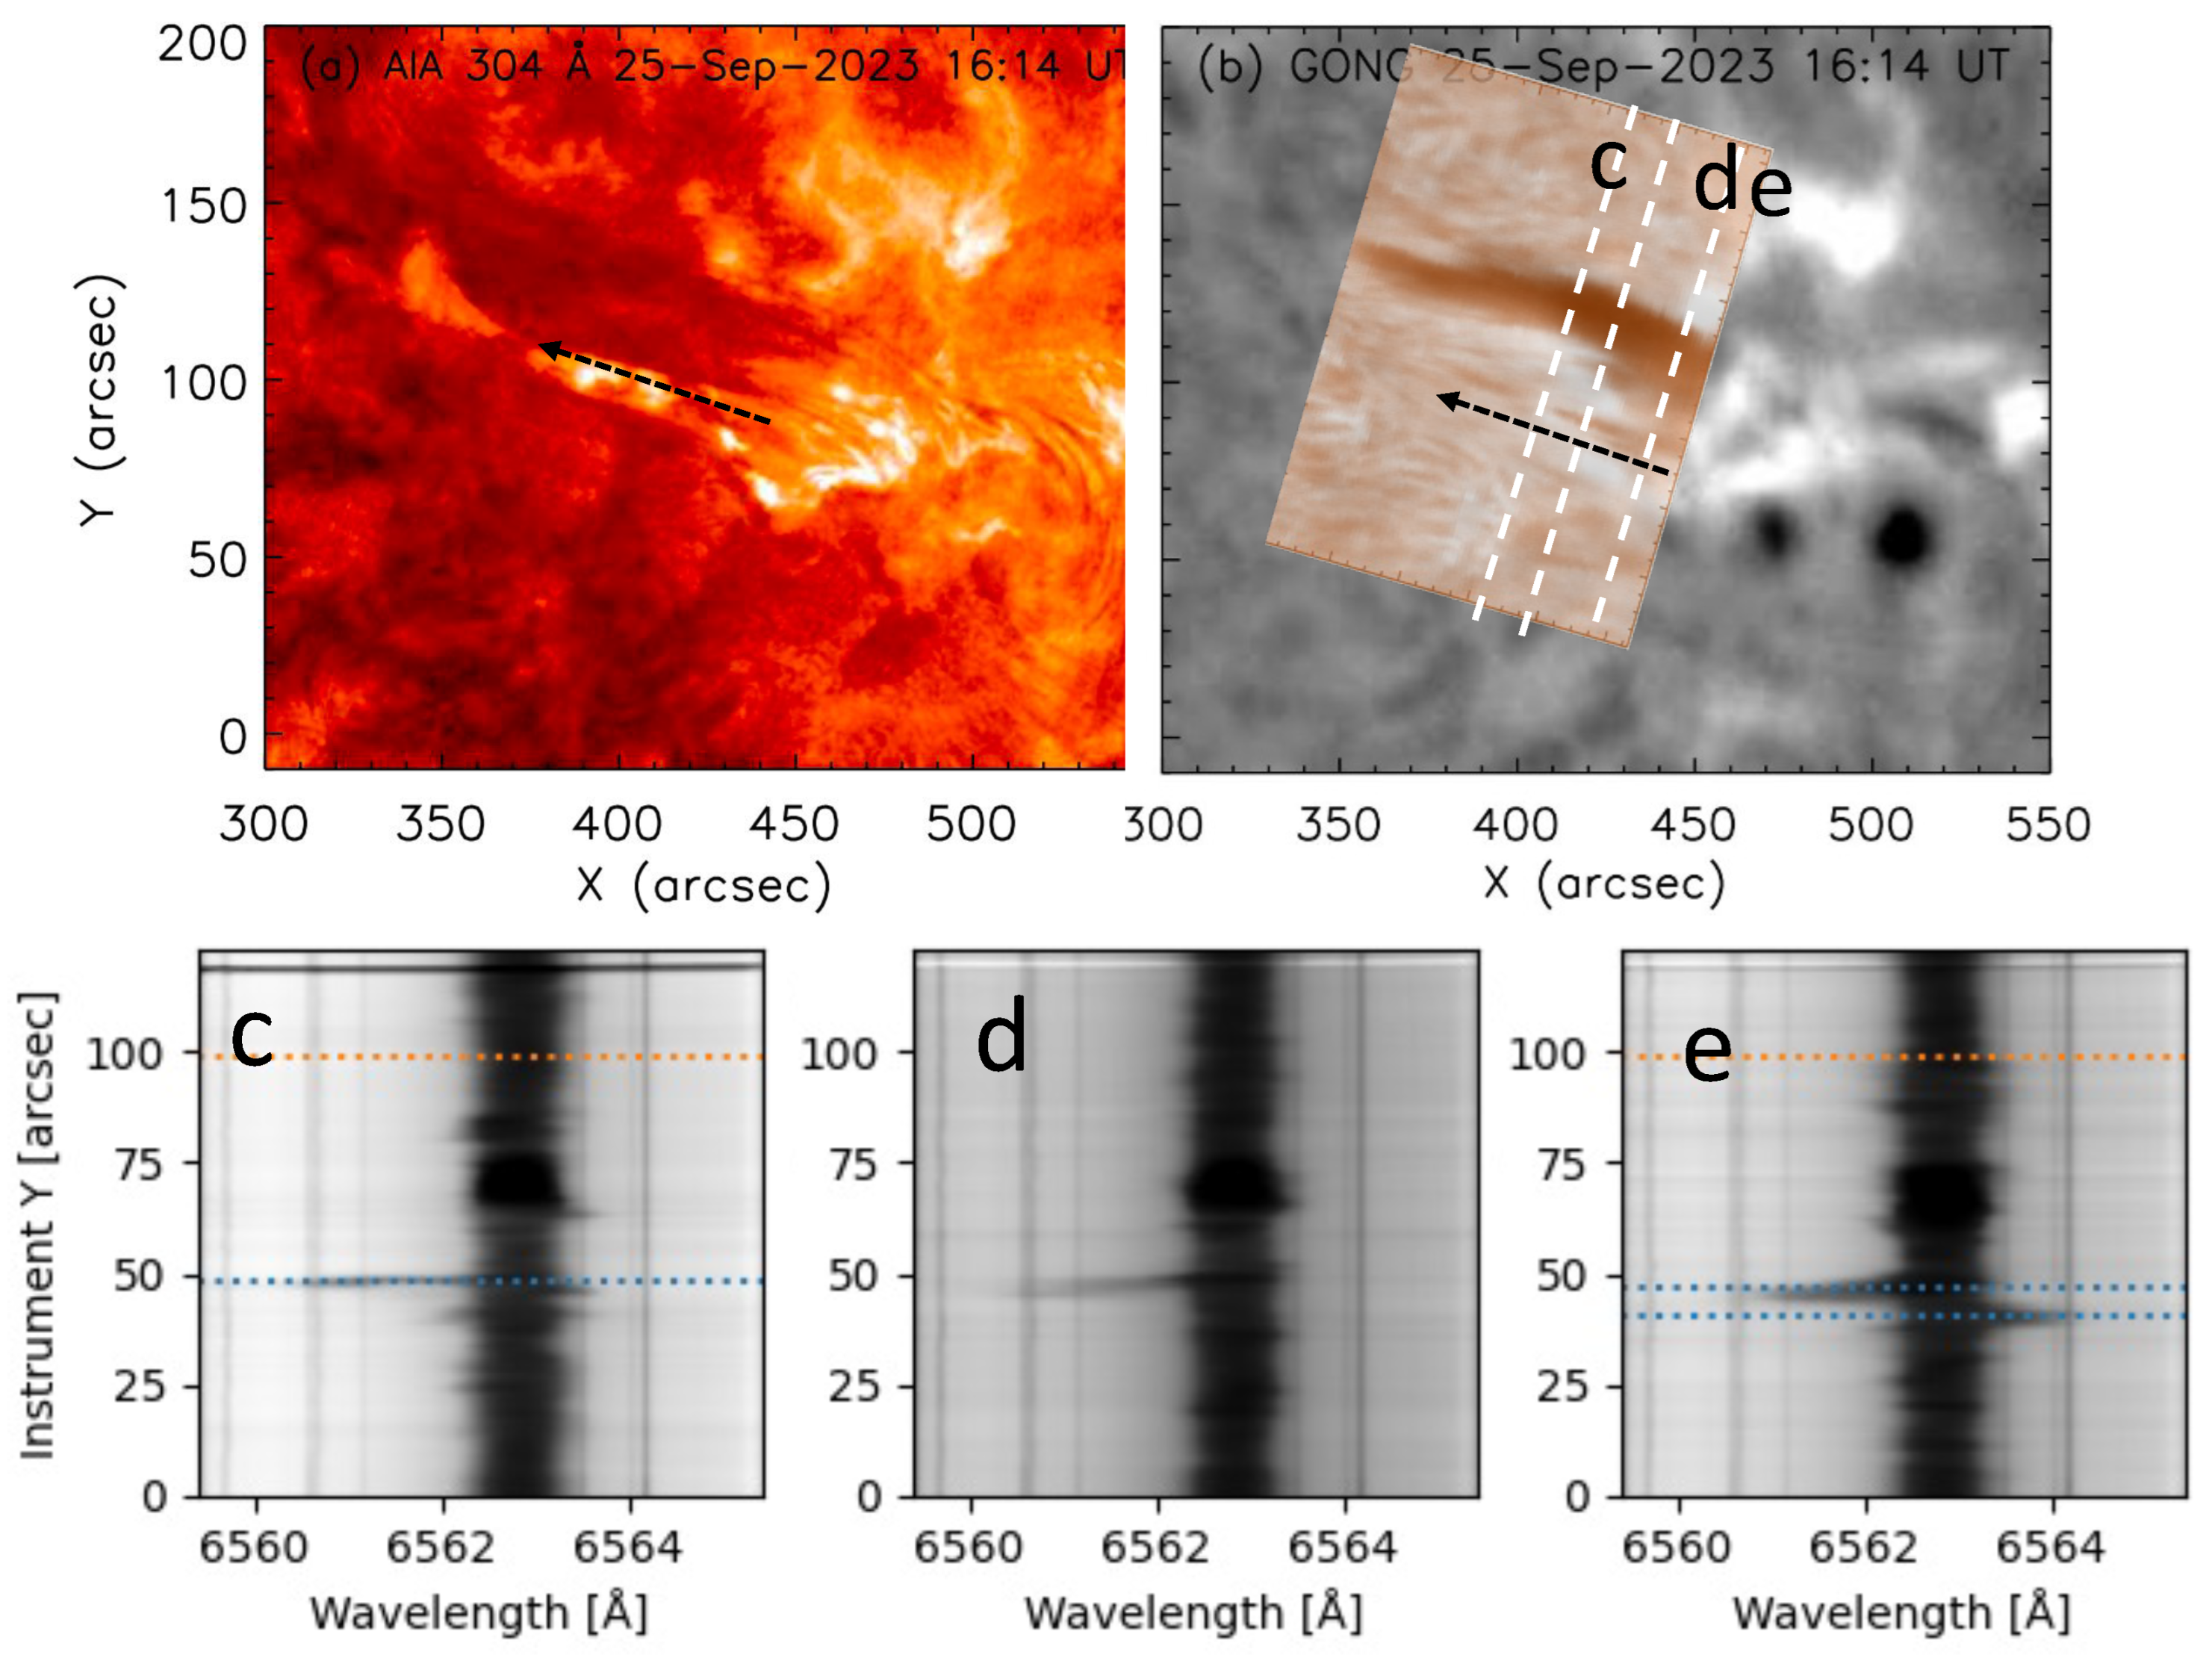
During an international campaign in September 2023, a fast jet in H α was observed in the vicinity of a filament (Figure 9) [67].
H α spectra were recorded on a large 2 k × 2 k camera. The pixel resolution along the slit was 0.0613 arcsec. The slit width is 0.5 arcsec and the stepping was 1 arcsec. The spectral dispersion was ∼3.076 mÅ per pixel. The bandpass was 6.3 Å around 6563 Å. The exposure time for H α range was 0.2 s. The multi-wavelength study of the interaction of filaments and jets allowed them to focus on one jet observed by SDO/AIA with plasma reaching a projected velocity of 100–180 km s−1 in the plane of the sky. Its origin is supposed to be related to flux cancellation at the edge of the active region. The high spatial resolution of THEMIS allows us to detect an enhancement absorption in the far blue wing of H α corresponding to Doppler shifts of around 140 km s−1 in a very narrow zone for a short time <1 min (Figure 9). This reconnection jet is perpendicular to the jet in the plane of the sky and corresponds to a bright point visible in AIA hot filters centered on a bandpass containing a line which forms at one million K degrees. They conjectured that this reconnection jet was due to an interchange of magnetic field lines between the filament channel and the AIA jet, leading to cold plasmoid ejections perpendicular to the jet trajectory.

4.3. Polarimeter

MTR2 in spectropolarimetry mode can currently output on up to five cameras (hence five wavelengths) at most, but only three cameras can be set up in polarimetric configuration. Nevertheless, it is possible to combine polarimetric and non-polarimetric cameras. Right now, it is the only instrument that works in spectropolarimetry; in September 2025, IBIS will be installed.
The THEMIS polarimetric analysis scheme is based on a new full-Stokes analyzer (An4) located at the F1 prime focus, designed to deliver dual-beam polarimetry with beam exchange. An4 is made of two rotating quarter-wave plates (QW) followed by a double Savart plate, with the second plate that counteracts the first plate splitting of the beam. For any solar polarization state input S i = ( I , Q , U , V ) , the output of the QW modulation is one of the following vectors S o Q = ( I , Q , U , V ) , S o U = ( I , U , Q , V ) or S o V = ( I , V , Q , U ) , depending on the state being analyzed. Then, it is straightforward to filter out the two first components in this output with a linear polarizer, or better yet, with a Savart plate that would generate the dual beam feature and recover two times more light. In our case, we use a double Savart that actually generates the dual beam and also superimposes both beams so that they appear as only one. The net result is that the output of the An4 is the encoding of two complementary Stokes states + S and S as two superimposed images linearly polarized at 90° to one another. Thanks to the THEMIS “polarization friendly” new optical scheme, this output can travel through the telescope and arrive minimally perturbed on the spectrograph cameras. Just in front of the cameras, a Wollaston prism splitter (one per camera) separates the single beam into complementary Stokes components to form the spectral focal plane.
A few examples are presented in the THEMIS website obtained in January, February, and March 2025 during testing programs https://www.themis.iac.es/doku.php?id=observation:data (accessed on 26 April 2025).
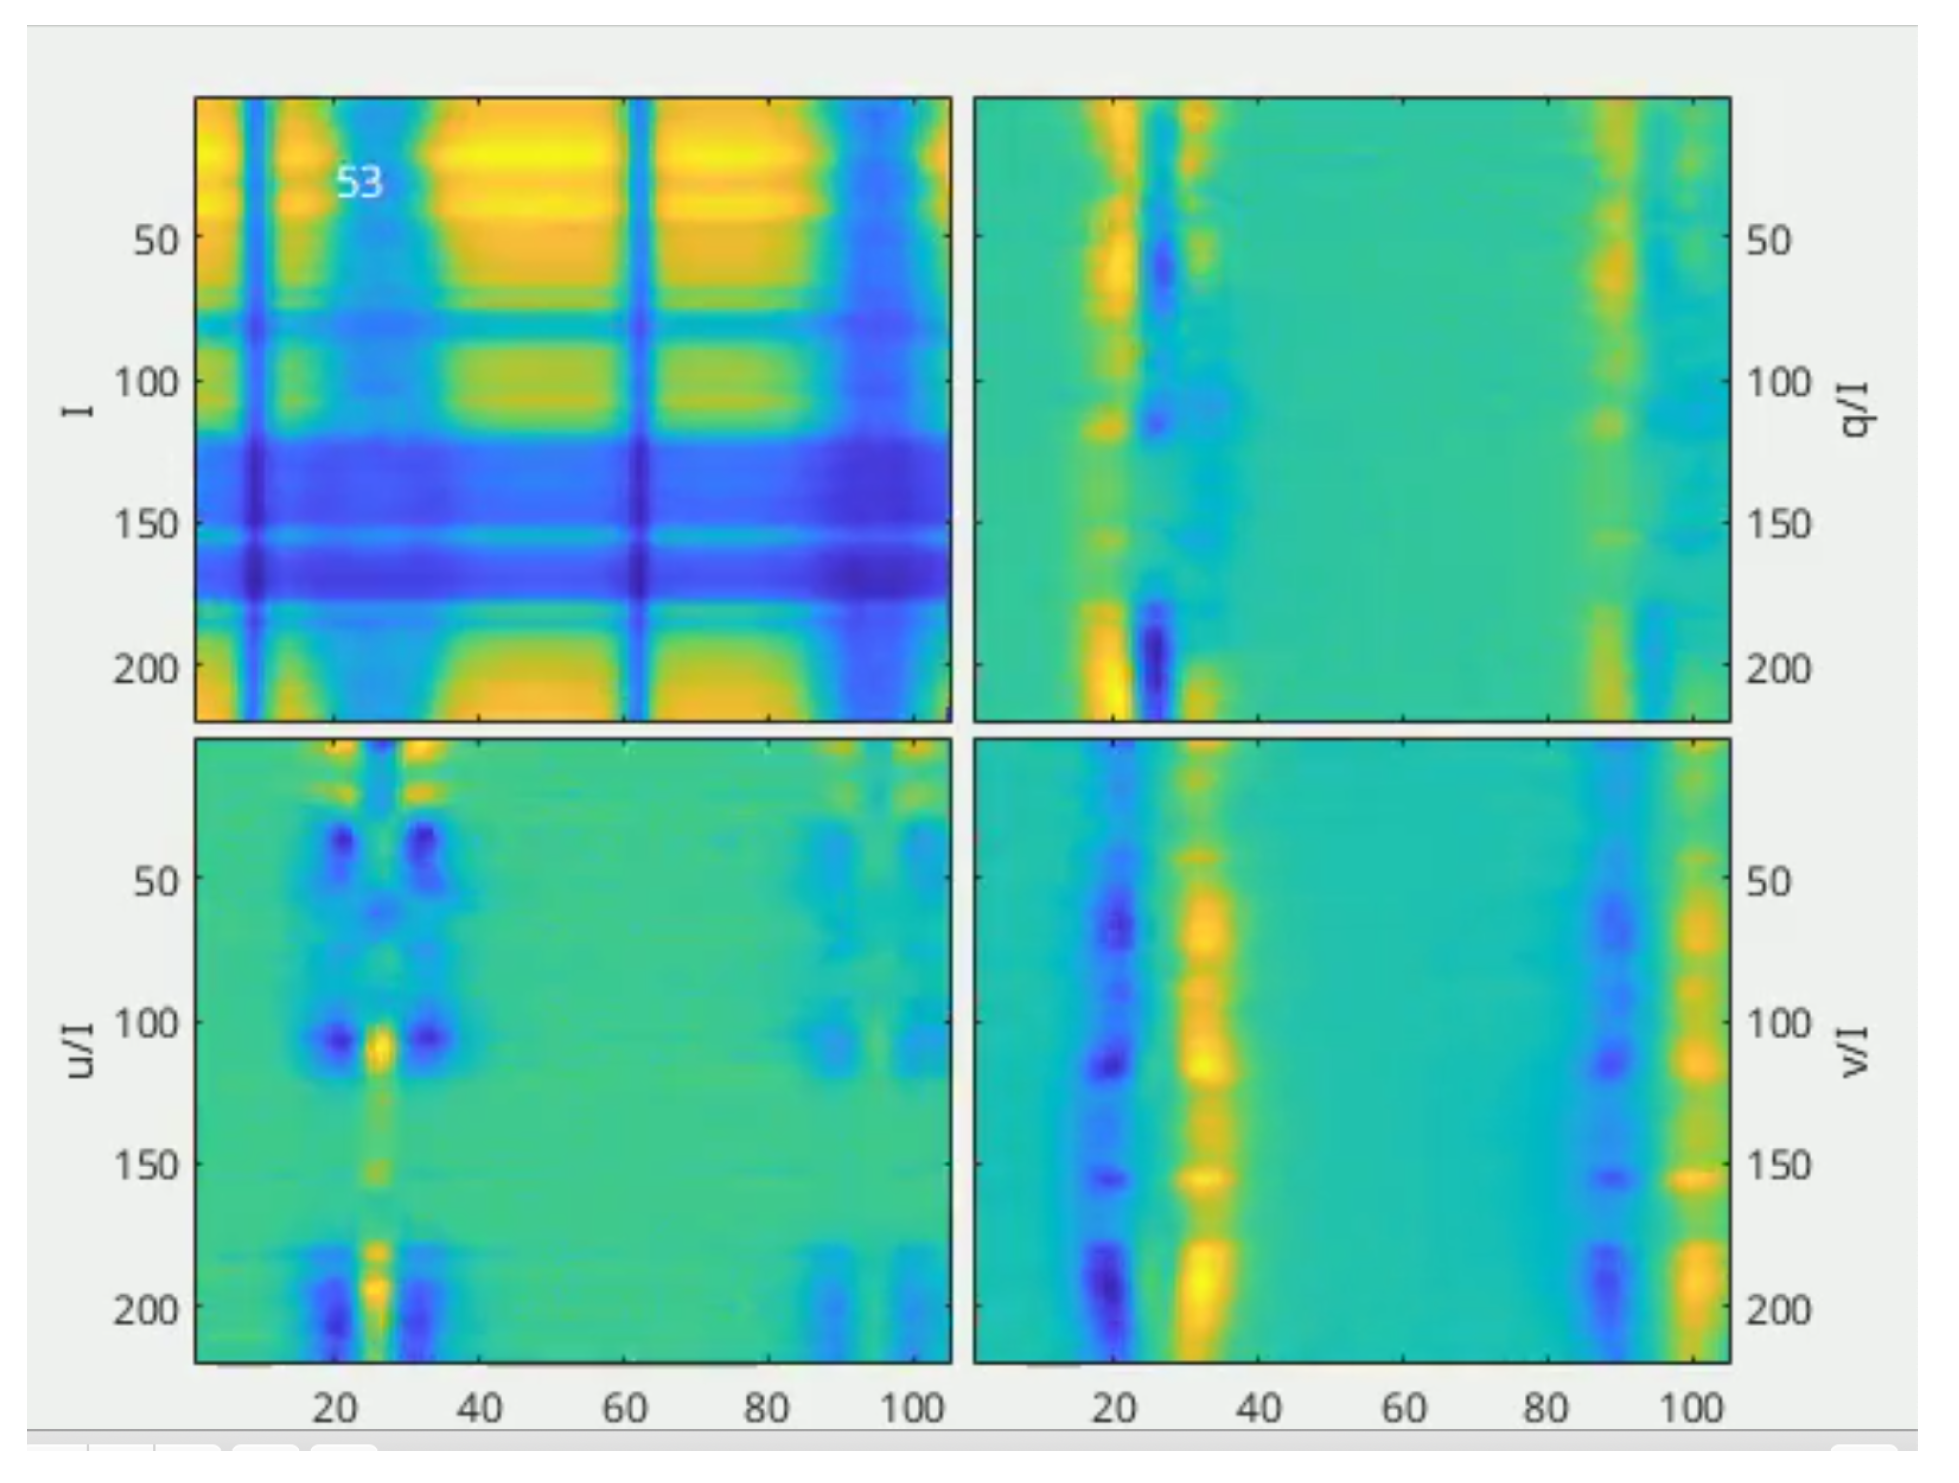
An example of the Level 0 observations of the parameters IQUV in Fe 6302 Å lines is shown for a slit position crossing a sunspot in Figure 10.
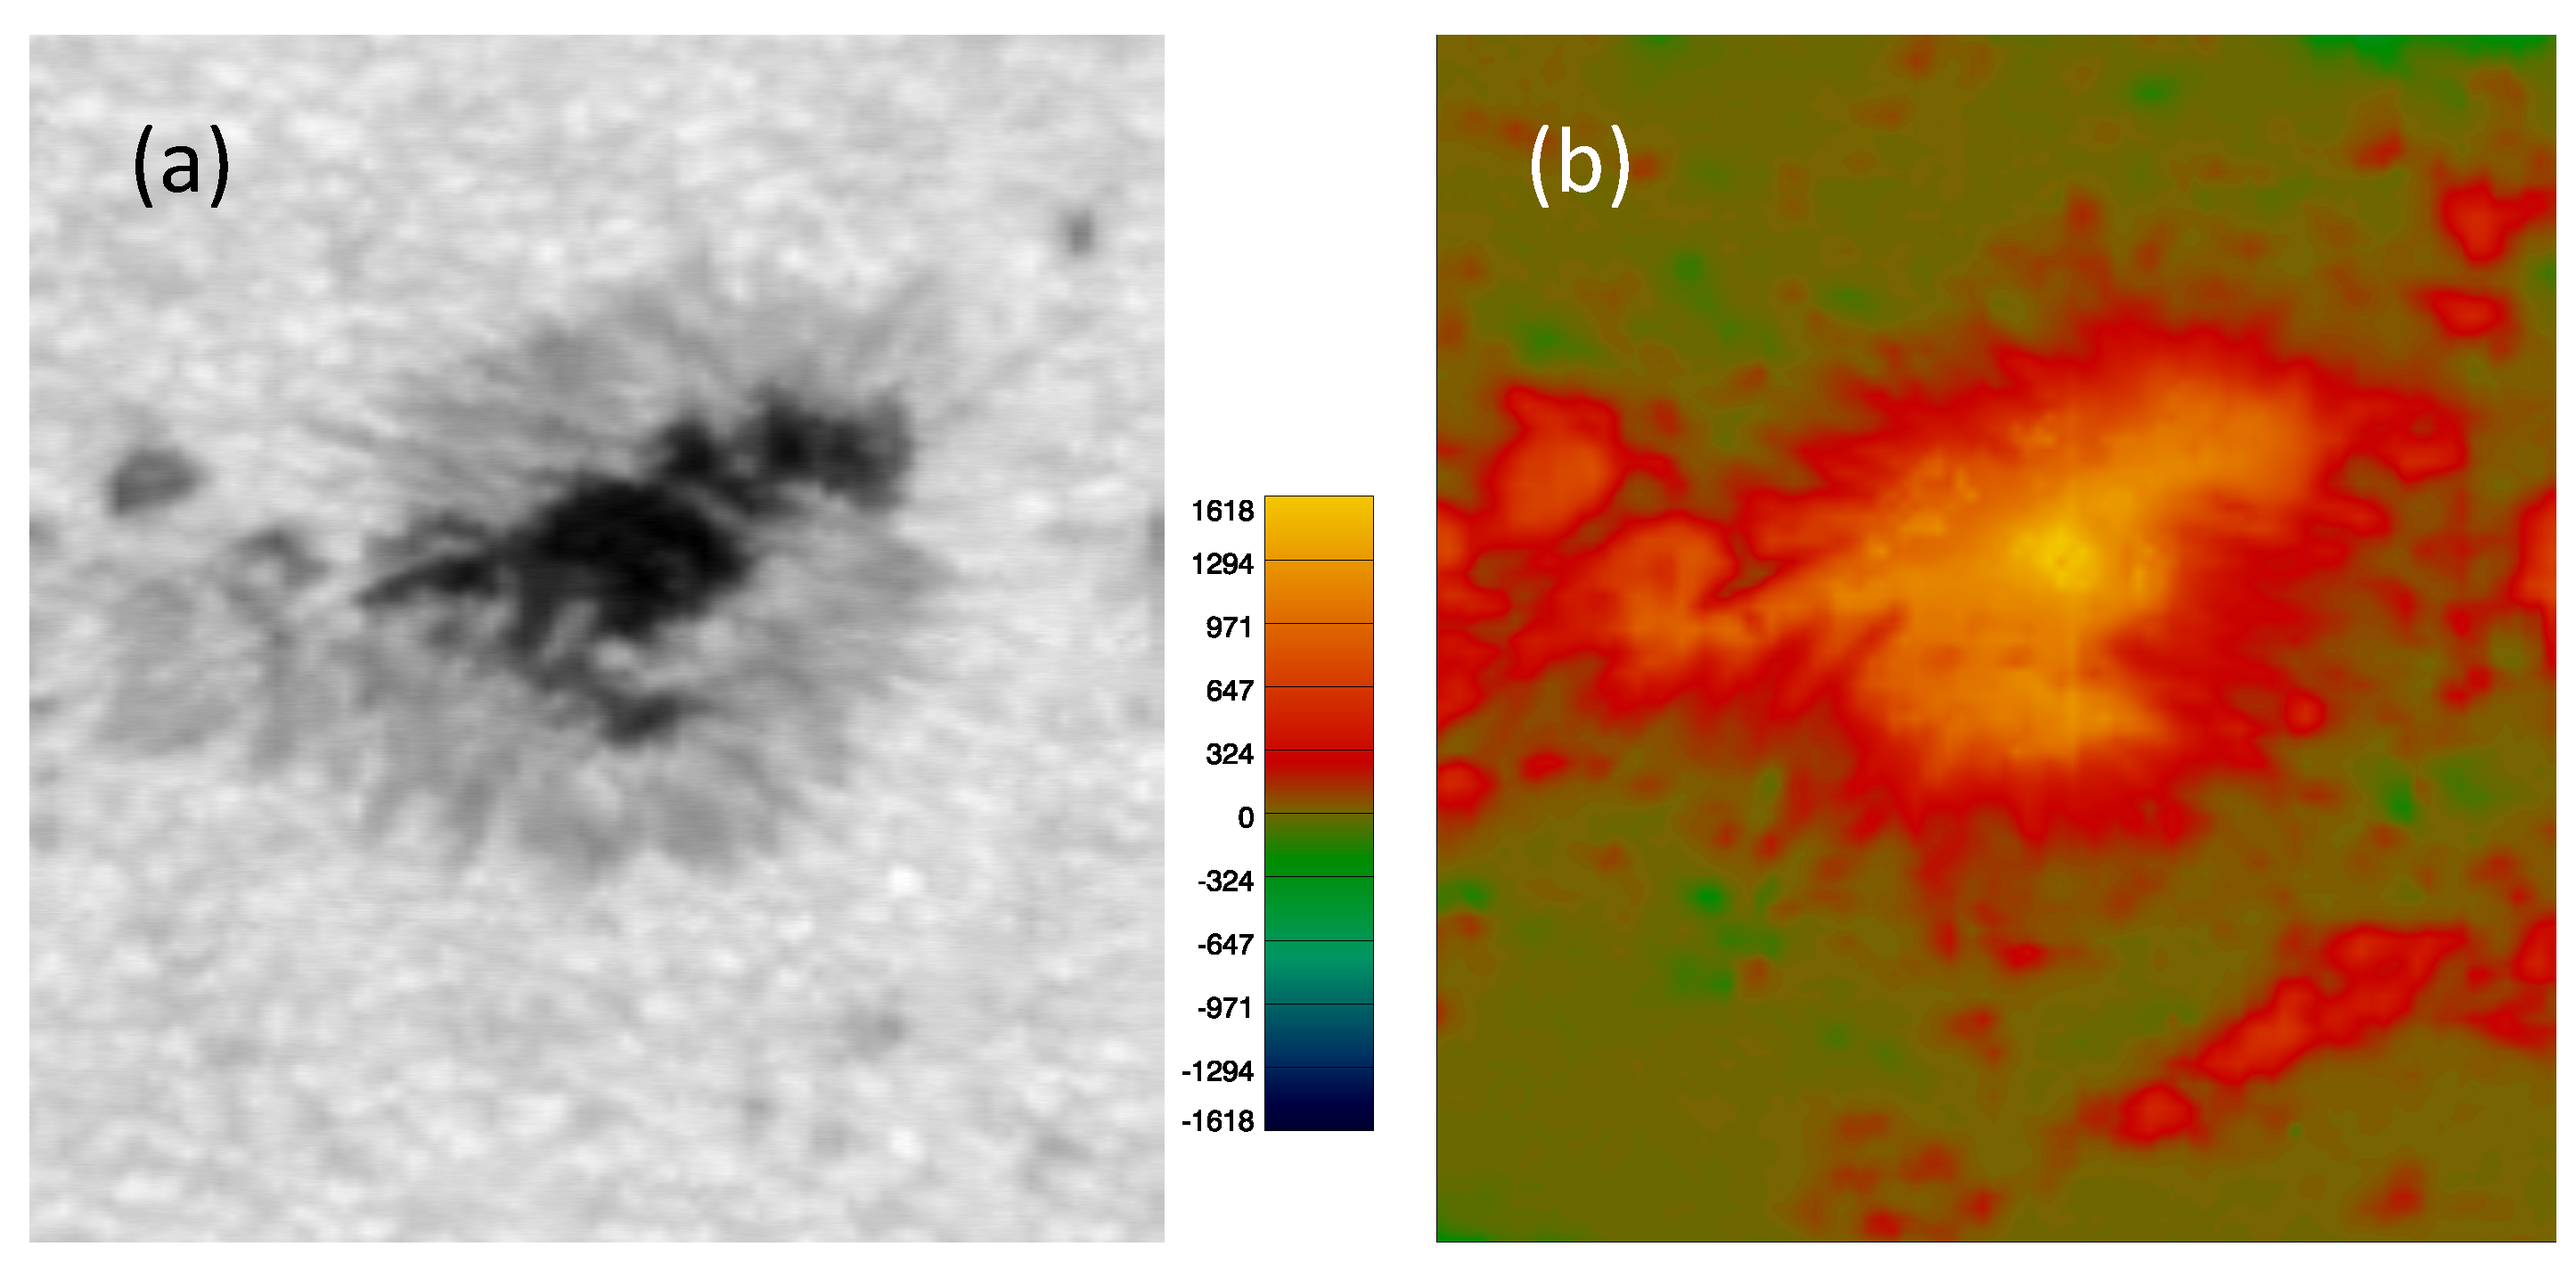
Several campaigns were conducted using the polarimeter in 2024 (Figure 11). The AR NOAA 13822 was observed on 11 September 2024, with the large cameras 2048 × 2028 with an X step of 0.5 arcsec (Figure 11). Along the slit, the spatial resolution is 0.0613 arcsec. The field of view is 50 arcsec × 53.5 arcsec. The observations of the Stokes parameters were registered in the Fe I 6302.5 Å. From these data, the magnetic field vector has been computed using UNNOFIT inversion.

5. Conclusions

THEMIS new generation with its adaptive optics opens new perspectives for different solar physics and heliophysics studies focusing on the following: sunspots, magnetic activities, jets, surges, eruptions, and origins of the solar wind. Campaigns with space missions are a plus for the observations of THEMIS. With multi-wavelength observations, we have a 3D view and a temporal evolution of the phenomena. We have shown that THEMIS observations have been the basis of many developments in MHD simulations and polarimetry. Many questions concerning the magnetic field in the Sun’s atmosphere remain open.

Funding

This research received no external funding.

Data Availability Statement

No new data were created or analyzed in this study. Data sharing is not applicable to this article.

Acknowledgments

The authors thank Pascal Démoulin for their critical reading of the manuscript. We have improved the original manuscript thanks to the reviewers’ suggestions. We want to thank the team of THEMIS for upgrading the instrument and for the assistance during our observation campaigns: Bernard Gelly, Didier Laforgue, and Richard Douet.

Conflicts of Interest

The authors declare no conflicts of interest.

References

  1. Arnaud, J.; Mein, P.; Rayrole, J. The Solar Telescope THEMIS. In Proceedings of the Crossroads for European Solar and Heliospheric Physics. Recent Achievements and Future Mission Possibilities; Priest, E.R., Ed.; ESA Special Publication: Noordwijk, The Netherlands, 1998; Volume 417, p. 213. [Google Scholar]
  2. Mein, P. High resolution observations with THEMIS: Prospects in magnetic field observations. In Proceedings of the High Spatial Resolution Solar Observations, Sunspot, MN, USA, 22–26 August 1988; von der Luehe, O., Ed.; National Solar Observatory: Sunspot, MN, USA, 1989; p. 12. [Google Scholar]
  3. Mein, P.; Malherbe, J.M.; Sayède, F.; Rudawy, P.; Phillips, K.J.H.; Keenan, F.P. Four Decades of Advances from MSDP to S4I and SLED Imaging Spectrometers. Sol. Phys. 2021, 296, 30. [Google Scholar] [CrossRef]
  4. Rayrole, J. The new solar magnetograph for the Canary Islands Observatory THEMIS. In Proceedings of the NASA Conference Publication, Monterey, CA, USA, 22–24 July 1985; NASA Conference Publication: Hanover, MD, USA, 1985; Volume 2374, pp. 219–230. [Google Scholar]
  5. Gelly, B.; Le Men, C.; López Ariste, A.; Delaigue, C.; Gónzalez Perez, R. Design and implementation of an image stabilization device at the THEMIS solar telescope. Exp. Astron. 2008, 22, 67–85. [Google Scholar] [CrossRef]
  6. Bommier, V.; Rayrole, J. Search for polarimetric sensitivity in the first observations with THEMIS spectropolarimetric mode MTR (August 1998 campaign). Astron. Astrophys. 2002, 381, 227–240. [Google Scholar] [CrossRef]
  7. Landi Degl’Innocenti, E.; Landolfi, M. Polarization in Spectral Lines; Springer: Berlin/Heidelberg, Germany, 2004; Volume 307. [Google Scholar] [CrossRef]
  8. Bommier, V.; Landi Degl’Innocenti, E.; Landolfi, M.; Molodij, G. UNNOFIT inversion of spectro-polarimetric maps observed with THEMIS. Astron. Astrophys. 2007, 464, 323–339. [Google Scholar] [CrossRef]
  9. Landolfi, M.; Landi Degl’Innocenti, E.; Arena, P. On the Diagnostic of Magnetic Fields in Sunspots Through the Interpretation of Stoke’s Parameters Profiles. Sol. Phys. 1984, 93, 269–287. [Google Scholar] [CrossRef]
  10. Bommier, V. Magnetometry: Solving the fundamental ambiguity from line pair inversion. Astron. Astrophys. 2025, 694, A40. [Google Scholar] [CrossRef]
  11. Faurobert, M.; Aime, C.; Périni, C.; Uitenbroek, H.; Grec, C.; Arnaud, J.; Ricort, G. Direct measurement of the formation height difference of the 630 nm Fe I solar lines. Astron. Astrophys. 2009, 507, L29–L32. [Google Scholar] [CrossRef]
  12. Metcalf, T.R. Resolving the 180-degree ambiguity in vector magnetic field measurements: The ‘minimum’ energy solution. Sol. Phys. 1994, 155, 235–242. [Google Scholar] [CrossRef]
  13. Leroy, J.L.; Bommier, V.; Sahal-Brechot, S. The Magnetic Field in the Prominences of the Polar Crown. Sol. Phys. 1983, 83, 135–142. [Google Scholar] [CrossRef]
  14. Bommier, V.; Sahal-Brechot, S.; Leroy, J.L. The linear polarization of hydrogen H-beta radiation and the joint diagnostic of magnetic field vector and electron density in quiescent prominences. I. The magnetic field. Astron. Astrophys. 1986, 156, 79–89. [Google Scholar]
  15. Bommier, V.; Landi Degl’Innocenti, E.; Leroy, J.L.; Sahal-Brechot, S. Complete determination of the magnetic field vector and of the electron density in 14 prominences from linear polarizaton measurements in the HeI D3 and Hα lines. Sol. Phys. 1994, 154, 231–260. [Google Scholar] [CrossRef]
  16. Bommier, V.; Leroy, J.L.; Sahal-Bréchot, S. 24 synoptic maps of average magnetic field in 296 prominences measured by the Hanle effect during the ascending phase of solar cycle 21. Astron. Astrophys. 2021, 647, A60. [Google Scholar] [CrossRef]
  17. Sahal-Brechot, S.; Bommier, V.; Feautrier, N. Doppler redistribution of anisotropic radiation and resonance polarization in moving scattering media. I. Theory revisited in the density matrix formalism. Astron. Astrophys. 1998, 340, 579–592. [Google Scholar]
  18. Bommier, V.; Leroy, J.L. Global Pattern of the Magnetic Field Vectors Above Neutral Lines from 1974 to 1982: Pic-du-Midi Observations of Prominences. In Proceedings of the IAU Colloq. 167: New Perspectives on Solar Prominences, Aussois, France, 28 April–4 May 1997; Webb, D.F., Schmieder, B., Rust, D.M., Eds.; Astronomical Society of the Pacific Conference Series. 1998; Volume 150, p. 434. [Google Scholar]
  19. Leroy, J.L.; Bommier, V.; Sahal-Brechot, S. New data on the magnetic structure of quiescent prominences. Astron. Astrophys. 1984, 131, 33–44. [Google Scholar]
  20. Kalewicz, T.; Bommier, V. Magnetic field vector ambiguity resolution in a quiescent prominence observed on two consecutive days. Astron. Astrophys. 2019, 629, A138. [Google Scholar] [CrossRef]
  21. López Ariste, A.; Casini, R. Magnetic Fields in Prominences: Inversion Techniques for Spectropolarimetric Data of the He I D3 Line. Astrophys. J. 2002, 575, 529–541. [Google Scholar] [CrossRef]
  22. Casini, R.; Bevilacqua, R.; López Ariste, A. Principal Component Analysis of the He I D3 Polarization Profiles from Solar Prominences. Astrophys. J. 2005, 622, 1265–1274. [Google Scholar] [CrossRef]
  23. Asensio Ramos, A.; Trujillo Bueno, J.; Landi Degl’Innocenti, E. Advanced Forward Modeling and Inversion of Stokes Profiles Resulting from the Joint Action of the Hanle and Zeeman Effects. Astrophys. J. 2008, 683, 542–565. [Google Scholar] [CrossRef]
  24. Faurobert, M.; Arnaud, J.; Vigneau, J.; Frisch, H. Investigation of weak solar magnetic fields. New observational results for the SrI 460.7 nm linear polarization and radiative transfer modeling. Astron. Astrophys. 2001, 378, 627–634. [Google Scholar] [CrossRef]
  25. Faurobert, M.; Arnaud, J. Center-to-limb variation of scattering polarization in molecular solar lines: Observations and modeling. Astron. Astrophys. 2003, 412, 555–565. [Google Scholar] [CrossRef]
  26. Bommier, V.; Landi Degl’Innocenti, E.; Feautrier, N.; Molodij, G. Collisional influence on the differential Hanle effect method applied to the second solar spectrum of the A2Π-X2Σ+ (0, 0) band of MgH. Astron. Astrophys. 2006, 458, 625–633. [Google Scholar] [CrossRef]
  27. Faurobert, M.; Derouich, M.; Bommier, V.; Arnaud, J. Hanle effect in the solar Ba II D2 line: A diagnostic tool for chromospheric weak magnetic fields. Astron. Astrophys. 2009, 493, 201–206. [Google Scholar] [CrossRef]
  28. Faurobert, M.; Ricort, G. Solar-cycle variations of the internetwork magnetic field. Astron. Astrophys. 2015, 582, A95. [Google Scholar] [CrossRef]
  29. Schmieder, B.; Mein, P.; Simnett, G.M.; Tandberg-Hanssen, E. An example of the association of X-ray and UV emission with H-alpha surges. Astron. Astrophys. 1988, 201, 327–338. [Google Scholar]
  30. Pasechnik, M.N. Spectral Study Lower Solar Atmosphere of the Active Region Site with the Ellerman Bomb and Accompanying Hα-EJECTIONS. Odessa Astron. Publ. 2023, 36, 178–182. [Google Scholar] [CrossRef]
  31. Guo, Y.; Schmieder, B.; Démoulin, P.; Wiegelmann, T.; Aulanier, G.; Török, T.; Bommier, V. Coexisting Flux Rope and Dipped Arcade Sections Along One Solar Filament. Astrophys. J. 2010, 714, 343–354. [Google Scholar] [CrossRef]
  32. Guo, Y.; Ding, M.D.; Schmieder, B.; Li, H.; Török, T.; Wiegelmann, T. Driving Mechanism and Onset Condition of a Confined Eruption. Astrophys. J. Lett. 2010, 725, L38–L42. [Google Scholar] [CrossRef]
  33. Török, T.; Kliem, B. Confined and Ejective Eruptions of Kink-unstable Flux Ropes. Astrophys. J. Lett. 2005, 630, L97–L100. [Google Scholar] [CrossRef]
  34. Kliem, B.; Török, T. Torus Instability. Phys. Rev. Lett. 2006, 96, 255002. [Google Scholar] [CrossRef]
  35. Canou, A.; Amari, T.; Bommier, V.; Schmieder, B.; Aulanier, G.; Li, H. Evidence for a Pre-Eruptive Twisted Flux Rope Using the Themis Vector Magnetograph. Astrophys. J. Lett. 2009, 693, L27–L30. [Google Scholar] [CrossRef]
  36. Aulanier, G.; Török, T.; Démoulin, P.; DeLuca, E.E. Formation of Torus-Unstable Flux Ropes and Electric Currents in Erupting Sigmoids. Astrophys. J. 2010, 708, 314–333. [Google Scholar] [CrossRef]
  37. Guo, J.H.; Ni, Y.W.; Zhou, Y.H.; Guo, Y.; Schmieder, B.; Chen, P.F. Prominence fine structures in weakly twisted and highly twisted magnetic flux ropes. Astron. Astrophys. 2022, 667, A89. [Google Scholar] [CrossRef]
  38. Guo, J.H.; Ni, Y.W.; Guo, Y.; Xia, C.; Schmieder, B.; Poedts, S.; Zhong, Z.; Zhou, Y.H.; Yu, F.; Chen, P.F. Data-driven Modeling of a Coronal Magnetic Flux Rope: From Birth to Death. Astrophys. J. 2024, 961, 140. [Google Scholar] [CrossRef]
  39. Schmieder, B.; Guo, J.; Poedts, S. Recent advances in solar data-driven MHD simulations of the formation and evolution of CME flux ropes. Rev. Mod. Plasma Phys. 2024, 8, 27. [Google Scholar] [CrossRef]
  40. Schmieder, B.; Bommier, V.; Kitai, R.; Matsumoto, T.; Ishii, T.T.; Hagino, M.; Li, H.; Golub, L. Magnetic Causes of the Eruption of a Quiescent Filament. Sol. Phys. 2008, 247, 321–333. [Google Scholar] [CrossRef]
  41. Xing, C.; Aulanier, G.; Cheng, X.; Xia, C.; Ding, M. Unveiling the Initiation Route of Coronal Mass Ejections through Their Slow Rise Phase. Astrophys. J. 2024, 966, 70. [Google Scholar] [CrossRef]
  42. Schmieder, B.; Tziotziou, K.; Heinzel, P. Spectroscopic diagnostics of an Hα and EUV filament observed with THEMIS and SOHO. Astron. Astrophys. 2003, 401, 361–375. [Google Scholar] [CrossRef]
  43. Aulanier, G.; Schmieder, B. The magnetic nature of wide EUV filament channels and their role in the mass loading of CMEs. Astron. Astrophys. 2002, 386, 1106–1122. [Google Scholar] [CrossRef]
  44. Schmieder, B.; Kucera, T.A.; Knizhnik, K.; Luna, M.; Lopez-Ariste, A.; Toot, D. Propagating Waves Transverse to the Magnetic Field in a Solar Prominence. Astrophys. J. 2013, 777, 108. [Google Scholar] [CrossRef]
  45. Orozco Suárez, D.; Asensio Ramos, A.; Trujillo Bueno, J. The magnetic field configuration of a solar prominence inferred from spectropolarimetric observations in the He i 10 830 Å triplet. Astron. Astrophys. 2014, 566, A46. [Google Scholar] [CrossRef]
  46. Levens, P.J.; Schmieder, B.; López Ariste, A.; Labrosse, N.; Dalmasse, K.; Gelly, B. Magnetic Field in Atypical Prominence Structures: Bubble, Tornado, and Eruption. Astrophys. J. 2016, 826, 164. [Google Scholar] [CrossRef]
  47. Koza, J.; Rybák, J.; Gömöry, P.; Kozák, M.; López Ariste, A. Spectral Characteristics of the He I D3 Line in a Quiescent Prominence Observed by THEMIS. Sol. Phys. 2017, 292, 98. [Google Scholar] [CrossRef]
  48. Aulanier, G.; Demoulin, P. 3-D magnetic configurations supporting prominences. I. The natural presence of lateral feet. Astron. Astrophys. 1998, 329, 1125–1137. [Google Scholar]
  49. López Ariste, A.; Aulanier, G. Unveiling the Magnetic Field Topology of Prominences. In Proceedings of the Physics of Chromospheric Plasmas, Coimbra, Portugal, 9–13 October 2006; Heinzel, P., Dorotovič, I., Rutten, R.J., Eds.; Astronomical Society of the Pacific Conference Series. 2007; Volume 368, p. 291. [Google Scholar]
  50. Schmieder, B.; Tian, H.; Kucera, T.; López Ariste, A.; Mein, N.; Mein, P.; Dalmasse, K.; Golub, L. Open questions on prominences from coordinated observations by IRIS, Hinode, SDO/AIA, THEMIS, and the Meudon/MSDP. Astron. Astrophys. 2014, 569, A85. [Google Scholar] [CrossRef]
  51. López Ariste, A.; Asensio Ramos, A.; Manso Sainz, R.; Derouich, M.; Gelly, B. Variability of the polarization profiles of the Ba II D{2} line in the solar atmosphere. Astron. Astrophys. 2009, 501, 729–734. [Google Scholar] [CrossRef]
  52. Casini, R.; López Ariste, A. PCA Inversion of Stokes Profiles in Solar Prominences. In Proceedings of the Solar Polarization, Tenerife, Canary Islands, Spain, 30 September–4 October 2002; Trujillo-Bueno, J., Sanchez Almeida, J., Eds.; Astronomical Society of the Pacific Conference Series. 2003; Volume 307, p. 109. [Google Scholar]
  53. López Ariste, A.; Casini, R. Inference of the Magnetic Field in Spicules from Spectro-Polarimetry of He I D3. In Proceedings of the Solar Polarization 4, Boulder, CO, USA, 19–23 September 2005; Casini, R., Lites, B.W., Eds.; Astronomical Society of the Pacific Conference Series. 2006; Volume 358, p. 443. [Google Scholar]
  54. Dudík, J.; Aulanier, G.; Schmieder, B.; Bommier, V.; Roudier, T. Topological Departures from Translational Invariance along a Filament Observed by THEMIS. Sol. Phys. 2008, 248, 29–50. [Google Scholar] [CrossRef]
  55. Dudík, J.; Aulanier, G.; Schmieder, B.; Zapiór, M.; Heinzel, P. Magnetic Topology of Bubbles in Quiescent Prominences. Astrophys. J. 2012, 761, 9. [Google Scholar] [CrossRef]
  56. Ariste, A.L. Hanle and Zeeman effects: From solar to stellar diagnostics. In Proceedings of the Magnetic Fields Throughout Stellar Evolution, Biarritz, France, 25–30 August 2013; Petit, P., Jardine, M., Spruit, H.C., Eds.; IAU Symposium. 2014; Volume 302, pp. 130–133. [Google Scholar] [CrossRef]
  57. Gunár, S.; Labrosse, N.; Luna, M.; Schmieder, B.; Heinzel, P.; Kucera, T.A.; Levens, P.J.; López Ariste, A.; Mackay, D.H.; Zapiór, M. On the Physical Nature of the so-Called Prominence Tornadoes. Space Sci. Rev. 2023, 219, 33. [Google Scholar] [CrossRef]
  58. Schmieder, B.; Zapiór, M.; López Ariste, A.; Levens, P.; Labrosse, N.; Gravet, R. Reconstruction of a helical prominence in 3D from IRIS spectra and images. Astron. Astrophys. 2017, 606, A30. [Google Scholar] [CrossRef]
  59. Levens, P.J.; Labrosse, N.; Schmieder, B.; López Ariste, A.; Fletcher, L. Comparing UV/EUV line parameters and magnetic field in a quiescent prominence with tornadoes. Astron. Astrophys. 2017, 607, A16. [Google Scholar] [CrossRef]
  60. Berger, T.E.; Shine, R.A.; Slater, G.L.; Tarbell, T.D.; Title, A.M.; Okamoto, T.J.; Ichimoto, K.; Katsukawa, Y.; Suematsu, Y.; Tsuneta, S.; et al. Hinode SOT Observations of Solar Quiescent Prominence Dynamics. Astrophys. J. Lett. 2008, 676, L89. [Google Scholar] [CrossRef]
  61. Zirker, J.B.; Engvold, O.; Martin, S.F. Counter-streaming gas flows in solar prominences as evidence for vertical magnetic fields. Nature 1998, 396, 440–441. [Google Scholar] [CrossRef]
  62. Xia, C.; Keppens, R. Internal Dynamics of a Twin-layer Solar Prominence. Astrophys. J. Lett. 2016, 825, L29. [Google Scholar] [CrossRef]
  63. Jenkins, J.M.; Keppens, R. Resolving the solar prominence/filament paradox using the magnetic Rayleigh-Taylor instability. Nat. Astron. 2022, 6, 942–950. [Google Scholar] [CrossRef]
  64. Gelly, B.; Langlois, M.; Moretto, G.; Douet, R.; Lopez Ariste, A.; Tallon, M.; Thiébaut, E.; Geyskens, N.; Lorgeoux, G.; Léger, J.; et al. New life for the THEMIS solar telescope. In Proceedings of the Ground-Based and Airborne Telescopes VI, Edinburgh, UK, 26 June–1 July 2016; Hall, H.J., Gilmozzi, R., Marshall, H.K., Eds.; Society of Photo-Optical Instrumentation Engineers (SPIE) Conference Series. 2016; Volume 9906, p. 99065. [Google Scholar] [CrossRef]
  65. Tallon, M.; Thiébaut, É.; Tallon-Bosc, I.; Gelly, B.; Denis, L. Solar wavefront sensing at THEMIS with self-calibrated reference image and estimation of the noise covariance. In Proceedings of the Adaptive Optics Systems VIII, Montreal, QC, Canada, 17–22 July 2022; Schreiber, L., Schmidt, D., Vernet, E., Eds.; Society of Photo-Optical Instrumentation Engineers (SPIE) Conference Series. 2022; Volume 12185, p. 121852. [Google Scholar] [CrossRef]
  66. Roudier, T.; Malherbe, J.M.; Gelly, B.; Douet, R.; Frank, Z.; Dalmasse, K. Evolution of exploding granules from coordinated observations by THEMIS, IRIS, SDO/HMI, and HINODE, and a simulation. Astron. Astrophys. 2020, 641, A50. [Google Scholar] [CrossRef]
  67. Karki, G.; Schmieder, B.; Devi, P.; Chandra, R.; Labrosse, N.; Joshi, R.; Gelly, B. Magnetic Reconnection between a Solar Jet and a Filament Channel. Astrophys. J. 2025, 979, 182. [Google Scholar] [CrossRef]
Figure 1. Active region NOAA 11865 observed with THEMIS on 11 October 2013 between 09:39 and 09:59 UT, in the photospheric lines Fe I 6301/6302. The ambiguity is resolved by the new method of Bommier [10]. Left panel: Magnetic field vector, vertical component between −1450 and +1450 G (blue/red color indicates negative/positive polarity), and horizontal component maximum arrow length 1320 G. Middle panel: Current density vector, vertical component between −96 and +96 mA m−2 (blue/red color indicates negative/positive electric current), and horizontal component maximum arrow length 655 mA m−2. Right panel: Lorentz force vector, vertical component between −83 and +83, and horizontal component maximum arrow length 43 mN m−2 (adapted from Bommier [10]).
Universe 11 00153 g001
Figure 2. Magnetic field vector of AR NOAA 10767 obtained by THEMIS in 27 May 2005. Top panel: Longitudinal magnetic field (negative/positive) in black/white in the map; the transverse magnetic field is represented by overlaid short lines with no arrow because the 180 ambiguity is not resolved. The red box is the FOV of the bottom panels. In the two bottom panels, the ambiguity is resolved with two methods as follows: in the bottom left by UNNOFIT2 directly, and in the bottom right with a procedure minimizing the electric current showing no discontinuity The red arrow indicates the region of the discontinuity (from Guo et al. [31]).
Universe 11 00153 g002
Figure 3. THEMIS H α filament and superimposed vector magnetic map for 24 August 2006 between 10:26 and 12:04 UT. The longitudinal magnetic field is drawn with colors (warm colors—yellow and red—for the field going out of the Sun surface, and cold colors—blue and green—for the field entering the Sun). The transverse field is drawn with segments having a length proportional to the field strength. The segments have no arrow because the 180-degree ambiguity is not solved. The field-of-view is 160 arcsec × 74 arcsec. The range for the longitudinal magnetic field is +/−330 G. (adapted from Schmieder 2008 [40]).
Universe 11 00153 g003
Figure 4. THEMIS/MTR maps of a prominence (FOV = 88 arcsec × 50 arcsec) on 10 October 2012 reconstructed from the observations of the Stokes parameters IQUV in the He D3 line along the slit scanning the prominence. The slit was tangent to the limb. The maps are obtained after feeding the Stokes profiles to an inversion code based on the PCA method [21]. Panel (a): intensity between 10:44 and 11:52 UT; panel (b): magnetic field strength; panel (c): inclination; and panel (d): azimuth. The color chart ranges from 0° to +180° (left to right). Orange means around 90°. The dark vertical lines are perpendicular to the slit scan and correspond to the grid mask which was used during these observations. The grid mode allows us to have a double image with opposite polarization at the same time. The inclination is measured from the vertical. All the orange pixels in the inclination map (on the left) show that the field direction is mainly horizontal. The azimuth is mainly around 110°, so the field direction is directed approximately (within about 30°) parallel to the plane of the sky (adapted from [44]).
Universe 11 00153 g004
Figure 5. Sunspot observed with THEMIS new generation: an image obtained with the broadband camera (BBI) and processed with the Knox Thompson reconstruction method; the slit-jaw image and the level 1 spectra with polarization (I +/− QUV).
Universe 11 00153 g005
Figure 6. Granulation observed with THEMIS on 6 October 2022 (FOV = 55 arcsec × 55 arcsec) using TAO (THEMIS Adaptive Optics). The data are acquired with the broadband BBI camera centered at 6560 Åand processed with the Knox Thompson image reconstruction method.
Universe 11 00153 g006
Figure 7. THEMIS surrounded by raging wildfires on 20 August 2023. The telescope was actually spared from the flames.
Universe 11 00153 g007
Figure 8. Sunspot observed on 6 October 2022 with THEMIS with the BBI camera and the adaptive optics (AO) (fov= 55 arcsec × 55 arcsec). The data are acquired with the broadband BBI camera centered at 656 Å and processed with the Knox Thompson image reconstruction method.
Universe 11 00153 g008
Figure 9. Jet and filament observed during a multi-wavelength campaign with THEMIS on 25 September 2023, (panel a) in 304 Å (SDO/AIA), and (panel b) in H α (GONG) with superimposed the image of THEMIS. The black arrow indicates the direction of the jet and the dashed yellow lines ce the positions of the spectra in the panels (ce). High velocity jet detected in H α spectra with large flow (panel c,d) and bilateral flow (panel e) around the horizontal dashed blue lines (adapted from Karki et al. [67]).
Universe 11 00153 g009
Figure 10. Spectropolarimetric observations (Level 0) obtained by THEMIS on a camera in four panels; the spectra of Fe 6302 Å doublet (I), and the Stokes parameters Q, U, abd V. The Zeeman effect splits the lines in two components as the slit is crossing a fragmented spot (see panel I). The x-axis is the wavelength coordinate, and the y-axis is along the slit. Observations obtained on 20 January 2025.
Universe 11 00153 g010
Figure 11. Sunspot observed with THEMIS new generation and the camera (2048 × 2048) on 11 September 2024 in Fe 6302.5 Å (following the spot of the AR NOAA 13822). The FOV is 50 arcsec × 53.5 arcsec. (a) the sunspot with its fibril penumbra; (b) the vertical magnetic field reconstructed from the Stokes parameters using the UNNOFIT inversion. The color chart indicates the vertical B strength.
Universe 11 00153 g011
Disclaimer/Publisher’s Note: The statements, opinions and data contained in all publications are solely those of the individual author(s) and contributor(s) and not of MDPI and/or the editor(s). MDPI and/or the editor(s) disclaim responsibility for any injury to people or property resulting from any ideas, methods, instructions or products referred to in the content.