Article

Exploring the Variability of Three Be Stars with TESS Observations

by
Laerte Andrade
1,†,
Alan W. Pereira
2,3,†,
Marcelo Emilio
2,3,*,† and
Eduardo Janot-Pacheco
4,†
1
Laboratório Nacional de Astrofísica, Ministério da Ciência, Tecnologia e Inovação, Itajubá 37504-364, Brazil
2
Departamento de Geociências, Universidade Estadual de Ponta Grossa, Ponta Grossa 84030-900, Brazil
3
Observatório Nacional, Ministério da Ciência, Tecnologia e Inovação, Rio de Janeiro 20921-400, Brazil
4
Instituto de Astronomia, Geofísica e Ciências Atmosféricas, Universidade de São Paulo, São Paulo 05508-090, Brazil
*
Author to whom correspondence should be addressed.
These authors contributed equally to this work.
Universe 2025, 11(2), 71; https://doi.org/10.3390/universe11020071
Submission received: 13 December 2024 / Revised: 30 January 2025 / Accepted: 11 February 2025 / Published: 18 February 2025
(This article belongs to the Section Solar and Stellar Physics)

Abstract

:
Be stars are rapidly rotating B-type stars surrounded by circumstellar disks formed from self-ejected material. Understanding the mechanisms driving mass ejection and disk formation, known as the Be phenomenon, requires a detailed investigation of their variability and underlying physical processes. In this study, we analyze the photometric, spectroscopic, and seismic characteristics of three Be stars—HD 212044, 28 Cyg, and HD 174237—using high-cadence data from the TESS mission and spectral data from the BeSS database. Photometric variability was analyzed through iterative prewhitening and wavelet techniques, revealing distinct frequency groups associated with non-radial pulsations (NRPs). Spectral data provided equivalent width measurements of the H α line, which correlated with photometric changes, reflecting dynamic interactions between the stars and their disks. Seismic analysis identified core rotation rates and buoyancy travel times for HD 212044 and 28 Cyg, offering insights into internal stellar processes and angular momentum distribution. HD 212044 exhibits a strong negative correlation between photometric brightness and H α equivalent width, whereas this correlation is weaker in the case of 28 Cyg. The findings for these two stars highlight the interplay between NRPs, rapid rotation, and circumstellar disk dynamics. In contrast, the case of HD 174237 presents an example of how a binary system with mass transfer and a B-type component is revealed when observed simultaneously with space-based photometry and ground-based spectroscopy, demonstrating the importance of distinguishing classical Be stars from interacting binaries.

1. Introduction

Since Father Angelo Secchi first observed the H β line emitted from the star γ Cassiopeiae in 1866, a distinct class of stars—known today as Be stars—has intrigued astronomers [1]. This enduring mystery, referred to as the “Be phenomenon”, represents one of the oldest unresolved problems in stellar astrophysics.
Be stars belong to the broader category of B-type stars, characterized by their high surface temperatures, strong luminosities, and distinct spectral features. In the Harvard spectral classification, B-type stars are situated in the temperature range of 10,000 to 30,000 K, giving them their characteristic blue–white color. These stars are relatively bright, with luminosities hundreds to thousands of times greater than the Sun, and masses between 2 and 16 solar masses. Their spectra are characterized by strong absorption Balmer lines, often showing some emission, and by prominent lines of He I and, at higher temperatures, He II.
A classical Be star is a rapidly rotating B-type star of luminosity class (LC) V to III, surrounded by a gaseous disk composed of self-ejected material [2]. The defining feature of Be stars is the “e” in their classification, indicating the presence of Balmer emission lines in their spectra. These emission lines are not permanent but vary over time, often alternating between phases of emission and absorption. This variability is linked to the periodic ejection of material from the star [2], which forms a circumstellar disk.
The nature of this phenomenon was first theorized by Otto Struve in 1931, who attributed the emission lines to ultraviolet radiation ionizing the gas within the circumstellar envelope [3]. Struve also noted the unusually broad absorption lines in Be star spectra, which he connected to their exceptionally high rotational velocities. These stars are known to rotate at speeds reaching 75% or more of their critical velocity—the speed at which centrifugal forces balance gravitational forces at the star’s equator.
In addition to their rapid rotation, non-radial pulsations (NRPs) are a fundamental characteristic of Be stars. NRPs are oscillations occurring near the stellar surface (pressure modes) or at moderate depths into the star (gravity modes). Pulsations can be observed where regions of the star alternately expand and contract, creating complex motion patterns. Unlike radial pulsations, which involve symmetric expansion and contraction of the star as a whole, NRPs involve surface distortions that propagate across the star’s surface. These pulsations generate localized changes in temperature and pressure and can contribute to the ejection of material from the star.
The frequencies of NRPs provide critical insight into the internal structure of Be stars, a field of study known as asteroseismology [4,5]. Asteroseismology is the science of probing the interiors of stars by analyzing their oscillations. Much like how seismology on Earth reveals the planet’s internal structure through the study of earthquakes, asteroseismology uses the frequencies, amplitudes, phases, and modes of stellar pulsations to infer details about a star’s internal layers, composition, and dynamics [5,6].
Space-based telescopes have revolutionized asteroseismology, especially for Be stars and other variable stars, which often exhibit pulsation periods on the order of one day. These periods closely match the Earth’s rotation period, making distinguishing stellar signals from observational biases challenging when using ground-based telescopes. Space missions have overcome these challenges by offering continuous, high-precision photometric data. Observations from satellites such as MOST [7], WISE [8], CoRoT [9], and Kepler [10] have significantly increased the number and precision of frequencies that can be detected.
The TESS (Transiting Exoplanet Survey Satellite) mission, building on the legacy of these earlier missions, has become a vital tool for studying Be stars. TESS offers near-continuous monitoring of stars over extended periods, allowing for the detection of subtle variations in their light curves. This capability is significant for understanding the interplay between NRPs, rapid rotation, and mass ejection in Be stars. Our group has successfully contributed to this effort, with Be star proposals selected through the TESS General Investigator program. This collaboration has enabled detailed photometric monitoring of selected Be stars, providing high-quality data for advancing our understanding of their seismic properties and the mechanisms driving the Be phenomenon. The three targets discussed in this paper were selected due to their photometric variations observed during TESS observations and the availability of complementary spectroscopic data in the BeSS database.
To understand the mechanisms underlying the Be phenomenon, analyzing NRP frequencies in Be stars provides crucial insights into their internal processes, including rotation profiles, energy transport, and angular momentum distribution. These internal mechanisms play a fundamental role in shaping the dynamics of Be stars and their circumstellar environments. For example, Andrade et al. [11] analyzed the Be star HD 171219 and identified a quintuplet at approximately 1.113 d−1 (12.88 μHz) with a separation of 0.017 d−1, attributed to a pulsation degree of l 2 . They observed variations in the intensity of the main frequencies following outbursts, suggesting a possible link between NRP regimes and the feeding of the circumstellar envelope. Similarly, Neiner et al. [12] detected a new type of pulsation in HD 51452, characterized as stochastically excited gravito-inertial modes, likely driven by rapid rotation. Stellar pulsations in Be stars have been identified in several studies. Emilio et al. [13] distinguished pulsation frequencies from the rotation frequency in CoRoT-ID 102761769, while Neiner et al. [14] and Gutiérrez-Soto et al. [15] identified pulsations in HD 181231 and HD 175869, respectively, with the latter study leaving open the possibility that the observed variations were due to NRPs. Additionally, Diago et al. [16] identified gravity modes with azimuthal orders m = 0, −1, −2, and −3 in HD 50209. Floquet et al. [17] and Huat et al. [18] studied HD 49330, finding both p and g modes. They reported amplitude variations correlated with outbursts and noted changes in line profile variability preceding these events.
Rapid rotation is a critical factor in the mass ejection observed in Be stars, but it alone cannot fully explain the phenomenon. The interplay between rapid rotation and NRPs is currently the most accepted explanation for the Be phenomenon. This dynamic combination provides an efficient mechanism for ejecting material into the circumstellar environment, leading to the formation and maintenance of the gaseous disk [2].
Understanding the interaction between internal stellar rotation and pulsation modes is essential for uncovering how the material is expelled to form the circumstellar disk and how this process contributes to the associated spectral emission. Observing the evolution of these oscillations over time offers valuable insights into the disk’s long-term stability and the variability of emission lines, emphasizing the critical role of linking pulsational behavior with circumstellar dynamics. Despite these advances, many questions remain regarding this complex phenomenon’s precise mechanisms and variability.
In this work, we present a comprehensive analysis of the TESS light curves and seismic characteristics of two Be stars, HD 212044 (TIC 431116093) and 28 Cyg (b02 Cyg, TIC 42360166), and discuss the nature of the object HD 174237 (CX Dra, TIC 48022676). Section 2 outlines the methods employed in our study, including the analysis of TESS light curves, frequency analysis, and the utilization of the BeSS database. We also detail the processes of spectral data analysis. Section 3 provides a seismic diagnosis for HD 212044, where we discuss the frequency characteristics and pulsation modes identified in the star. Section 4 focuses on 28 Cyg, presenting the TESS observations that reveal photometric variations and outbursts, followed by a seismic diagnosis. Section 5 focuses on HD 174237, summarizing the key findings from the TESS observations and their significance in understanding the star’s behavior. Finally, in Section 6, we present a discussion of our findings and their implications.

2. Methods

Our methodology is comprehensively described in Pereira et al. [19,20]. In the following paragraphs, we summarize the main points of our approach.

2.1. TESS Light Curve

We utilized Simple Aperture Photometry (SAP) light curves obtained from NASA’s Ames Research Center. The TESS data processing pipeline includes calibration and cleaning procedures similar to and based on the Kepler pipeline [21]. Detailed explanations of these processes can be found in Smith et al. [22]. Notably, we opted for SAP flux over Pre-search Data Conditioning Simple Aperture Photometry (PDCSAP) flux, as the latter can sometimes eliminate astrophysical variability on longer timescales [23], potentially masking outburst events characteristic of Be stars and other astrophysical sources.
The TESS observations for the three stars analyzed in this study were obtained at a 20 s cadence during observation cycles 2, 4, 5, 6, and 7. The specific observation periods for each target and the total time span of the light curve merged over two sectors are summarized in Table 1. Since we are not interested in frequencies beyond 20 cycles per day in the present study, we binned the data into 30 min intervals for our analyses.

2.2. Frequency Analysis

Searches for Nonradial Pulsations (NRPs) in TESS light curves were performed using the iterative prewhitening method outlined by Degroote et al. [24]. This method is a component of the ivs Python package, developed by the Institute of Astronomy at KU Leuven, and is documented in the package’s repository (https://github.com/IvS-KULeuven/IvSPythonRepository, accessed on 7 December 2024).
The prewhitening approach utilizes the Lomb–Scargle periodogram [25] iteratively to identify the highest amplitude frequency at each stage. The initial light curve is then adjusted via a non-linear least-squares fit incorporating the current and previous frequencies until a signal-to-noise ratio (S/N) limit. Based on the calculation of the detection threshold for the TESS time series made by Baran and Koen [26], we adopt the limit of 5 for the S/N. This value corresponds to a false alarm probability of around 0.1% for two sector data. One significant limitation of the prewhitening method is its tendency to introduce errors when analyzing closely spaced or overlapping frequencies within the data. Additionally, it often faces challenges in distinguishing genuine independent frequencies from harmonics or combination frequencies, potentially leading to incorrect interpretation of the results.
The frequency spectra for HD 212044 can be found in Figure A.1 of Pereira et al. [20] and are presented in Figure 1 for 28 Cyg. Both stars exhibit two distinct groups of frequencies, a common characteristic observed in Be stars.
Furthermore, wavelet plots were employed to evaluate the stability of the frequency signals across the observed sectors. Wavelet analysis enables the examination of variability behavior within a two-dimensional time-frequency plane [27]. Wavelet transforms face a trade-off between time and frequency resolution, with high frequencies offering better time resolution but poorer frequency resolution, and vice versa for low frequencies. This limits their ability to analyze signals with sharp features and closely spaced frequencies. Additionally, edge effects near data boundaries can distort results, particularly at the start and end of the time series.

2.3. BeSS

To analyze the behavior of the H α line, we utilized the BeSS database, a repository of spectra maintained by the LESIA laboratory at the Observatoire de Paris-Meudon [28]. This database contains a collection of spectra from Be stars, Herbig Ae/Be stars, and B[e] supergiants, contributed by professional and amateur astronomers. With hundreds of thousands of spectra from over a thousand Be stars, the BeSS database is a valuable resource for our research. For our analysis, we specifically selected medium-to-high resolution spectra obtained concurrently with the TESS observations for the emission line stars 28 Cyg and HD 174237, following the same methodology applied to HD 212044 in Pereira et al. [20].

2.4. Spectral Data Analysis

The BeSS database contains normalized and rectified spectra and spectra with absolute flux. Homogenizing these data required ensuring correct normalization among the thousands of spectra, providing a minimum standard for comparison. Given the number of spectra involved, an automated method was required. The normalization routine “fit_continuum” from the Python package “specutils” was adopted, with spectral intervals for the continuum defined on both sides of the line of interest.
The principal quantity obtained from the BeSS spectra was the equivalent width. The equivalent width of a line is the width of a rectangle with a height of 1 and the same area as the line in question. The equivalent width is represented by the abbreviation EW (equivalent width), and here, we adopt the convention that positive EW corresponds to an absorption line. Thus, negative values correspond to emission lines.
Measurements were also taken of the full width at half maximum (FWHM) of the H α line, the maximum or minimum intensity of the H α line in emission or absorption, and the violet-to-red peak ratio and sum (V/R and V + R) when the line showed a double peak. These measurements were also performed using routines from the “specutils” package. The equivalent width measurements proved to be the most robust and less vulnerable to instrumental and quality differences found in the spectra from community observers. For this reason, the EW quantity will be the only one mentioned in the following sections.

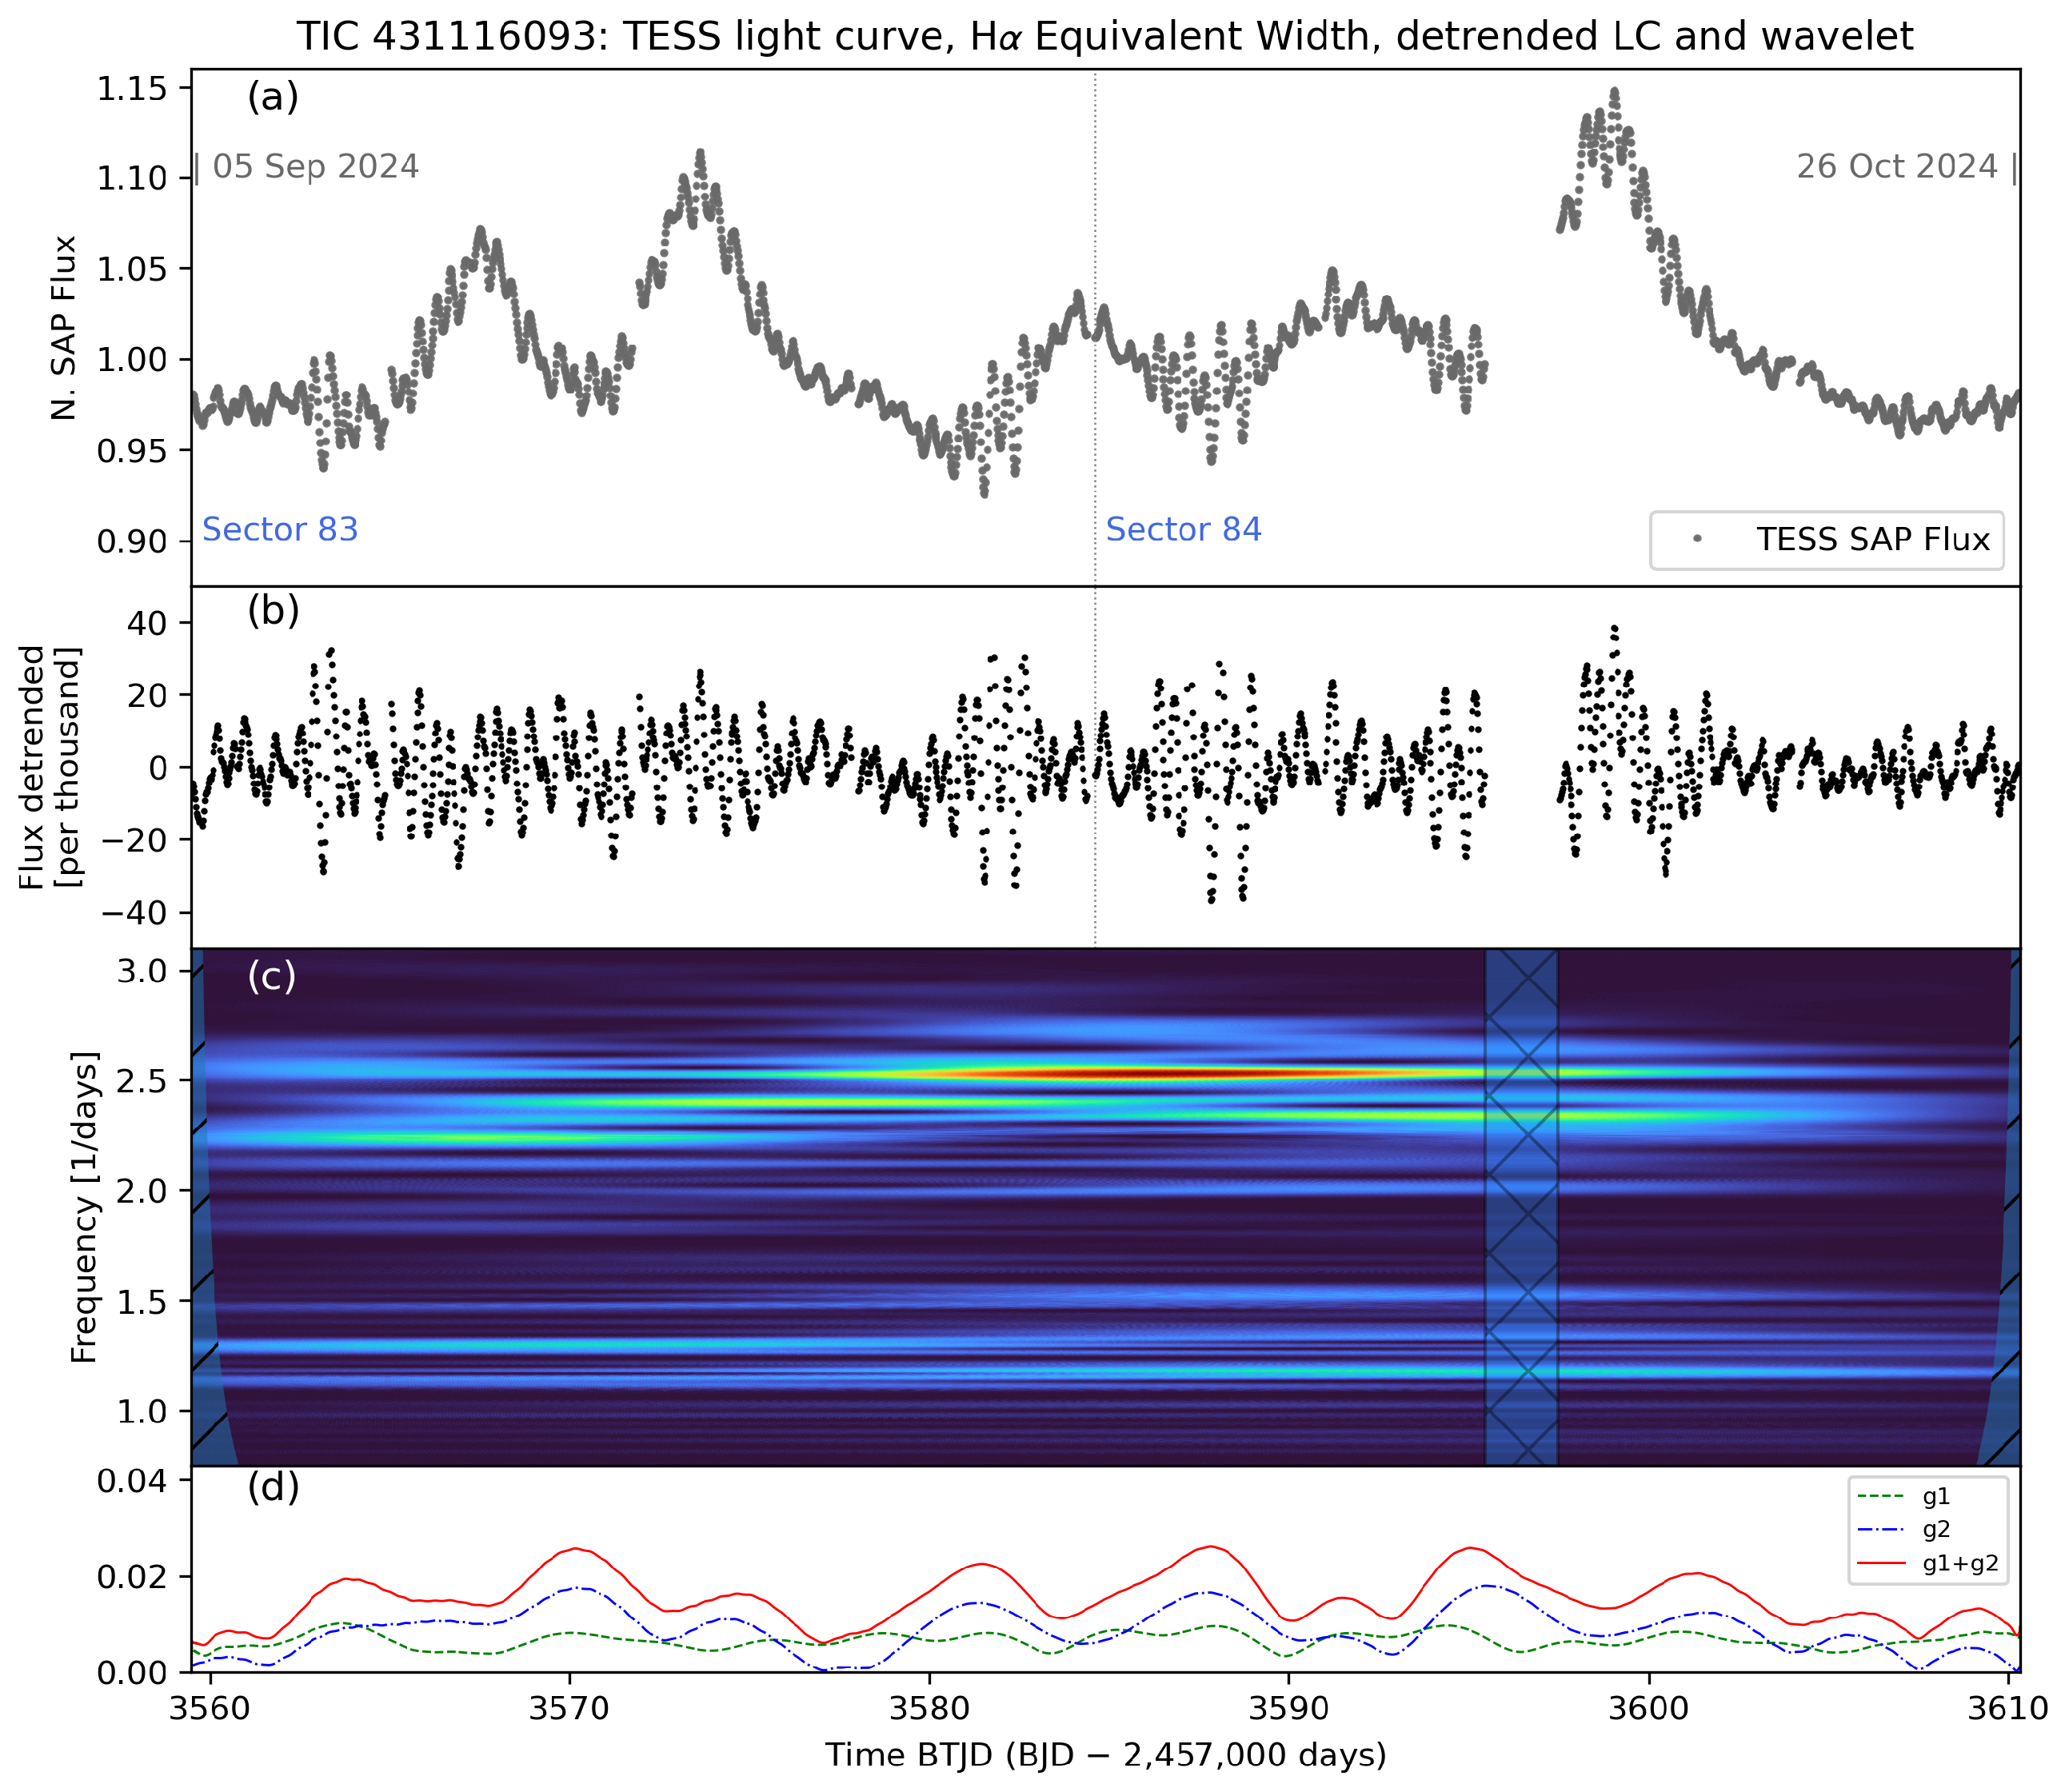
3. Seismic Diagnosis for HD 212044/TIC 431116093

Takata et al. [29] proposed a method to calculate the internal rotation frequency and the buoyancy travel times for stars with NRP g sectoral prograde modes. They showed that for each pair of two adjacent NRP frequencies observed in a star, there should correspond a point of a common straight line in the ν vs. Δ ν space, where ν is an NRP frequency displayed by a star and Δ ν the difference between the frequencies. The slope and the abscissa intercept of the linear fit are given by P 0 (the buoyancy travel time of g modes) and ν r o t (the star’s average rotation rate), respectively. Takata et al. [29] showed that the method can only be applied to prograde sectoral g modes. Otherwise, points do not align in the ν vs. Δ ν diagram, forming a chaotic distribution (see their Figure 4). Takata et al. [29]’s scheme serves then also to perform a test for the presence of sectoral g modes in the star.
We applied the seismic diagnosis method developed by Takata et al. [29] to HD 212044, following the implementation described by Pereira et al. [19]. In the frequency domain, the method allows for estimating the star’s average rotation rate and buoyancy travel time, specifically for gravity sectorial non-radial pulsation (NRP) modes (see Figure 2). Fortunately, B stars commonly exhibit such sectorial g modes, as observed in previous studies (e.g., [30,31,32,33]). Moreover, Aerts et al. [34] conducted a comprehensive analysis of the angular momentum in stellar interiors using seismic analysis deduced using space photometry. Their findings suggested that low- and intermediate-mass stars rotate quasi-rigidly during their core-hydrogen-burning phase. Therefore, the average rotation rate estimated through the Takata et al. [29] method is a reliable approximation of the stellar core rotation rate. We applied Takata’s method [29] to shorter light curves than the extensive Kepler light curve [19]. The method demonstrated promising reliability even for shorter observation periods; however, due to the limited datasets, it exhibits reduced accuracy and robustness.
Figure A.1 of Pereira et al. [20] shows the frequency spectra of HD 212044 for sectors 16 and 17, 56 and 57, and 76 and 77. We applied the seismic analysis method to those frequency values, specifically focusing on the group of frequencies between 2.0 and 2.5 d−1, corresponding to m = 2 . For TESS sectors 16 and 17, we obtained the ν vs. Δ ν diagram shown in Figure 2, which yielded the following rotation rate and travel time for HD 212044: ν r o t = 8.9 ± 0.7 μ Hz = 0.77 ± 0.06   d 1 , P 0 = 5.3 ± 0.6 × 10 3 s . In sectors 56 and 57, the same procedure led to the values: ν r o t = 9.2 ± 0.3 μ Hz = 0.79 ± 0.03   d 1 , P 0 = 6.0 ± 0.3 × 10 3 s . For the sector pair 76 and 77 the results were: ν r o t = 9.0 ± 0.2 μ Hz = 0.78 ± 0.02   d 1 , P 0 = 6.3 ± 0.2 × 10 3 s . These values align well with average rotation rates and buoyancy travel times for B stars, as illustrated in Pereira et al. [19] (Table 3, and references therein).
In addition to the data presented in Pereira et al. [20], we now include the recently released TESS observations for these stars in sectors 83 and 84. However, the absence of Balmer line measurements in the BeSS database for these epochs limits our ability to correlate spectroscopic and photometric variability during this period. The original and detrended light curves for these sectors are shown in Figure 3, where the star’s variability appears consistent with that observed in previous years. Using the same procedure to construct the ν versus Δ ν diagram, we determined a convergence value of ν r o t = 8.8 ± 0.6 μ Hz = 0.76 ± 0.06   d 1 and a characteristic period of P 0 = 5.5 ± 0.5 × 10 3 s . The consistency of these parameters across independent analyses of four different time segments over five years reinforces the reliability of our results for this object. This consistency is particularly significant given the challenges of applying the Takata et al. [29] method to short-duration light curves.
Assuming ν r o t = 9.0 ± 0.5 μ Hz = 0.77 ± 0.05   d 1 for the star, and considering a spectral type B0V with a radius of 7.2 R s u n [35], along with a vsin i measurement of 150 km s−1 by Harmanec et al. [36], we deduce a rotation period of 1.30 ± 0.08 d and an inclination angle of 30 º < i < 35 º . The H α profile of the star further supports this deduction, exhibiting characteristics typical of an object seen at a low inclination angle.

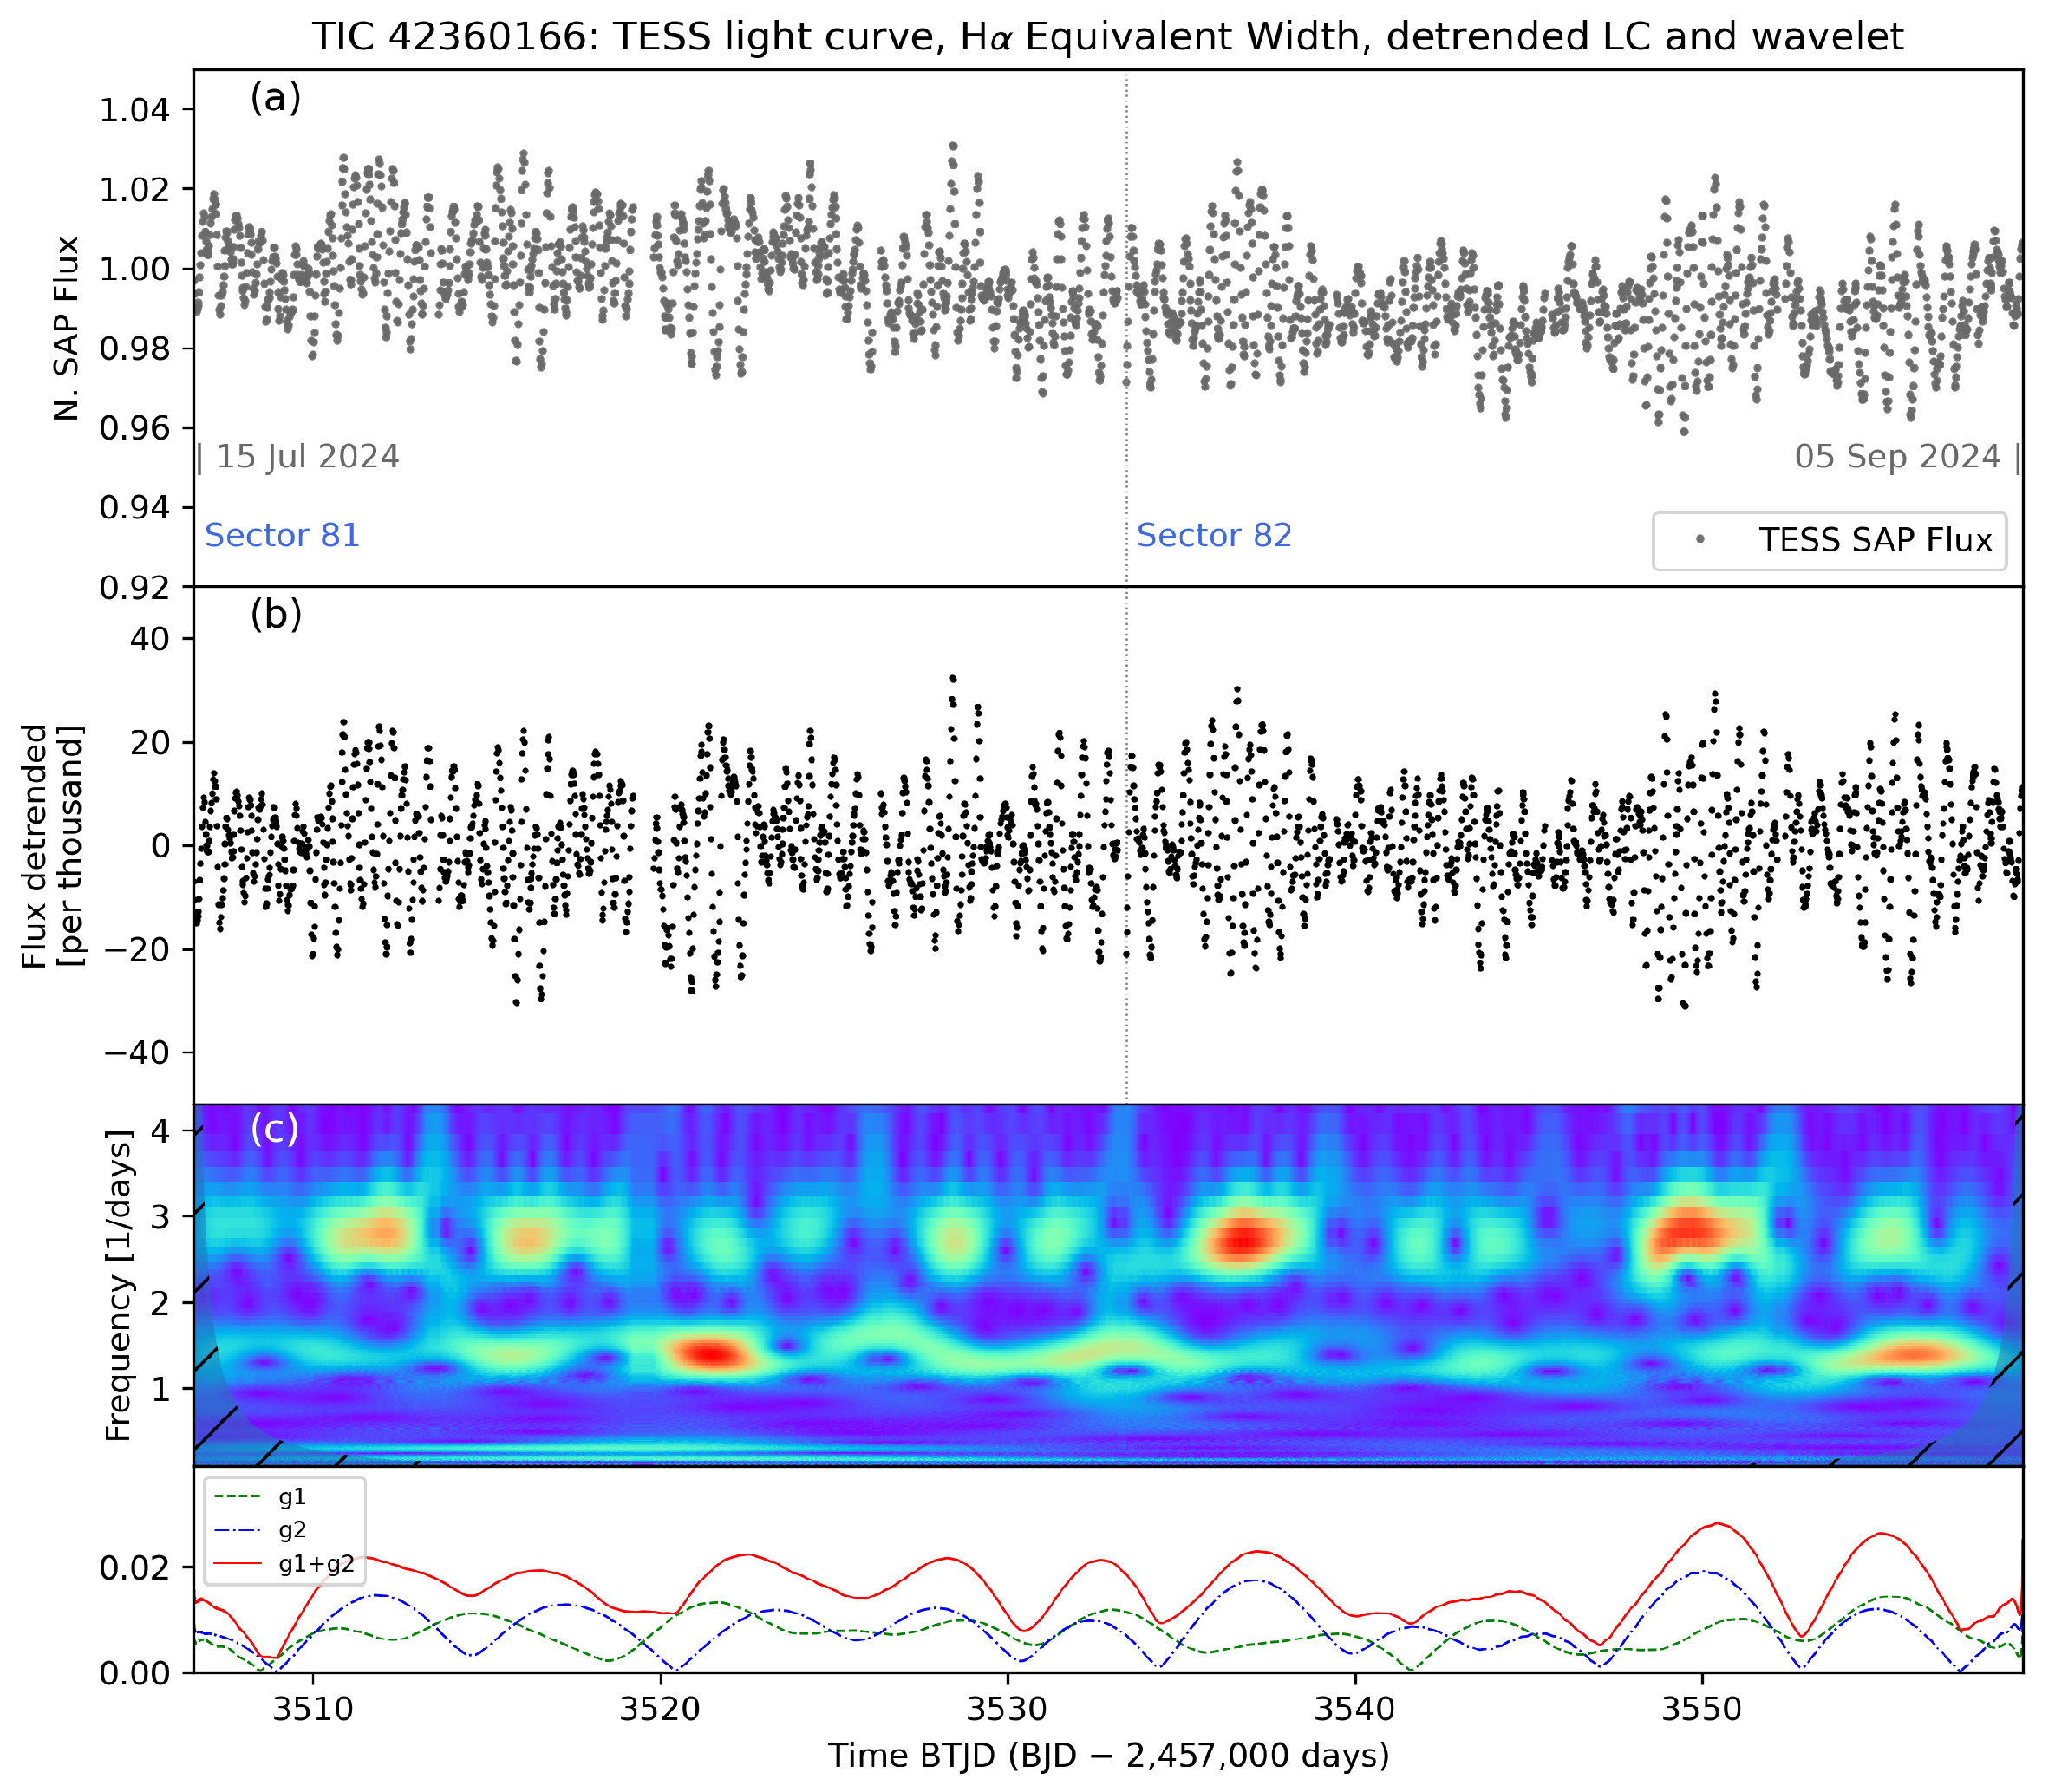
4. 28 Cyg/b02 Cyg/TIC 42360166

For a comprehensive review of the star 28 Cyg, readers are referred to Baade et al. [37]. The variability of this particular Be star was initially identified by Gies and Percy [38]. Utilizing ground observations in conjunction with data from the International Ultraviolet Explorer (IUE) space mission, Peters and Penrod [39] identified non-radial pulsations with periods of 16.5 and 3.2 h, attributed to = 2 and 10, respectively.
Rivinius et al. [30] pointed out that = m = 2 dominates the spectral variability of many Be stars, adopting for 28 Cyg the value vsin i = 320 km/s and a spectral type B2 IVe, both taken from Slettebak [40]. In a subsequent study, Baade et al. [37] highlighted that for decades, 28 Cyg has exhibited four large-amplitude frequencies: two closely spaced ones of spectroscopically confirmed g-modes near 1.5 d−1, one slightly lower exophotospheric ( S ˇ tefl) frequency, and another near 0.05 d−1, which equals the frequency difference ( Δ ) between the g-modes. They suggested that the variation in this difference modulates the star-to-disk mass transfer. An inclination angle of 40 < i < 75° was estimated for the star. Additionally, Sigut and Ghafourian [41] deduced the inclination angle for 28 Cyg to be i = 40 ± 5 ° and vsin i = 314 ± 33 km/s by fitting its H α emission line profile. In the late 90s, 28 Cyg experienced multiple H α outbursts [42]. Baade et al. [37] noted from photometric and contemporaneous spectroscopy that 28 Cyg exhibited a relatively calm behavior for a Be star from the late 1990s through the early 2000s, despite a high emission level. A new emission outburst occurred in 2012, reaching an H α emission EW lower than in the previous years, from −5 to −7 Å. The EW varies between −5 and −12 Å during TESS observations.

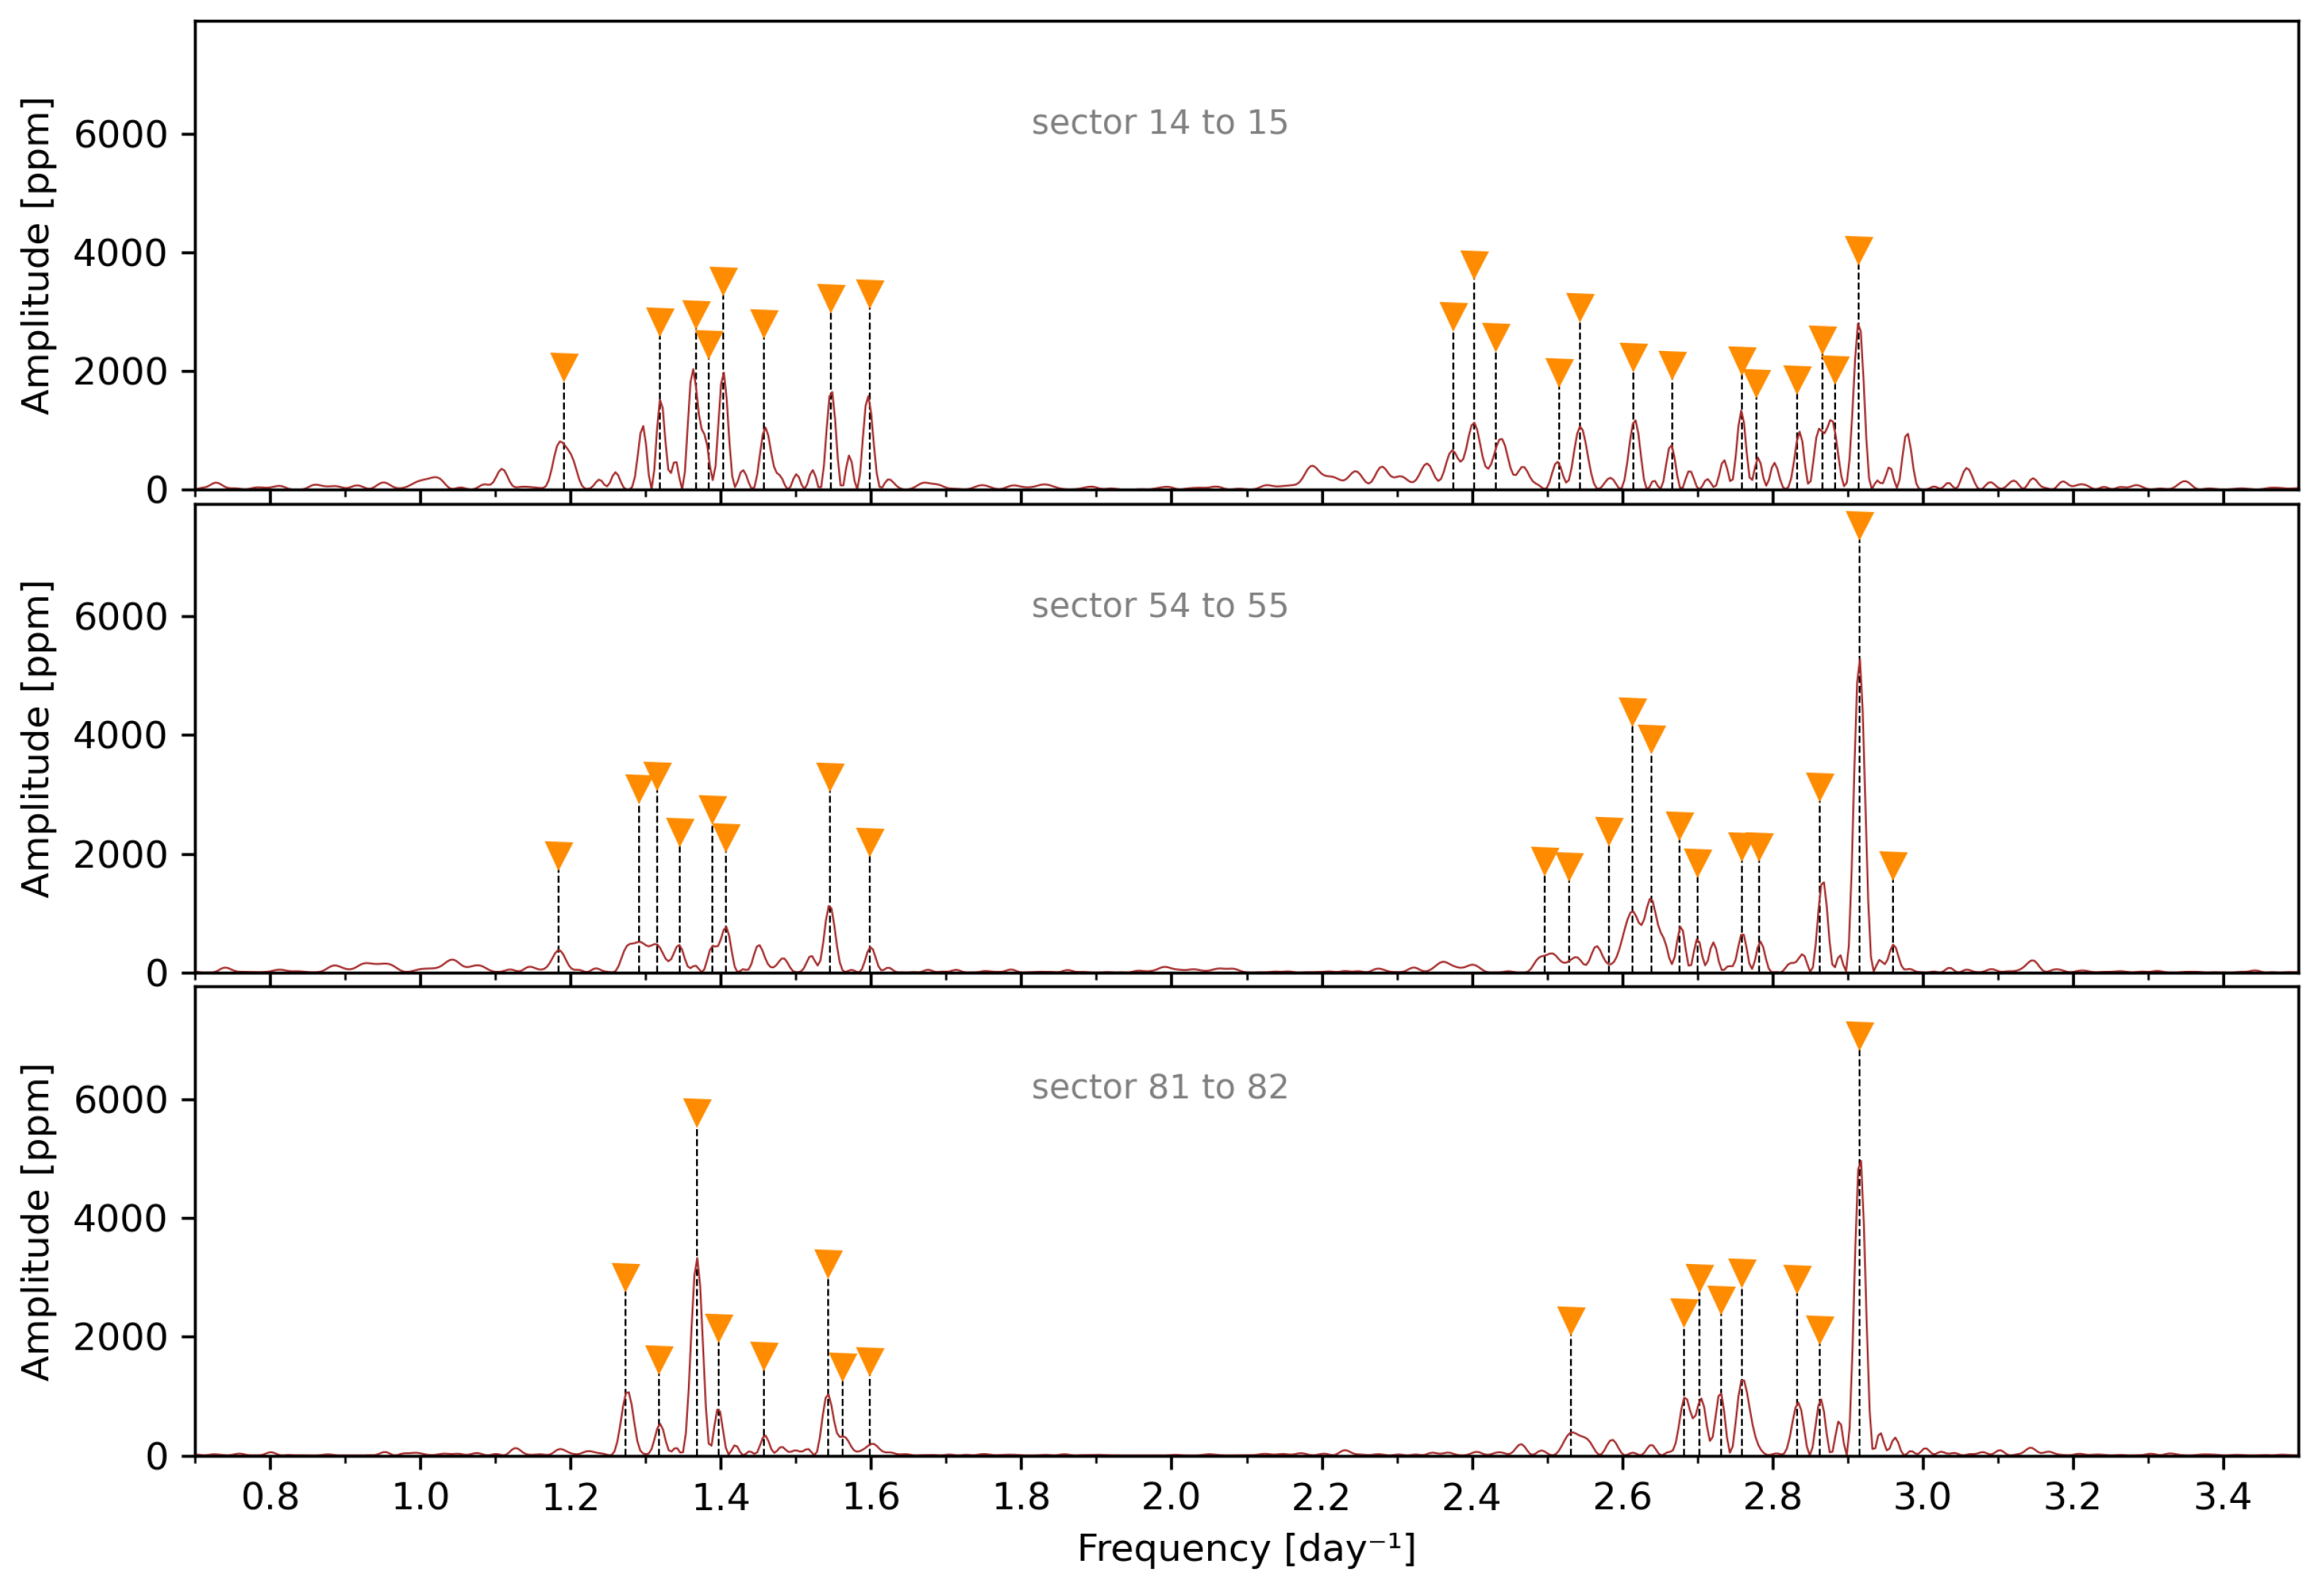
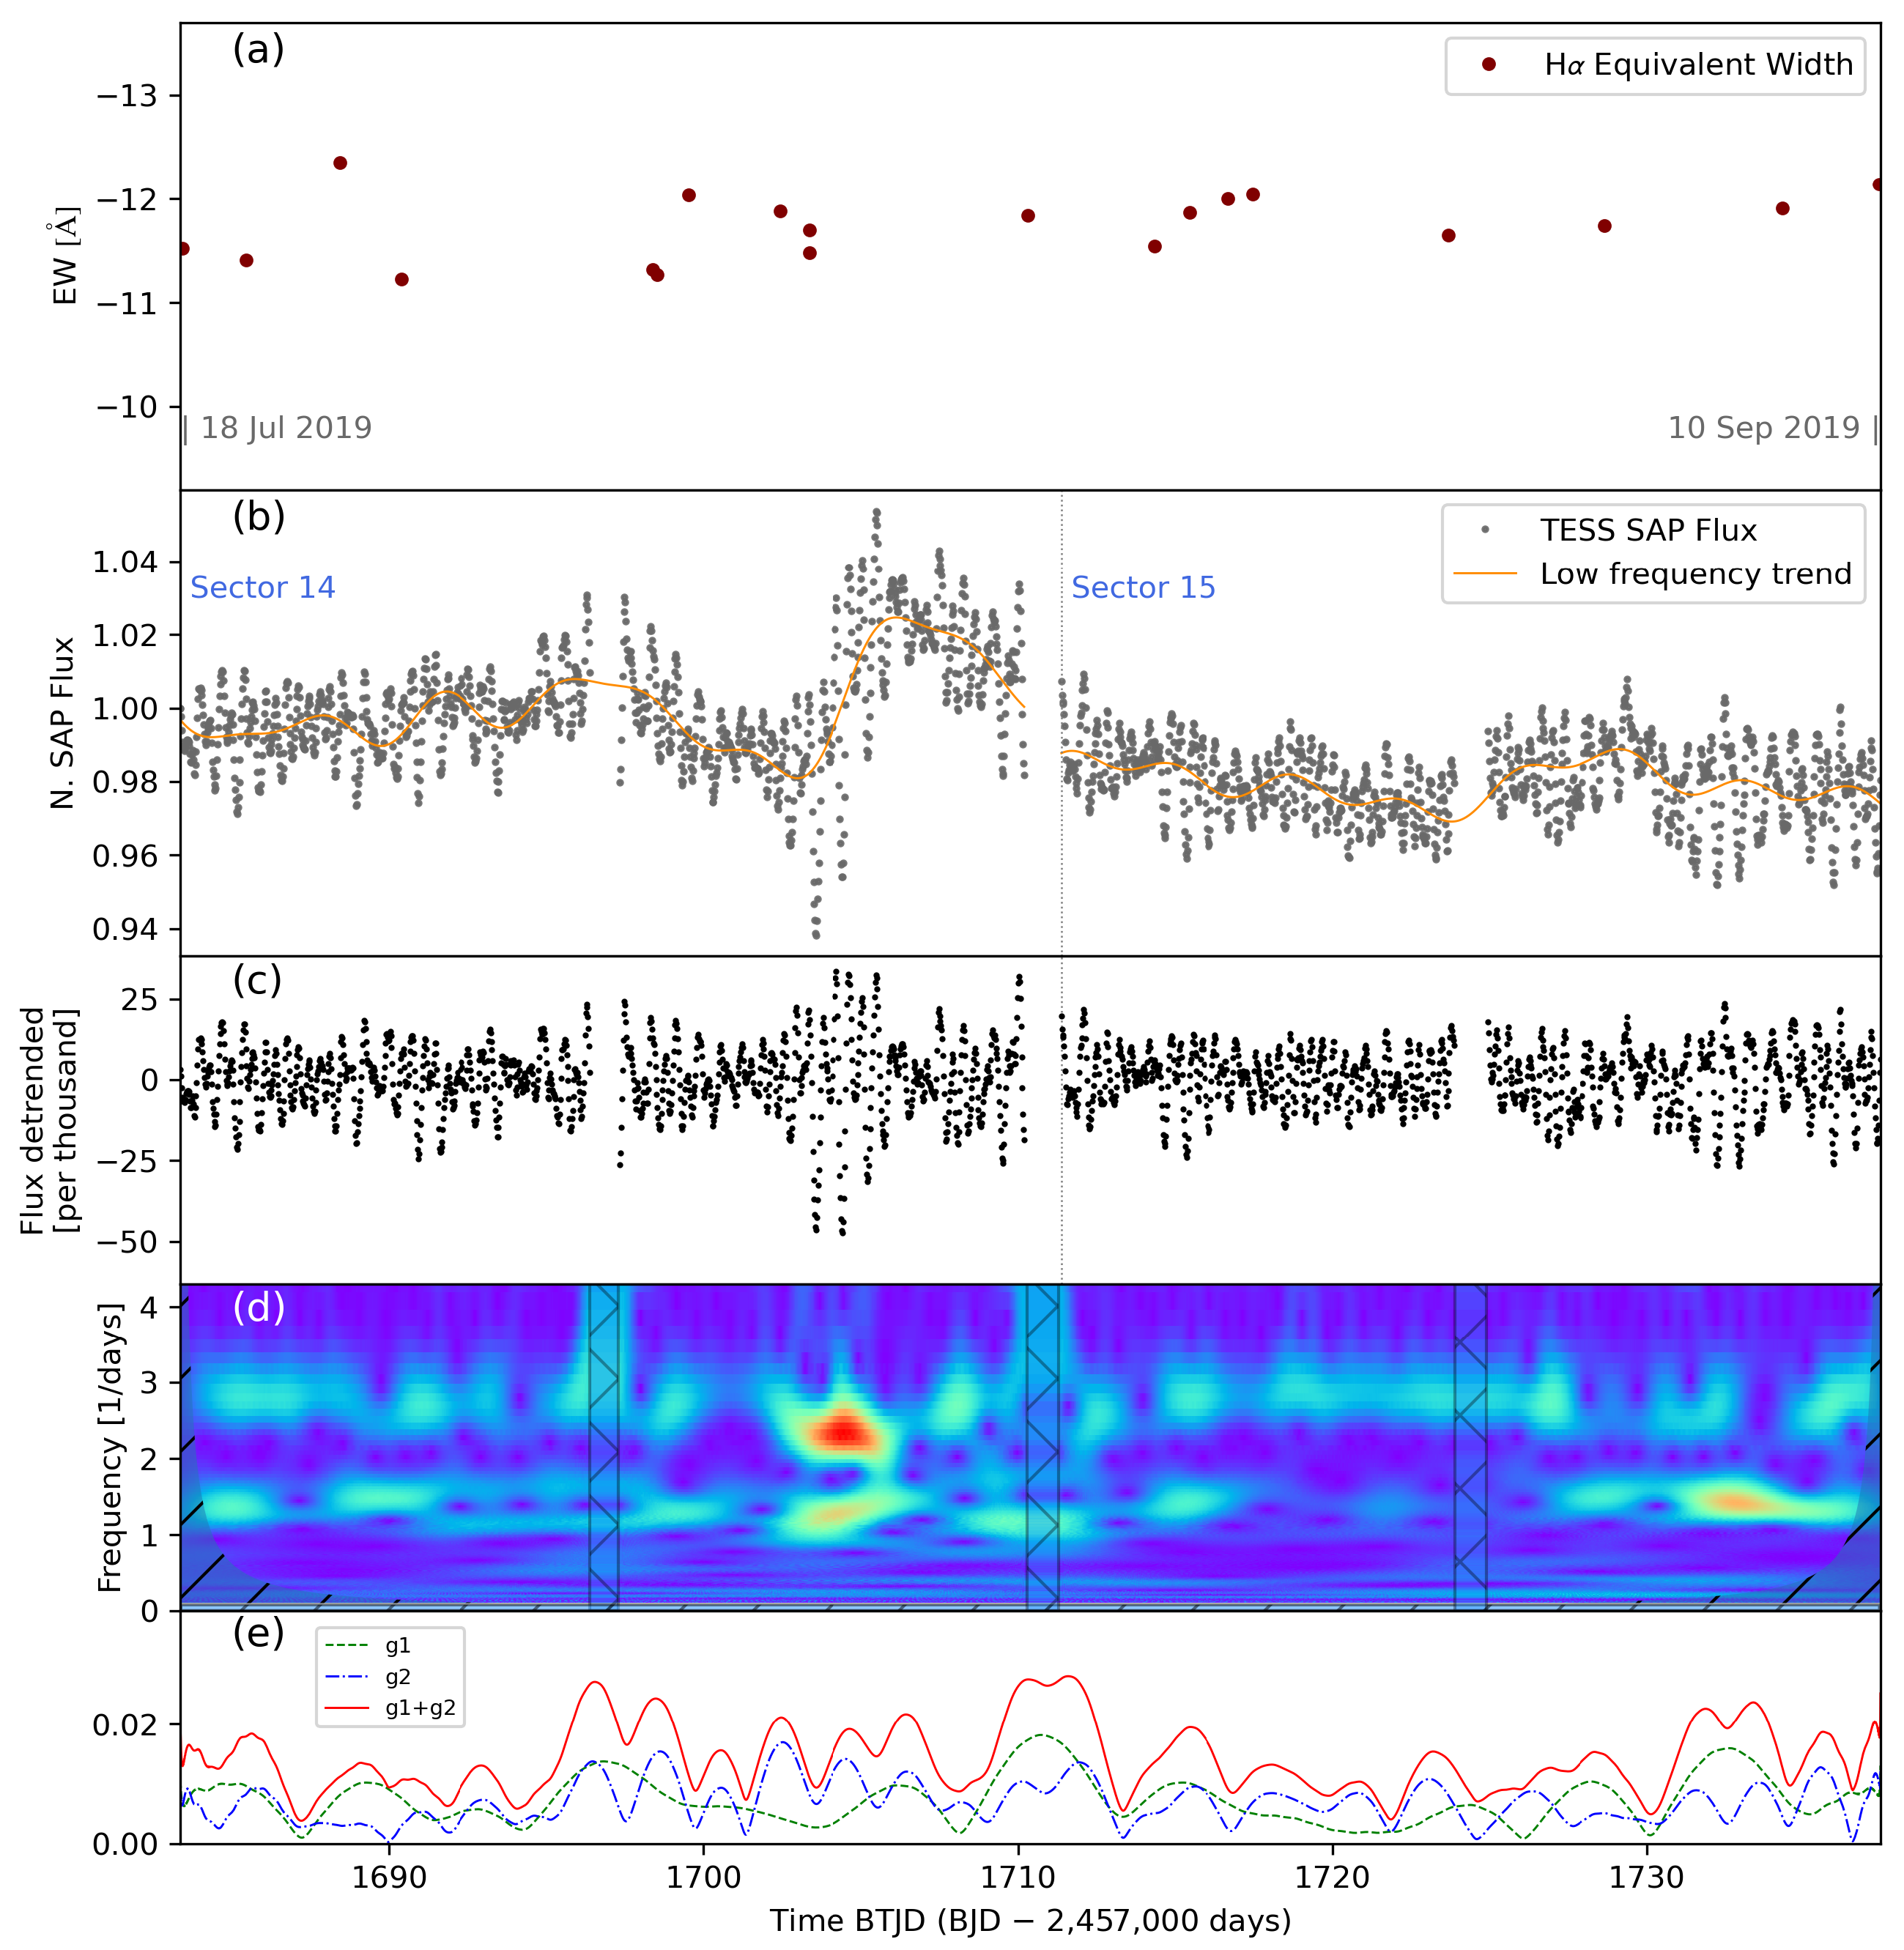
4.1. TESS Observations: Photometric Variations and Outbursts for 28 Cyg

Harmanec [43] remarked that Be stars at low inclination angles correlate between H α Balmer emission line and the brightness in the Paschen continuum. An inverse correlation occurs for stars seen near the equator, where more robust H α line emission results in a fainter star. As for HD 212044 [20], we searched for correlations between H α outbursts and photometric variations for 28 Cyg during TESS Sectors 14, 15, 54, and 55. The star’s variability can be seen in Figure 4 and Figure 5, and the behavior predicted by Harmanec [43] is more evident in Figure 5. 28 Cyg is considered by Baade et al. [37] as one of the quiet early-type Be stars, and this behavior may be seen in Figure 4 and Figure 5. Indeed, during the ≥50 days covered by each of the two TESS Sectors, the star showed a moderate-to-weak emission level with no noticeable outbursts; in Figure 4 and Figure 5, moderate brightness enhancement is observed in phase with beatings of NRP frequencies near BTJD 1705 and 2795, respectively. After this last epoch, a discrete H α EW enhancement is seen in phase with the TESS photometric level and the beating of NRP frequencies.
This star was also recently observed by TESS during sectors 81 and 82. The variability plots for these sectors are presented in Figure 6. In the new data, the characteristics of the star’s pulsations are consistent with those observed in previous sectors. Unfortunately, we do not have accompanying spectral data for this time window.

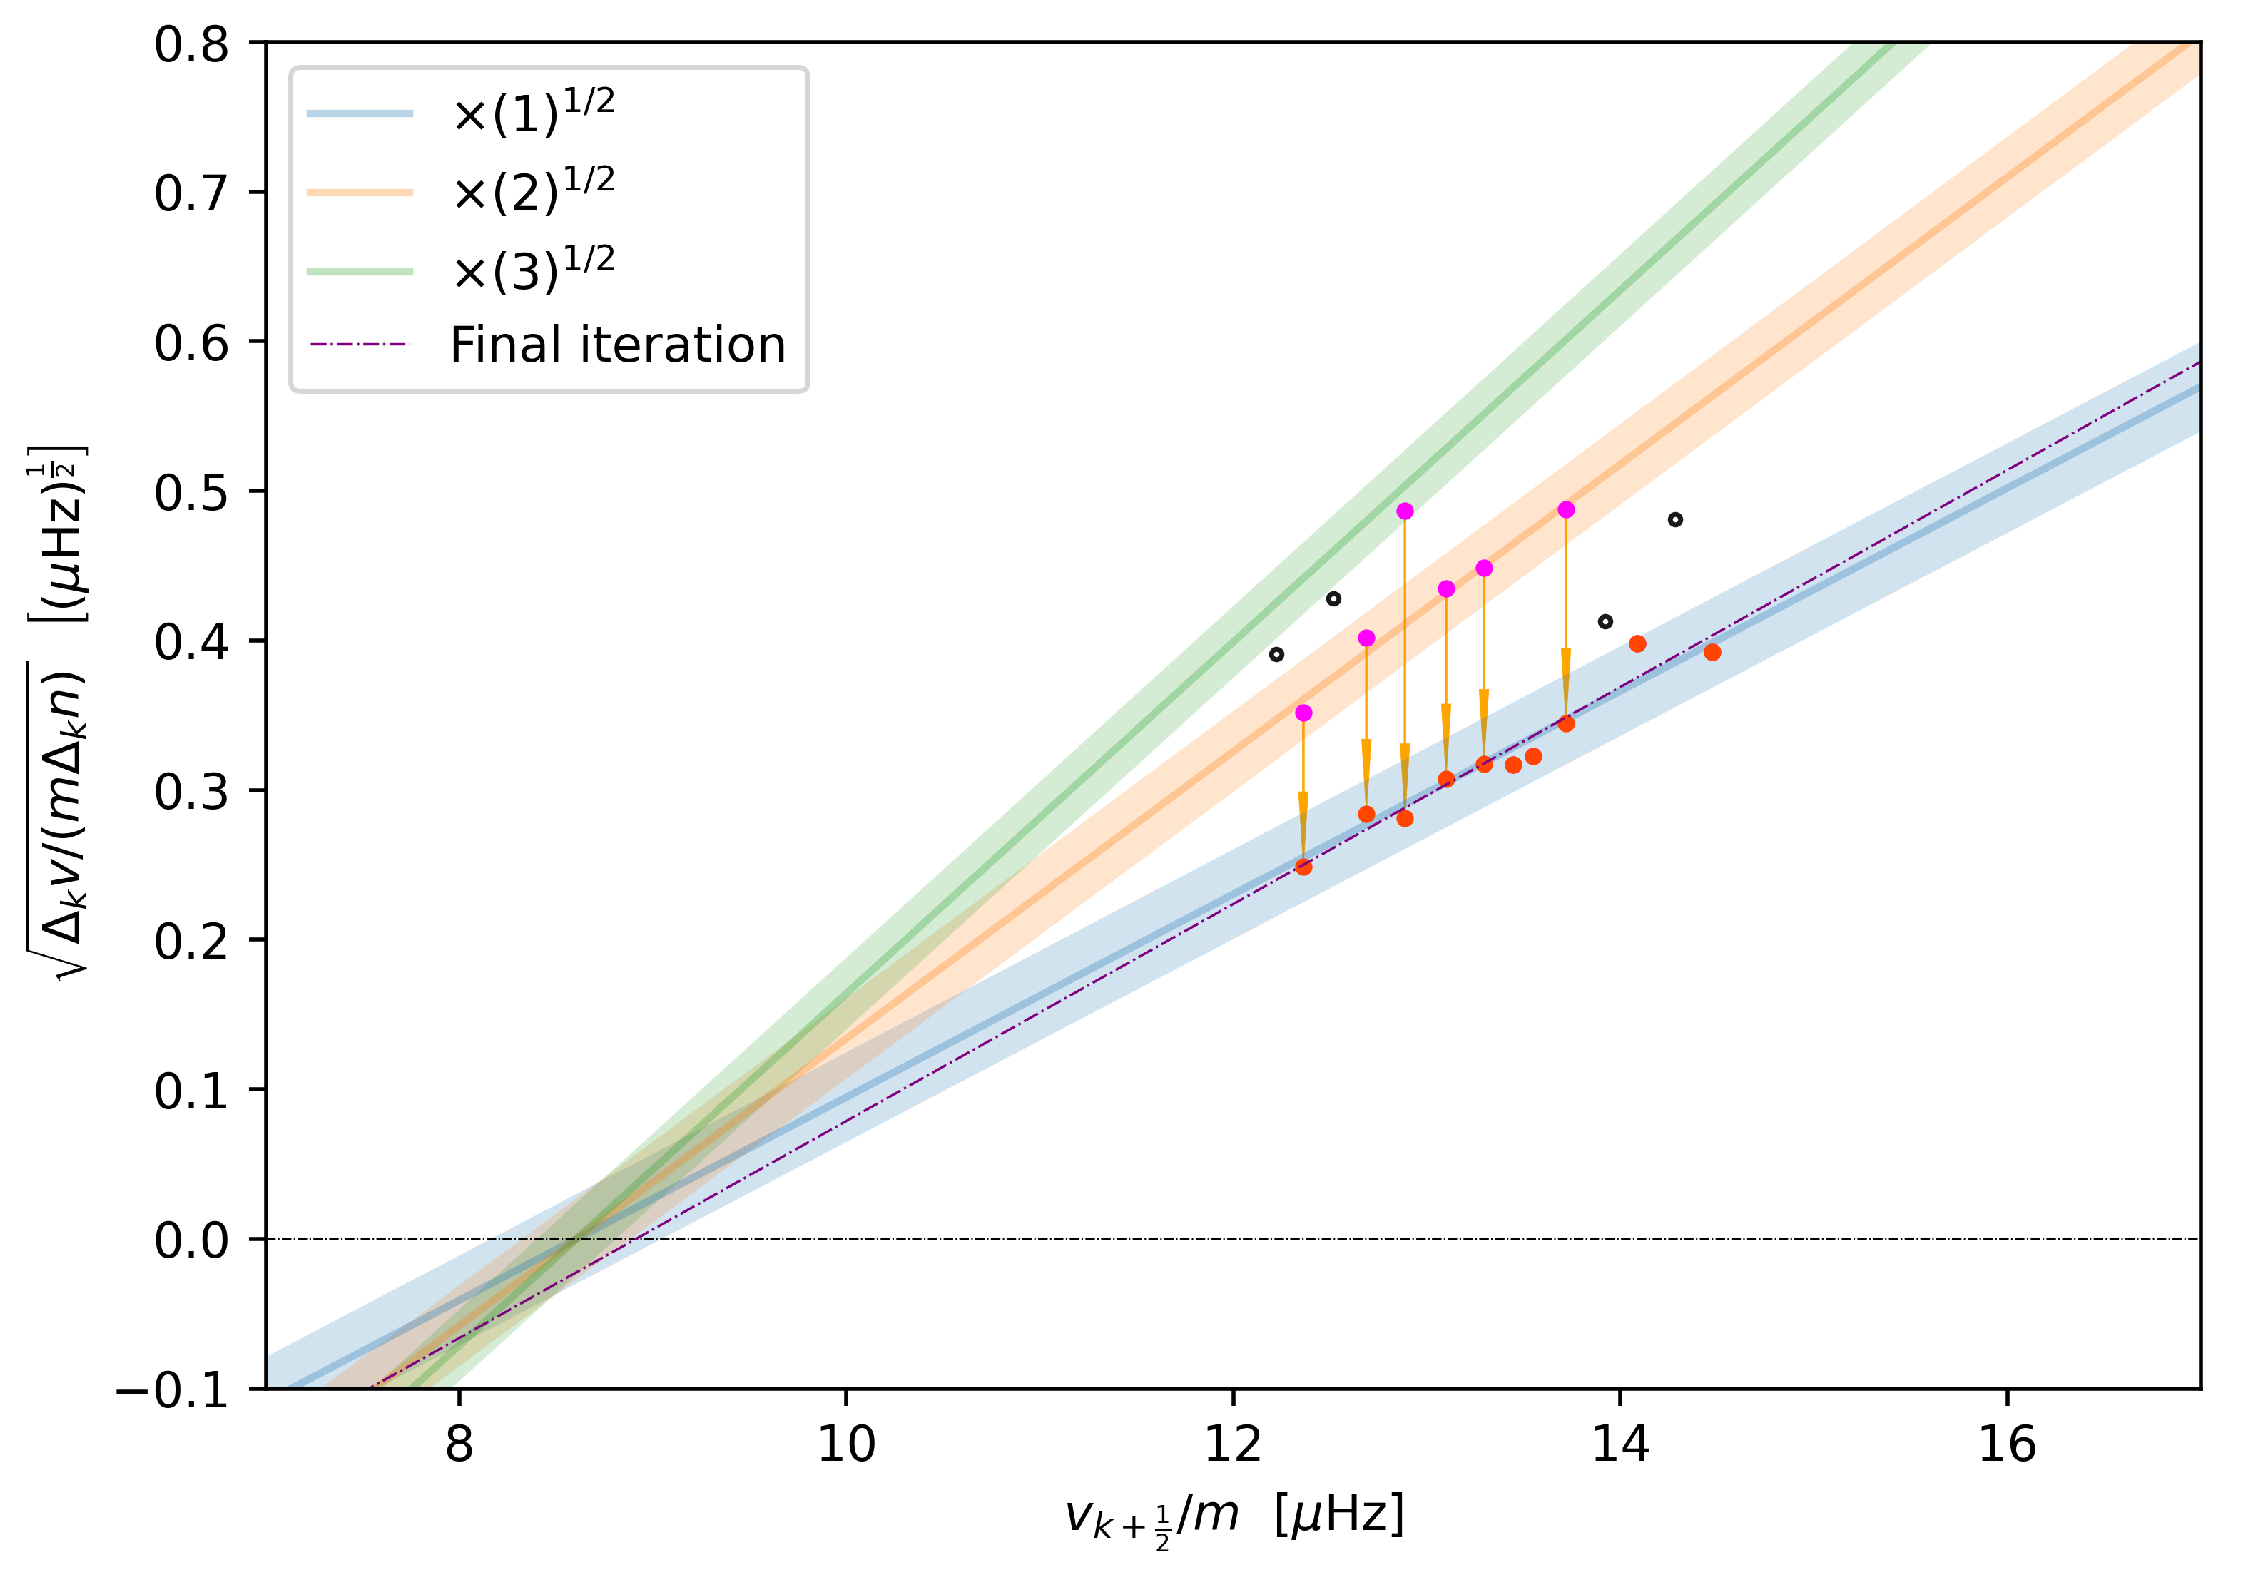
4.2. Seismic Diagnosis for 28 Cyg

We also applied to 28 Cyg the seismic analysis method developed by Takata et al. [29]. Notably, Peters and Penrod [39] previously identified a = 2 non-radial pulsation (NRP) mode in this star. Considering the tendency of B stars to pulsate with sectorial g modes (e.g., [31,32,33]), we presume this might be the case for 28 Cyg.
We applied the seismic analysis method to the frequency values of 28 Cyg in Sectors 14 and 15. We obtained an average internal rotation frequency ν r o t = 7.8 ± 0.5 μ Hz = 0.67 ± 0.06 d 1 and a buoyancy travel time P 0 = 4.6 ± 0.4 × 10 3 s . These values align with typical values of these parameters for B stars, as indicated in Pereira et al. [19], Table 3. Pereira et al. [19] also established a correlation between the dominant ν and ν r o t for B stars (their Figure 6). For 28 Cyg, the dominant frequency is around 1.4 d−1 [37], and with ν r o t = 0.67 ± 0.06 d 1 , the star’s position in the dominant ν versus ν r o t diagram aligns well with the general trend observed for pulsating B stars.
However, Baade et al. [37] estimated for the star an inclination angle of 40 < i < 75° and vsin i = 320 km/s. Within this interval, the rotation frequency ν r o t = 7.8 ± 0.5 μ Hz determined by us, and considering a typical radius for a B2 IV star (6.3 R s u n ), there is no consistent solution for the star’s inclination angle. Only for the radius characteristics of a giant star (at least 10 R s u n ), an inclination angle of 70° could be accommodated. Unfortunately, no modern spectroscopic observations and spectral classification determinations exist for 28 Cyg. Sharma et al. [44] employed machine learning techniques for spectral interpolation of physical parameters, utilizing the Miles spectral library [45]. Their results suggested a B2III spectral classification for 28 Cyg. However, the limited number of B stars in the library constrains the precision of these findings.

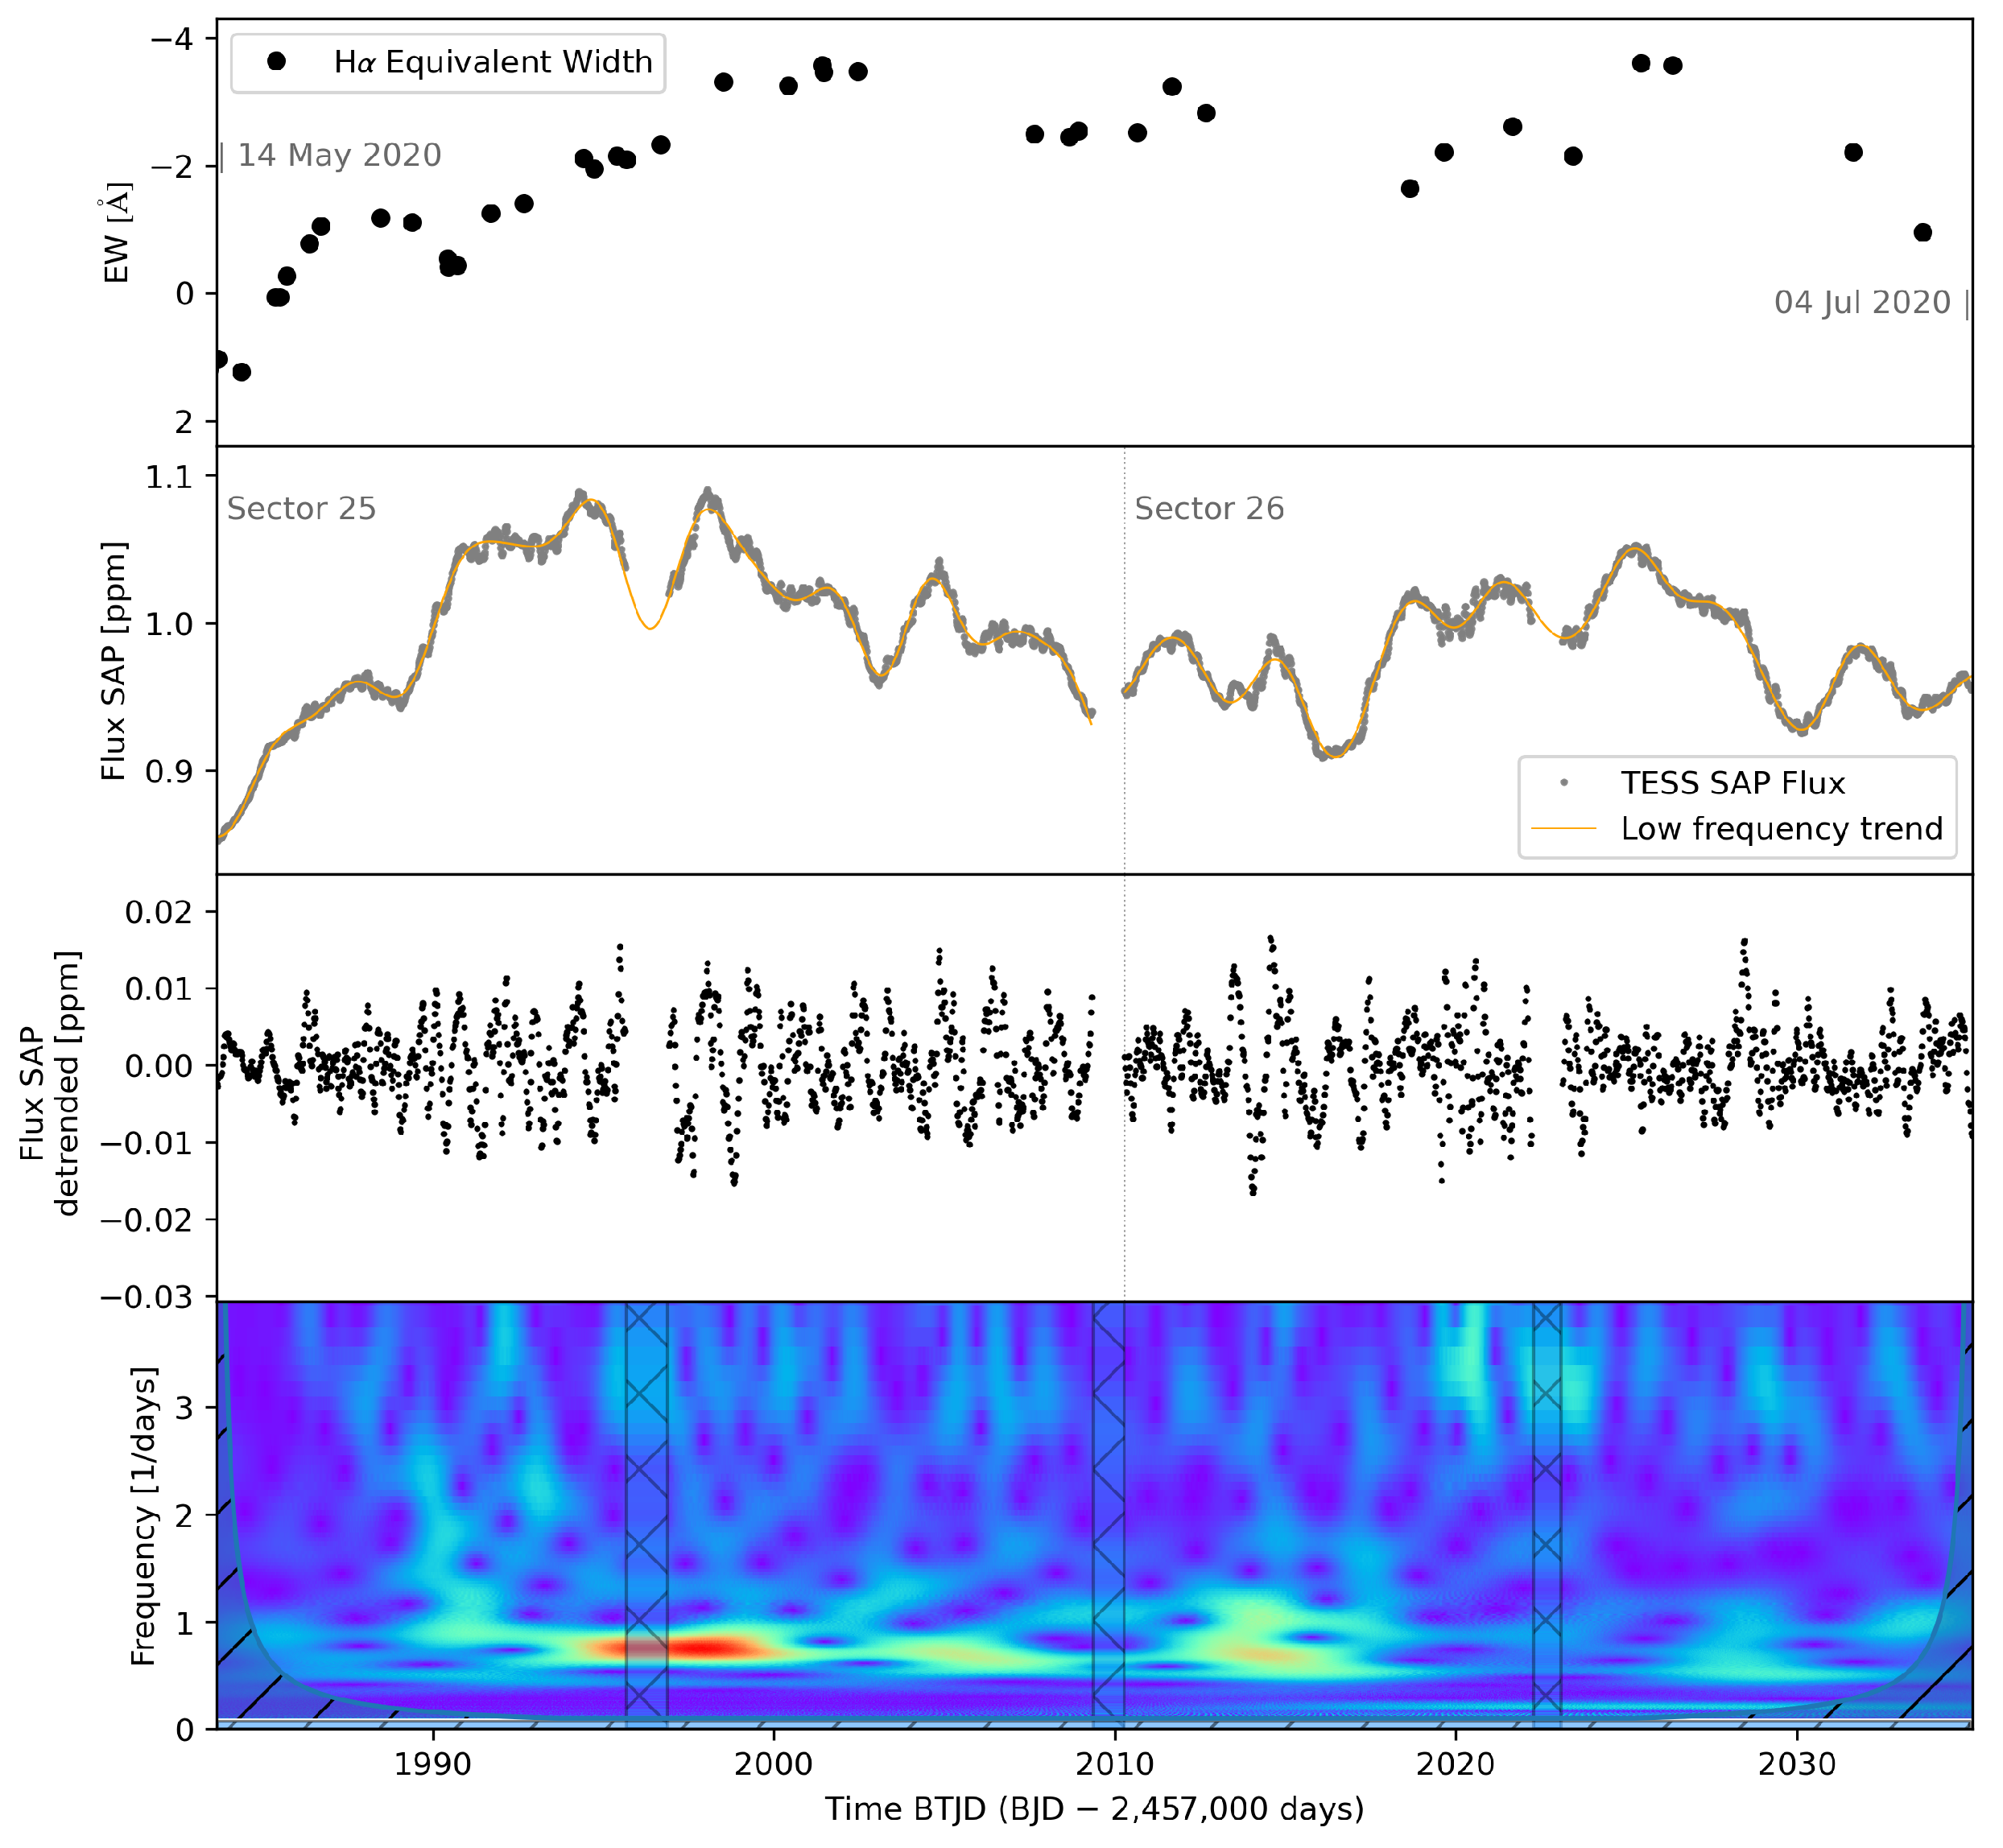
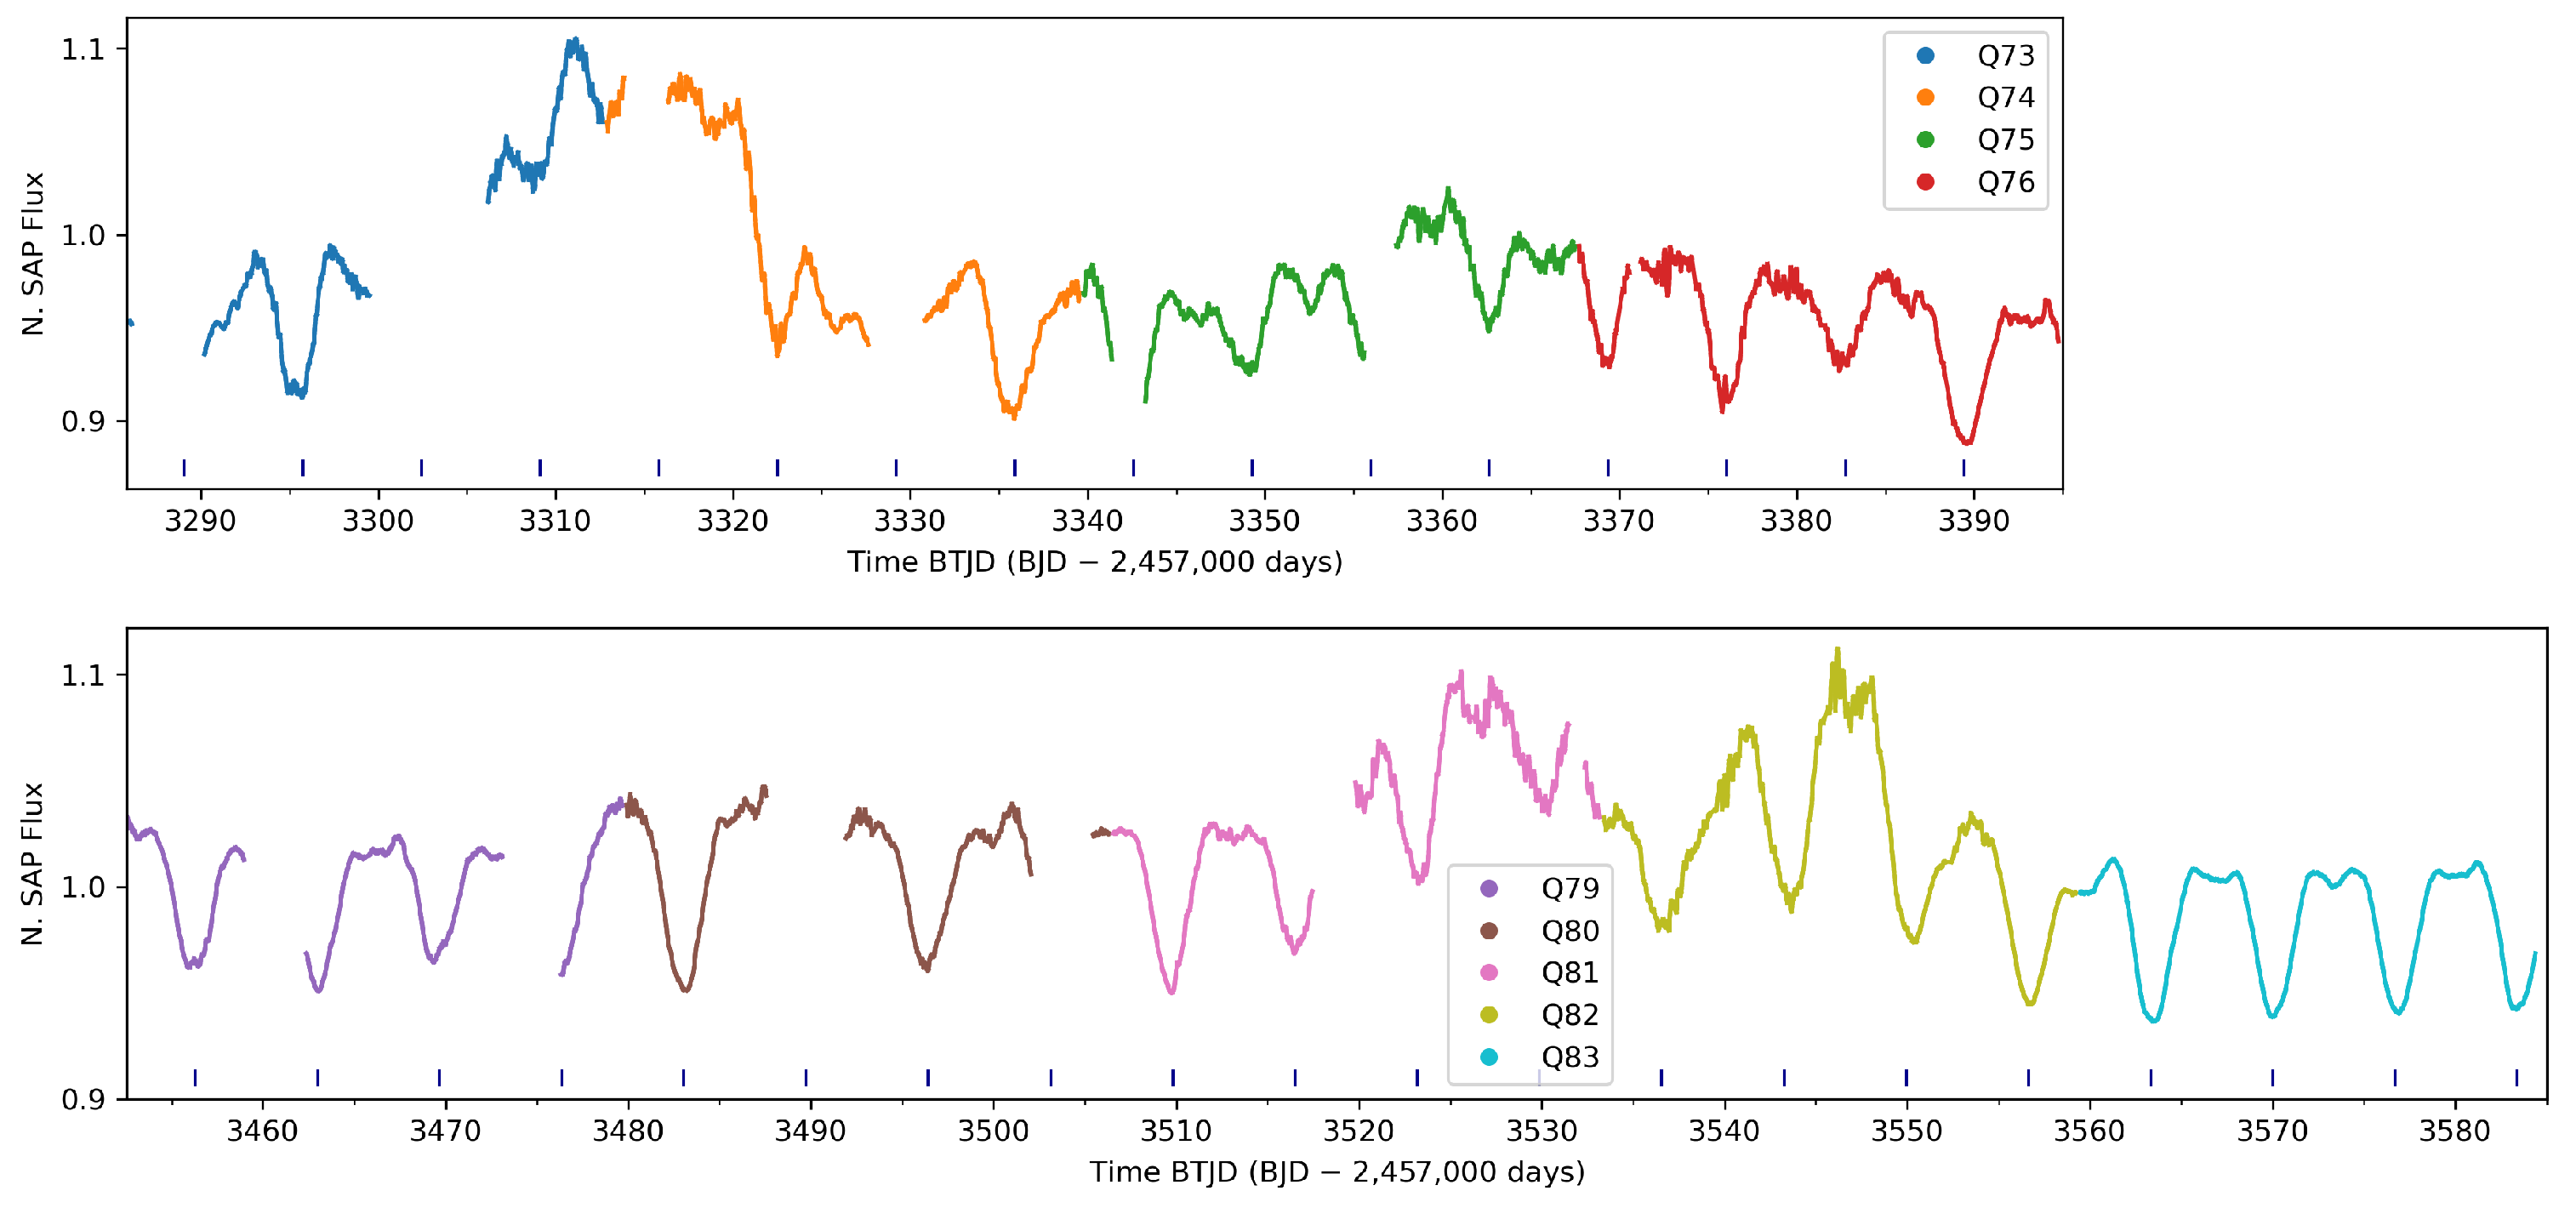
5. HD 174237/CX Dra/TIC 48022676

We decided to include the binary star HD 174237 (B3e + F5III) in this discussion as a special case whose behavior is changed by the presence of a close companion.
The star HD 174237 was first identified as a Be star by Mohler [46], who discovered its H α line in emission. Later, Harmanec and Krýz [47] stated that it was a binary system undergoing variable mass transfer, with the less massive secondary star transferring material towards the B star. Strengthening this hypothesis, Koubsky [48] confirmed that HD 174237 is a spectroscopic binary with an orbital period of 6.69 days. This study also observed significant fluctuations in the intensity of the H α and H β emission lines throughout 6 to 10 days. Furthermore, they noted a substantial dispersion in the radial velocity derived from H α and a photometric variability of up to 0.1 mag. Accordingly, this observed emission originates from the gas flow from the secondary to the primary star.
Over the years, there have been several significant developments in our understanding of this star system. One such advancement was made by Horn et al. [49], who utilized medium-resolution spectroscopy to estimate a mass ratio of 0.24 between the stars, an orbital inclination angle ranging from 52° to 55°, and identified the secondary star as having a spectral type of F5 III. In another breakthrough, Richards et al. [50] analyzed spectra collected over 23 years. Using Doppler tomography across four lines, they constructed a model of the velocity field of the system’s emission sources. Their study revealed that most of the flux originates from the gas stream flowing from the F to the B star. In contrast, the emission lines He I λ 6678, Si II λ 6371, and H β were found to primarily originate from the accretion disk formed around the B star.
Another important, complementary information concerning this binary star comes from the observations of Koubský et al. [51] of color changes in this system in the (U–B) vs. (B–V) diagram. It shows a positive relationship for Be stars (as defined in Harmanec [43]: the brighter the star, the redder is (B–V), and the bluer is (U–B). This behavior is typical of stars seen at low inclination angles, which is the case for HD 174237. Correspondingly, it is characterized by a change in spectral class between B3 V and B3 I. Regarding other parameters of the B star, Frémat et al. [52] determined vsin i = 163 ± 11 km s 1 and Ahmed and Sigut [53] reports a temperature of 17,700 K and log g = 3.6 .

TESS Observations and Variability

The H α emission star HD 174237 was observed by TESS in sectors 14, 15, 25, and 26. The dominant frequency in sectors 14 and 15 is 0.6 d−1, while in sectors 25 and 26, it shifts to 0.7 d−1. This frequency evolution highlights the star’s complex variability.
In the BeSS database, numerous spectra align with the TESS observation windows, particularly at the beginning of sector 14 and sectors 25 and 26. Figure 7 and Figure 8 show the light curves and equivalent width measurements for these periods. A correspondence between the light curve behavior and the H α emission line intensity can be seen, particularly during sectors 25 and 26 (Figure 8), where the BeSS data have higher density compared with the observations from earlier sectors. For instance, minima in the H α line emission coincide with or precede minimal TESS flux, while flux increases appear to precede enhancements in H α line intensity. This correlation suggests a connection between the star’s photometric and spectroscopic variability. However, it is important to consider that mass exchange in this binary system complicates straightforward interpretations of these correlations, unlike the more evident relationship observed in single Be stars such as HD 212044 [20]. Mass transfer dynamics can obscure or mimic photometric and spectroscopic patterns typically attributed to NRPs. During the interval BTJD 1995–2000, an increase in the star’s flux is observed (Figure 8), coinciding with the maximum amplitude of the 0.7 d−1 frequency. This behavior is characteristic of an outburst in Be stars. Moreover, the frequency range is consistent with typical non-radial pulsations (NRPs) in Be stars. However, given the binary nature of HD 174237, it is difficult to conclusively attribute these frequencies and their changes solely to NRPs. The potential influence of mass exchange between the companions introduces additional complexities, requiring a more in-depth analysis to confirm the true origin of the observed variability. This complexity is evidenced by the CX Dra light curves recently released in TESS Cycle 6, shown in Figure 9. Unfortunately, we do not have spectroscopic data collected concurrently to draw further conclusions.

6. Discussion

This study provides an analysis of the photometric and spectroscopic characteristics of the Be stars HD 212044, 28 Cyg, and HD 174237, along with an investigation of the interior properties of the first two stars using a seismic diagnostic tool. Using high-cadence data from the TESS mission and spectral data from the BeSS database, we investigated the variability and searched for underlying mechanisms driving the Be phenomenon. The strength of our approach is the comprehensive nature of our methods, including iterative prewhitening, wavelet analysis, and spectral characteristics that thoroughly explore these stars’ behaviors and properties.
The photometric variability observed in all three stars revealed distinct frequencies consistent with Be stars’ hallmark features. Non-radial pulsations (NRPs) were identified, showcasing stable and variable components over time. Seismic diagnostics applied to two stars provided two valuable parameters: the core rotation rates and buoyancy travel times.
For HD 212044, we focused on the group of frequencies between 2.0 and 2.5 d−1, corresponding to m = 2 . The rotation rate and buoyancy travel time for HD 212044 were determined to be ν rot = 8.9 ± 0.7 μ Hz ( 0.77 ± 0.06   d 1 ) and P 0 = ( 5.3 ± 0.6 ) × 10 3 s , respectively, in sectors 16 and 17. Compatible results were obtained for sectors 56 and 57, 76 and 77, and 83 and 84.
For 28 Cyg, the dominant frequency is around 1.4 d−1. The average internal rotation frequency was determined to be ν rot = 7.8 ± 0.5   μ Hz ( 0.67 ± 0.06 d 1 ), with a buoyancy travel time of P 0 = ( 4.6 ± 0.4 ) × 10 3 s .
The seismic results for HD 212044 and 28 Cyg are consistent with the average rotation rates and buoyancy travel times typically observed in B-type stars. However, unlike HD 212044, we could not identify a coherent pattern in the ν versus Δ ν diagram for 28 Cyg across the other observational sectors. The lack of a pattern may be due to the detected frequencies for 28 Cyg not corresponding to prograde g-mode oscillations, as Takata’s method only applies to these modes. In contrast, the results for HD 212044 are consistent across multiple TESS sectors, demonstrating that the frequencies identified are not random. This strengthens our findings for HD 212044 and highlights the method’s applicability, even with shorter observation periods. Additionally, TESS observations allow us to explore variability on timescales and amplitudes that are otherwise challenging to observe with ground-based observations.
Our analysis of the spectra from the BeSS database showed significant variability in the H α emission line and how it is related to the photometric changes observed in TESS data. Equivalent width measurements offer a robust method for assessing emission variability, reflecting the dynamic processes of mass ejection and disk formation in Be stars. HD 212044 exhibits a strong negative correlation between photometric brightness and H α equivalent width. Given the star’s low inclination angle, this negative correlation challenges the established understanding of Be star behavior. Pereira et al. [20]
At the end of sector 54, 28 Cyg displays an outburst. To confirm the validity of this event, we analyzed the light curves of three nearby B stars observed by TESS during the same period: HD 227892, HD 191456, and HD 191720. These stars, located in the same camera and CCD as 28 Cyg (camera 3, CCD 2 in sector 54; camera 3, CCD 1 in sector 55), were used for comparison. None of these stars exhibited similar behavior to 28 Cyg at the end of sector 54 or the beginning of sector 55, confirming that the observed outburst is intrinsic to 28 Cyg and not due to external contamination. These measurements align well with theoretical expectations for pulsating B stars and contribute to our understanding of their internal rotation profiles and angular momentum distribution.
The variability observed in HD 174237, driven by mass transfer in a semi-detached binary system, highlights the importance of distinguishing classical Be stars from interacting binaries. In classical Be stars, mass ejection results from rapid rotation and NRPs, forming a stable circumstellar disk. In contrast, interacting binaries exhibit variability caused by episodic or continuous mass transfer, often leading to complex and irregular changes in brightness and spectral features. HD 174237 presents a particularly complex case as a Be star in a binary system. Its observed variability may arise from multiple factors, including the Be star’s intrinsic outbursts or disk oscillations and processes associated with binary interaction, such as accretion streams, Roche lobe overflow, or transient disk formation due to mass transfer. This dual nature complicates the interpretation of light curves and spectral lines, such as H α , requiring careful analysis to separate these overlapping sources of variability. Failing to differentiate between these mechanisms can lead to misinterpretations of observational data, particularly regarding the origin of circumstellar material and variability patterns.
This study illustrates the value of using diverse data sources to investigate Be stars. By combining high-quality space-based photometry from TESS with ground-based spectroscopic observations, we gain a more comprehensive understanding of the complex interactions between stellar pulsations, rotation, and the circumstellar environment.

Author Contributions

Conceptualization, methodology, validation, formal analysis, investigation, and writing—review and editing, all authors; software and data curation, A.W.P.; resources, supervision, project administration, and funding acquisition, M.E. and E.J.-P.; writing—original draft preparation and visualization, all authors. All authors have read and agreed to the published version of the manuscript.

Funding

This study was financed in part by the Coordenação de Aperfeiçoamento de Pessoal de Nível Superior—Brazil (CAPES)—Finance Code 001, by Fundação de Amparo à Pesquisa do Estado de São Paulo (FAPESP) through grant 2016/13750-6, and by the State of Paraná Secretary of Science, Technology and Higher Education—Fundo Paraná grant 031/2024. M.E. gratefully acknowledges the financial support of the “Fenômenos Extremos do Universo” of the Fundação Araucária grant 348/2024.

Data Availability Statement

The TESS data presented in the study are openly available in Mikulski Archive for Space Telescopes (MAST) at https://archive.stsci.edu/missions-and-data/tess (accessed on 10 January 2025). The Spectral data presented in the study are openly available on the Be Star Spectra Database at http://basebe.obspm.fr (accessed on 5 October 2024).

Acknowledgments

This work has made use of the BeSS database, operated at LESIA, Observatoire de Meudon, France: http://basebe.obspm.fr (accessed on 5 October 2024). This paper includes data collected by the TESS mission. Funding for the TESS mission is provided by the NASA’s Science Mission Directorate.

Conflicts of Interest

The authors declare no conflicts of interest.

References

  1. Secchi, A. Schreiben des Herrn Prof. Secchi, Directors der Sternwarte des Collegio Romano, an den Herausgeber. Astron. Nachrichten 1866, 68, 63. [Google Scholar] [CrossRef]
  2. Rivinius, T.; Carciofi, A.C.; Martayan, C. Classical Be stars. Rapidly rotating B stars with viscous Keplerian decretion disks. Astron. Astrophys. Rev. 2013, 21, 69. [Google Scholar] [CrossRef]
  3. Struve, O. On the Origin of Bright Lines in Spectra of Stars of Class B. Astrophys. J. 1931, 73, 94. [Google Scholar] [CrossRef]
  4. Brown, T.M.; Gilliland, R.L. Asteroseismology. Annu. Rev. Astron. Astrophys. 1994, 32, 37–82. [Google Scholar] [CrossRef]
  5. Aerts, C.; Christensen-Dalsgaard, J.; Kurtz, D.W. Asteroseismology; Springer: Dordrecht, The Netherlands, 2010. [Google Scholar] [CrossRef]
  6. Bowman, D.M.; Bugnet, L. Asteroseismology. arXiv 2024, arXiv:2410.01715. [Google Scholar] [CrossRef]
  7. Kuschnig, R. Space observations of O and B stars with MOST. Commun. Asteroseismol. 2009, 158, 162. [Google Scholar]
  8. Wright, E.L.; Eisenhardt, P.R.M.; Mainzer, A.K.; Ressler, M.E.; Cutri, R.M.; Jarrett, T.; Kirkpatrick, J.D.; Padgett, D.; McMillan, R.S.; Skrutskie, M.; et al. The Wide-field Infrared Survey Explorer (WISE): Mission Description and Initial On-orbit Performance. Astron. J. 2010, 140, 1868–1881. [Google Scholar] [CrossRef]
  9. Auvergne, M.; Bodin, P.; Boisnard, L.; Buey, J.T.; Chaintreuil, S.; Epstein, G.; Jouret, M.; Lam-Trong, T.; Levacher, P.; Magnan, A.; et al. The CoRoT satellite in flight: Description and performance. Astron. Astrophys. 2009, 506, 411–424. [Google Scholar] [CrossRef]
  10. Caldwell, D.A.; van Cleve, J.E.; Jenkins, J.M.; Argabright, V.S.; Kolodziejczak, J.J.; Dunham, E.W.; Geary, J.C.; Tenenbaum, P.; Chandrasekaran, H.; Li, J.; et al. Kepler instrument performance: An in-flight update. In Proceedings of the Space Telescopes and Instrumentation 2010: Optical, Infrared, and Millimeter Wave, San Diego, CA, USA, 27 June–2 July 2010; Oschmann, J.M., Jr., Clampin, M.C., MacEwen, H.A., Eds.; Society of Photo-Optical Instrumentation Engineers (SPIE) Conference Series. SPIE: Bellingham, WA, USA, 2010; Volume 7731, p. 773117. [Google Scholar] [CrossRef]
  11. Andrade, L.; Janot-Pacheco, E.; Emilio, M.; Frémat, Y.; Neiner, C.; Poretti, E.; Mathias, P.; Rainer, M.; Suárez, J.C.; Uytterhoeven, K.; et al. Photometric and spectroscopic variability of the B5IIIe star HD 171219. Astron. Astrophys. 2017, 603, A41. [Google Scholar] [CrossRef]
  12. Neiner, C.; Floquet, M.; Samadi, R.; Espinosa Lara, F.; Frémat, Y.; Mathis, S.; Leroy, B.; de Batz, B.; Rainer, M.; Poretti, E.; et al. Stochastic gravito-inertial modes discovered by CoRoT in the hot Be star HD 51452. Astron. Astrophys. 2012, 546, A47. [Google Scholar] [CrossRef]
  13. Emilio, M.; Andrade, L.; Janot-Pacheco, E.; Baglin, A.; Gutiérrez-Soto, J.; Suárez, J.C.; de Batz, B.; Diago, P.; Fabregat, J.; Floquet, M.; et al. Photometric variability of the Be star CoRoT-ID 102761769. Astron. Astrophys. 2010, 522, A43. [Google Scholar] [CrossRef]
  14. Neiner, C.; Gutiérrez-Soto, J.; Baudin, F.; de Batz, B.; Frémat, Y.; Huat, A.L.; Floquet, M.; Hubert, A.M.; Leroy, B.; Diago, P.D.; et al. The pulsations of the B5IVe star HD 181231 observed with CoRoT and ground-based spectroscopy. Astron. Astrophys. 2009, 506, 143–151. [Google Scholar] [CrossRef]
  15. Gutiérrez-Soto, J.; Floquet, M.; Samadi, R.; Neiner, C.; Garrido, R.; Fabregat, J.; Frémat, Y.; Diago, P.D.; Huat, A.L.; Leroy, B.; et al. Low-amplitude variations detected by CoRoT in the B8IIIe star HD 175869. Astron. Astrophys. 2009, 506, 133–141. [Google Scholar] [CrossRef]
  16. Diago, P.D.; Gutiérrez-Soto, J.; Auvergne, M.; Fabregat, J.; Hubert, A.M.; Floquet, M.; Frémat, Y.; Garrido, R.; Andrade, L.; de Batz, B.; et al. Pulsations in the late-type Be star HD 50 209 detected by CoRoT. Astron. Astrophys. 2009, 506, 125–131. [Google Scholar] [CrossRef]
  17. Floquet, M.; Hubert, A.M.; Huat, A.L.; Frémat, Y.; Janot-Pacheco, E.; Gutiérrez-Soto, J.; Neiner, C.; de Batz, B.; Leroy, B.; Poretti, E.; et al. The B0.5 IVe CoRoT target HD 49330. II. Spectroscopic ground-based observations. Astron. Astrophys. 2009, 506, 103–110. [Google Scholar] [CrossRef]
  18. Huat, A.L.; Hubert, A.M.; Baudin, F.; Floquet, M.; Neiner, C.; Frémat, Y.; Gutiérrez-Soto, J.; Andrade, L.; de Batz, B.; Diago, P.D.; et al. The B0.5IVe CoRoT target HD 49330. I. Photometric analysis from CoRoT data. Astron. Astrophys. 2009, 506, 95–101. [Google Scholar] [CrossRef]
  19. Pereira, A.W.; Janot-Pacheco, E.; Emilio, M.; Andrade, L.; Armstrong, J.D.; Eidam, J.M.; Rabello-Soares, M.C.; da Silva, B.V.H.V. Characterizing B stars from Kepler/K2 Campaign 11. Optical analysis and seismic diagnostics. Astron. Astrophys. 2024, 686, A20. [Google Scholar] [CrossRef]
  20. Pereira, A.W.; Janot-Pacheco, E.; Andrade, L.; Emilio, M. The persistent Be enigma: The case of HD 212044. Astron. Astrophys. 2024, 691, L4. [Google Scholar] [CrossRef]
  21. Jenkins, J.M.; Twicken, J.D.; McCauliff, S.; Campbell, J.; Sanderfer, D.; Lung, D.; Mansouri-Samani, M.; Girouard, F.; Tenenbaum, P.; Klaus, T.; et al. The TESS science processing operations center. In Proceedings of the Software and Cyberinfrastructure for Astronomy IV, Edinburgh, UK, 26–30 June 2016; Chiozzi, G., Guzman, J.C., Eds.; Society of Photo-Optical Instrumentation Engineers (SPIE) Conference Series. SPIE: Bellingham, WA, USA, 2016; Volume 9913, p. 99133E. [Google Scholar] [CrossRef]
  22. Smith, J.C.; Morris, R.L.; Jenkins, J.M.; Bryson, S.T.; Caldwell, D.A.; Girouard, F.R. Kepler Data Processing Handbook: Finding Optimal Apertures in Kepler Data; Kepler Science Document KSCI-19081-002; NASA Ames Research Center: Mountain View, CA, USA, 2017. [Google Scholar]
  23. Labadie-Bartz, J.; Carciofi, A.C.; Henrique de Amorim, T.; Rubio, A.; Luiz Figueiredo, A.; Ticiani dos Santos, P.; Thomson-Paressant, K. Classifying Be Star Variability With TESS. I. The Southern Ecliptic. Astron. J. 2022, 163, 226. [Google Scholar] [CrossRef]
  24. Degroote, P.; Aerts, C.; Ollivier, M.; Miglio, A.; Debosscher, J.; Cuypers, J.; Briquet, M.; Montalbán, J.; Thoul, A.; Noels, A.; et al. CoRoT’s view of newly discovered B-star pulsators: Results for 358 candidate B pulsators from the initial run’s exoplanet field data. Astron. Astrophys. 2009, 506, 471–489. [Google Scholar] [CrossRef]
  25. Scargle, J.D. Studies in astronomical time series analysis. II. Statistical aspects of spectral analysis of unevenly spaced data. Astrophys. J. 1982, 263, 835–853. [Google Scholar] [CrossRef]
  26. Baran, A.S.; Koen, C. A Detection Threshold in the Amplitude Spectra Calculated from TESS Time-Series Data. Acta Astron. 2021, 71, 113–121. [Google Scholar] [CrossRef]
  27. Daubechies, I.; Heil, C. Ten Lectures on Wavelets. Comput. Phys. 1992, 6, 697. [Google Scholar] [CrossRef]
  28. Neiner, C.; de Batz, B.; Cochard, F.; Floquet, M.; Mekkas, A.; Desnoux, V. The Be Star Spectra (BeSS) Database. Astron. J. 2011, 142, 149. [Google Scholar] [CrossRef]
  29. Takata, M.; Ouazzani, R.M.; Saio, H.; Christophe, S.; Ballot, J.; Antoci, V.; Salmon, S.J.A.J.; Hijikawa, K. A diagnostic diagram for γ Doradus variables and slowly pulsating B-type stars. Astron. Astrophys. 2020, 635, A106. [Google Scholar] [CrossRef]
  30. Rivinius, T.; Baade, D.; Štefl, S. Non-radially pulsating Be stars. Astron. Astrophys. 2003, 411, 229–247. [Google Scholar] [CrossRef]
  31. Van Reeth, T.; Tkachenko, A.; Aerts, C.; Pápics, P.I.; Triana, S.A.; Zwintz, K.; Degroote, P.; Debosscher, J.; Bloemen, S.; Schmid, V.S.; et al. Gravity-mode Period Spacings as a Seismic Diagnostic for a Sample of γ Doradus Stars from Kepler Space Photometry and High-resolution Ground-based Spectroscopy. Astrophys. J. Suppl. Ser. 2015, 218, 27. [Google Scholar] [CrossRef]
  32. Pápics, P.I.; Tkachenko, A.; Van Reeth, T.; Aerts, C.; Moravveji, E.; Van de Sande, M.; De Smedt, K.; Bloemen, S.; Southworth, J.; Debosscher, J.; et al. Signatures of internal rotation discovered in the Kepler data of five slowly pulsating B stars. Astron. Astrophys. 2017, 598, A74. [Google Scholar] [CrossRef]
  33. Li, G.; Van Reeth, T.; Bedding, T.R.; Murphy, S.J.; Antoci, V. Period spacings of γ Doradus pulsators in the Kepler field: Rossby and gravity modes in 82 stars. Mon. Not. R. Astron. Soc. 2019, 487, 782–800. [Google Scholar] [CrossRef]
  34. Aerts, C.; Mathis, S.; Rogers, T.M. Angular Momentum Transport in Stellar Interiors. Annu. Rev. Astron. Astrophys. 2019, 57, 35–78. [Google Scholar] [CrossRef]
  35. Straizys, V.; Kuriliene, G. Fundamental Stellar Parameters Derived from the Evolutionary Tracks. Astrophys. Space Sci. 1981, 80, 353–368. [Google Scholar] [CrossRef]
  36. Harmanec, P.; Morand, F.; Bonneau, D.; Jiang, Y.; Yang, S.; Guinan, E.F.; Hall, D.S.; Mourard, D.; Hadrava, P.; Bozic, H.; et al. Jet-like structures in β Lyrae. Results of optical interferometry, spectroscopy and photometry. Astron. Astrophys. 1996, 312, 879–896. [Google Scholar]
  37. Baade, D.; Pigulski, A.; Rivinius, T.; Carciofi, A.C.; Panoglou, D.; Ghoreyshi, M.R.; Handler, G.; Kuschnig, R.; Moffat, A.F.J.; Pablo, H.; et al. Short-term variability and mass loss in Be stars. III. BRITE and SMEI satellite photometry of 28 Cygni. Astron. Astrophys. 2018, 610, A70. [Google Scholar] [CrossRef]
  38. Gies, D.R.; Percy, J.R. Photometric variability of 29 Cygni. Astron. J. 1977, 82, 166–168. [Google Scholar] [CrossRef]
  39. Peters, G.J.; Penrod, G.D. Short-term wind variability in the nonradially pulsating Be star 28 Cyg. In ESA Special Publication; Longdon, N., Rolfe, E.J., Eds.; ESA: Paris, France, 1988; Volume 2, pp. 117–120. [Google Scholar]
  40. Slettebak, A. Spectral types and rotational velocities of the brighter Be stars and A-F type shell stars. Astrophys. J. Suppl. Ser. 1982, 50, 55–83. [Google Scholar] [CrossRef]
  41. Sigut, T.A.A.; Ghafourian, N.R. Comparing Be Star Inclination Angles Determined from Hα Fitting and Gravitational Darkening. Astrophys. J. 2023, 948, 34. [Google Scholar] [CrossRef]
  42. Tubbesing, S.; Rivinius, T.; Wolf, B.; Kaufer, A. Multiperiodic Variability and Outbursts of 28 Cygni. In Proceedings of the IAU Colloq. 175: The Be Phenomenon in Early-Type Stars, Alicante, Spain, 28 June–2 July 1999; Smith, M.A., Henrichs, H.F., Fabregat, J., Eds.; Astronomical Society of the Pacific Conference Series. Cambridge University Press: Cambridge, UK, 2000; Volume 214, p. 232. [Google Scholar]
  43. Harmanec, P. Review of observational facts about Be stars. Hvar Obs. Bull. 1983, 7, 55–88. [Google Scholar]
  44. Sharma, K.; Singh, H.P.; Gupta, R.; Kembhavi, A.; Vaghmare, K.; Shi, J.; Zhao, Y.; Zhang, J.; Wu, Y. Stellar spectral interpolation using machine learning. Mon. Not. R. Astron. Soc. 2020, 496, 5002–5016. [Google Scholar] [CrossRef]
  45. Sánchez-Blázquez, P.; Peletier, R.F.; Jiménez-Vicente, J.; Cardiel, N.; Cenarro, A.J.; Falcón-Barroso, J.; Gorgas, J.; Selam, S.; Vazdekis, A. Medium-resolution Isaac Newton Telescope library of empirical spectra. Mon. Not. R. Astron. Soc. 2006, 371, 703–718. [Google Scholar] [CrossRef]
  46. Mohler, O. Six New BE Stars. Astrophys. J. 1940, 92, 315. [Google Scholar] [CrossRef]
  47. Harmanec, P.; Krýz, S. Duplicity of be Stars as Seen from ONDrEJOV (review Paper). In Be and Shell Stars; Slettebak, A., Ed.; IAU Symposium; D. Reidel: Dordrecht, The Netherlands, 1976; Volume 70, p. 385. [Google Scholar]
  48. Koubsky, P. Properties and Nature of Be and Shell Stars. 9. Periodic Radial-velocity Changes of HD 174237. Bull. Astron. Inst. Czechoslov. 1978, 29, 288. [Google Scholar]
  49. Horn, J.; Hubert, A.M.; Hubert, H.; Koubsky, P.; Bailloux, N. CX Draconis: The orbit parameters for both components. Astron. Astrophys. 1992, 259, L5–L8. [Google Scholar]
  50. Richards, M.T.; Koubský, P.; Šimon, V.; Peters, G.J.; Hirata, R.; Škoda, P.; Masuda, S. A Multiwavelength Study of Spectral Variations in the CX Draconis Binary. Astrophys. J. 2000, 531, 1003–1027. [Google Scholar] [CrossRef]
  51. Koubský, P.; Harmanec, P.; Brož, M.; Kotková, L.; Yang, S.; Božić, H.; Sudar, D.; Frémat, Y.; Korčáková, D.; Votruba, V.; et al. Properties and nature of Be stars. 31. The binary nature, light variability, physical elements, and emission-line changes of HD 81357. Astron. Astrophys. 2019, 629, A105. [Google Scholar] [CrossRef]
  52. Frémat, Y.; Zorec, J.; Hubert, A.M.; Floquet, M. Effects of gravitational darkening on the determination of fundamental parameters in fast-rotating B-type stars. Astron. Astrophys. 2005, 440, 305–320. [Google Scholar] [CrossRef]
  53. Ahmed, A.; Sigut, T.A.A. Rotational mixing in Be stars: Nitrogen abundances for a sample of Be stars from the MiMeS survey. Mon. Not. R. Astron. Soc. 2017, 471, 3398–3418. [Google Scholar] [CrossRef]
Figure 1. The figure shows the frequency spectrum for each pair of TESS sectors of 28 Cyg. Orange triangles and dashed lines indicate the frequencies detected using the iterative prewhitening method, with S/N ≥ 5. The red line represents a simple Lomb–Scargle periodogram. Two distinct groups of frequencies are evident: a first one primarily between 1.1 and 1.6 d−1, and a second one between 2.4 and 3.0 d−1. Many frequencies remain consistent across the two observation segments.
Universe 11 00071 g001
Figure 2. ν versus Δ ν diagram for HD 212044, with frequencies determined during TESS sectors 16 and 17. In Takata et al. [29]’s method, the intercept of the final fitting with the 0.0 line estimates the star’s average rotation frequency, and its slope measures the buoyancy travel time of the gravity oscillations, P 0 . Magenta circles indicate modes with “jumps” in the radial order n, with Δ k n of 2, 3, …, represented by colored lines starting with orange. Red circles indicate modes with Δ k n = 1 or corrected by a factor of 1 / Δ k n ; yellow arrows indicate when this correction was applied. Black points were discarded. The solid blue line represents the first iteration, and the purple dashed line indicates the inclination after convergence.
Universe 11 00071 g002
Figure 3. Variability of HD 212044 during TESS sectors 83 and 84. (a) Normalized Tess Simple Aperture Photometry (SAP) flux. (b) Detrended flux, obtained by removing frequencies below 0.5 d−1. Note the occurrence of beating frequencies often preceding flux maxima, suggesting a cause-and-effect phenomenon. (c) Wavelet analysis of the TESS signal, showing the evolution of frequency content over time with a heat-map color scale: blue for lower and red for higher intensity frequencies. (d) Amplitude modulation of the five NRP frequencies with the highest intensities and the corresponding beatings. Frequencies of the first (in green) and second (in blue) frequency groups. The red curve represents the vector sum combined effect of both groups. Note that its maxima often correspond to maxima in the flux curve. Abcissas are in BTJD = BJD − 2,457,000 days.
Universe 11 00071 g003
Figure 4. Variability of 28 Cyg during TESS sectors 14 and 15. (a) H α EW measurements are shown as red points. (b) Normalized TESS Simple Aperture Photometry (SAP) flux, with the orange line representing the low-frequency trend. (c) Detrended flux, highlighting frequency beatings (see Sect. 4 of Pereira et al. [20]). Note that a beating of NRP frequencies is observed around 1705 BTJD, followed by a maximum flux, as seen in panel (b). (d) Wavelet analysis of the TESS signal, showing the temporal evolution of frequency content with the same heat-map color scale as in Figure 3. (e) Amplitude modulation corresponds to beatings and intensity variations of the five highest amplitude frequencies from the first (green) and second (blue) frequency groups. The red curve shows the vector sum of the combined effect of both groups. The X-axis is in BTJD = BJD − 2,457,000 days.
Universe 11 00071 g004
Figure 5. This figure presents the same analysis shown in Figure 4 for 28 Cyg, but for TESS sectors 54 and 55. Note in (d) the strong intensity increasing of NRP in both frequency groups 1 (around 1.5 d−1 and 2 (around 2.5 d−1) just before the remarkable maximum in the photometric level seen in (b) and the (somewhat) delayed brightening of the circumstellar envelope seen through H- α in (a). (c) Detrended flux, obtained by removing frequencies below 0.5 d−1. (d) Wavelet analysis of the TESS signal, showing the temporal evolution of frequency content with the same heat-map color scale as in Figure 3. Like in the previous figures, (e) shows the amplitude modulation of the NRP frequencies with the highest intensities and the corresponding beat frequencies.
Universe 11 00071 g005
Figure 6. The same as in Figure 4, with the most recent data for 28 Cyg, in sectors 81 and 82, and without the panel corresponding to H α measurements, not available for this time window at the time of writing. (a) Normalized TESS flux. (b) Detrended flux. (c) Wavelet analysis of the TESS signal, showing the temporal evolution of frequency content with heat-map color scale.
Universe 11 00071 g006
Figure 7. The same as in Figure 4, but for CX Dra, sectors 14 and 15.
Universe 11 00071 g007
Figure 8. The same as in Figure 4, but for CX Dra, sectors 25 and 26.
Universe 11 00071 g008
Figure 9. During its sixth year of observations, TESS revisited the sky region containing CX Dra multiple times. The star was observed in sectors 73 to 76, with the corresponding light curve shown in the first panel and again in sectors 79 and 83, displayed in the second panel. A different color represents each sector. Vertical markers at the base of the plots indicate primary eclipses, spaced according to the 6.69-day orbital period. Significant changes in the star’s behavior are evident in these light curves. In sector 73, a significant increase in brightness is followed by a decrease in sector 74, while sectors 81 and 82 also display substantial variability. This variability may result from mass transfer from the F5 component to the B3e component or outbursts from the B3e component ejecting material into its circumstellar disk. In contrast, sector 83 shows the most stable light curve, featuring clearly defined primary and secondary eclipses typical of binary systems.
Universe 11 00071 g009
Table 1. Observation dates and light-curve length.
Star IDTESS SectorsObservation PeriodUsable Data Duration
HD 21204416 and 1712 September 2019–2 November 201951 days
56 and 571 September 2022–29 October 202257 days
76 and 7716 February 2024–23 April 202440 days
83 and 845 September 2024–26 October 202451 days
28 Cyg14 and 1518 July 2019–11 September 201951 days
54 and 559 July 2022–1 September 202257 days
81 and 8215 July 2024–5 September 202453 days
HD 17423714 and 1518 July 2019–11 September 201954 days
25 and 2613 May 2020–4 July 202051 days
73 and 767 December 2023–23 April 202489 days
79 and 8321 May 2024–1 October 2024132 days
Disclaimer/Publisher’s Note: The statements, opinions and data contained in all publications are solely those of the individual author(s) and contributor(s) and not of MDPI and/or the editor(s). MDPI and/or the editor(s) disclaim responsibility for any injury to people or property resulting from any ideas, methods, instructions or products referred to in the content.

