Abstract
In this paper, we describe the study of one- and three-dimension pion and kaon source functions for chaotic and partially coherent sources in Pb-Pb central collisions at TeV using the AMPT model. The characteristic source function quantities are calculated and compared with the results obtained by fitting the two-boson correlation functions using the Gaussian source formula. It was found that the imaging results are approximately consistent with the results of the Gaussian source formula fits. The partially coherent pion sources exhibit a high degree of coherence. However, the kaon pairs with high transverse momenta are emitted with a high degree of chaos.
Keywords:
imaging technique; source functions; partially coherent sources; AMPT model; relativistic heavy-ion collisions PACS:
25.75.Gz; 25.75.-q; 21.65.jk
1. Introduction
Two-boson Hanbury Brown–Twiss (HBT) correlations are important observables in high-energy heavy-ion collisions [1,2,3,4,5,6]. In HBT analysis, it is common to fit the HBT correlation functions with the parameterized formula based on the particle-emitting source model, usually the Gaussian source model, to obtain quantitative source space–time structure and coherence results [1,2,3,4,5,6,7,8,9,10,11,12,13,14]. These HBT results are source-model dependent. The imaging technique introduced by Brown and Danielewicz [15,16,17] is another HBT analysis method in high-energy heavy-ion collisions that can obtain the particle-emitting source functions directly from the HBT correlation functions [18,19,20,21,22,23,24]. Therefore, the source functions extracted by the imaging analyses are independent of the source model [15,16,17,18,19,20,21,22,23,24]. These source functions can be used to obtain more realistic source spatial characteristic quantities and coherence for non-Gaussian particle-emitting sources [25,26].
In Reference [27], we investigated the two-pion HBT correlations for chaotic and partially coherent sources in heavy-ion collisions at the Relativistic Heavy Ion Collider (RHIC) and Large Hadron Collider (LHC) with a multiphase transport (AMPT) model [28,29]. In Reference [30], we studied the multi-pion and multi-kaon HBT correlations at TeV Pb-Pb collisions at the LHC using the AMPT model. A partially coherent source was constructed with the coherent emission lengths related to the boson de Broglie wavelength and density [30]. These studies indicate that the two-pion and multi-pion HBT results of the partially coherent sources are more consistent with experimental data than those of the chaotic sources using the AMPT model [27,30]. In this work, we studied the pion and kaon two-boson correlation functions and source functions for partially coherent and chaotic sources in Pb-Pb central collisions at TeV using the AMPT model. It was found that the characteristic source function quantities are approximately consistent with the correlation function results fitted with the Gaussian source formula. The chaoticity characteristic quantity results indicate that the partially coherent pion sources exhibit a high degree of coherence. However, the kaon pairs with high transverse momenta are emitted with a high degree of chaos.
The rest of this paper is organized as follows: In Section 2, we introduce the one- and three-dimension imaging techniques. In Section 3, we study the pion and kaon two-boson HBT correlations and one- and three-dimension source functions for chaotic and partially coherent sources in Pb-Pb central collisions at TeV using the AMPT model. The characteristic pion and kaon source function quantities for chaotic and partially coherent sources are calculated. We summarize this work and present conclusions in Section 4.
2. Imaging Technique
Based on the Koonin–Pratt formulism [31,32], the two-boson HBT correlation function can be written in the pair center-of-mass system (PCMS) as [17,18,25,33,34]
where is the relative momentum of the identical boson pair, is the relative separation of emission points of the two bosons, and is the relative wave function of the pair. Neglecting the final-state interaction of the boson pair,
In Equation (1), is the so-called two-particle source function, which denotes the probability of emitting an identical boson pair with the relative spatial separation . The problem of imaging is obtaining the source function with the measured data of the correlation function [or ].
For a spherically symmetric source function, Equation (1) reduces to
where and because in the PCMS.
By expanding the source function in the b-spline basis [17] as follows:
the value of correlation function at the ith q bin, , can be expressed as
where
where is the bin size of q. The one-dimension imaging problem then becomes solving in Equation (5).
For a general three-dimension particle-emitting source, the source function and correlation function can be expressed in spherical harmonics () [34]:
where is the unit vector of and is the unit vector of . Let denote the cosine of the angle between and , and the kernel can be expanded in Legendre polynomials () as follows [34]:
By inserting Equations (7)–(9) into Equation (1), one obtains
where
where () are spherical Bessel functions.
3. Imaging Results for Heavy-Ion Collisions Using the Ampt Model at the LHC
3.1. Calculations of Correlation Functions Using the Ampt Model
The AMPT model has been successfully used to describe the observables in high-energy heavy-ion collisions [27,28,29,30,35,36,37,38,39,40,41,42,43,44,45,46,47,48]. It is a four-part hybrid, including initialization, parton transport, hadronization, and hadron transport. The initialization of collisions in the AMPT model is performed using the HIJING model [49]. The parton transport and hadron transport are described by the ZPC parton cascade model [50] and the ART model [51], respectively. In this study, we use the string melting version of the AMPT model in which partons are hadronized by the quark coalescence mechanism [28,29]. In the AMPT model, the generated hadrons may interact with other particles in the source and may be absorbed or remain until freeze-out. Some hadrons may also be generated by the particle interactions in the source and hadron decays. As a microscopic transport model, the AMPT model can provide the origin of a freeze-out particle. We divide all the identical bosons into two kinds, namely, the bosons generated by quark coalescence and the bosons generated by particle scattering and decay, as in Reference [27].
In Reference [30], we investigated the multi-pion and multi-kaon correlation functions for partially coherent pion and kaon sources. The two-boson correlation functions for the partially coherent sources are calculated in the equations,
where is the magnitude of the amplitude for emitting a boson with momentum at the freeze-out four-coordinate ,
and
where , , are the pion generation coordinates, and and are the respective longitudinal and transverse coherent emission lengths, which are related to the boson density as well as the de Broglie wavelengths of the two bosons [30]. The values of and are zero for the chaotic boson-emitting sources. In this study, we calculate the two-pion and two-kaon correlation functions using the AMPT data samples, as in Reference [30].
3.2. One-Dimension Results
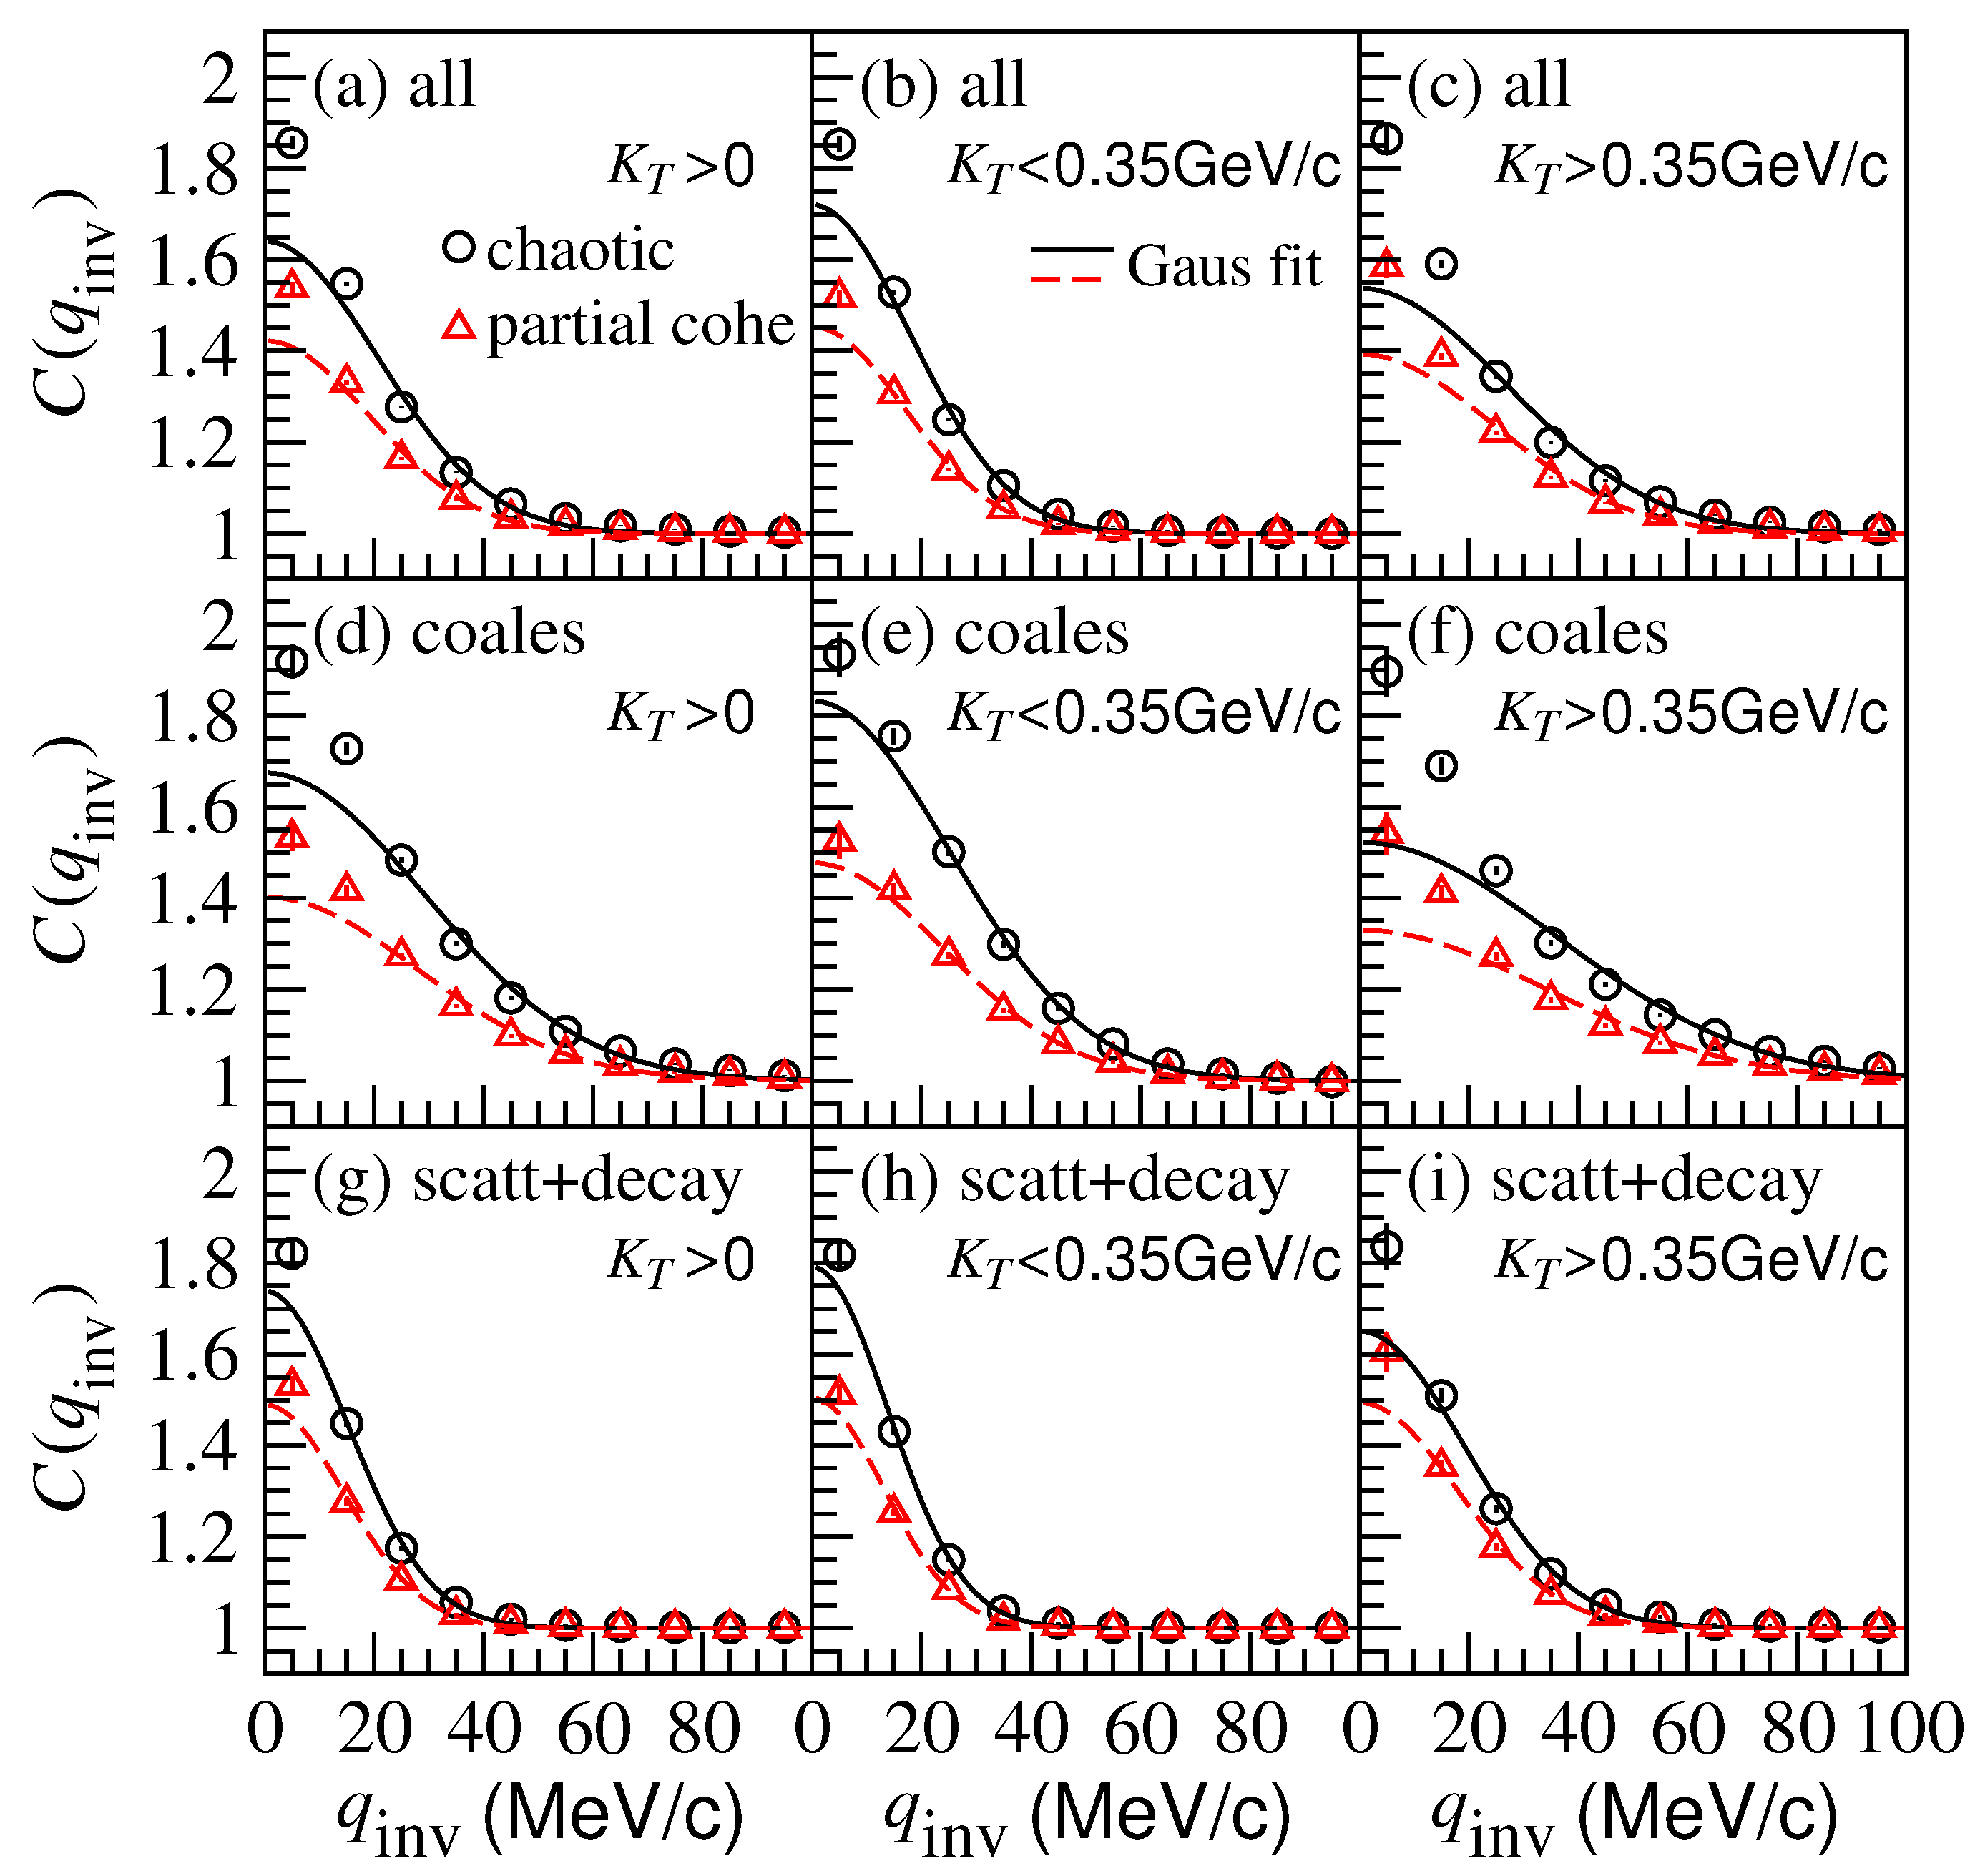
Figure 1 shows the two-pion correlation functions for chaotic sources (circle symbols) and partially coherent sources (triangle symbols) in Pb-Pb central collisions at TeV using the AMPT model. Here, the left, middle, and right columns are the results in the pion pair transverse momentum intervals, , , and GeV in the laboratory frame, respectively. The top, middle, and bottom rows show the results for all the identical (negative) pions, the pions generated by quark coalescence, and the pions generated by particle scattering and decay, respectively.
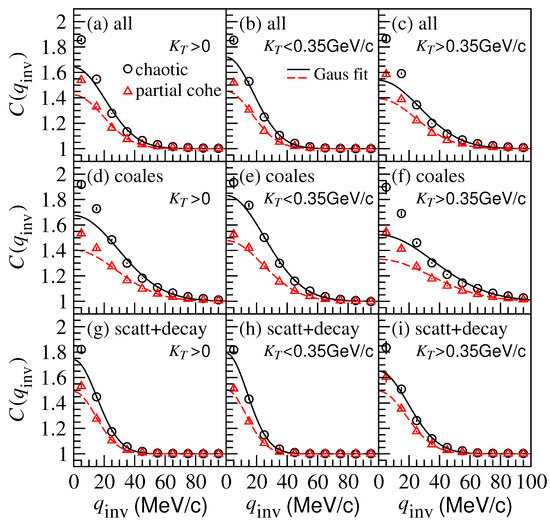
Figure 1.
(Color online) Two-pion correlation functions for chaotic and partially coherent sources in Pb-Pb central collisions at TeV using the AMPT model, in different pion pair transverse momentum intervals in the laboratory frame. The solid and dashed lines are the correlation function curves for chaotic and partially coherent sources, respectively, fitted with the Gaussian source formula. The top, middle, and bottom panels show the results for all the identical pions, the pions generated by quark coalescence, and the pions generated by particle scattering and decay, respectively.
One can see that the two-pion correlation function intercepts near for partially coherent sources are lower than those for the chaotic sources. Moreover, the widths of the correlation functions for the pions generated by quark coalescence are larger than those for the pions generated by particle scattering and decay. This indicates that the source sizes for the pions generated by quark coalescence are smaller than those for the pions generated by the particle scattering and decay. The widths of the correlation functions in the lower interval are smaller than those in the higher interval. This means that the pion source sizes are smaller in the high transverse momentum interval than those in the lower transverse momentum interval. In Figure 1, the solid and dashed lines are the correlation function curves for the chaotic and partially coherent sources, respectively, fitted with the Gaussian formula
The differences between the fitted curves and the correlation functions are due to the non-Gaussian source distributions in the AMPT model. The distortions are significant for the quark coalescence pion-emitting sources and in the high pion pair transverse momentum intervals.
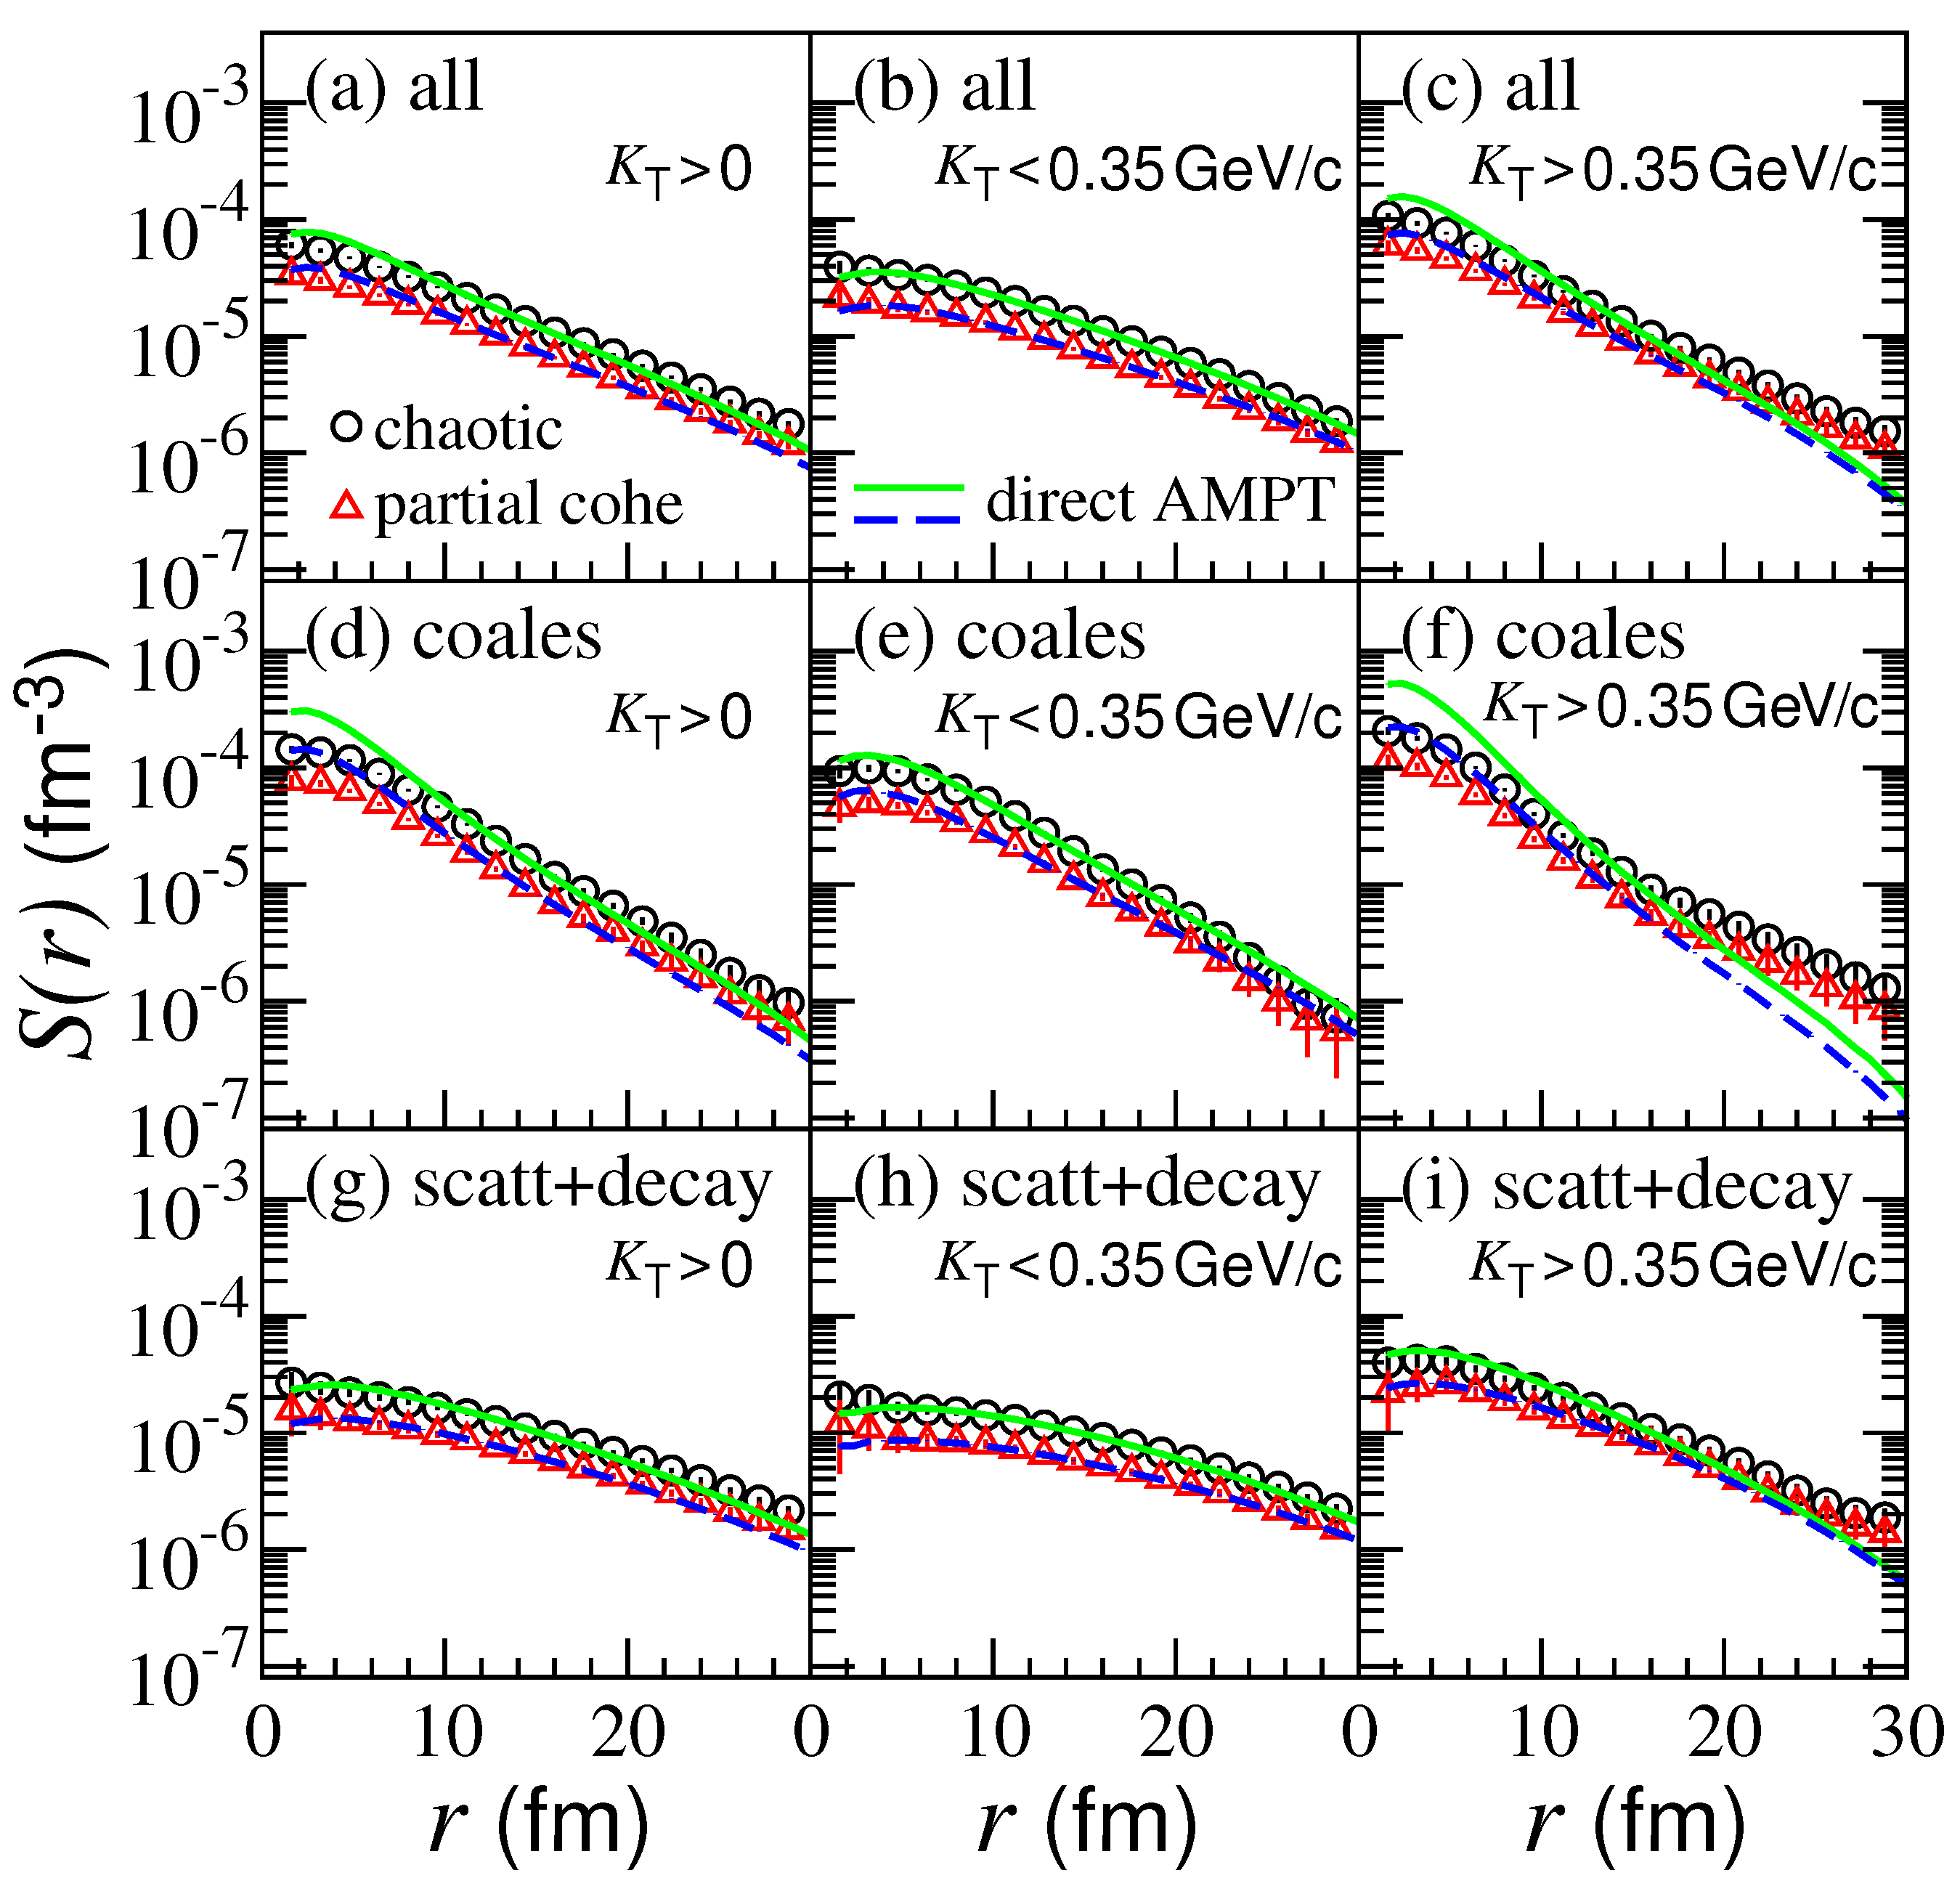
Figure 2 shows the one-dimension pion source functions of chaotic sources (circle symbols) and partially coherent sources (triangle symbols) in Pb-Pb central collisions at TeV using the AMPT model. Here, the solid and dashed lines are the results directly extracted from the AMPT model (plotting the average boson freeze-out relative coordinates provided by the AMPT model) for the chaotic and partially coherent sources, respectively. The left, middle, and right columns are the results in the pion pair transverse momentum intervals, , , and GeV in the laboratory frame, respectively. The top, middle, and bottom rows show the results for all the identical (negative) pions, the pions generated by quark coalescence, and the pions generated by particle scattering and decay, respectively.
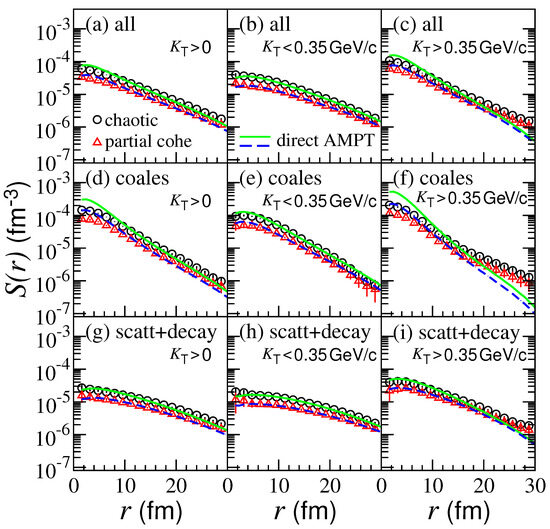
Figure 2.
(Color online) One-dimension pion source functions of chaotic and partially coherent sources in Pb-Pb central collisions at TeV using the AMPT model, in different pion pair transverse momentum intervals in the laboratory frame. The solid and dashed lines are the results directly extracted from the AMPT model for the chaotic and partially coherent sources, respectively. The top, middle, and bottom rows show the results for all the identical pions, the pions generated by quark coalescence, and the pions generated by particle scattering and decay, respectively.
One can see that the source functions of the partially coherent sources are lower than those of the chaotic sources. The source functions for the pions generated by particle scattering and decay are flatter as a function of the relative coordinate r than those for the pions generated by quark coalescence. This means that there are more pion pairs with a small r for the pions generated by quark coalescence than for the pions generated by particle scattering and decay. The differences between the source functions obtained using the imaging technique and those extracted directly from the AMPT model are significant for the quark coalescence pion sources and in the high intervals. This is mainly because the sources are different in spherical symmetric systems.
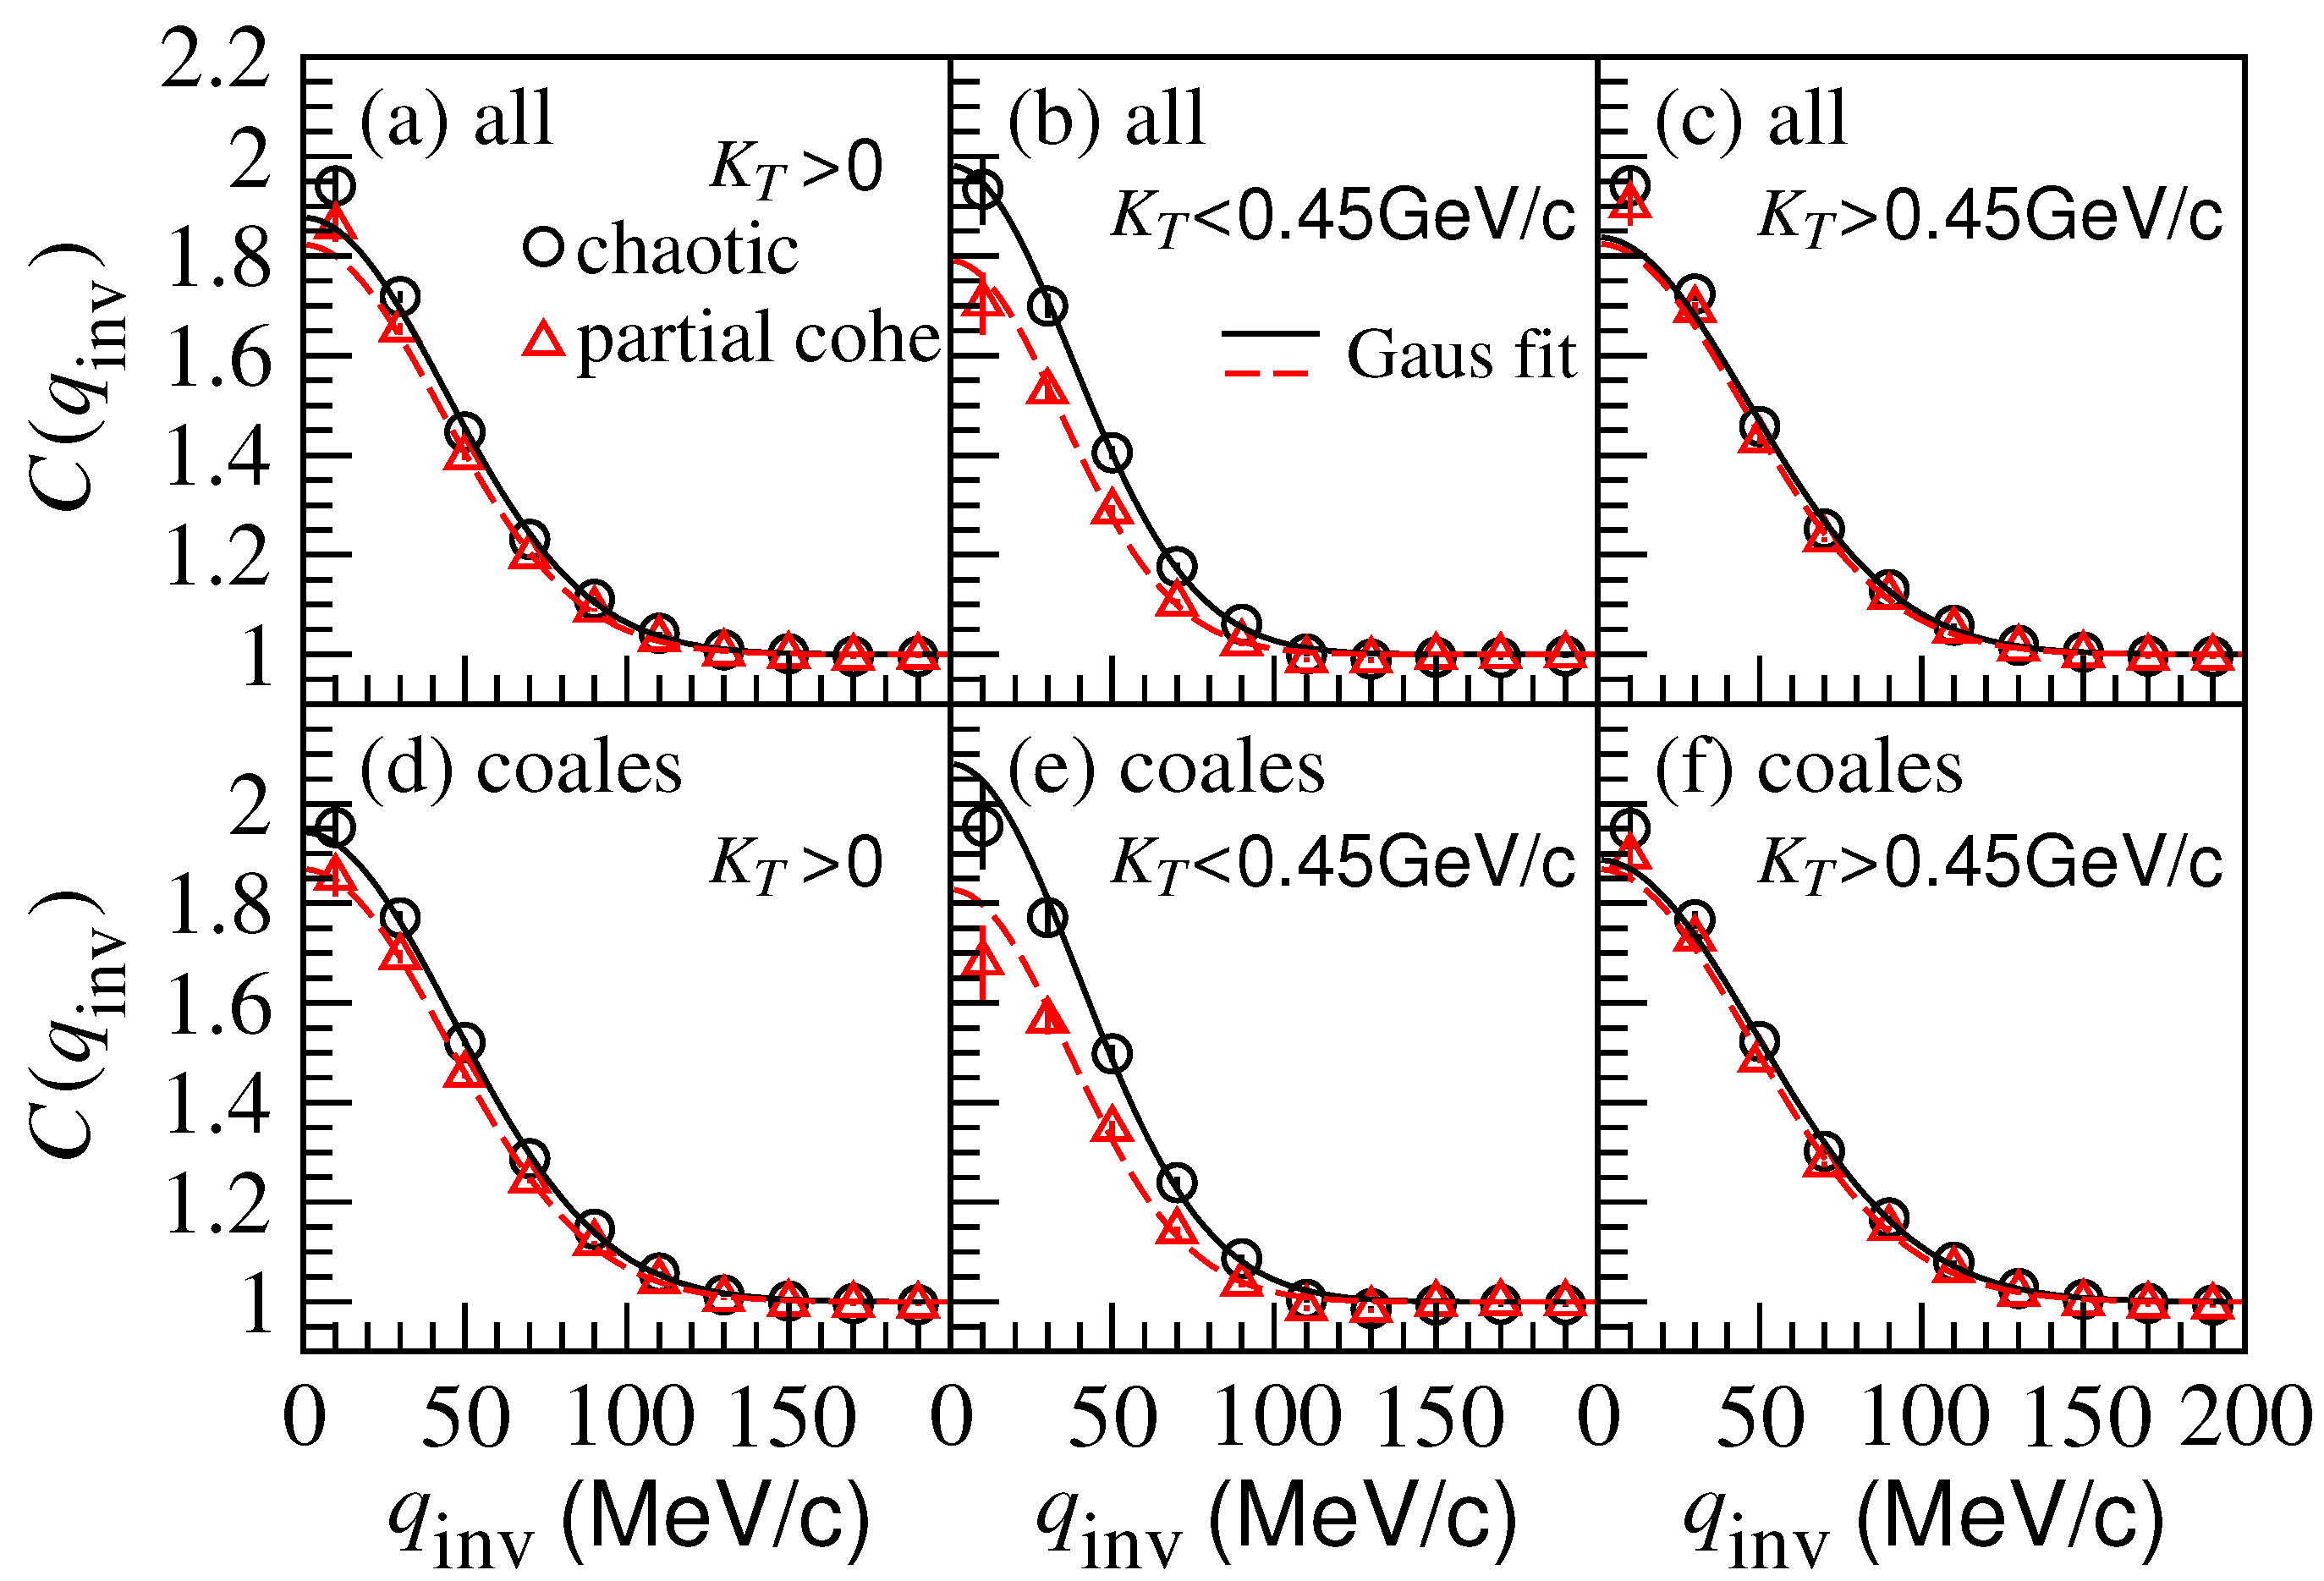
Figure 3 shows the two-kaon correlation functions for chaotic sources (circle symbols) and partially coherent sources (triangle symbols) in Pb-Pb central collisions at TeV using the AMPT model. Here, the left, middle, and right columns are the results in the kaon pair transverse momentum intervals, , , and GeV, respectively, in the laboratory frame. The top and bottom rows show the results for all of the identical (negative) kaons and the kaons generated by quark coalescence, respectively. We found that the two-kaon correlation functions for the kaons generated by particle scattering and decay have low statistics. In the low transverse momentum interval GeV, the correlation function intercepts near for the partially coherent sources are significantly lower than those for the chaotic sources. However, the differences between the correlation functions for partially coherent and chaotic sources are small in the high transverse momentum interval GeV. Compared with the two-pion correlation functions (see Figure 1), the two-kaon correlation functions can be fitted better with the Gaussian source formula Equation (15).
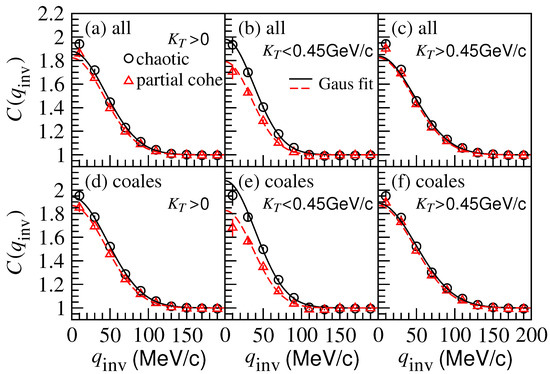
Figure 3.
(Color online) Two-kaon correlation functions for chaotic and partially coherent sources in Pb-Pb central collisions at TeV using the AMPT model in different kaon pair transverse momentum intervals in the laboratory frame. The solid and dashed lines are the correlation function curves for chaotic and partially coherent sources, respectively, fitted with the Gaussian source formula. The top and bottom rows show the results for all the identical kaons and the kaons generated by quark coalescence, respectively.
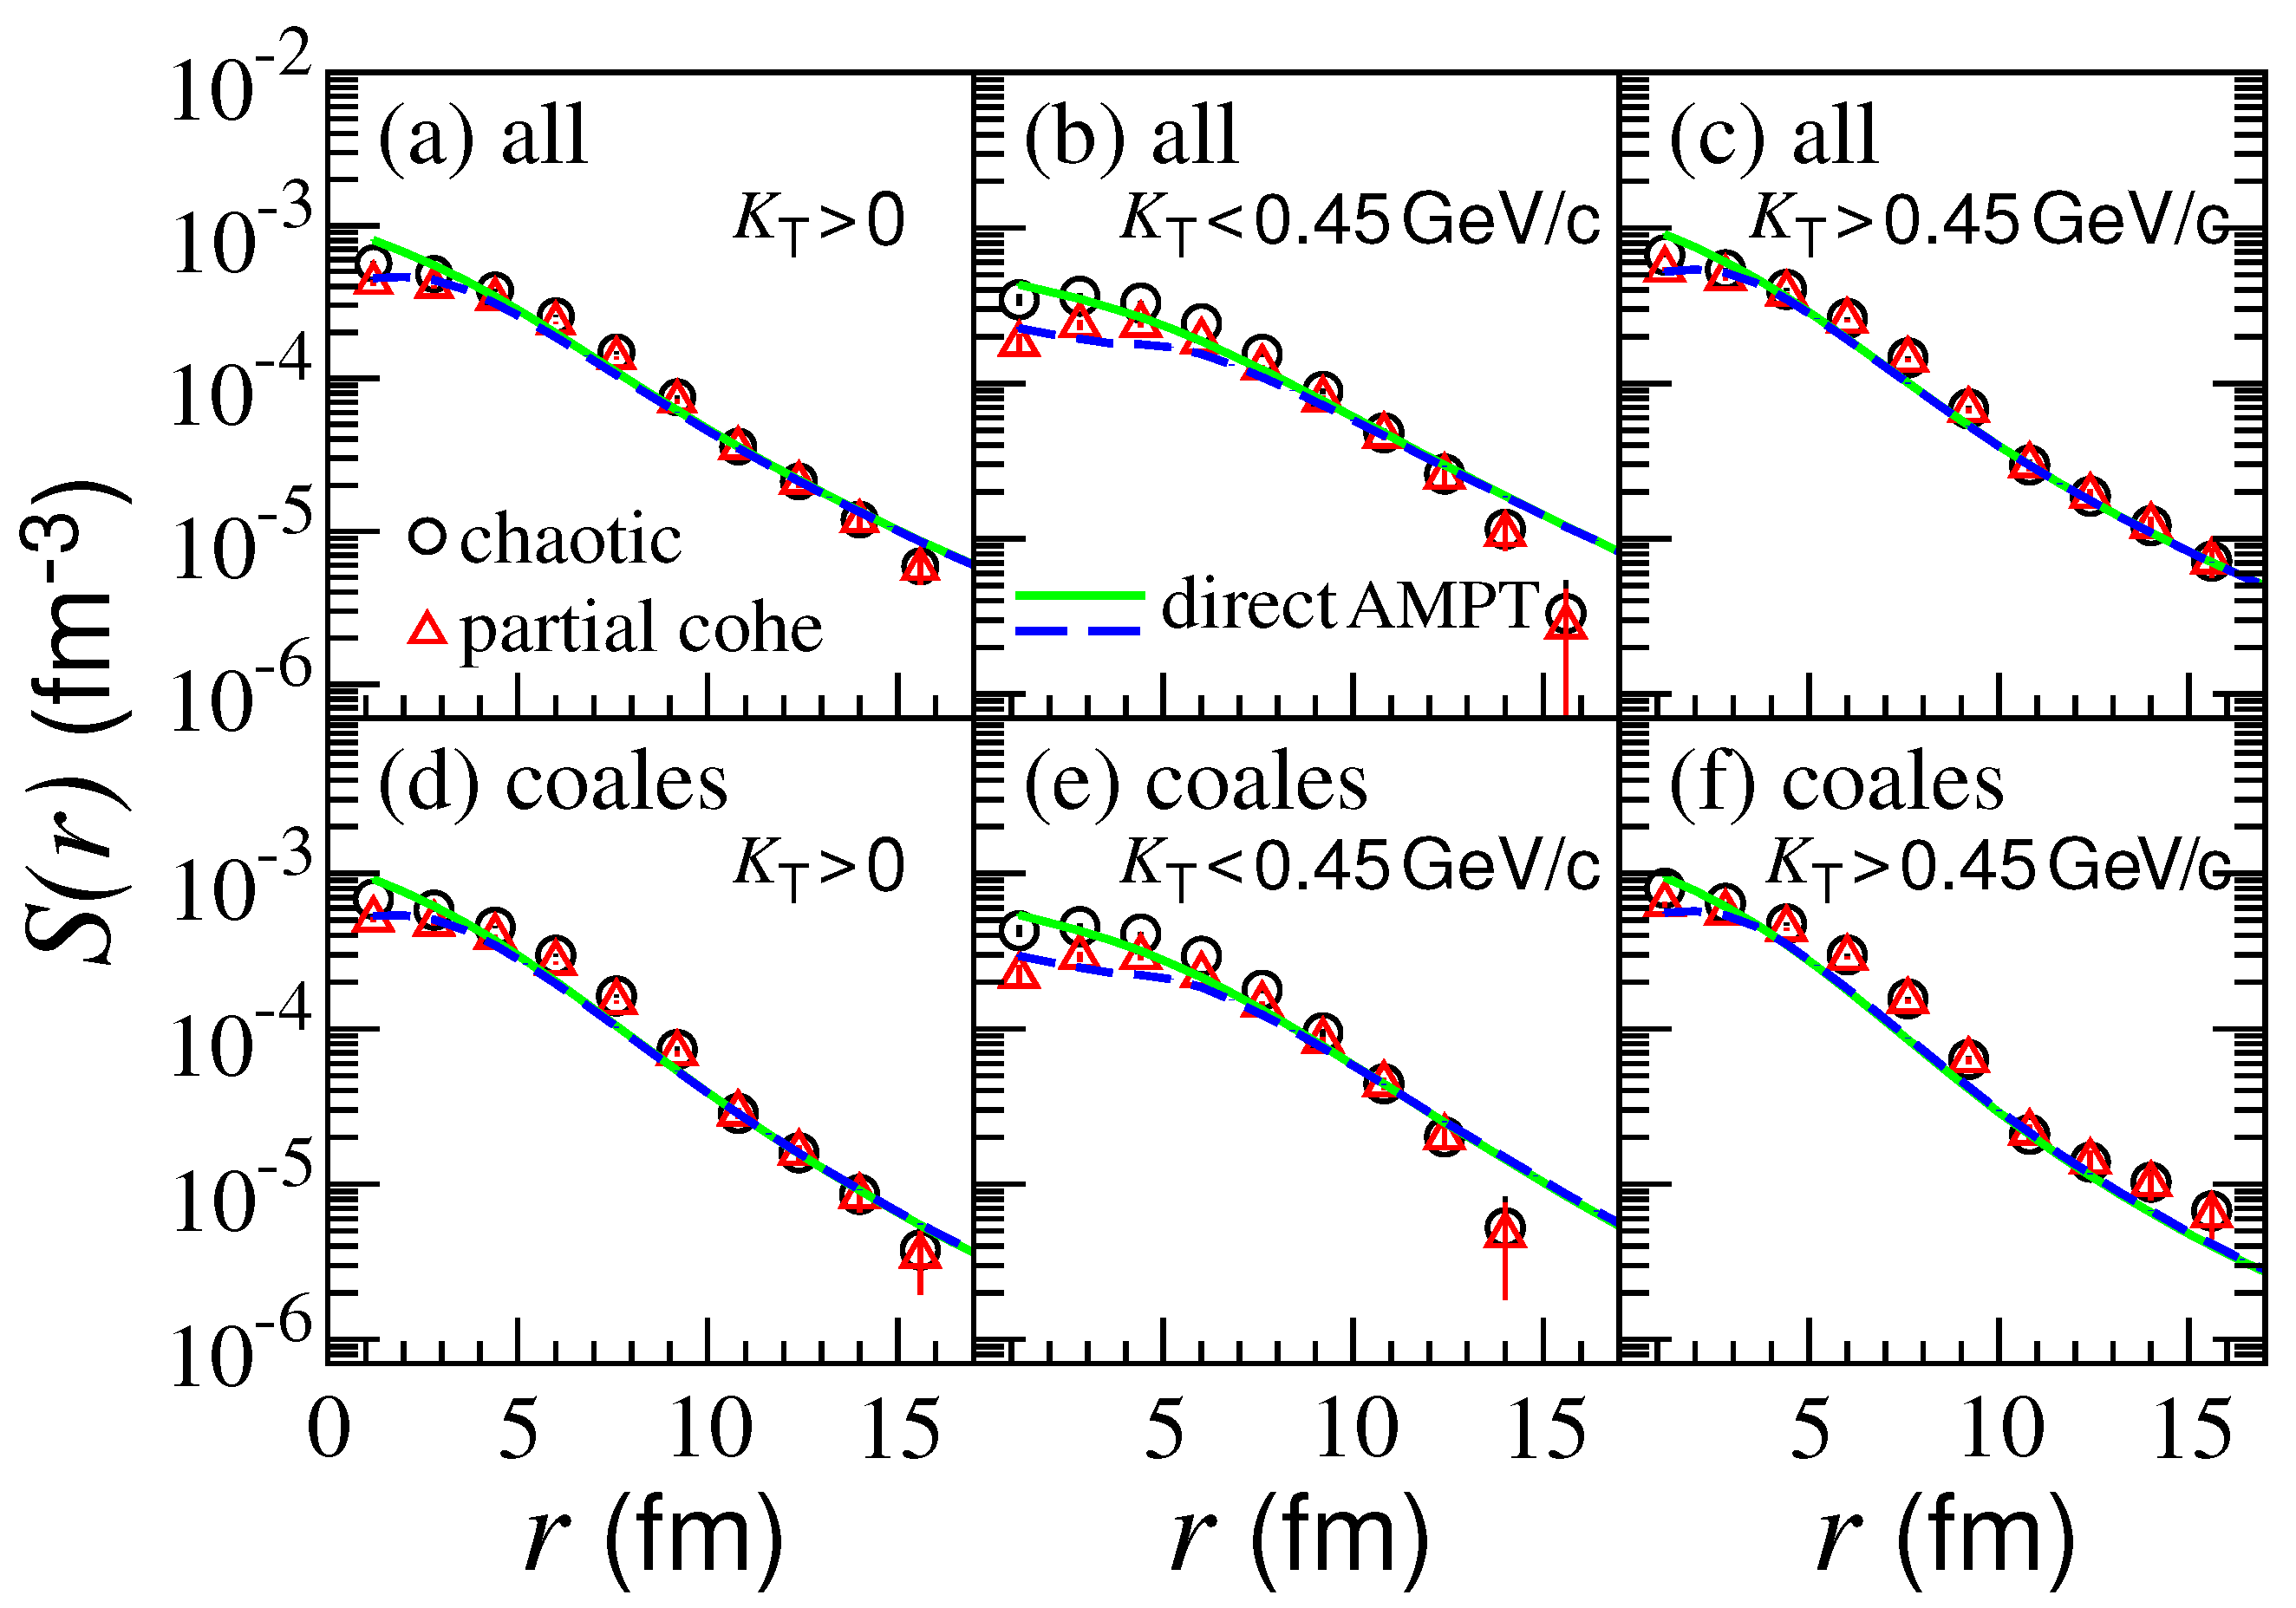
Figure 4 shows the one-dimension kaon source functions of chaotic sources (circle symbols) and partially coherent sources (triangle symbols) in Pb-Pb central collisions at TeV using the AMPT model. Here, the solid and dashed lines are the results directly extracted from the AMPT model for the chaotic and partially coherent sources, respectively. The left, middle, and right columns show the results in the kaon pair transverse momentum intervals, , , and GeV in the laboratory frame, respectively. The top and bottom rows show the results for all the identical (negative) kaons and the kaons generated by quark coalescence, respectively. One can see that the source functions of the partially coherent sources are lower than those of the chaotic sources at a small r. The source functions obtained using the imaging technique are approximately consistent with those extracted directly from the AMPT model.
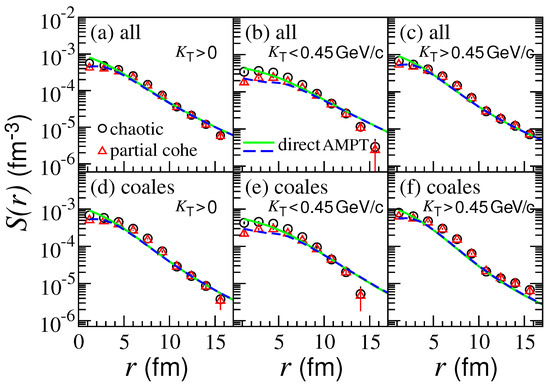
Figure 4.
(Color online) One-dimension kaon source functions of chaotic and partially coherent sources in Pb-Pb central collisions at TeV using the AMPT model, in different kaon pair transverse momentum intervals in the laboratory frame. The solid and dashed lines are the results directly extracted from the AMPT model for the chaotic and partially coherent sources, respectively. The top and bottom rows show the results for all the identical kaons and the kaons generated by quark coalescence, respectively.
3.3. Three-Dimension Results
In usual HBT analyses in high-energy heavy-ion collisions, the three-dimension two-pion correlation functions are decomposed in the longitudinal direction (along the beam—denoted as the “long” direction), the transverse out direction (along transverse pair momentum—denoted as the “out” direction), and the transverse side direction (vertical to the out direction—denoted as the “side” direction). The correlation functions are fitted with the three-dimension Gaussian formula:
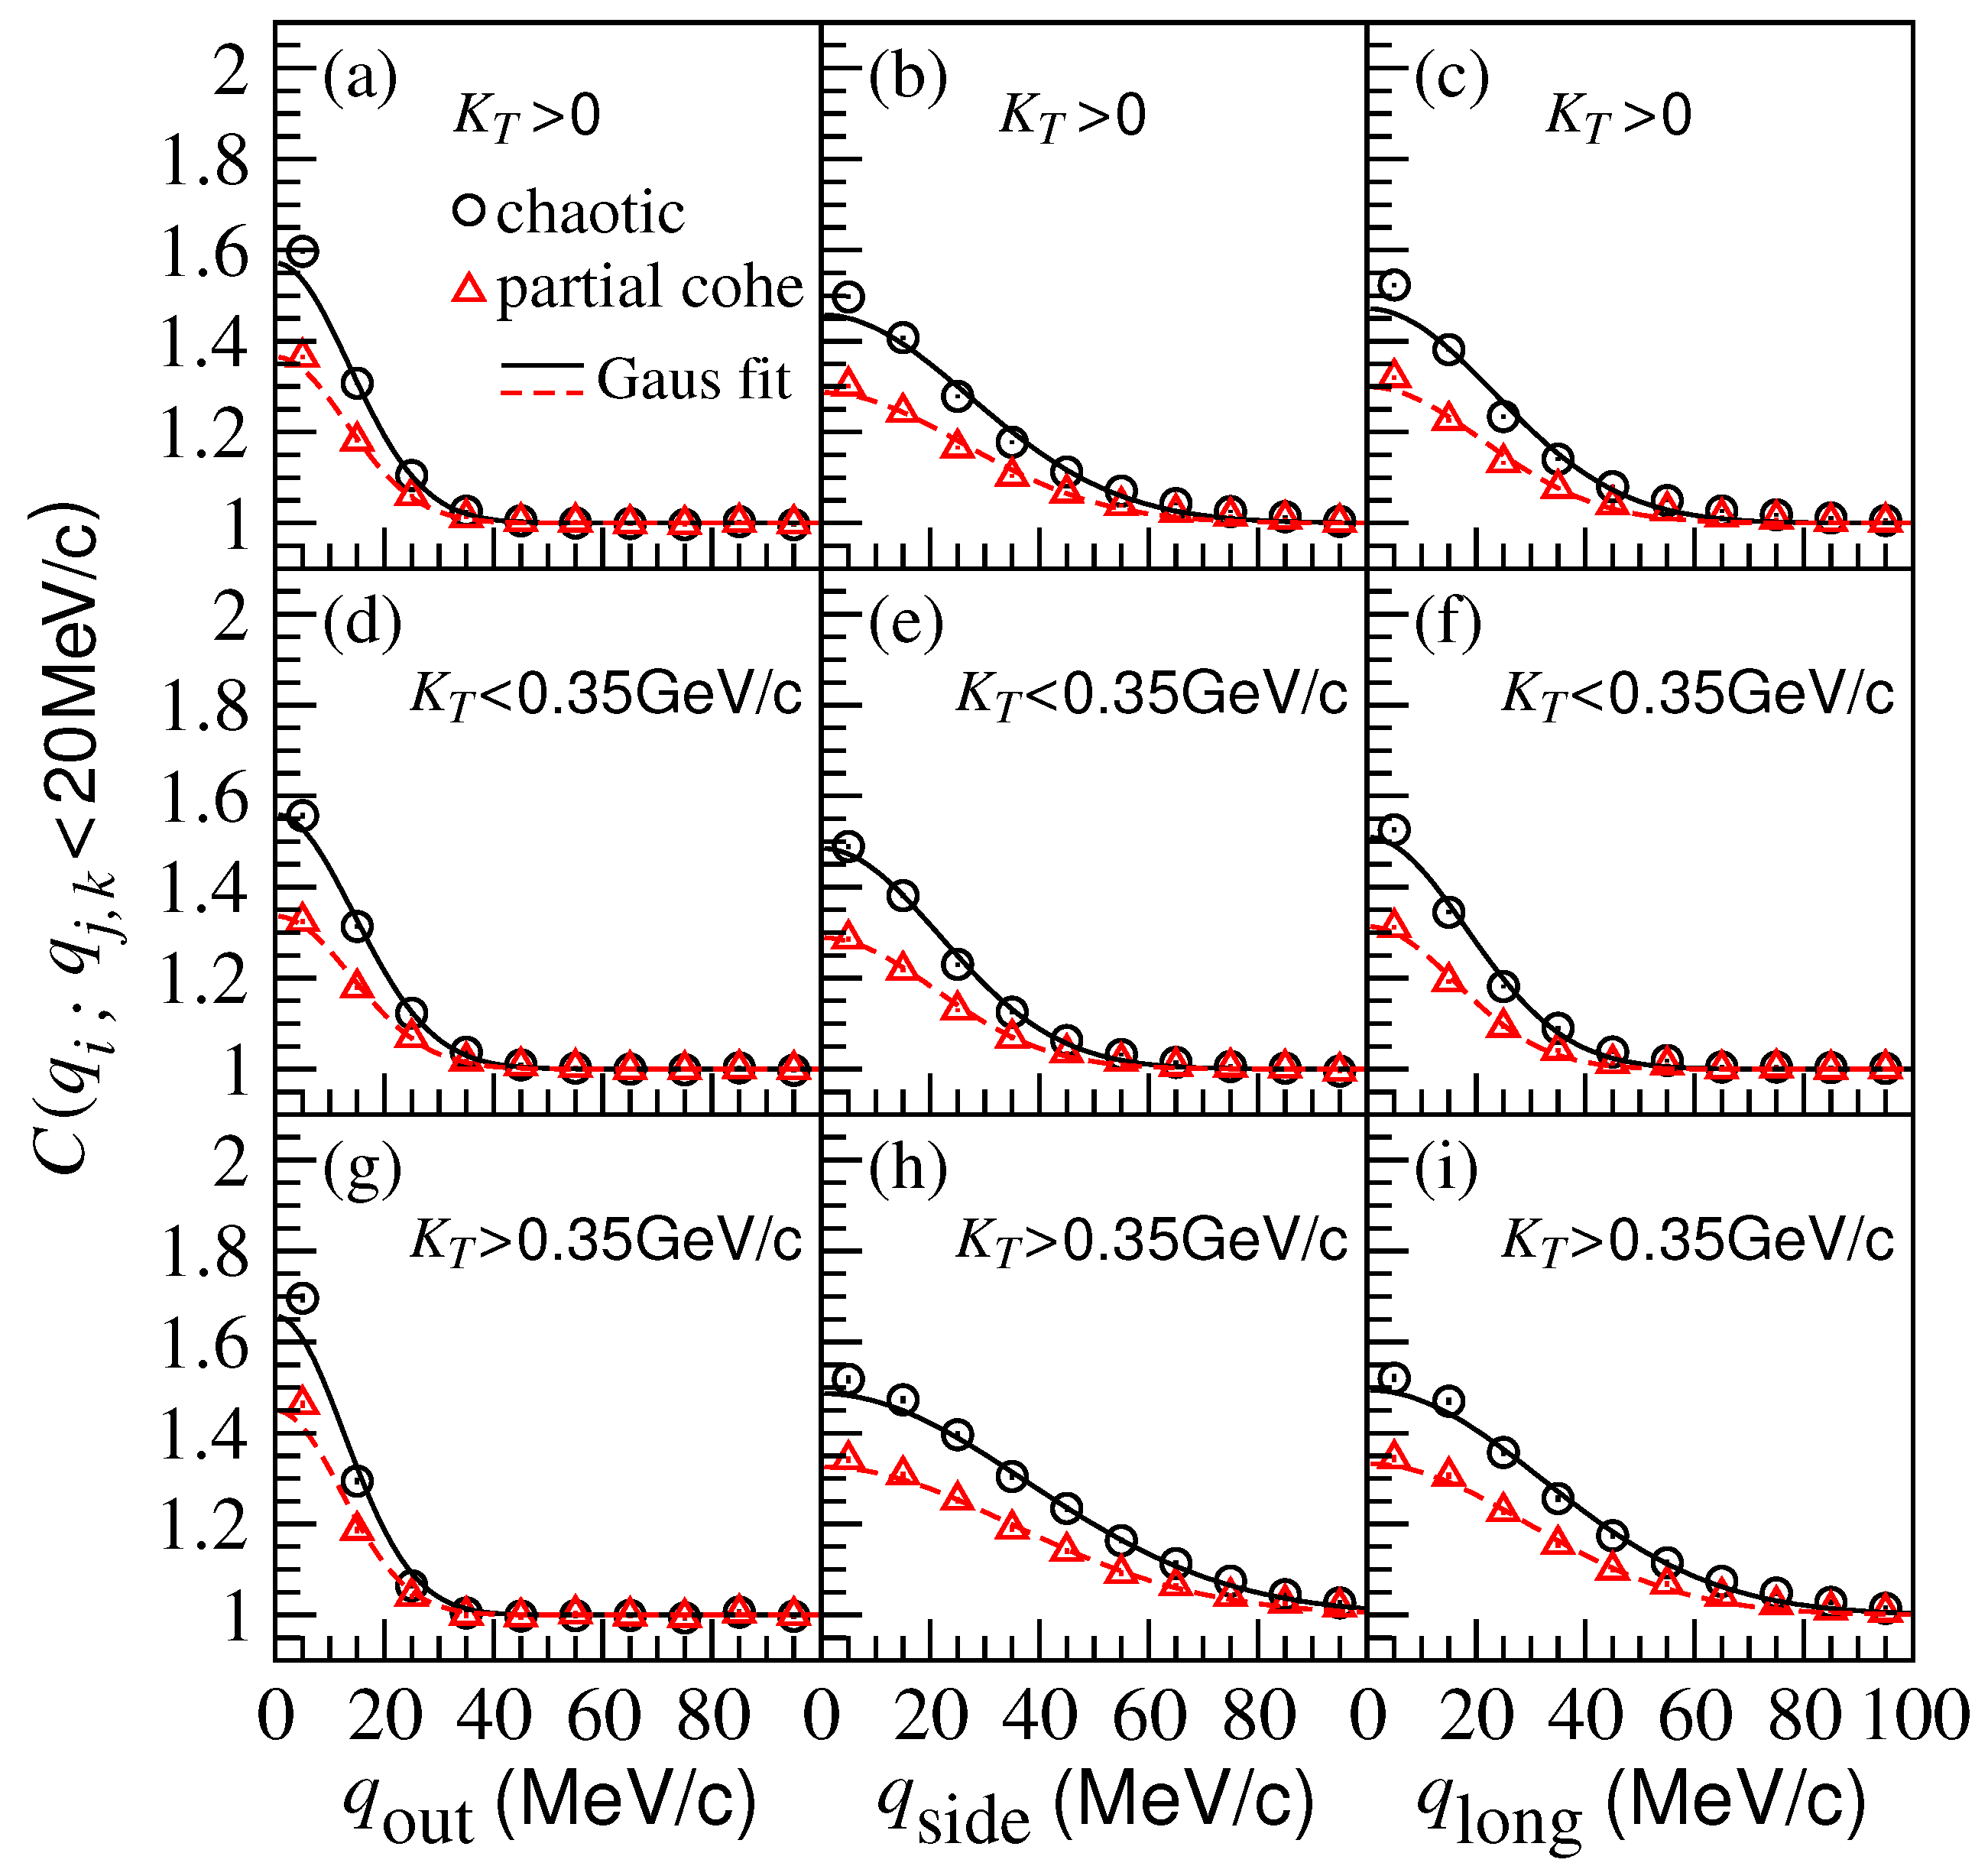
Figure 5 shows the two-pion correlation functions in the out, side, and long directions for the chaotic sources (circle symbols) and partially coherent sources (triangle symbols) in Pb-Pb central collisions at TeV using the AMPT model. Here, the solid and dashed lines are the correlation function curves for chaotic and partially coherent sources, respectively, fitted with Equation (16). The top, middle, and bottom rows show the results in the pion pair transverse momentum intervals, , , and GeV, respectively, in the laboratory frame. One can see that the correlation function intercepts near zero relative momenta for the partially coherent sources are lower than those for the chaotic sources.
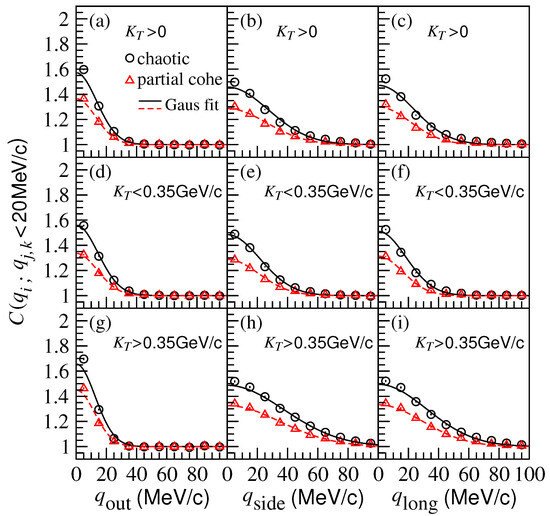
Figure 5.
(Color online) Two-pion correlation functions with respect to the relative momenta () in the PCMS frame for chaotic and partially coherent sources in Pb-Pb central collisions at TeV using the AMPT model. The solid and dashed lines are the correlation function curves for chaotic and partially coherent sources, respectively, fitted with Gaussian source formula. The top, middle, and bottom rows show the results in pion pair transverse momentum intervals , , and GeV in the laboratory frame, respectively.
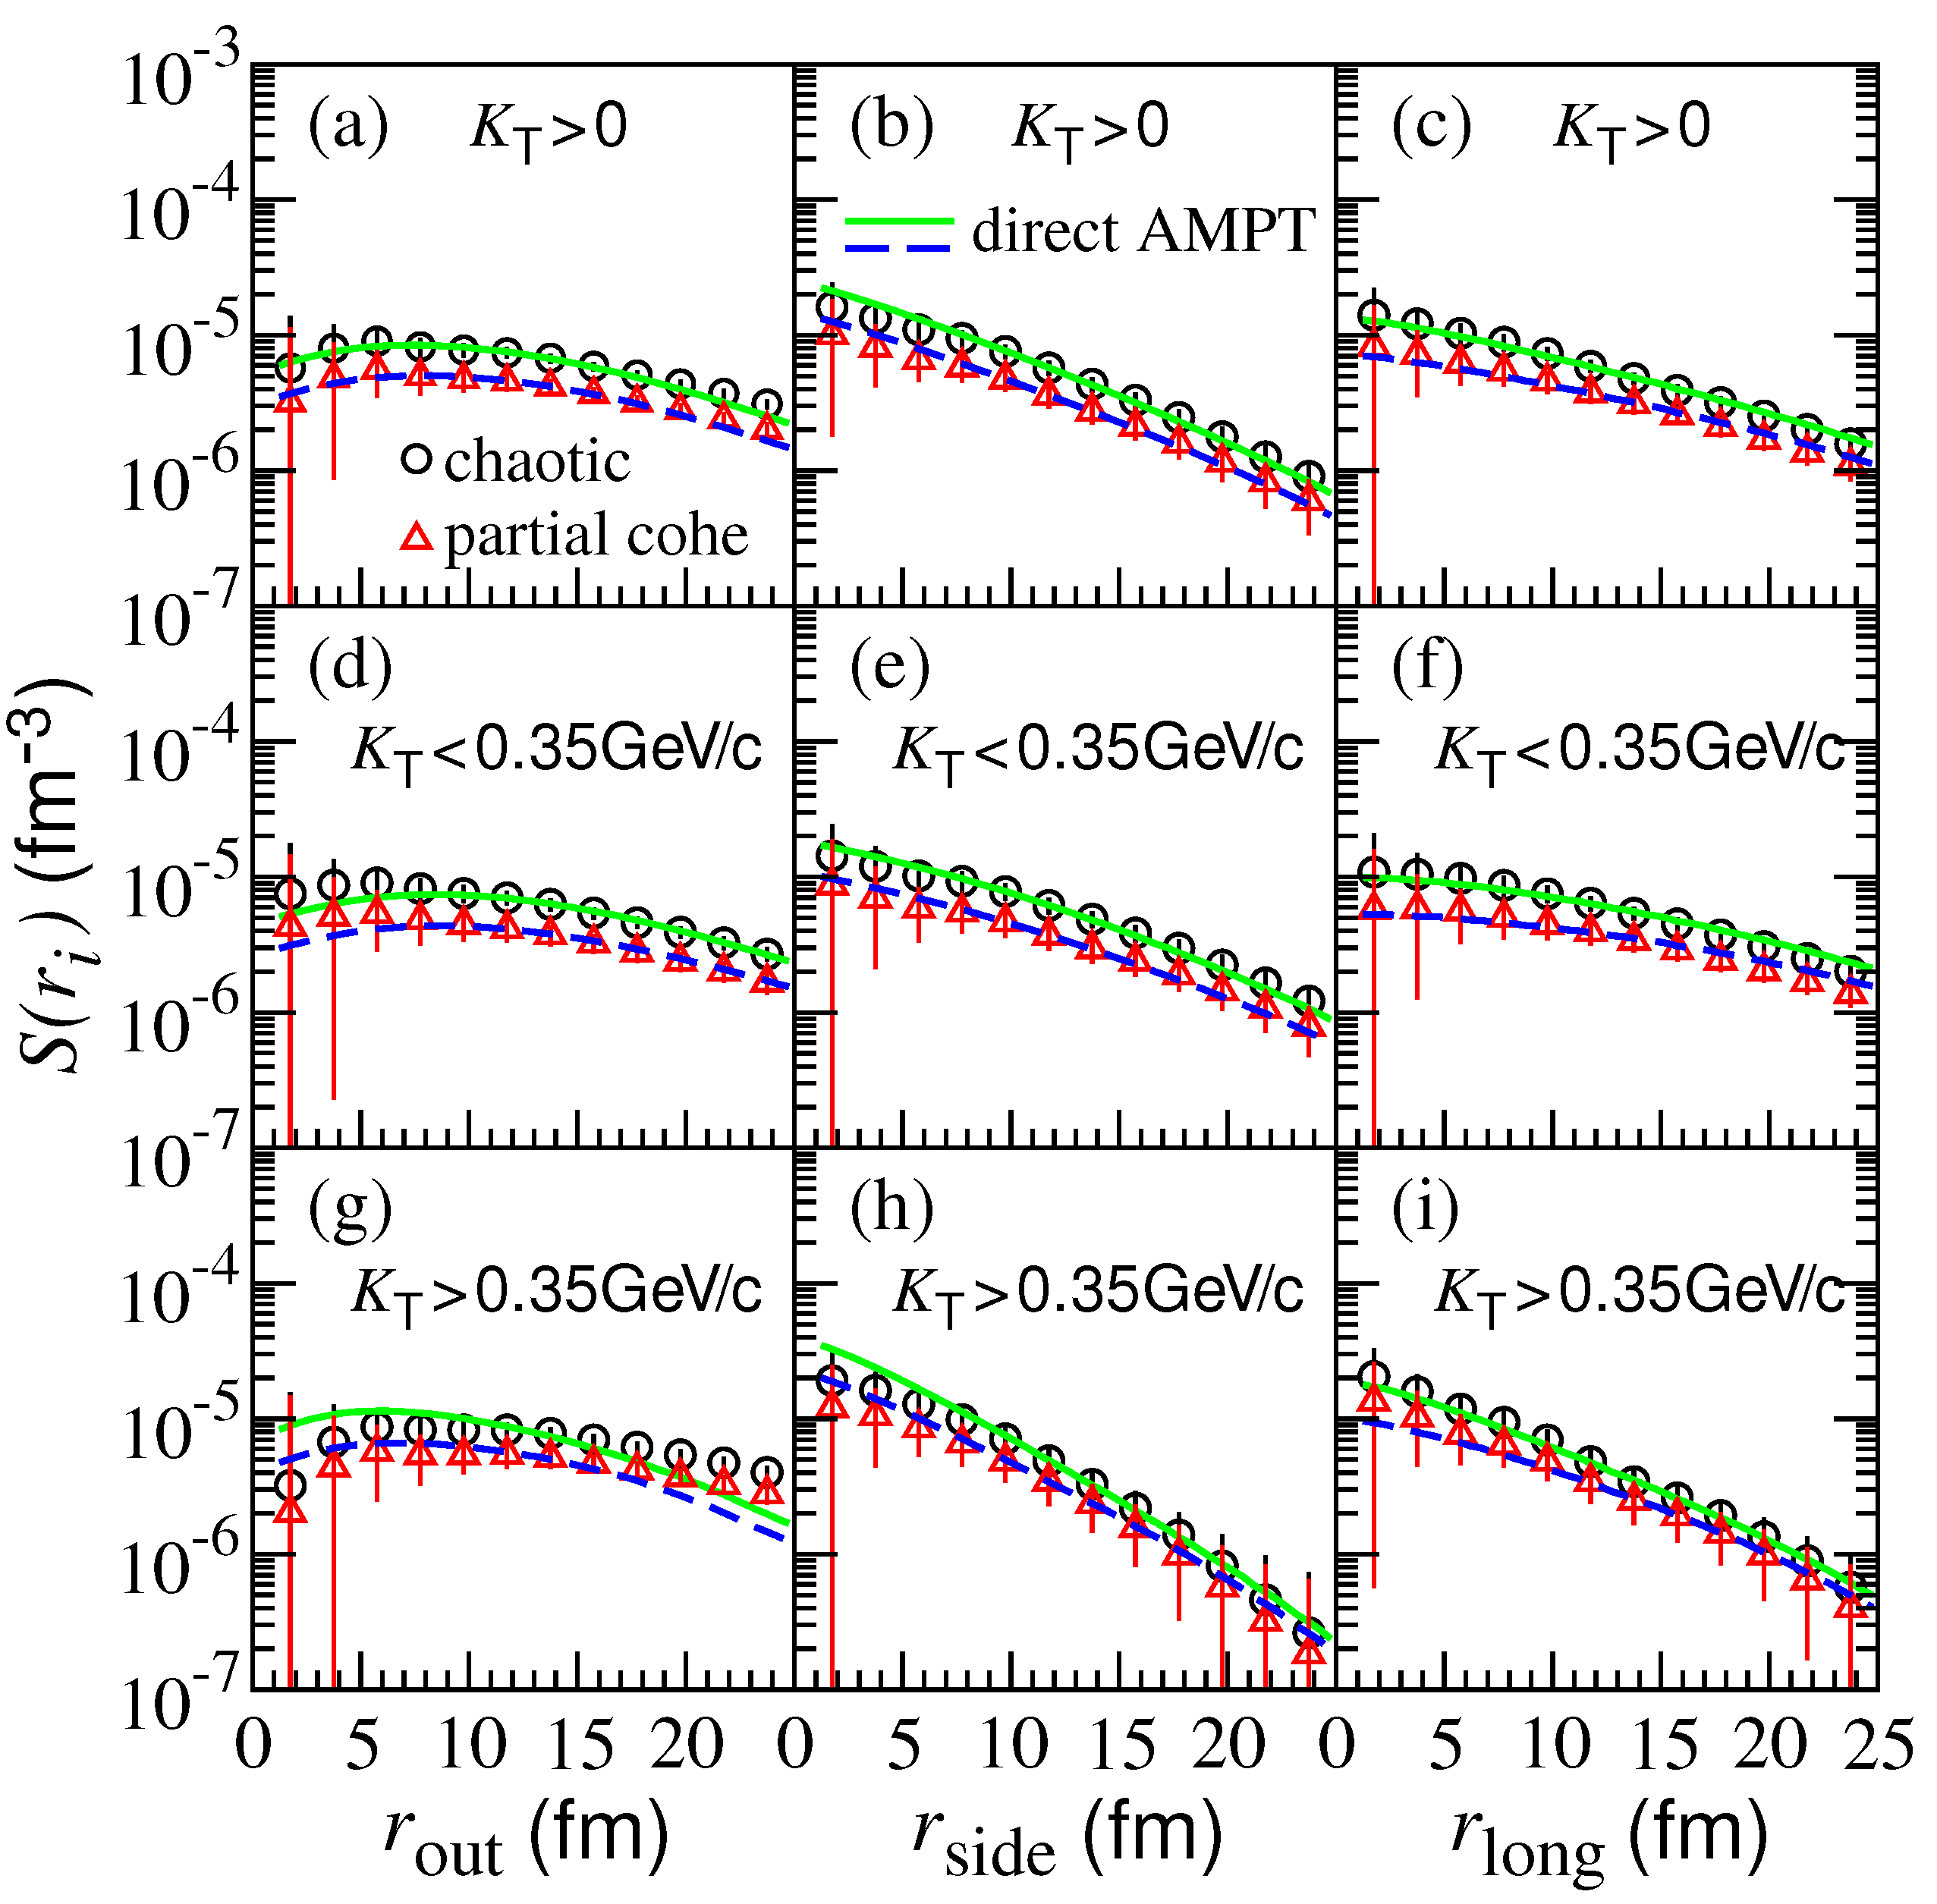
Figure 6 shows the three-dimension pion source functions ( out, side, long) of the chaotic sources (circle symbols) and partially coherent sources (triangle symbols) in Pb-Pb central collisions at TeV using the AMPT model. Here, the solid and dashed lines are the results directly extracted from the AMPT model for the chaotic and partially coherent sources, respectively. The top, middle, and bottom rows show the results in the pion pair transverse momentum intervals, , , and GeV, respectively, in the laboratory frame. One can see that the source functions of the partially coherent sources are lower than those of the chaotic sources. In addition, the source functions obtained using the imaging technique are consistent with those extracted directly from the AMPT model. In the out direction, the source functions are flatter with respect to the relative coordinate compared with those in the side direction.
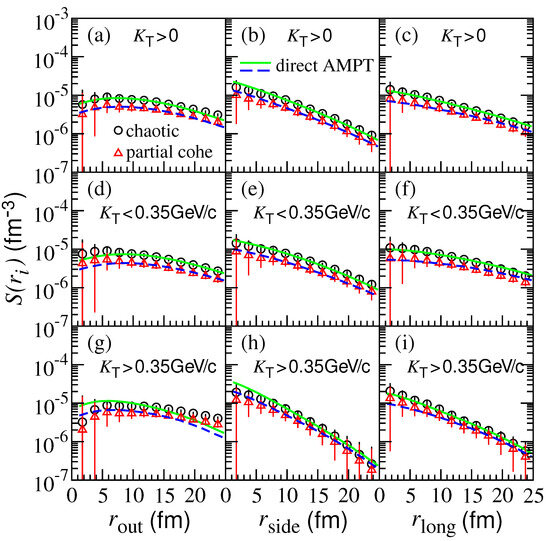
Figure 6.
(Color online) Three-dimension pion source functions ( out, side, long) of chaotic and partially coherent sources in Pb-Pb central collisions at TeV using the AMPT model. The solid and dashed lines are the results directly extracted from the AMPT model for the chaotic and partially coherent sources, respectively. The top, middle, and bottom rows show the results in the pion pair transverse momentum intervals, , , and GeV, respectively, in the laboratory frame.
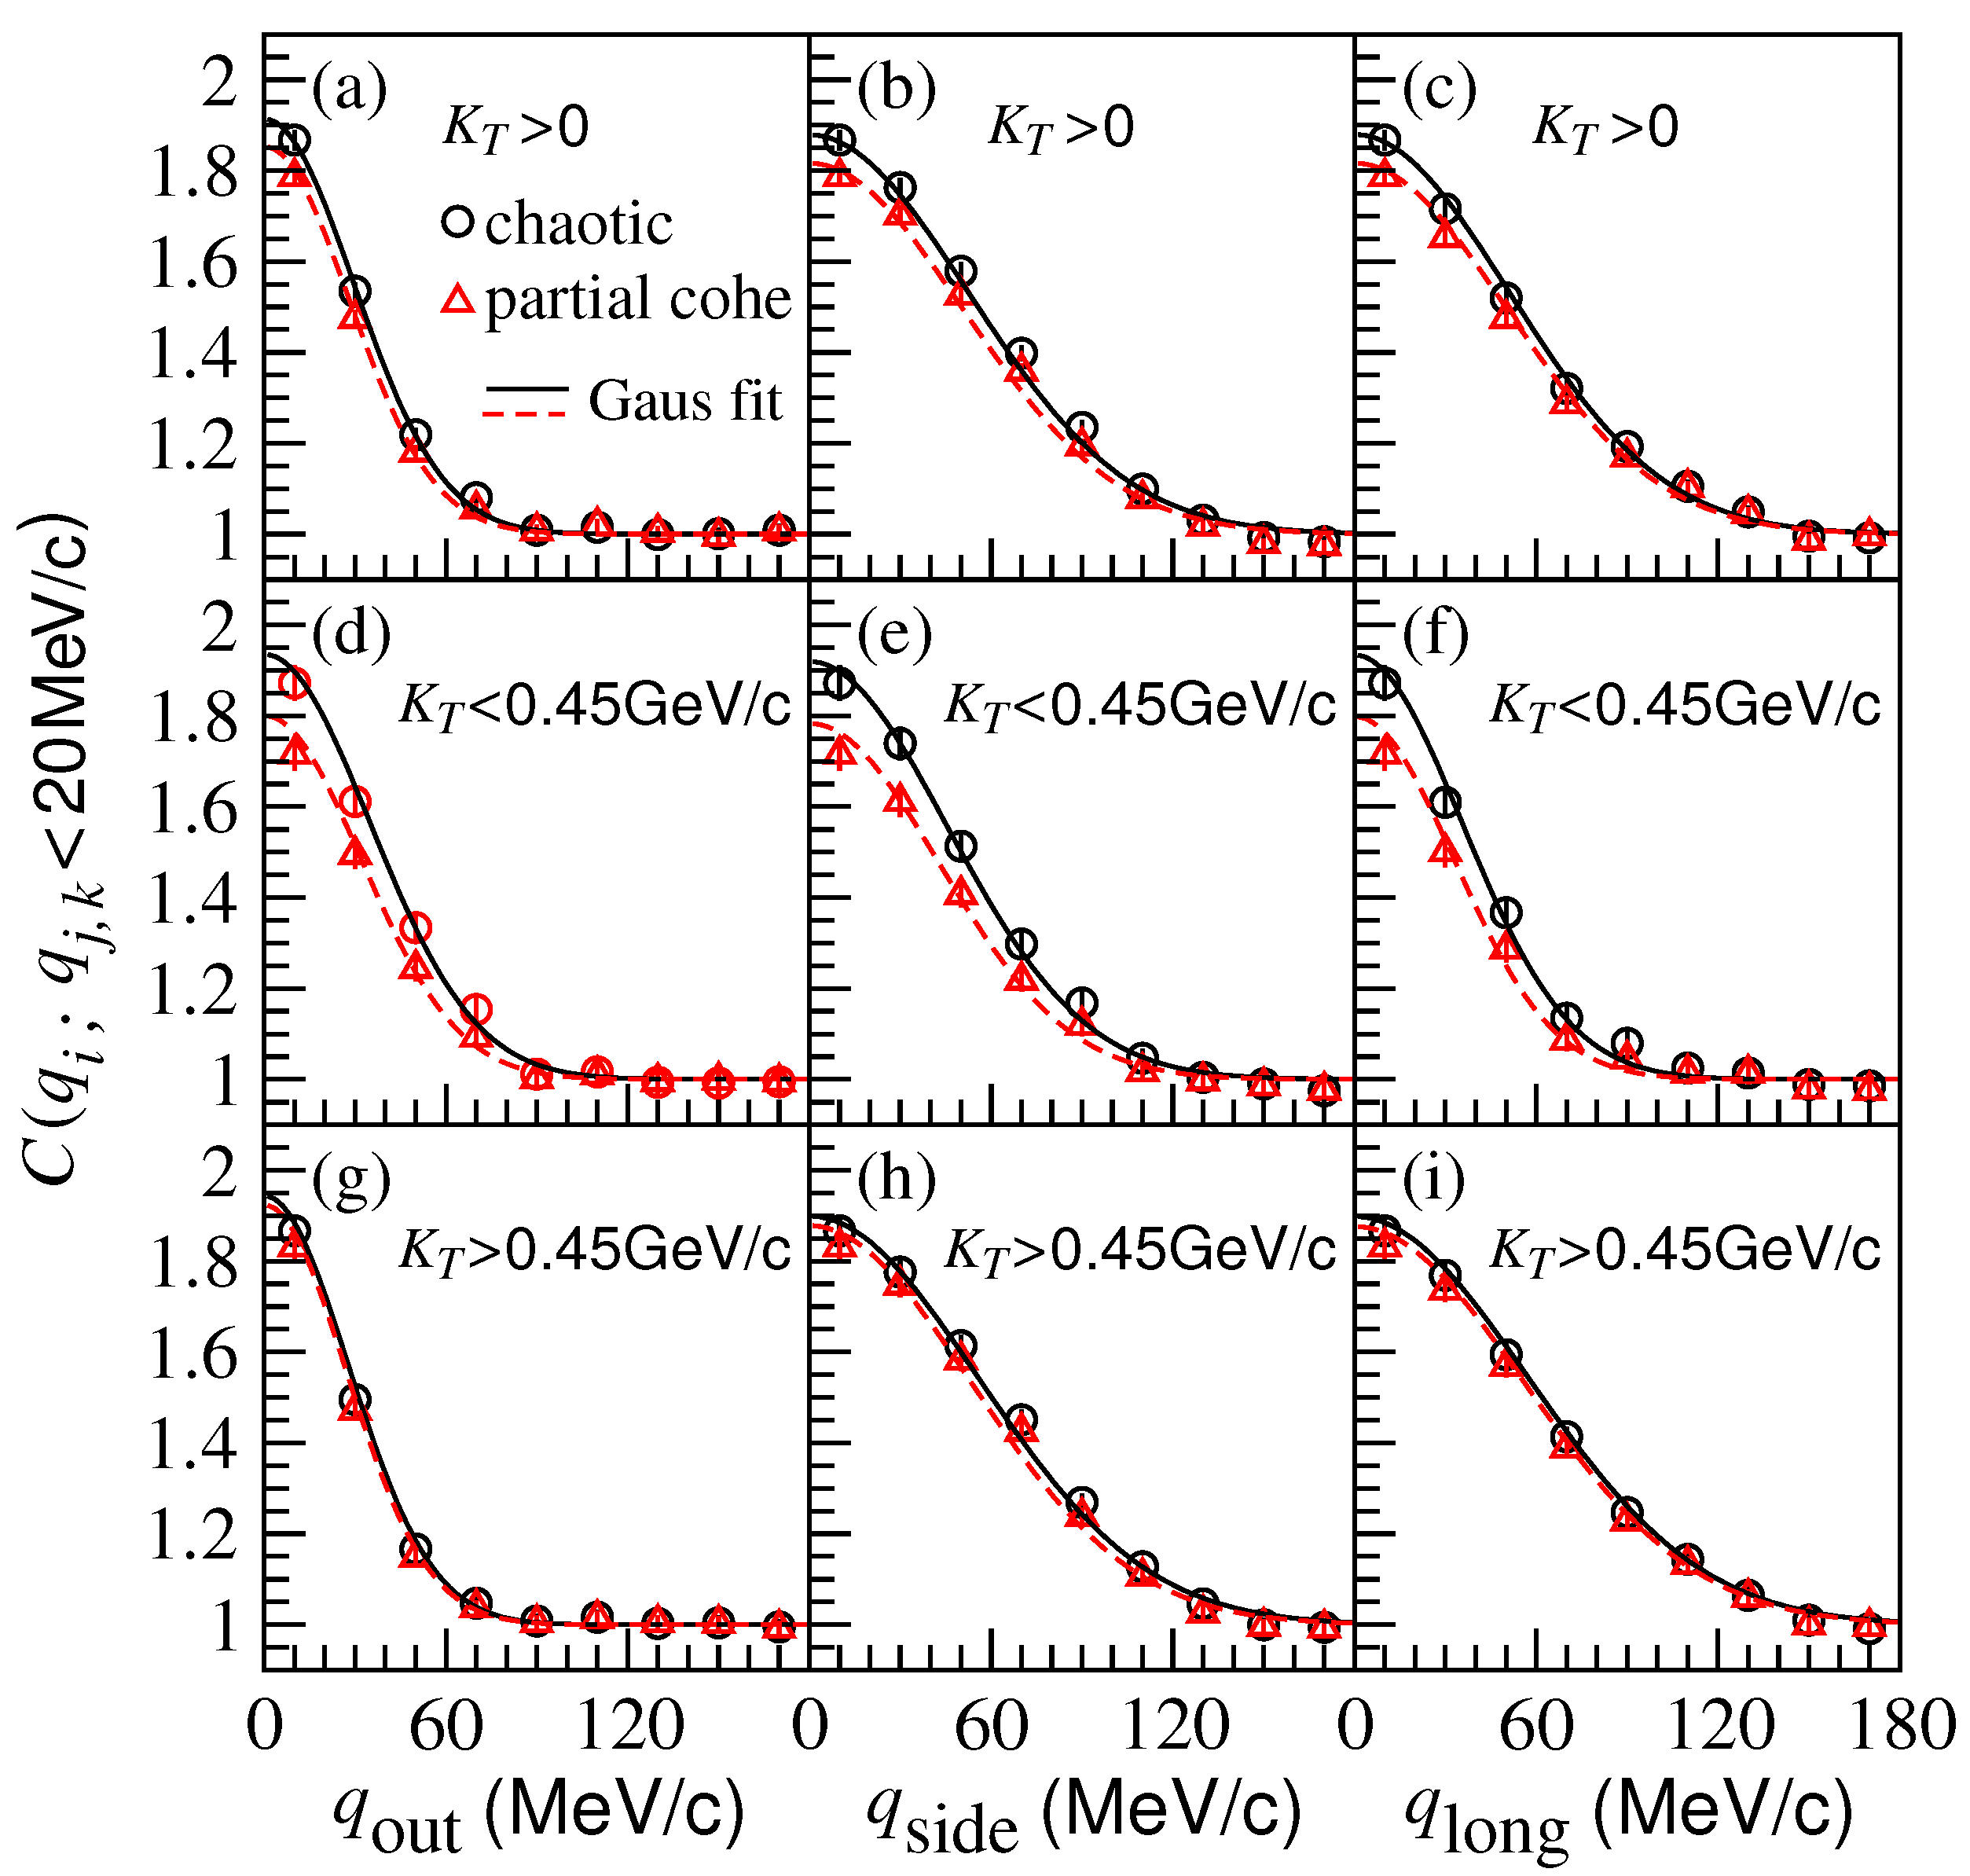
Figure 7 shows the two-kaon correlation functions in the out, side, and long directions for the chaotic sources (circle symbols) and partially coherent sources (triangle symbols) in Pb-Pb central collisions at TeV using the AMPT model. Here, the solid and dashed lines are the correlation function curves for chaotic and partially coherent sources, respectively, fitted with Equation (16). The top, middle, and bottom rows show the results in the kaon pair transverse momentum intervals, , , and GeV, respectively, in the laboratory frame. The correlation function intercepts near zero relative momenta for the partially coherent sources are lower than those for chaotic sources in the low transverse momentum interval.
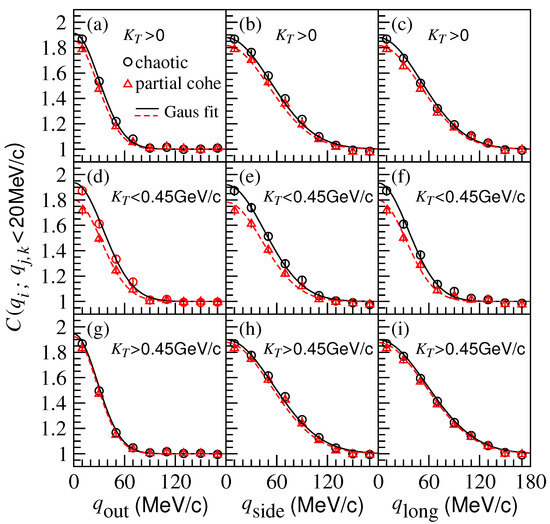
Figure 7.
(Color online) Two-kaon correlation functions with respect to the relative momenta ( out, side, long) in the PCMS frame for chaotic and partially coherent sources in Pb-Pb central collisions at TeV using the AMPT model. The solid and dashed lines are the correlation function curves for chaotic and partially coherent sources, respectively, fitted with Gaussian source formula. The top, middle, and bottom rows show the results in the kaon pair transverse momentum intervals , , and GeV, respectively, in the laboratory frame.
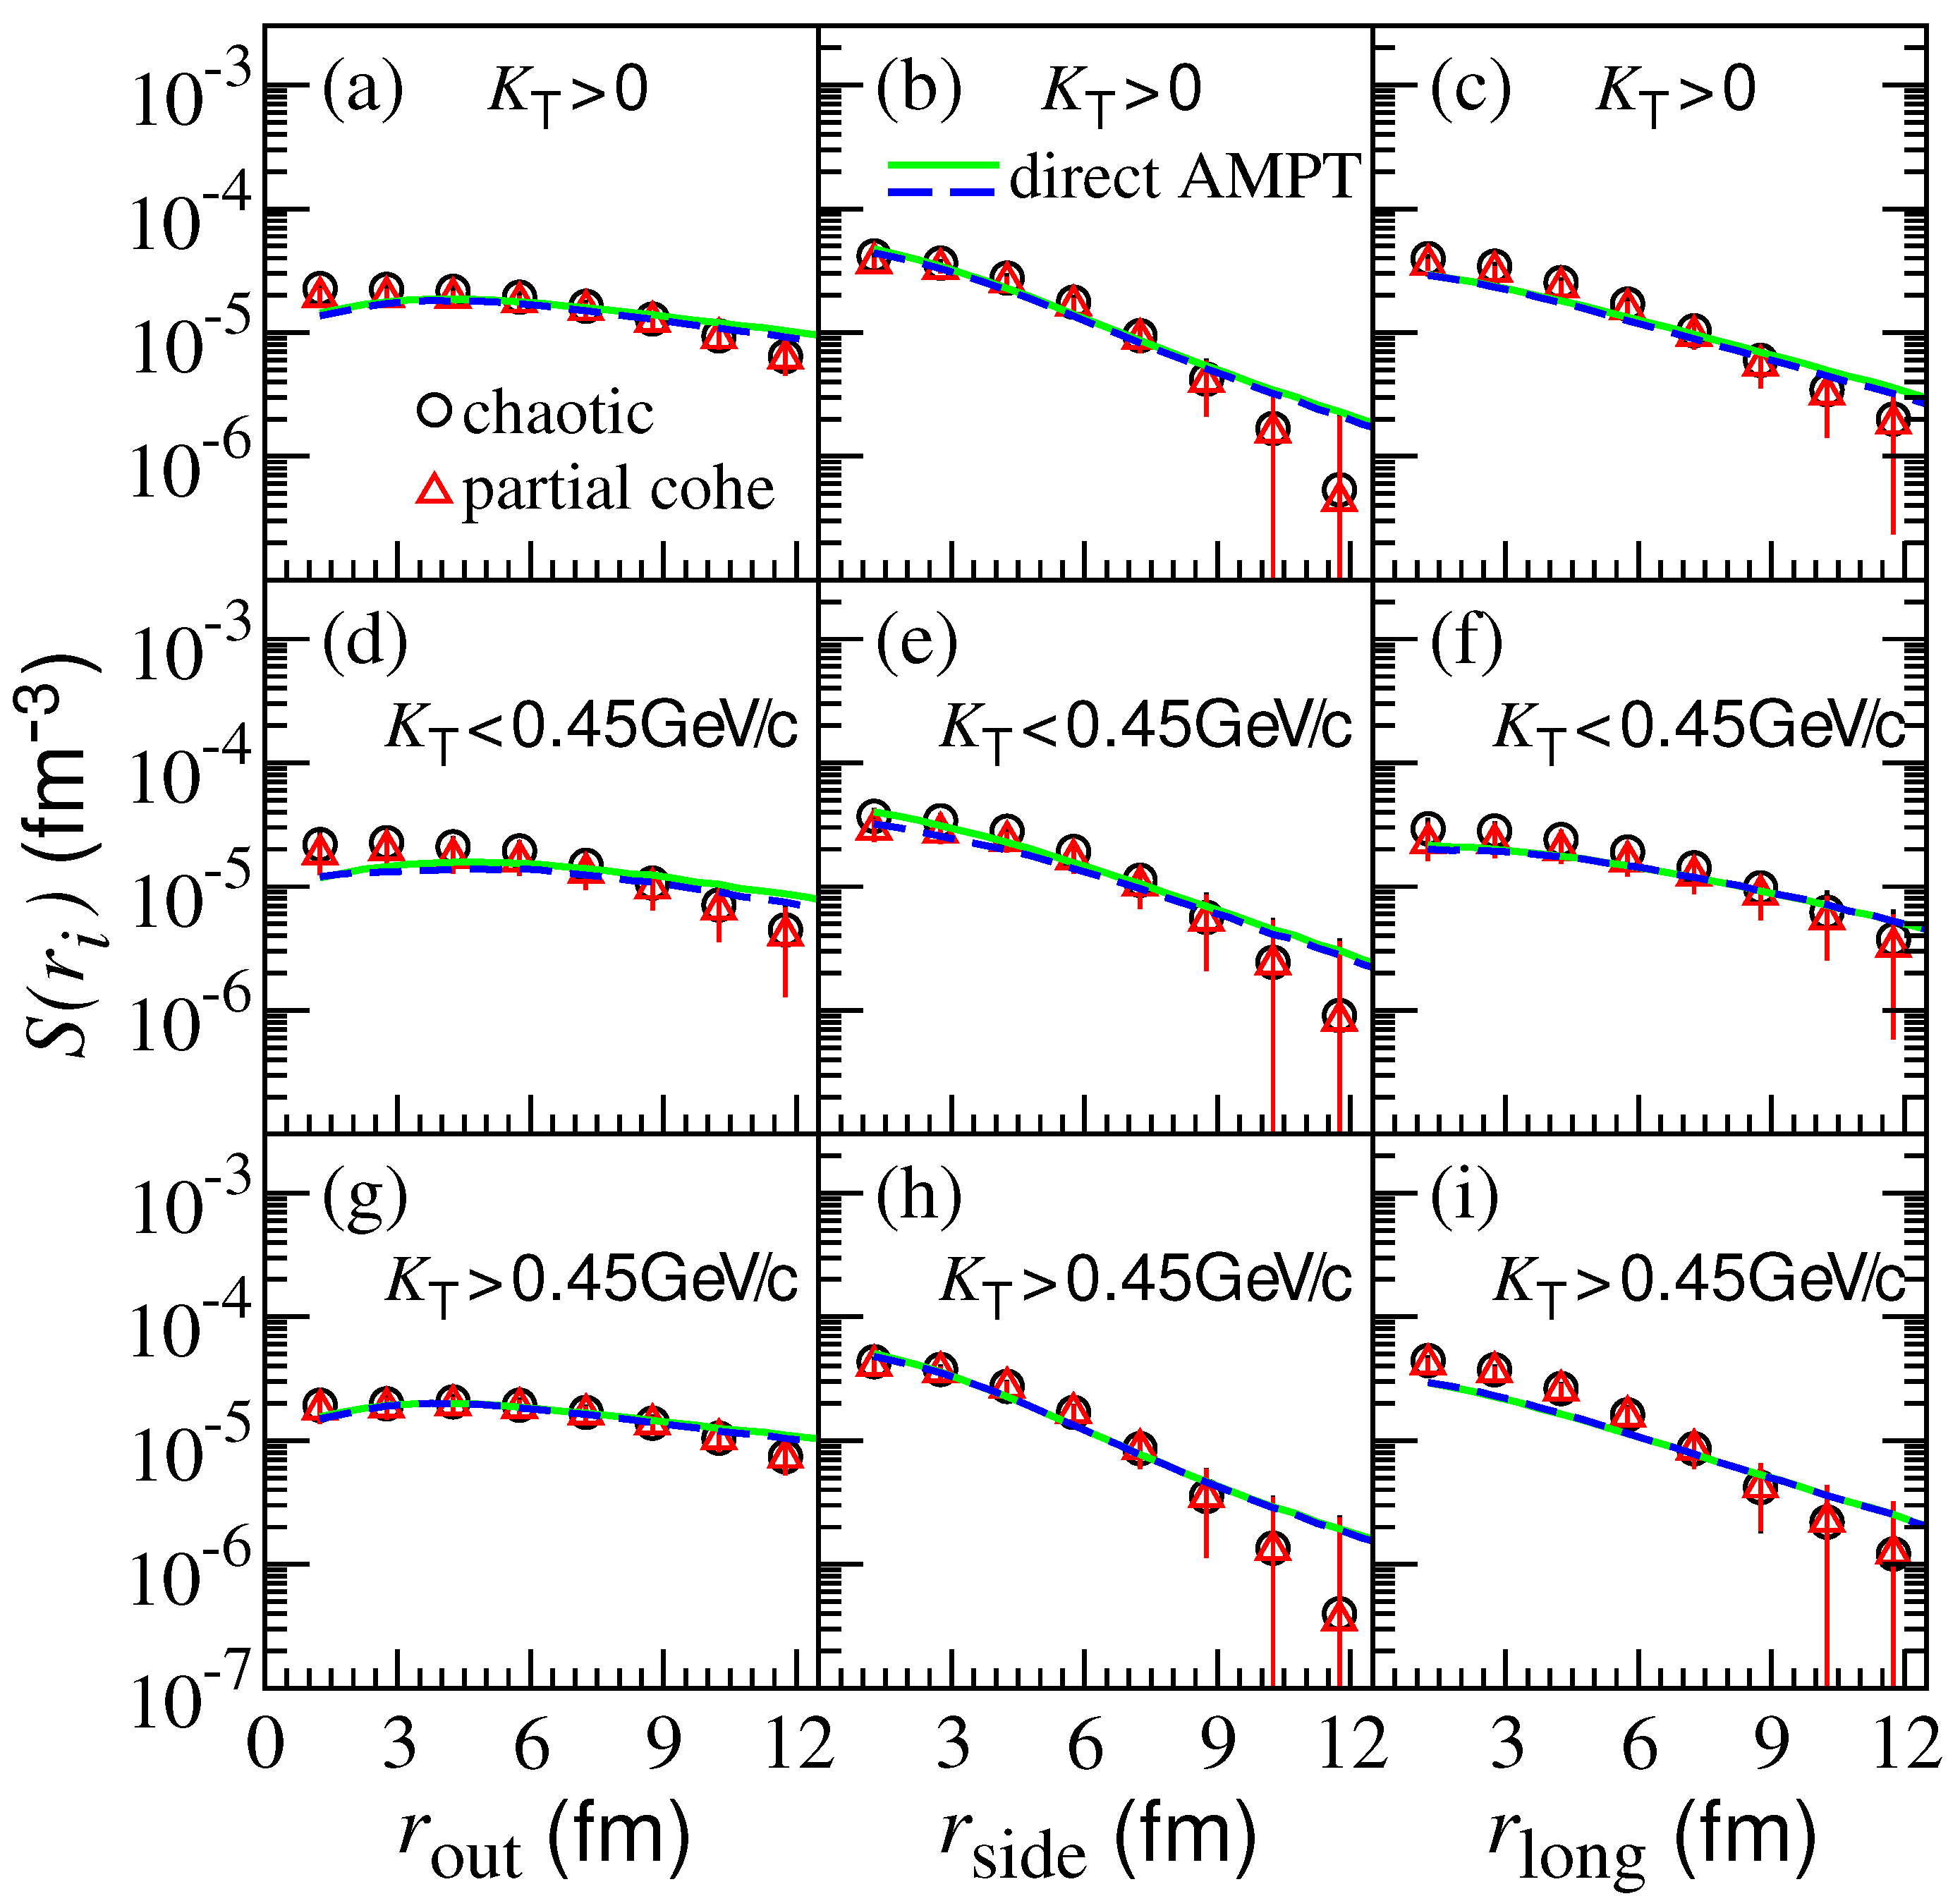
Figure 8 shows the three-dimension kaon source functions ( out, side, long) of the chaotic sources (circle symbols) and partially coherent sources (triangle symbols) in Pb-Pb central collisions at TeV using the AMPT model. Here, the solid and dashed lines are the results directly extracted from the AMPT model for the chaotic and partially coherent sources, respectively. The top, middle, and bottom rows show the results in the kaon pair transverse momentum intervals, , , and GeV, respectively, in the laboratory frame. One can see that the source functions obtained using the imaging technique are consistent with those extracted directly from the AMPT model. The source functions in the out direction are flat with respect to the relative coordinate. The differences between the kaon source functions of the chaotic and partially coherent sources are smaller compared with the pion source functions (see Figure 6).
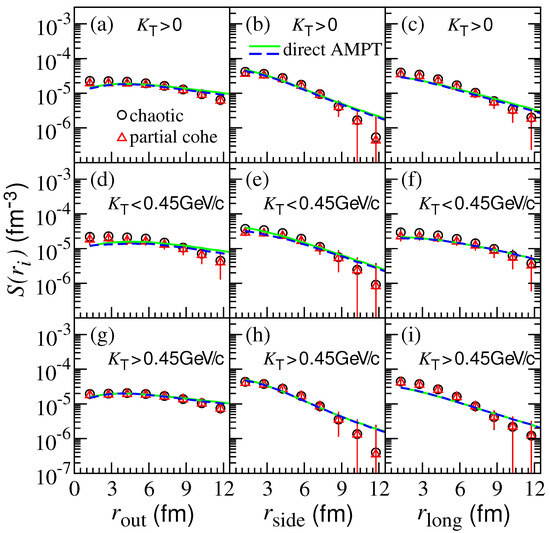
Figure 8.
(Color online) Three-dimension kaon source functions ( out, side, long) of chaotic and partially coherent sources in Pb-Pb central collisions at TeV using the AMPT model. The solid and dashed lines are the results directly extracted from the AMPT model for the chaotic and partially coherent sources, respectively. The top, middle, and bottom rows show the results in the kaon pair transverse momentum intervals, , , and GeV, respectively.
3.4. Characteristic Source Function Quantities
For a one-dimension source function, the nth-order moment of r is
where the denominator is a normalization quantity denoted by
Theoretically, the value of is equal to . It should be unity for a chaotic source and between zero and unity for a partially coherent source. In actual calculations, some data of at a very small r are statistically too low to sample. This affects the calculated results of .
The normalized first- and second-order moments are defined as
They describe the source spatial size and are normalized to the Gaussian radius and the radius square for the spherical Gaussian source [26].
Table 1 presents the characteristic pion and kaon one-dimension source function quantities, , , and , for chaotic and partially coherent sources in Pb-Pb central collisions at TeV using the AMPT model. One can see that the values of the partially coherent pion sources are much smaller than those of the chaotic sources. However, the differences of between chaotic and partially coherent kaon sources are small. This means that the coherence of partially coherent kaon sources is small. In the low pion pair transverse momentum interval, the value of is larger than that in the high transverse momentum interval, meaning that the pion source size is large in the low transverse momentum interval. However, the and values of the kaon sources are almost independent of the pair transverse momentum.

Table 1.
Characteristic quantities , , and of pion and kaon one-dimension source functions for chaotic and partially coherent sources in Pb-Pb central collisions at TeV using the AMPT model.
For a three-dimension source function, the normalized first-order moment of the i component is defined as [26]
which describe the average sizes of the sources in the out, side, and long directions in the PCMS, normalized to the Gaussian radius for the one-dimension Gaussian source functions, .
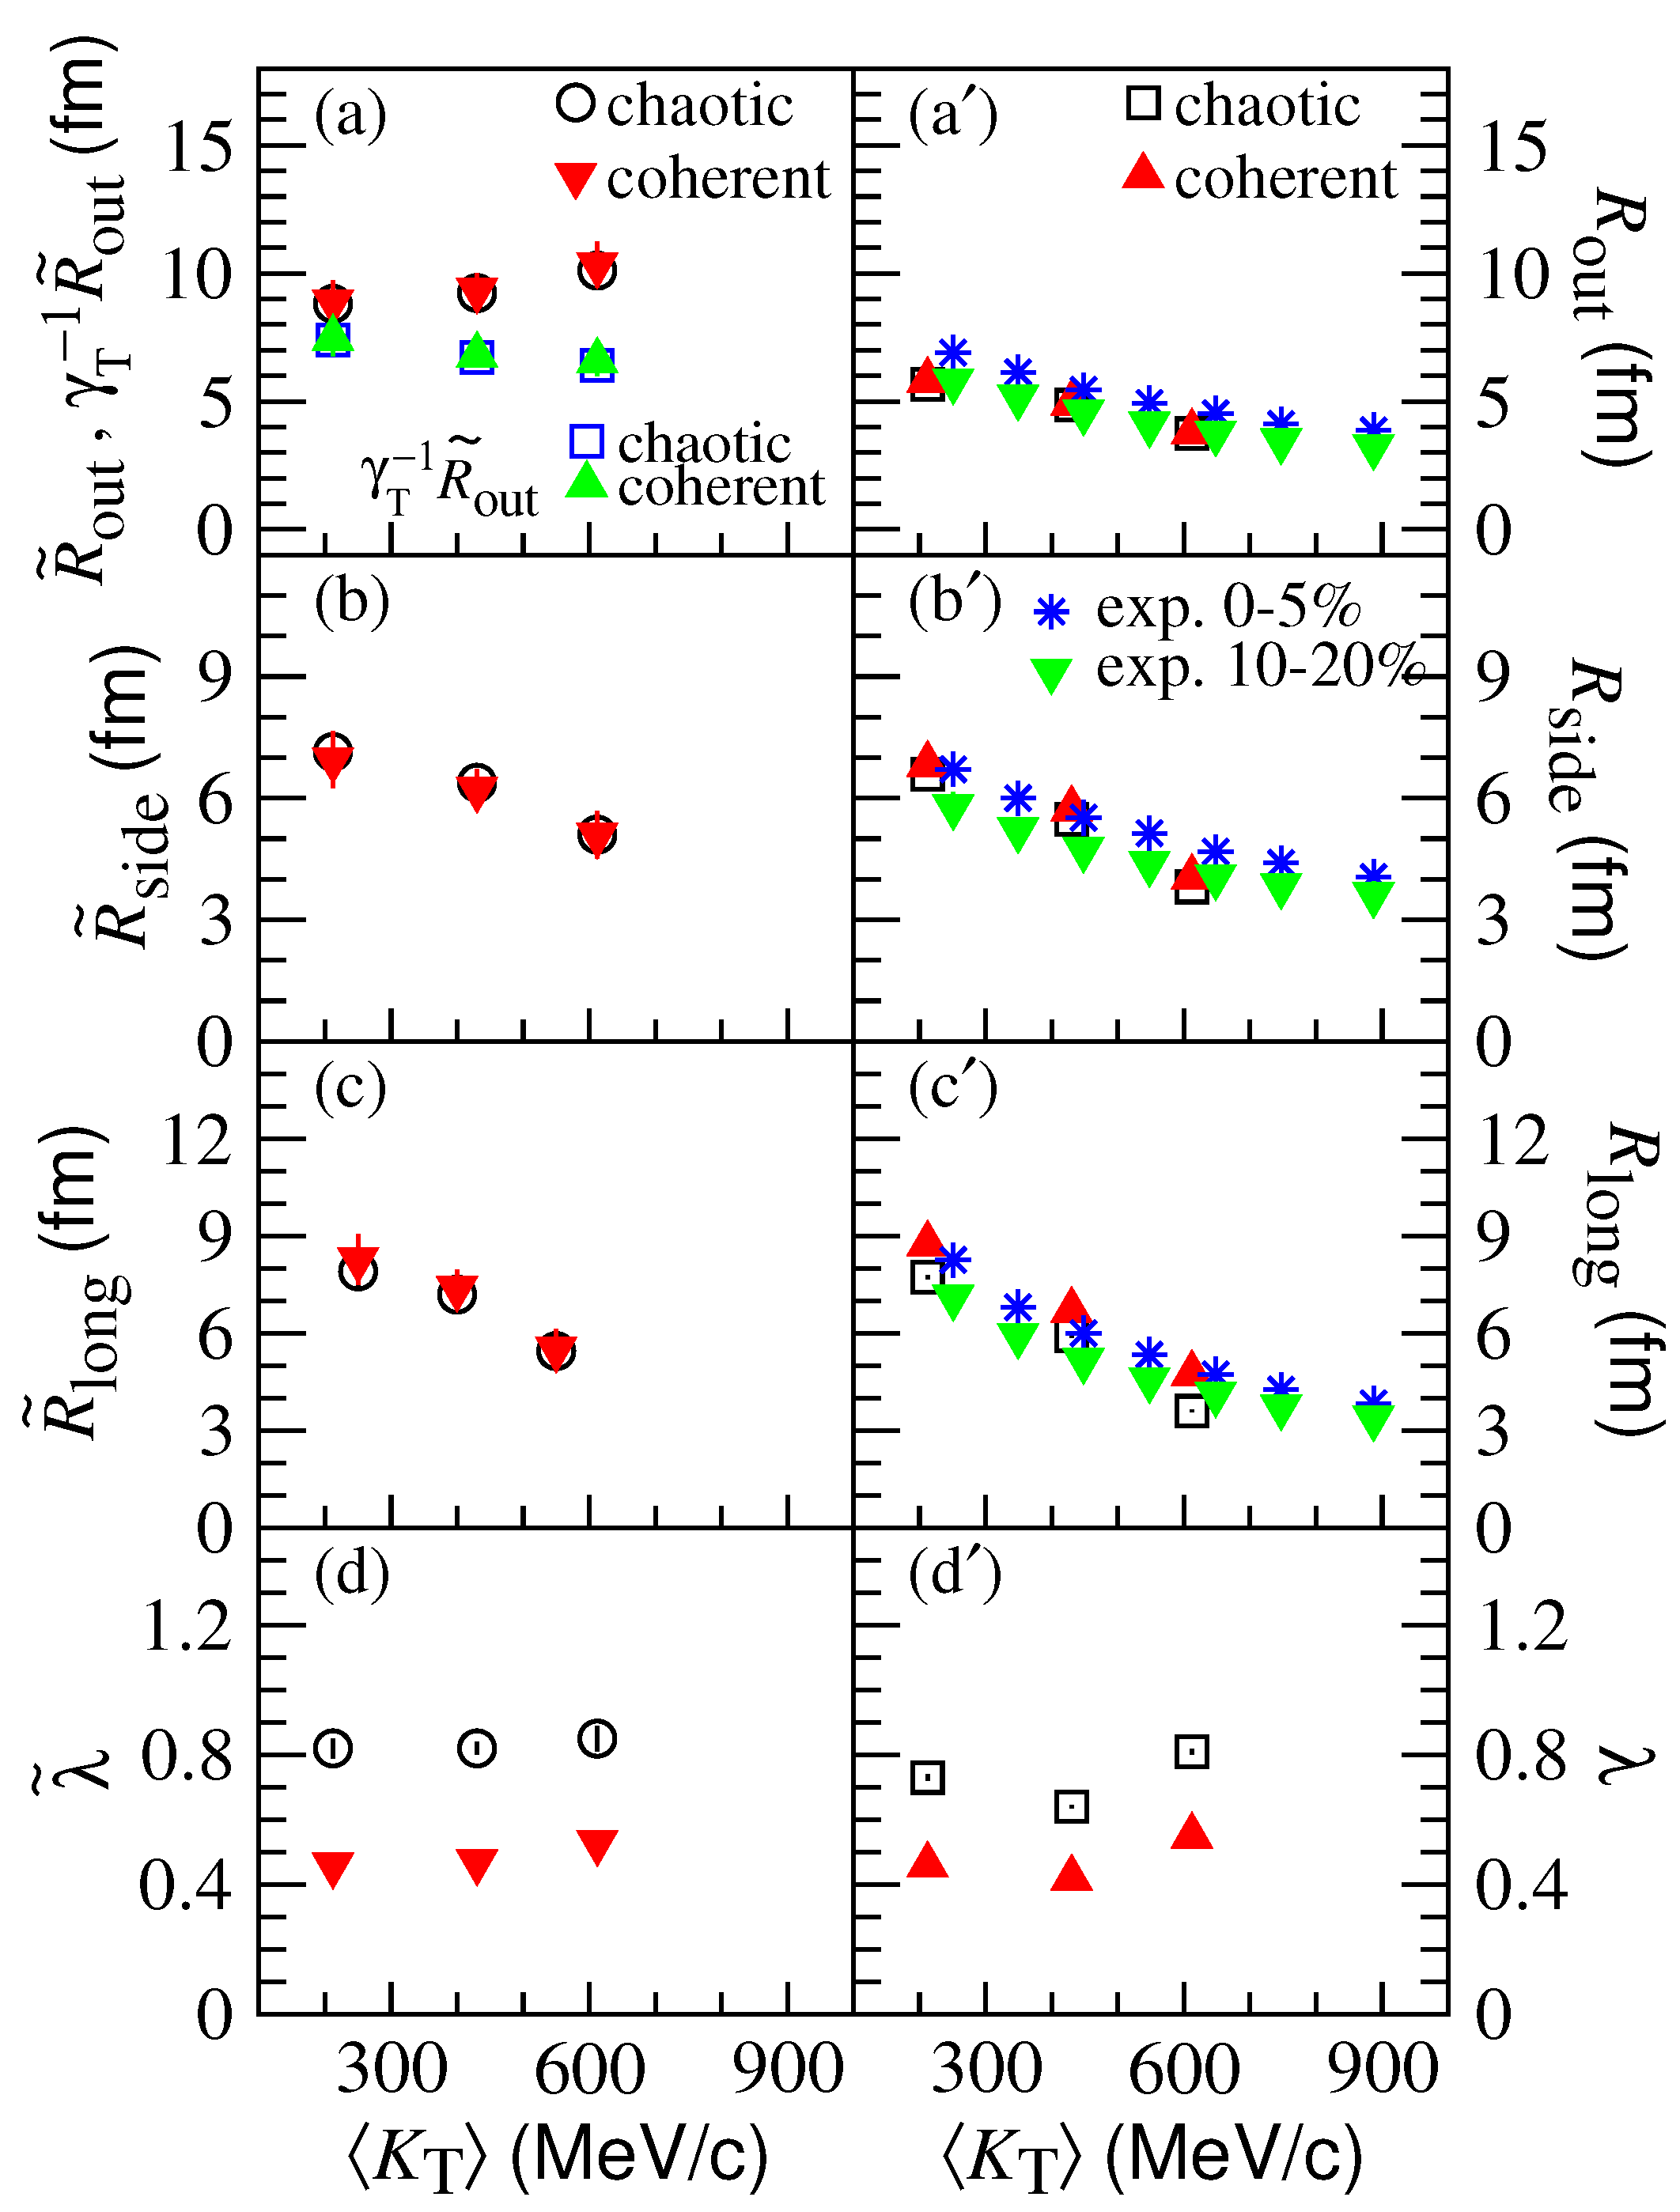
For the AMPT model, Figure 9a–d show the pion imaging results , , , and for the chaotic and partially coherent sources in Pb-Pb central collisions at TeV in the pair transverse momentum intervals, GeV (average GeV), (average GeV), and GeV (average GeV) in the laboratory frame. Figure 9a’–d’ show the fitted results of HBT radii , , , and the chaoticity parameter of the two-pion correlation functions for chaotic and partially coherent sources in the intervals. The correlation functions were calculated using the longitudinal co-moving system (LCMS) to compare them with the experimental data in Pb-Pb collisions at TeV at the LHC [14]. In the LCMS, the pion pair has a transverse velocity , leading to a Lorentz contraction of with the factor . In Figure 9a, the values of are shown for comparison with the fitted results using the LCMS.
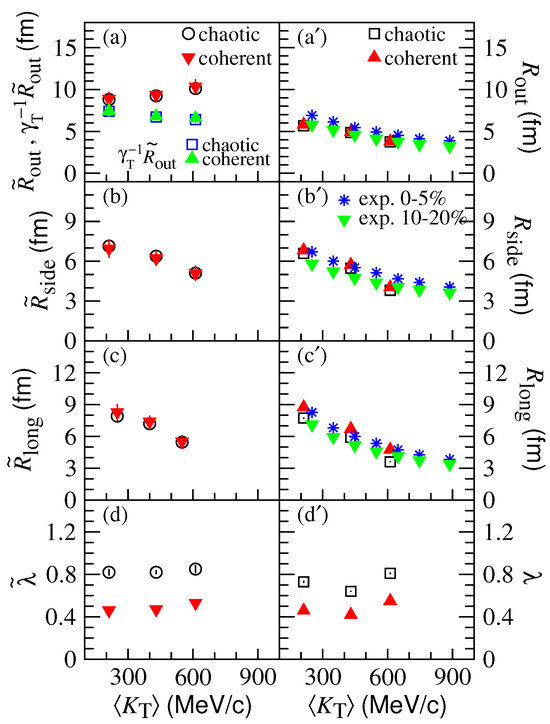
Figure 9.
(Color online) Characteristic pion source function quantities (a–d) and fitted two-pion correlation function results (a’–d’) with respect to the average pair transverse momentum in the transverse momentum intervals, , , and GeV (, 0.430, and 0.612 GeV) in the laboratory frame for chaotic and partially coherent sources in Pb-Pb central collisions at TeV using the AMPT model. The experimental data in the collisions [14] are plotted in the (a’), (b’), and (c’) panels.
One can see that the results of increase with the increase in pair transverse momentum. However, the results of , , and decrease with the increase in pair transverse momentum. This indicates that the particle separations are small at high transverse momenta and infers that the pion pairs with high transverse momenta emit at average levels during early times. The differences in the results between chaotic and partially coherent sources are significant. However, the differences are slight between chaotic and partially coherent sources in the first-order moment results, indicating that the partially coherent sources have high coherence degrees and the sizes of the partially coherent and chaotic sources are approximately the same. The fitted radius and as functions of pair transverse momentum are approximately consistent with the first-order moment and results, respectively, and the fitted radius results are approximately consistent with the experimental data.
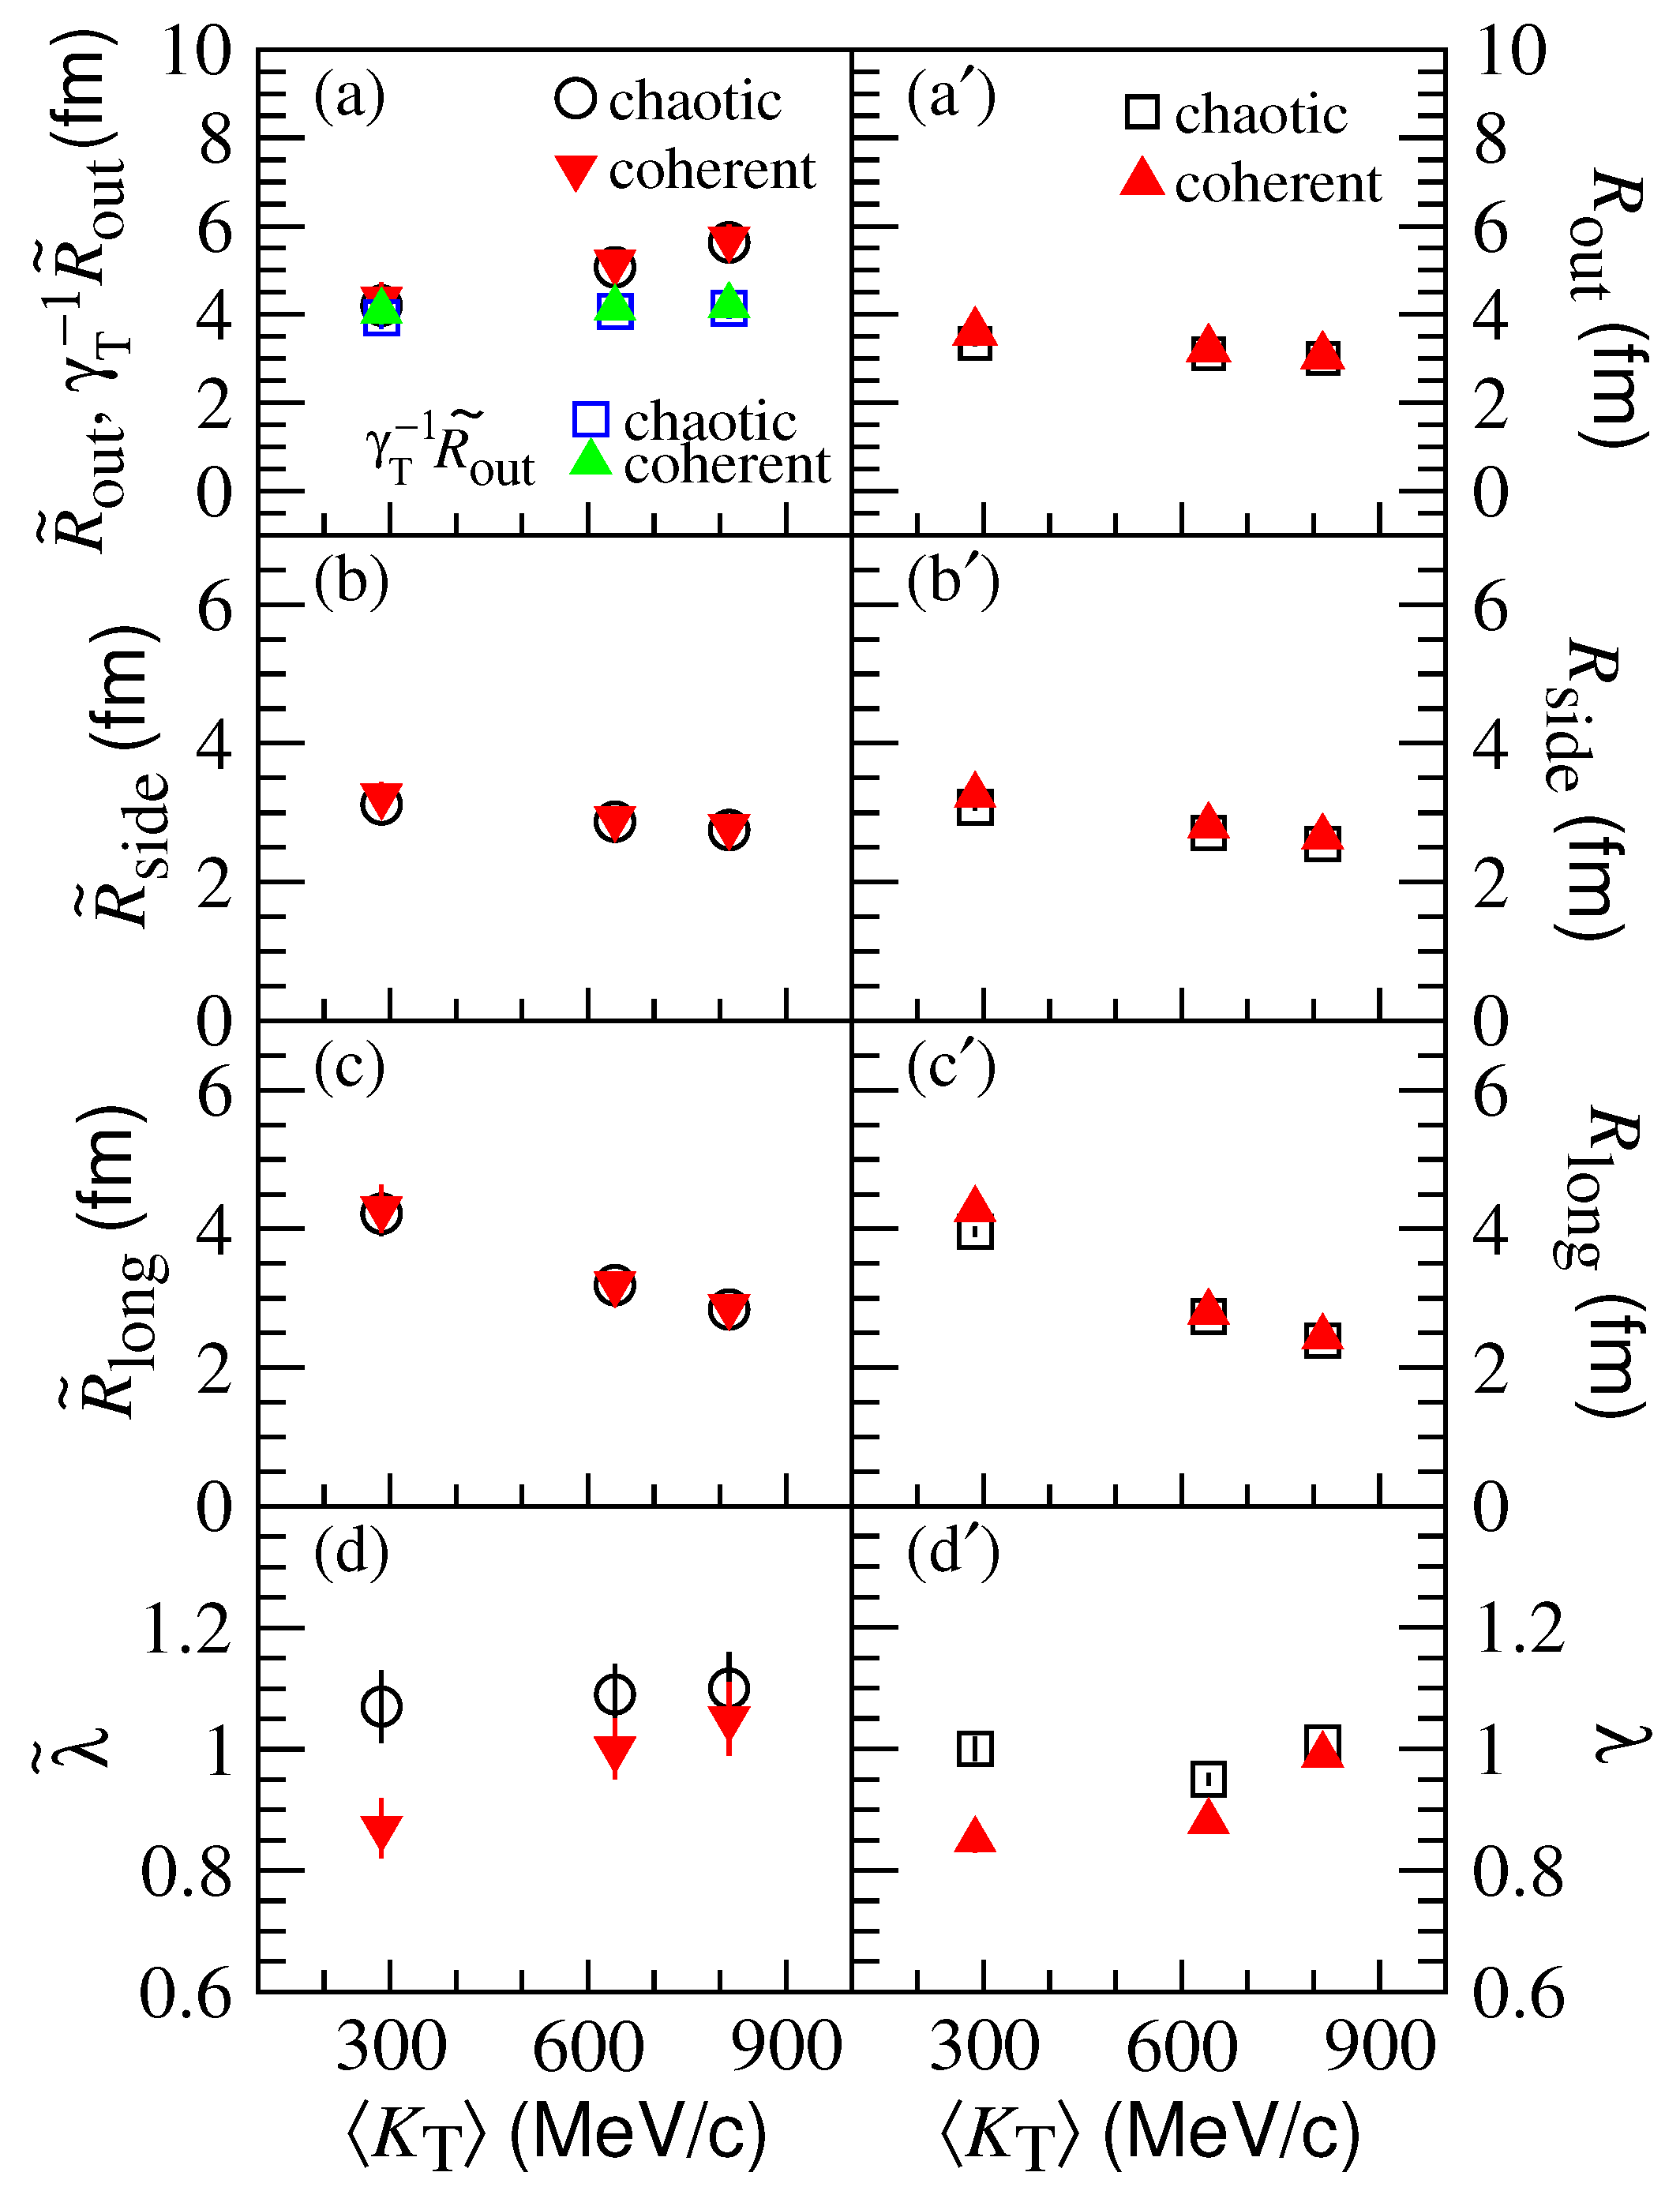
Using the AMPT model, Figure 10a–d show the kaon imaging results , , , , and for the chaotic and partially coherent sources in central Pb-Pb collisions at TeV in the kaon pair transverse momentum intervals, GeV (average GeV), (average GeV), and GeV (average GeV) in the laboratory frame. Figure 10a’–d’ show the , , , and results of the two-kaon correlation functions for the chaotic and partially coherent sources fitted with the Gaussian source Equation (16). One can see that the imaging results are approximately consistent with the fitted two-kaon correlation function results. The transverse first-order moments of the kaon source functions decrease more slowly with the increase in , as compared to the pion results. The and results are near 1 except for the partially coherent source results in the lowest interval. This means that the kaon pairs with high transverse momenta are emitted with a high degree of chaos.
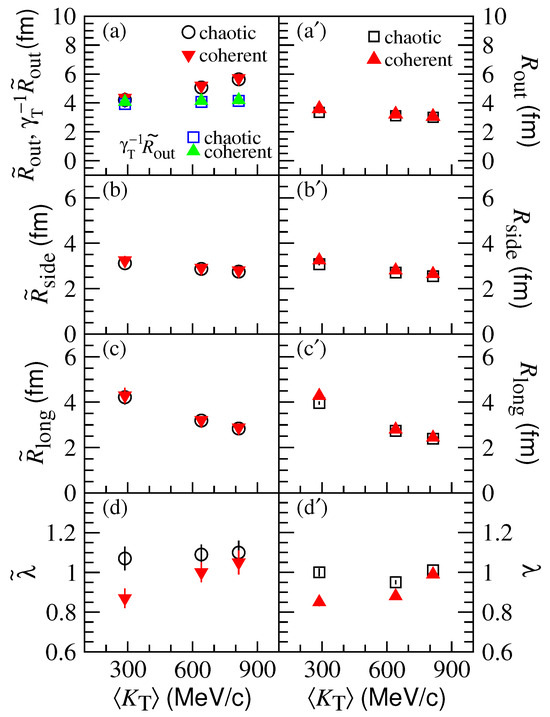
Figure 10.
(Color online) Characteristic kaon source function quantities (a–d) and fitted two-kaon correlation function results (a’–d’) with respect to the average pair transverse momentum in the transverse momentum intervals, , , and GeV (, 0.641, and 0.814 GeV) in the laboratory frame for chaotic and partially coherent sources in Pb-Pb central collisions at TeV using the AMPT model.
4. Summary and Conclusions
Imaging techniques can be used to obtain the source functions of boson-emitting sources from two-boson HBT correlation functions measured in high-energy heavy-ion collisions. The source spatial size and coherence results obtained using imaging source functions are independent of the emitting source model and may accurately reflect the source properties.
In this work, we studied the one- and three-dimension pion and kaon source functions for chaotic and partially coherent sources in Pb-Pb central collisions at TeV using the AMPT model. The characteristic source function quantities were calculated and compared with the radius and chaoticity parameter results of the two-boson correlation functions fitted with the Gaussian source formula.
We found that the pion source functions of partially coherent sources are lower than those of the chaotic sources, and the differences between the kaon source functions of the chaotic and partially coherent sources are smaller than those of the pion source functions. The first-order moment values of the partially coherent pion sources are slightly different from those of the chaotic pion sources. However, the characteristic quantities of the partially coherent pion sources are much smaller than those of the chaotic pion sources. The characteristic pion source function quantities are approximately consistent with the two-pion correlation function results fitted with the Gaussian source formula. Compared to pion results, the kaon first-order moments of the source functions decrease more slowly with the increase in pair transverse momentum. The values of the kaon source functions are near 1 in high pair transverse momentum intervals. This means that the kaon pairs with high transverse momenta are emitted with a high degree of chaos. In future studies, a comparison of the source imaging in various high-energy heavy-ion collision models will be of interest.
Author Contributions
Methodology, Y.-Y.R. and W.-N.Z.; investigation, S.-Y.W. and W.-N.Z.; data curation, W.-N.Z.; writing—original draft preparation, Y.-Y.R., S.-Y.W. and W.-N.Z.; writing—review and editing, Y.-Y.R., S.-Y.W. and W.-N.Z. All authors have read and agreed to the published version of the manuscript.
Funding
This research was supported by the National Natural Science Foundation of China under Grant No. 12175031.
Data Availability Statement
Data is contained within the article.
Acknowledgments
We thank Zi-Wei Lin for useful discussions and suggestions. We thank Jun-Ting Ye for help in analysis programs.
Conflicts of Interest
The authors declare no conflicts of interest.
References
- Gyulassy, M.; Kauffmann, S.K.; Wilson, L.W. Pion Interferometry of Nuclear Collisions. 1. Theory. Phys. Rev. C 1979, 20, 2267. [Google Scholar] [CrossRef]
- Wong, C.Y. Introduction to High-Energy Heavy-Ion Collisions; World Scientific: Singapore, 1994; Chapter 17. [Google Scholar]
- Wiedemann, U.A.; Heinz, U. Particle Interferometry for Relativistic Heavy-Ion Collisions. Phys. Rep. 1999, 319, 145. [Google Scholar] [CrossRef]
- Weiner, R.M. Boson Interferometry in High-Energy Physics. Phys. Rep. 2000, 327, 249. [Google Scholar] [CrossRef]
- Csörgő, T. Particle Interferometry from 40 MeV to 40 TeV. Heavy Ion Phys. 2002, 15, 1, arXiv:hep-ph/0001233. [Google Scholar] [CrossRef]
- Lisa, M.A.; Pratt, S.; Soltz, R.; Wiedemann, U. Femtoscopy in Relativistic Heavy Ion Collisions: Two Decades of Progress. Annu. Rev. Nucl. Part. Sci. 2005, 55, 357. [Google Scholar] [CrossRef]
- Adler, C. et al. [STAR Collaboration] Pion Interferometry of = 130 GeV Au+Au Collisions at RHIC. Phys. Rev. Lett. 2001, 87, 082301. [Google Scholar] [CrossRef] [PubMed]
- Adler, S.S. et al. [PHENIX Collaboration] Bose-Einstein Correlations of Charged Pion Pairs in Au+Au Collisions at = 200 GeV. Phys. Rev. Lett. 2004, 93, 152302. [Google Scholar] [CrossRef] [PubMed]
- Adams, J. et al. [STAR Collaboration] Pion Interferometry in Au+Au Collisions at = 200 GeV. Phys. Rev. C 2005, 71, 044906. [Google Scholar] [CrossRef]
- Aamodt, K. et al. [ALICE Collaboration] Two-Pion Bose-Einstein Correlations in Central Pb-Pb Collisions at = 2.76 TeV. Phys. Lett. B 2011, 696, 328. [Google Scholar] [CrossRef]
- Abelev, B. et al. [ALICE Collaboration] Two- and Three-Pion Quantum Statistics Correlations in Pb-Pb Collisions at = 2.76 TeV at the CERN Large Hadron Collider. Phys. Rev. C 2014, 89, 024911. [Google Scholar] [CrossRef]
- Adamczky, L. et al. [STAR Collaboration] Beam-Energy-Dependent Two-Pion Interferometry and the Freeze-out Eccentricity of Pions Measured in Heavy Ion Collisions at the STAR Detector. Phys. Rev. C 2015, 92, 014904. [Google Scholar] [CrossRef]
- Adam, J. et al. [ALICE Collaboration] One-Dimensional Pion, Kaon, and Proton Femtoscopy in Pb-Pb Collisions at = 2.76 TeV. Phys. Rev. C 2015, 92, 054908. [Google Scholar] [CrossRef]
- Adam, J. et al. [ALICE Collaboration] Centrality Dependence of Pion Freeze-out Radii in Pb-Pb Collisions at = 2.76 TeV. Phys. Rev. C 2016, 93, 024905. [Google Scholar] [CrossRef]
- Brown, D.A.; Danielewicz, P. Imaging of Sources in Heavy-Ion Reactions. Phys. Lett. B 1997, 398, 252. [Google Scholar] [CrossRef]
- Brown, D.A.; Danielewicz, P. Optimized Discretization of Sources Imaged in Heavy-Ion Reactions. Phys. Rev. C 1998, 57, 2474. [Google Scholar] [CrossRef]
- Brown, D.A.; Danielewicz, P. Observing Non-Gaussian Sources in Heavy-Ion Reactions. Phys. Rev. C 2001, 64, 014902. [Google Scholar] [CrossRef]
- Panitkin, S.Y. et al. [E895 Collaboration] Model-Independent Source Imaging Using Two-Pion Correlations in (2 to 8)A GeV Au+Au Collisions. Phys. Rev. Lett. 2001, 87, 112304. [Google Scholar] [CrossRef] [PubMed]
- Chung, P. et al. [E895 Collaboration] Comparison of Source Images for Protons, π−’s, and Λ’s in 6A GeV Au+Au Collisions. Phys. Rev. Lett. 2003, 91, 162301. [Google Scholar] [CrossRef] [PubMed]
- Chung, P.; [for PHENIX Collaboration]. Evidence for a Long Range Structure in the Pion Emission Source in Au+Au Collisions at RHIC. Nucl. Phys. A 2006, 774, 607. [Google Scholar] [CrossRef][Green Version]
- Adler, S.S. et al. [PHENIX Collabortion] Evidence for a Long-Range Component in the Pion Emission Source in Au+Au Collisions at = 200 GeV. Phys. Rev. Lett. 2007, 98, 132301. [Google Scholar] [CrossRef]
- Chung, P.; [for PHENIX Collaboration]. Three-Dimensional Two-Pion Emission Source at RHIC-PHENIX. J. Phys. G 2008, 35, 044034. [Google Scholar] [CrossRef]
- Lacey, R.A.; [for PHENIX Collaboration]. PHENIX Measurements of 3D Emission Source Functions in Au+Au Collisions at = 200 GeV. J. Phys. G 2008, 35, 104139. [Google Scholar] [CrossRef][Green Version]
- Afanasiev, S. et al. [PHENIX Collaboration] Source Breakup Dynamics in Au+Au Collisions at = 200 GeV via Three-Dimensional Two-Pion Source Imaging. Phys. Rev. Lett. 2008, 100, 232301. [Google Scholar] [CrossRef]
- Yang, Z.T.; Zhang, W.N.; Huo, L.; Zhang, J.B. Imaging of Granular Sources in High Energy Heavy Ion Collisions. J. Phys. G 2009, 36, 015113. [Google Scholar] [CrossRef]
- Zhang, W.N.; Yang, Z.T.; Ren, Y.Y. Characteristic Quantities of Pion-Emitting Sources Extracted by Model-Independent Analysis in Relativistic Heavy Ion Collisions. Phys. Rev. C 2009, 80, 044908. [Google Scholar] [CrossRef]
- Wang, S.Y.; Ye, J.T.; Zhang, W.N. Two-Pion Interferometry for Partially Coherent Sources in Relativistic Heavy-Ion Collisions in a Multiphase Transport Model. Phys. Rev. C 2024, 109, 014912. [Google Scholar] [CrossRef]
- Lin, Z.W.; Ko, C.M. Partonic Effects on the Elliptic Flow at Relativistic Heavy Ion Collisions. Phys. Rev. C 2002, 65, 034904. [Google Scholar] [CrossRef]
- Lin, Z.W.; Ko, C.M.; Li, B.A.; Zhang, B.; Pal, S. Multiphase Transport Model for Relativistic Heavy Ion Collisions. Phys. Rev. C 2005, 72, 064901. [Google Scholar] [CrossRef]
- Wang, S.Y.; Ye, J.T.; Zhang, W.N. Multiboson Hanbury-Brown-Twiss Correlations for Partially Coherent Sources in Relativistic Heavy-Ion Collisions in a Multiphase Transport Mode. Phys. Rev. C 2024, 110, 054907. [Google Scholar] [CrossRef]
- Koonin, S.E. Proton Pictures of High-energy Nuclear Collisions. Phys. Lett. B 1977, 70, 43. [Google Scholar] [CrossRef]
- Pratt, S.; Csörgő, T.; Zimányi, J. Detailed Predictions for Two-Pion Correlations in Ultrarelativistic Heavy-Ion Collisions. Phys. Rev. C 1990, 42, 2646. [Google Scholar] [CrossRef]
- Brown, D.A.; Panitkin, S.Y.; Bertsch, G.F. Extracting Particle Freeze-out Phase-Space Densities and Entropies from Sources Imaged in Heavy-Ion Reactions. Phys. Rev. C 2000, 62, 014904. [Google Scholar] [CrossRef]
- Brown, D.A.; Enokizono, A.; Heffner, M.; Soltz, R.; Danielewicz, P.; Pratt, S. Imaging Three Dimensional Two-Particle Correlations for Heavy-Ion Reaction Studies. Phys. Rev. C 2005, 72, 054902. [Google Scholar] [CrossRef]
- Nasim, M.; Kumar, L.; Kumar, P.; Mohanty, B. Energy Dependence of Elliptic Flow from Heavy-Ion Collision Models. Phys. Rev. C 2010, 82, 054908. [Google Scholar] [CrossRef]
- Xu, J.; Ko, C.M. Effects of Triangular Flow on Di-Hadron Azimuthal Correlations in Relativistic Heavy Ion Collisions. Phys. Rev. C 2011, 83, 021903(R). [Google Scholar] [CrossRef]
- Solanki, D.; Sorensen, P.; Basu, S.; Raniwala, R.; Nayak, T.K. Beam Energy Dependence of Elliptic and Triangular Flow with the AMPT Model. Phys. Lett. B 2013, 720, 352. [Google Scholar] [CrossRef]
- Bzdak, A.; Ma, G.L. Elliptic and Triangular Flow in p-Pb and Peripheral Pb-Pb Collisions from Parton Scatterings. Phys. Rev. Lett. 2014, 113, 252301. [Google Scholar] [CrossRef] [PubMed]
- Ma, G.L.; Lin, Z.W. Predictions for = 5.02 TeV Pb+Pb Collisions from a Multiphase Transport Model. Phys. Rev. C 2016, 93, 054911. [Google Scholar] [CrossRef]
- Li, H.; He, L.; Lin, Z.W.; Molnar, D.; Wang, F.; Xie, W. Origin of the Mass Splitting of Azimuthal Anisotropies in a Multiphase Transport Model. Phys. Rev. C 2017, 96, 014901. [Google Scholar] [CrossRef]
- Haque, M.R.; Nasim, M.; Mohanty, B. Systematic Investigation of Azimuthal Anisotropy in Au+Au and U+U Collisions at = 200 GeV. J. Phys. G 2019, 46, 085104. [Google Scholar] [CrossRef]
- Dordevic, M.; Milosevic, J.; Nadderd, L.; Stojanovic, M.; Wang, F.; Zhu, X. Correlations between Azimuthal Anisotropy Fourier Harmonics in Pb-Pb Collisions at = 2.76 TeV in the HYDJET++ Model and in the Multiphase Transport Model. Phys. Rev. C 2020, 101, 014908. [Google Scholar] [CrossRef]
- Shao, T.; Chen, J.; Ko, C.M.; Lin, Z.W. Enhanced Production of Strange Baryons in High-Energy Nuclear Collisions from a Multiphase Transport Model. Phys. Rev. C 2020, 102, 014906. [Google Scholar] [CrossRef]
- Sun, K.J.; Ko, C.M. Light Nuclei Production in a Multiphase Transport Model for Relativistic Heavy Ion Collisions. Phys. Rev. C 2021, 103, 064909. [Google Scholar] [CrossRef]
- Magdy, N.; Lacey, R.A. Model Investigation of the Longitudinal Broadening of the Transverse Momentum Two-Particle Correlator. Phys. Rev. C 2021, 104, 014907. [Google Scholar] [CrossRef]
- Basu, S.; Gonzalez, V.; Pan, J.; Knospe, A.; Marin, A.; Markert, C.; Pruneau, C. Differential Two-Particle Number and Momentum Correlations with the AMPT, UrQMD, and EPOS Models in Pb-Pb Collisions at = 2.76 TeV. Phys. Rev. C 2021, 104, 064902. [Google Scholar] [CrossRef]
- Magdy, N.; Evdokimov, O.; Lacey, R.A. A Method to Test the Coupling Strength of the Linear and Nonlinear Contributions to Higher-Order Flow Harmonics via Event Shape Engineering. J. Phys. G 2021, 48, 025101. [Google Scholar] [CrossRef]
- Zhang, Z.; Yu, N.; Xu, H. Neutron Density Fluctuation and Neutron-Proton Correlation from AMPT Model. Eur. Phys. J. A 2022, 58, 240. [Google Scholar] [CrossRef]
- Wang, X.N.; Gyulassy, M. Hijing: A Monte Carlo Model for Multiple Jet Production in pp, pA, and AA Collisions. Phys. Rev. D 1991, 44, 3501. [Google Scholar] [CrossRef] [PubMed]
- Zhang, B. ZPC 1.0.1: A Parton Cascade for Ultrarelativistic Heavy Ion Collisions. Comput. Phys. Commun. 1998, 109, 193. [Google Scholar] [CrossRef]
- Li, B.A.; Ko, C.M. Formation of Superdense Hadronic Matter in High Energy Heavy-Ion Collisions. Phys. Rev. C 1995, 52, 2037. [Google Scholar] [CrossRef]
Disclaimer/Publisher’s Note: The statements, opinions and data contained in all publications are solely those of the individual author(s) and contributor(s) and not of MDPI and/or the editor(s). MDPI and/or the editor(s) disclaim responsibility for any injury to people or property resulting from any ideas, methods, instructions or products referred to in the content. |
© 2025 by the authors. Licensee MDPI, Basel, Switzerland. This article is an open access article distributed under the terms and conditions of the Creative Commons Attribution (CC BY) license (https://creativecommons.org/licenses/by/4.0/).

