Article

Optical Quasi-Periodic Oscillation of Blazar PKS 1440-389 in the TESS Light Curve

1
Department of Physics, Yunnan Normal University, Kunming 650500, China
2
Guangxi Key Laboratory for the Relativistic Astrophysics, Nanning 530004, China
3
Yunnan Province China-Malaysia HF-VHF Advanced Radio Astronomy Technology International Joint Laboratory, Kunming 650011, China
4
College of Physics and Electronic Information, Dezhou University, Dezhou 253023, China
5
Yunnan Key Laboratory, International Centre of Supernovae, Kunming 650216, China
6
South-Western Institute for Astronomy Research, Yunnan University, Kunming 650500, China
*
Authors to whom correspondence should be addressed.
Universe 2024, 10(6), 242; https://doi.org/10.3390/universe10060242
Submission received: 11 April 2024 / Revised: 16 May 2024 / Accepted: 27 May 2024 / Published: 31 May 2024
(This article belongs to the Special Issue Blazar Bursts: Theory and Observation)

Abstract

:
We report the results of time series analysis of blazar PKS 1440-389, observed by the Transiting Exoplanet Survey Satellite (TESS) in two sectors. We find that the source has a quasi-periodic oscillation (QPO) of about 3.1 days for sector 11 and around 3.7 days for sector 38 in the optical band. We use two methods to assess the QPO and its confidence level: Lomb–Scargle periodogram and weighted wavelet Z-transforms. We explore various potential explanations for these rapid quasi-periodic variations and propose that their source most likely resides within the innermost region of the accretion disk. Within this framework, we estimate the mass of the central black hole of this blazar. We obtain black hole masses of 6.65 × 10⁸ M (Schwarzschild black hole) and 4.22 × 10⁹ M (maximally rotating Kerr black hole), with a main period of 3.7 days. Finally, we utilize the kink instability model to explain the QPO.

1. Introduction

Active galactic nuclei (AGNs) exhibit rapid and drastic changes in their physical properties [1]. AGNs have the following observational characteristics [1]: (1) They possess bright and dense nuclear regions, with luminosities far exceeding those of the nuclei of normal galaxies; (2) rapid variability ranging from hours to days; and (3) some of them have the phenomena of radio, optical, and X-ray jets. Blazars are the brightest and most active subclass of AGNs, with rapid and large optical variability. According to the equivalent width of the emission line, blazars can be divided into BL Lacertae (BL Lac) objects and flat spectrum radio quasars (FSRQs). FSRQs have strong emission lines (>5 Å), while the emission lines of BL Lac objects are very weak [2,3]. According to the synchrotron peak frequency, blazars can be divided into low synchrotron peaked (LSP), whose synchrotron peak frequency is less than 10 14 Hz; intermediate synchrotron peaked (ISP), whose synchrotron peak frequency is between 10 14 Hz and 10 15 Hz; and high synchrotron peaked (HSP), whose synchrotron peak frequency is greater than 10 15 Hz [4].
The flux variations of most blazars are random and have no obvious regular pattern [5]. The periodicity of blazars is of great significance for studying the jet-launching mechanism of blazars and the mass of the central black hole. For year-like QPOs, the physical mechanism is mostly attributed to the following: instability of pulsating accretion flow; homogeneous curved helical jet scenario; and Lense–Thirring precession of the flow [6]. For example, the QPO of PKS 0607-157 in the radio band [7] and PKS 0405-385 in the γ -ray light curve [8]. Month-like QPOs can be explained by the helical structure in the jet [9]. For example, the 34.5-day QPO was reported in PKS 2247-131 [9] and 31.3-day transient QPO was reported in γ -rays of S5 0716+714 [10]. The most likely origin of day-like QPOs is in the innermost part of the accretion disk. This kind of QPO was reported in PKS 1510-089 [11].
Relatively few QPOs have been reported in optical bands compared to other bands, and the more classic ones include S5 0716+714 [12], W2R 1926+42 [13], and CTA 102 [14]. Uneven and irregular sampling of optical QPOs results in them being rarely detected in ground-based surveys. When attempting to identify periodic patterns in such datasets, there is a significant concern that the stochastic red noise associated with AGNs may produce delusive quasi-periodic signals [15]. The Transiting Exoplanet Survey Satellite (TESS) [16] is a space telescope that can avoid interference from the earth’s atmosphere on optical band data. Its data products have high precision and regular sampling, so its light curves can be used in periodicity analysis. For example, Kishore et al. [17] used the light-curve data of TESS to discover QPOs of around 0.6–2.5 days in the optical band of blazar S4 0954+658 in 2023. In 2024, Tripathi et al. [18] also used TESS data to discover the QPOs of blazar BL Lacertae, 1RXS J111741.0+2548581, and 1RXS J004519.6+212735.
In this paper, we report a QPO with high confidence in the TESS light curves of PKS 1440-389. In Section 2, we summarize basic information about the TESS satellite and its instrument. In Section 3, we present the TESS observations of the blazar PKS 1440-389 and our reduction technique for these data. In Section 4, we briefly describe various analytical techniques we have used in our search for QPOs. The results of those analyses are reported in Section 5. Conclusions and discussion are given in Section 6.

2. TESS Photometry

TESS was launched by the National Aeronautics and Space Administration (NASA) [16] in 2018, which has four wide-field optical charge-coupled device (CCD) cameras; each camera has a field-of-view (FOV) of 24° × 24°; four cameras connected together create an FOV of 24° × 96° [19]. TESS divides the sky into northern and southern hemispheres during observation. The FOV formed by the four CCD cameras is regarded as a sector, and the two hemispheres are divided into 13 sectors. The observation time of each sector is about 27 days, the wide-field telescope of the TESS allows it to complete a sky survey in just 2 years [16]. The exploration initiative began in the southern hemisphere during Cycle 1, then shifted to the northern hemisphere in Cycle 2. It later returned to the southern hemisphere for Cycle 3 before once again transitioning to the northern hemisphere for Cycle 4. The TESS instrument, primarily designed for the detection of transiting exoplanets through long-term, high-precision photometric monitoring of stars across nearly the entire sky, offers exceptionally high cadence optical monitoring [19]. From 2018 to 2019, the observation cadence of TESS was 30 min. The current observation cadence is 2 min or 10 min (2020–present).

3. TESS Data Reduction

The light-curve extraction and correction for systematics were conducted utilizing the QUAVER software (https://github.com/kristalynnesmith/quaver (accessed on 26 May 2024)), specifically tailored for TESS AGN research. Notably, this software enables users to customize their extraction aperture by selecting from a cutout of the full frame images (FFIs), thereby bypassing the need to download the entire image. This feature proves invaluable in mitigating interference from nearby sources and accommodating extended host galaxies. The QUAVER code is publicly available [20], accompanied by a detailed user guide that describes the various extraction modes in detail.
Figure 1 shows the light curves of PKS 1440-389. The left panel shows the light curve of sector 11. TESS observed this source beginning on 2019 April 27 for around 22.8 days. The observation of sector 38 began on 2021 April 30 and continued for about 25.7 days, it is shown in the right panel of Figure 1. The gray curve represents the error associated with the fluxes, which are shown in black. Due to different cadences, the data dots on the light curve for the former are relatively sparse compared to the latter, which exhibits a denser distribution.

4. Data Analysis

In this section, we use two methods, Lomb–Scargle periodogram (LSP) and weighted wavelet Z-transform (WWZ), to analyze the quasi-periodicity of the target source. And we assess the confidence levels of the QPOs. In addition, we bin the data into 1-h chunks for subsequent analysis.

4.1. Lomb–Scargle Periodogram

Lomb–Scargle periodogram (LSP) [21,22] is a very famous algorithm for detecting and characterizing the periodicity of time series and is widely used in time-domain astronomy. LSP can efficiently calculate the Fourier power spectrum from unevenly sampled data, with a larger power reflecting the likely presence of the frequency, thereby determining possible periodic oscillation elements [23]. The generalized form of LSP is
P L S ( ω ) = 1 2 i = 1 N x t i x ¯ cos ω t i τ i = 1 N cos 2 ω t i τ + i = 1 N x t i x ¯ sin ω t i τ i = 1 N sin 2 ω t i τ ,
where ω presents the angular frequency. The time phase correction τ is
τ = 1 4 π f tan 1 n sin 4 π f t n n cos 4 π f t n .

4.2. Weighted Wavelet Z-Transform

Fourier analysis provides an ideal tool to detect a periodic or quasi-periodic fluctuation, but it has two disadvantages: (1) For non-uniformly sampled data, discontinuities at gaps may cause flase power peaks in the LSP power spectrum. (2) Fourier transform will pay more attention to long-period signals within the entire time span and ignore those intermittent or transient periodic modulated signals [24]. Hence, Fourier analysis may not be optimal where signals may exhibit short intervals of characteristic oscillation.
In this study, we utilize the WWZ method, known for its effectiveness in handling unevenly sampled and sparse data [25]. According to the complex Morlet wavelet function [26]
ψ ( t ) = e t 2 2 e i ω 0 t e ω 0 / 2 ,
where ω 0 represents the attenuation factor.
ψ t b a = e ( t b ) 2 2 a 2 e i ω 0 t b a ,
where a and b represent the scaling and translation parameters, respectively. Then, Foster [27] defines weighted wavelet transform (WWT),
W W T = N e f f 1 V y 2 V x .
N e f f = ω α 2 ω α 2
V x = α ω α x 2 t α β ω β α ω α x t α β ω β 2 , V y = α ω α y 2 t α β ω β α ω α y t α β ω β 2 ,
where N e f f is the number of effective data, V x and V y are the weighted variation in the data and model function, respectively.
After wavelet transform, there will be more effective data points in the low-frequency part compared to the high-frequency part, causing the WWT value to shift towards the high-frequency part. Therefore, Foster [28] employed Z-transform to enhance the performance of wavelet transform when dealing with non-uniform sampling.
Z = N e f f 3 V y 2 V x V y .

4.3. Light-Curve Simulation and Confidence Evaluation

We simulate the artificial light curve according to the method given by Connolly (https://ascl.net/1602.012 (accessed on 28 May 2024)), which implements the algorithm proposed by Emmanoulopoulos et al. [29]. Simulate 10,000 light curves for each original light curve. These artificial light curves have the same power spectral density (PSD). The LSP and WWZ power spectra can be obtained for each simulated light curve. Confidence levels are estimated by calculating the percentiles of the power for each frequency in the periodograms of the simulated light curves. This approach ensures that the LSP and WWZ confidence levels are derived from the simulated LSP and WWZ periodograms, respectively.

5. Results

In this study, we collect and analyze data for PKS 1440-389 obtained from TESS during sector 11 and 38 observations. We detect the periodicity using the LSP and WWZ methods in each sector. LSP provides the Fourier transform of the data, allowing us to analyze the frequency domain. On the other hand, wavelet analysis decomposes the data into both frequency and time simultaneously, providing a more comprehensive understanding of the signal. A quasi-periodic signal in the periodograms was deemed significant when its LSP and WWZ power peak exceeded the 4 σ confidence levels [17]. This stringent criterion helped us confirm the presence of a credible QPO signal, reducing the chance of false detections.
The left plot of Figure 2 and the upper plot of Figure 3 show the LSP and WWZ results of PKS 1440-389 in sector 11. The black curve represents the result of the LSP analysis. The blue dashed line represents the confidence levels of 4 σ (99.99 percent). A strong signal at a period of 74.61 h (about 3.1 days) is present with at least a 4 σ confidence level in the LSP and WWZ. The signal exhibits significant persistence during the latter half of the observations, as shown in the color density (blue indicating the least power and red the most) plot of WWZ power, which also indicates that the observations are non-stationary. In WWZ, there is an additional peak exceeding 4 σ , which is also identified in LSP. However, compared to the peak at around 3.1 days, its power is smaller and does not exceed 4 σ in LSP.
The right plot of Figure 2 and the lower plot of Figure 3 show the LSP and WWZ results of PKS 1440-389 in sector 38. In the LSP result, a strong peak, having a confidence level of at least 4 σ , is detected at 89.45 h (about 3.7 days). In the WWZ plot, this peak at 3.7 days also has a confidence level of at least 4 σ , and the signal persists for the majority of the observation time.
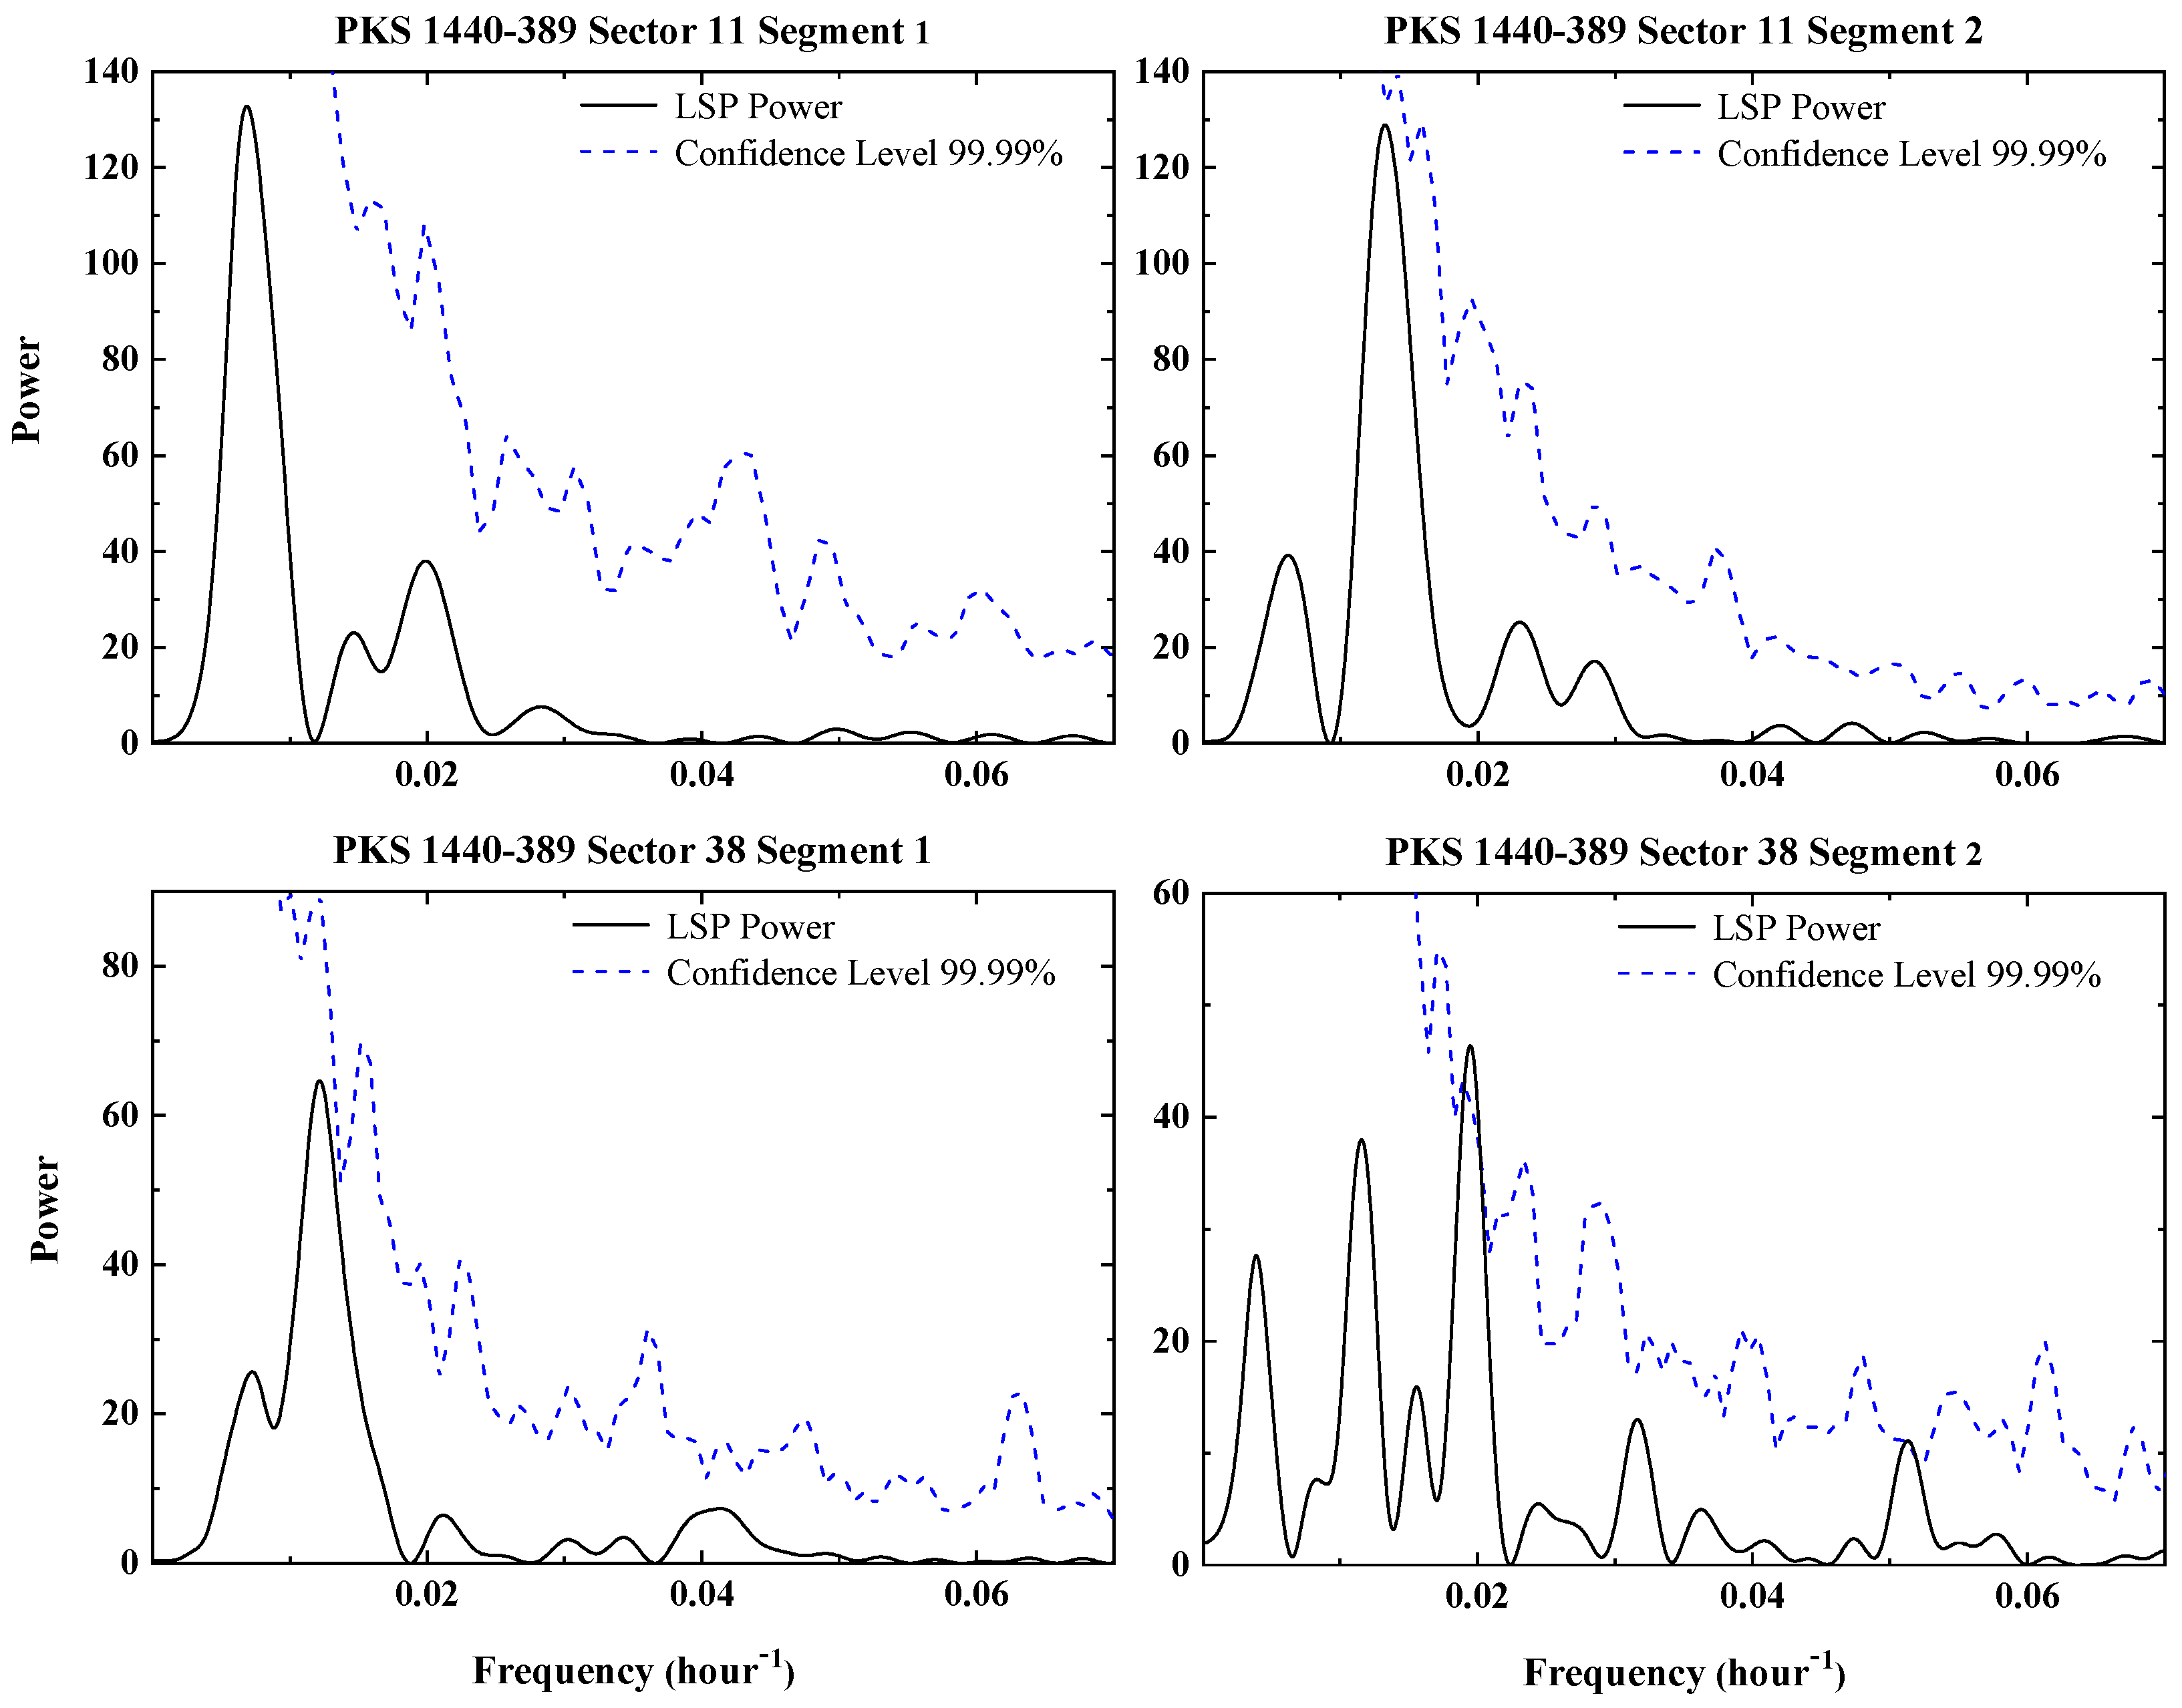
During the observation period, the instrument needs to transmit data to earth, resulting in gaps in the TESS light curves, which poses challenges for analyzing the light-curve data. The durations of these gaps range from 1 to 5 days. In the light curve of PKS 1440-389 for sector 11, which spans 22.8 days, there is a gap of around 4 days. Similarly, in sector 38, the light curve covers 25.7 days with a gap of around 1 day. To verify whether the QPO originates from the overall light curve or from a specific portion of it, and to assess whether QPOs exist in the light curves before and after the data gaps, further analysis is required [18]. We divide the light curve into two segments based on the data gap: the segment before the gap is referred to as segment 1, and the segment after the gap is referred to as segment 2. We conduct LSP analysis on each segment separately.
The left panels of Figure 4 show the segment-wise analysis for the sector 11 observation of PKS 1440-389. The LSP plots shown in the left and right plots for segments 1 and 2, respectively, give no evidence for a signal that could go beyond a 4 σ confidence level. We conclude that the period in sector 11 does not originate from a specific segment.
We analyze the sector 38 observation of PKS 1440-389 by segment, and the LSP results are shown in the upper panels of Figure 4. No signal exceeding 4 σ is observed in segment 1. Signals of at least 4 σ significance are found at 2 days for segment 2. In the combined analysis (Figure 2), a period of 3.7 days is observed.

6. Conclusions and Discussion

In this paper, we analyze the light curve of the optical band of PKS 1440-389 using the LSP and WWZ methods in sector 11 and sector 38. We find that sector 11 has a QPO of about 3.1 days, and sector 38 has a QPO of about 3.7 days. In order to estimate the reliability of the QPO signal, we also evaluate the confidence level of the QPO. We find that the confidence level of the 3.1-day QPO in sector 11 is about 4 σ (99.99%), and the confidence level of the 3.7-day QPO in the sector 38 is about 4 σ .
To understand the physical mechanisms of this QPO, many authors have proposed some models, such as supermassive binary black hole systems [30,31], the persistent jet precession model [32,33], and Lense–Thirring precession of accretion discs [34]. However, these models are designed to explain long-term QPOs, and the period of PKS 1440-389 in this paper is only 3.1 and 3.7 days. Therefore, we can dismiss these models as an explanation for the short-term QPO derived in this paper.
For the detection of periodic variability on intraday timescales, the most reasonable hypothesis may be that there is a single dominating hot spot in the innermost stable circular orbit (ISCO) of the accretion disk [35,36]. It could also come from periodic pulsations in the accretion disk [37]. Assuming that the QPO is associated with the orbital timescale of a hot spot, spiral shocks, or other non-axisymmetric phenomena within the innermost region of the rotating accretion disc [38], we can estimate the central supermassive black hole (SMBH) mass using the expression [39]
M BH M = 3.23 × 10 4 P r 3 / 2 + a ( 1 + z ) ,
where M is the solar mass, P is the period in seconds, z is the cosmological redshift of the source (z = 0.065 for PKS 1440-389) [40], r is the radius of the ISCO in units of GM B H /c2, and a is the SMBH spin parameter. For a Schwarzschild black hole, r = 6.0 and a = 0, and for a maximally rotating Kerr black hole, r = 1.2 and a = 0.9982 [39]. Vaughan et al. [15] discovered that a greater number of cycles following a periodic pattern provide stronger evidence for the presence of periodicity. Although both sectors have peak periods exceeding 4 σ , the cycle corresponding to sector 11 is smaller than that of sector 38, so we believe the period is more likely to be 3.7 days. Taking 3.7 days as the period, we estimate that the black hole mass of PKS 1440-389 is 6.65 × 10⁸ M (Schwarzschild black hole) and 4.22 × 10⁹ M (maximally rotating Kerr black hole).
Another highly compelling model for such quasi-periodic features, entirely intrinsic to the jet, revolves around the emergence of a kink instability [41,42]. Kink instabilities are a type of current-driven plasma instability that induces transverse displacements of plasma and twists the magnetic field structure. Within a relativistic jet permeated by helical magnetic fields, these kink instabilities can dissipate a significant amount of magnetic energy [43]. The dissipated magnetic energy then may lead to non-thermal particle acceleration, resulting in variability in the radiation flux. The QPO signatures arise from the quasi-periodic dissipation of magnetic energy caused by kink instabilities, whose period is correlated with the kink growth time [44].
The TESS satellite operates in space, free from atmospheric interference, but its operational characteristics pose challenges for the detection of quasi-periodic oscillations (QPOs). Firstly, TESS has short observation times in each sector, which is unfavorable for detecting QPOs with long timescales. Secondly, due to TESS’s division of the sky into sectors, sources near the celestial poles are observed across multiple contiguous sectors, while those farther from the poles are observed in only one sector [16]. If a target source is not near the poles, it may take up to two years for it to be observed again, hindering the detection of periodicity. With TESS’s continued operation and an increasing number of observed sectors, it is hoped that more data will support the detection of periodic signals in the future.

Author Contributions

Conceptualization, H.L. and T.Y.; data curation, H.L.; formal analysis, S.Z., Y.S. and J.W.; funding acquisition, L.D.; investigation, H.L. and Y.T.; resources, T.Y.; software, S.Z. and Y.C.; supervision, H.L., T.Y. and Y.Z.; visualization, S.Z. and L.W.; writing—original draft: H.L., J.W. and T.Y.; writing—review and editing, H.L., J.W. and T.Y. All authors have read and agreed to the published version of the manuscript.

Funding

This research was supported by the National Natural Science Foundation of China (rant Nos.: 12203041, 12063007, 11863007). Yanke Tang is supported by the International Centre of Supernovae, Yunnan Key Laboratory (Nos. 202302AN360001 and 202302AN36000103). Liang Dong is supported by Yunnan Province China-Malaysia HF-VHF Advanced Radio Astronomy Technology International Joint Laboratory (Nos. 202303AP140003).

Data Availability Statement

The TESS data presented in this paper were obtained from the Mikulski Archive for Space Telescopes (MAST) at the Space Telescope Science Institute.

Acknowledgments

This study has made use of the TESS data, obtained from The Mikulski Archive for Space Telescopes (MAST), provided by the NASA Explorer Program.

Conflicts of Interest

The authors declare no conflicts of interest.

References

  1. Padovani, P.; Alexander, D.M.; Assef, R.J.; Marco, B.D.; Giommi, P.; Hickox, R.C.; Richards, G.T.; Smolčić, V.; Hatziminaoglou, E.; Mainieri, V.; et al. Active galactic nuclei: What’s in a name? Astron. Astrophys. Rev. 2017, 107, 1–91. [Google Scholar] [CrossRef]
  2. Urry, C.M.; Padovani, P. Unified schemes for radio-loud active galactic nuclei. Publ. Astron. Soc. Pac. 1995, 25, 803–845. [Google Scholar] [CrossRef]
  3. Ghisellini, G.; Tavecchio, F.; Foschin, L.; Ghirlanda, G. The transition between BL Lac objects and flat spectrum radio quasars. Mon. Not. R. Astron. Soc. 2011, 414, 2674–2689. [Google Scholar] [CrossRef]
  4. Abdo, A.A.; Ackermann, M.; Agudo, I.; Agudo, I.; Aller, H.D.; Aller, M.F.; Angelakis, E.; Arkharov, A.A.; Axelsson, M.; Bach, U.; et al. The spectral energy distribution of Fermi bright blazars. Astrophys. J. 2010, 716, 30–70. [Google Scholar] [CrossRef]
  5. Sobolewska, M.A.; Siemiginowska, A.; Kelly, B.C.; Nalewajko, K. Stochastic Modeling of the Fermi/LAT γ-Ray Blazar Variability. Astrophys. J. 2014, 786, 143–156. [Google Scholar] [CrossRef]
  6. Ackermann, M.; Ajello, M.; Albert, A.; Atwood, W.B.; Baldini, L.; Ballet, J.; Barbiellini, G.; Bastieri, D.; Becerra Gonzalez, J.; Bellazzini, R.; et al. Multiwavelength Evidence for Quasi-periodic Modulation in the Gamma-Ray Blazar PG 1553+113. Astrophys. J. Lett. 2015, 813, L41–L48. [Google Scholar] [CrossRef]
  7. Li, X.-P.; Yang, H.-Y.; Cai, Y.; Song, X.-F.; Yang, H.-T.; Shan, Y.-Q. A Quasi-periodic Oscillation of 4.6 years in the Radio Light Curves of the Blazar PKS 0607–157. Res. Astron. Astrophys. 2023, 23, 095010–095018. [Google Scholar] [CrossRef]
  8. Gong, Y.-L.; Zhou, L.-C.; Yuan, M.; Zhang, H.-Y.; Yi, T.-F.; Fang, J. Quasiperiodic Behavior in the γ-Ray Light Curve of the Blazar PKS 0405-385. Astrophys. J. 2022, 931, 168–175. [Google Scholar] [CrossRef]
  9. Zhou, J.-N.; Wang, Z.-X.; Chen, L.; Wiita, P.J.; Vadakkumthani, J.; Morrell, N.; Zhang, P.-F.; Zhang, J.-J. A 34.5 day quasi-periodic oscillation in γ-ray emission from the blazar PKS 2247–131. Nat. Commun. 2018, 9, 4599. [Google Scholar] [CrossRef]
  10. Chen, J.-P.; Yi, T.-F.; Gong, Y.-L.; Yang, X.; Chen, Z.-H.; Chang, X.; Mao, L.-S. A 31.3 day Transient Quasiperiodic Oscillation in Gamma-ray Emission from Blazar S5 0716+714. Astrophys. J. 2022, 938, 8–16. [Google Scholar] [CrossRef]
  11. Roy, A.; Sarkar, A.; Chatterjee, A.; Gupta, A.C.; Chitnis, V.; Wiita, P.J. Transient quasi-periodic oscillations at γ-rays in the TeV blazar PKS 1510-089. Mon. Not. R. Astron. Soc. 2022, 510, 3641–3649. [Google Scholar] [CrossRef]
  12. Hong, S.-W.; Xiong, D.-R.; Bai, J.-M. Optical Quasi-periodic Oscillation of the BL Lacertae Object S5 0716+714 during the Faint State. Astron. J. 2017, 155, 31–39. [Google Scholar] [CrossRef]
  13. Mohan, P.; Gupta, A.C.; Bachev, R.; Strigachev, A. Kepler light-curve analysis of the blazar W2R 1926+42. Mon. Not. R. Astron. Soc. 2016, 456, 654–664. [Google Scholar] [CrossRef]
  14. Sarkar, A.; Kushwaha, P.; Gupta, A.C.; Chitnis, V.R.; Wiita, P.J. Multi-waveband quasi-periodic oscillations in the light curves of blazar CTA 102 during its 2016-2017 optical outburst. Astro. Astrophys. 2020, 642, A129–A137. [Google Scholar] [CrossRef]
  15. Vaughan, S.; Uttley, P.; Markowitz, A.G.; Huppenkothen, D.; Middleton, M.J.; Alston, W.N.; Scargle, J.D.; Farr, W.M. False periodicities in quasar time-domain surveys. Mon. Not. R. Astron. Soc. 2016, 461, 3145–3152. [Google Scholar] [CrossRef]
  16. Ricker, G.R.; Winn, J.N.; Vanderspek, R.; Latham, D.W.; Bakos, G.Á.; Bean, J.L.; Berta-Thompson, Z.K.; Brown, T.M.; Buchhave, L.; Butler, N.R.; et al. Transiting Exoplanet Survey Satellite. J. Astron. Telesc. Instrum. Syst. 2015, 1, 1–10. [Google Scholar] [CrossRef]
  17. Kishore, S.; Gupta, A.C.; Wiita, P.J. Detection of Quasiperiodic Oscillations in the Blazar S4 0954+658 with TESS. Astrophys. J. 2023, 943, 53–68. [Google Scholar] [CrossRef]
  18. Tripathi, A.; Smith, K.L.; Wiita, P.J.; Wagoner, R.V. Optical quasi-periodic oscillations in the TESS light curves of three blazars. Mon. Not. R. Astron. Soc. 2024, 527, 9132–9144. [Google Scholar] [CrossRef]
  19. Ricker, G.R.; Winn, J.N.; Vanderspek, R.; Latham, D.W.; Bakos, G.Á.; Bean, J.L.; Berta-Thompson, Z.K.; Brown, T.M.; Buchhave, L.; Butler, N.R.; et al. Transiting Exoplanet Survey Satellite (TESS). Proc. SPIE 2014, 9143, 914320–914334. [Google Scholar]
  20. Smith, K.L.; Sartori, L.F. The Rapid Optical Variability of the Nearby Radio-loud AGN Pictor A: Introducing the Quaver Pipeline for AGN Science with TESS. Astrophys. J. 2023, 2, 188–210. [Google Scholar] [CrossRef]
  21. Lomb, N.R. Least-Squares Frequency Analysis of Unequally Spaced Data. Astrophys. Space Sci. 1976, 39, 447–462. [Google Scholar] [CrossRef]
  22. Scargle, J.D. Studies in astronomical time series analysis. II. Statistical aspects of spectral analysis of unevenly spaced data. Astrophys. J. 1982, 263, 835–853. [Google Scholar] [CrossRef]
  23. VanderPlas, J.T. Understanding the Lomb-Scargle Periodogram. Astrophys. J. Suppl. Ser. 2018, 236, 16–43. [Google Scholar] [CrossRef]
  24. Wang, J.-Y.; An, T.; Baan, W.A.; Lu, X.-L. Periodic radio variabilities of the blazar 1156+ 295: Harmonic oscillations. Mon. Not. R. Astron. Soc. 2014, 443, 58–66. [Google Scholar] [CrossRef]
  25. Witt, A.; Schumann, A.Y. Holocene climate variability on millennial scales recorded in Greenland ice cores. Nonlin. Processes Geophys. 2005, 12, 345–352. [Google Scholar] [CrossRef]
  26. Grossmann, A.; Morlet, J. Decomposition of Hardy functions into square integrable wavelets of constant shape. SIAM J. Math. Anal. 1984, 12, 723–736. [Google Scholar] [CrossRef]
  27. Foster, G. Wavelets for period analysis of unevenly sampled time series. Astron. J. 1996, 112, 1709–1729. [Google Scholar] [CrossRef]
  28. Foster, G. Time series analysis by projection. I. statistical properties of Fourier analysis. Astron. J. 1996, 111, 541–554. [Google Scholar] [CrossRef]
  29. Emmanoulopoulos, D.; McHardy, I.M.; Papadakis, I.E. Generating artificial light curves: Revisited and updated. Mon. Not. R. Astron. Soc. 2013, 433, 907–927. [Google Scholar] [CrossRef]
  30. Valtonen, M.J.; Lehto, H.J.; Nilsson, K.; Heidt, J.; Takalo, L.O.; Sillanpää, A.; Villforth, C.; Kidger, M.; Poyner, G.; Pursimo, T.; et al. A massive binary black-hole system in OJ 287 and a test of general relativity. Nature 2008, 452, 851–853. [Google Scholar] [CrossRef] [PubMed]
  31. Li, X.-P.; Zhao, L.; Yan, Y.; Wang, L.-S.; Yang, H.-T.; Cai, Y.; Luo, Y.-H. Detection of quasi-periodic oscillations from the blazar PKS 1510-089. J. Astrophys. Astron. 2021, 42, 92–98. [Google Scholar] [CrossRef]
  32. Rieger, F.M. On the Geometrical Origin of Periodicity in Blazar-type Sources. Astrophys. J. 2004, 615, L5–L8. [Google Scholar] [CrossRef]
  33. Liska, M.; Hesp, C.; Tchekhovskoy, A.; Ingram, A.; van der Klis, M.; Markoff, S. Formation of precessing jets by tilted black hole discs in 3D general relativistic MHD simulations. Mon. Not. R. Astron. Soc. 2018, 474, L81–L85. [Google Scholar] [CrossRef]
  34. Stella, L.; Vietri, M. Lense-Thirring Precession and Quasi-periodic Oscillations in Low-Mass X-Ray Binaries. Astrophys. J. 1998, 492, L59–L62. [Google Scholar] [CrossRef]
  35. Chakrabarti, S.K.; Wiita, P.J. Spiral Shocks in Accretion Disks As a Contributor to Variability in Active Galactic Nuclei. Astrophys. J. 1993, 411, 602–609. [Google Scholar] [CrossRef]
  36. Mangalam, A.V.; Wiita, P.J. Accretion Disk Models for Optical and Ultraviolet Microvariability in Active Galactic Nuclei. Astrophys. J. 1993, 406, 420–429. [Google Scholar] [CrossRef]
  37. Espailat, C.; Bregman, J.; Hughes, P.; Lloyd-Davies, E. Wavelet Analysis of AGN X-Ray Time Series: A QPO in 3C 273? Astrophys. J. 2008, 679, 182–193. [Google Scholar] [CrossRef]
  38. Chang, X.; Yi, T.-F.; Xiong, D.-R.; Liu, C.-X.; Yang, X.; Li, H.-Z.; Gong, Y.-L.; Na, W.-W.; Li, Y.; Chen, Z.-H.; et al. Multicolour optical variability monitoring of blazars with high time resolution. Mon. Not. R. Astron. Soc. 2023, 520, 4118–4133. [Google Scholar] [CrossRef]
  39. Gupta, A.C.; Srivastava, A.K.; Wiita, P.J. Periodic Oscillations in the Intra-Day Optical Light Curves of the Blazar S5 0716+714. Astrophys. J. 2009, 690, 216–223. [Google Scholar] [CrossRef]
  40. Chang, Y.-L.; Arsioli, B.; Giommi, P.; Padovani, P.; Brandt, C.H. The 3HSP catalogue of extreme and high-synchrotron peaked blazars. Astro. Astrophys. 2019, 632, A77–A92. [Google Scholar] [CrossRef]
  41. Dong, L.-Y.; Zhang, H.-C.; Giannios, D. Kink instabilities in relativistic jets can drive quasi-periodic radiation signatures. Mon. Not. R. Astron. Soc. 2020, 494, 1817–1825. [Google Scholar] [CrossRef]
  42. Jorstad, S.G.; Marscher, A.P.; Raiteri, C.M.; Villata, M.; Weaver, Z.R.; Zhang, H.-C.; Dong, L.-Y.; Gómez, J.L.; Perel, M.V.; Savchenko, S.S.; et al. Rapid quasi-periodic oscillations in the relativistic jet of BL Lacertae. Nature 2022, 7926, 265–268. [Google Scholar] [CrossRef] [PubMed]
  43. Mizuno, Y.; Lyubarsky, Y.; Nishikawa, K.; Hardee, P.E. Three-Dimensional Relativistic Magnetohydrodynamic Simulations of Current-Driven Instability. I. Instability of a Static Column. Astrophys. J. 2009, 700, 684–693. [Google Scholar] [CrossRef]
  44. Tripathi, A.; Smith, K.L.; Wiita, P.J.; Wagoner, R.V. Search for quasi-periodic oscillations in TESS light curves of bright Fermi Blazars. Mon. Not. R. Astron. Soc. 2024, 528, 6608–6618. [Google Scholar] [CrossRef]
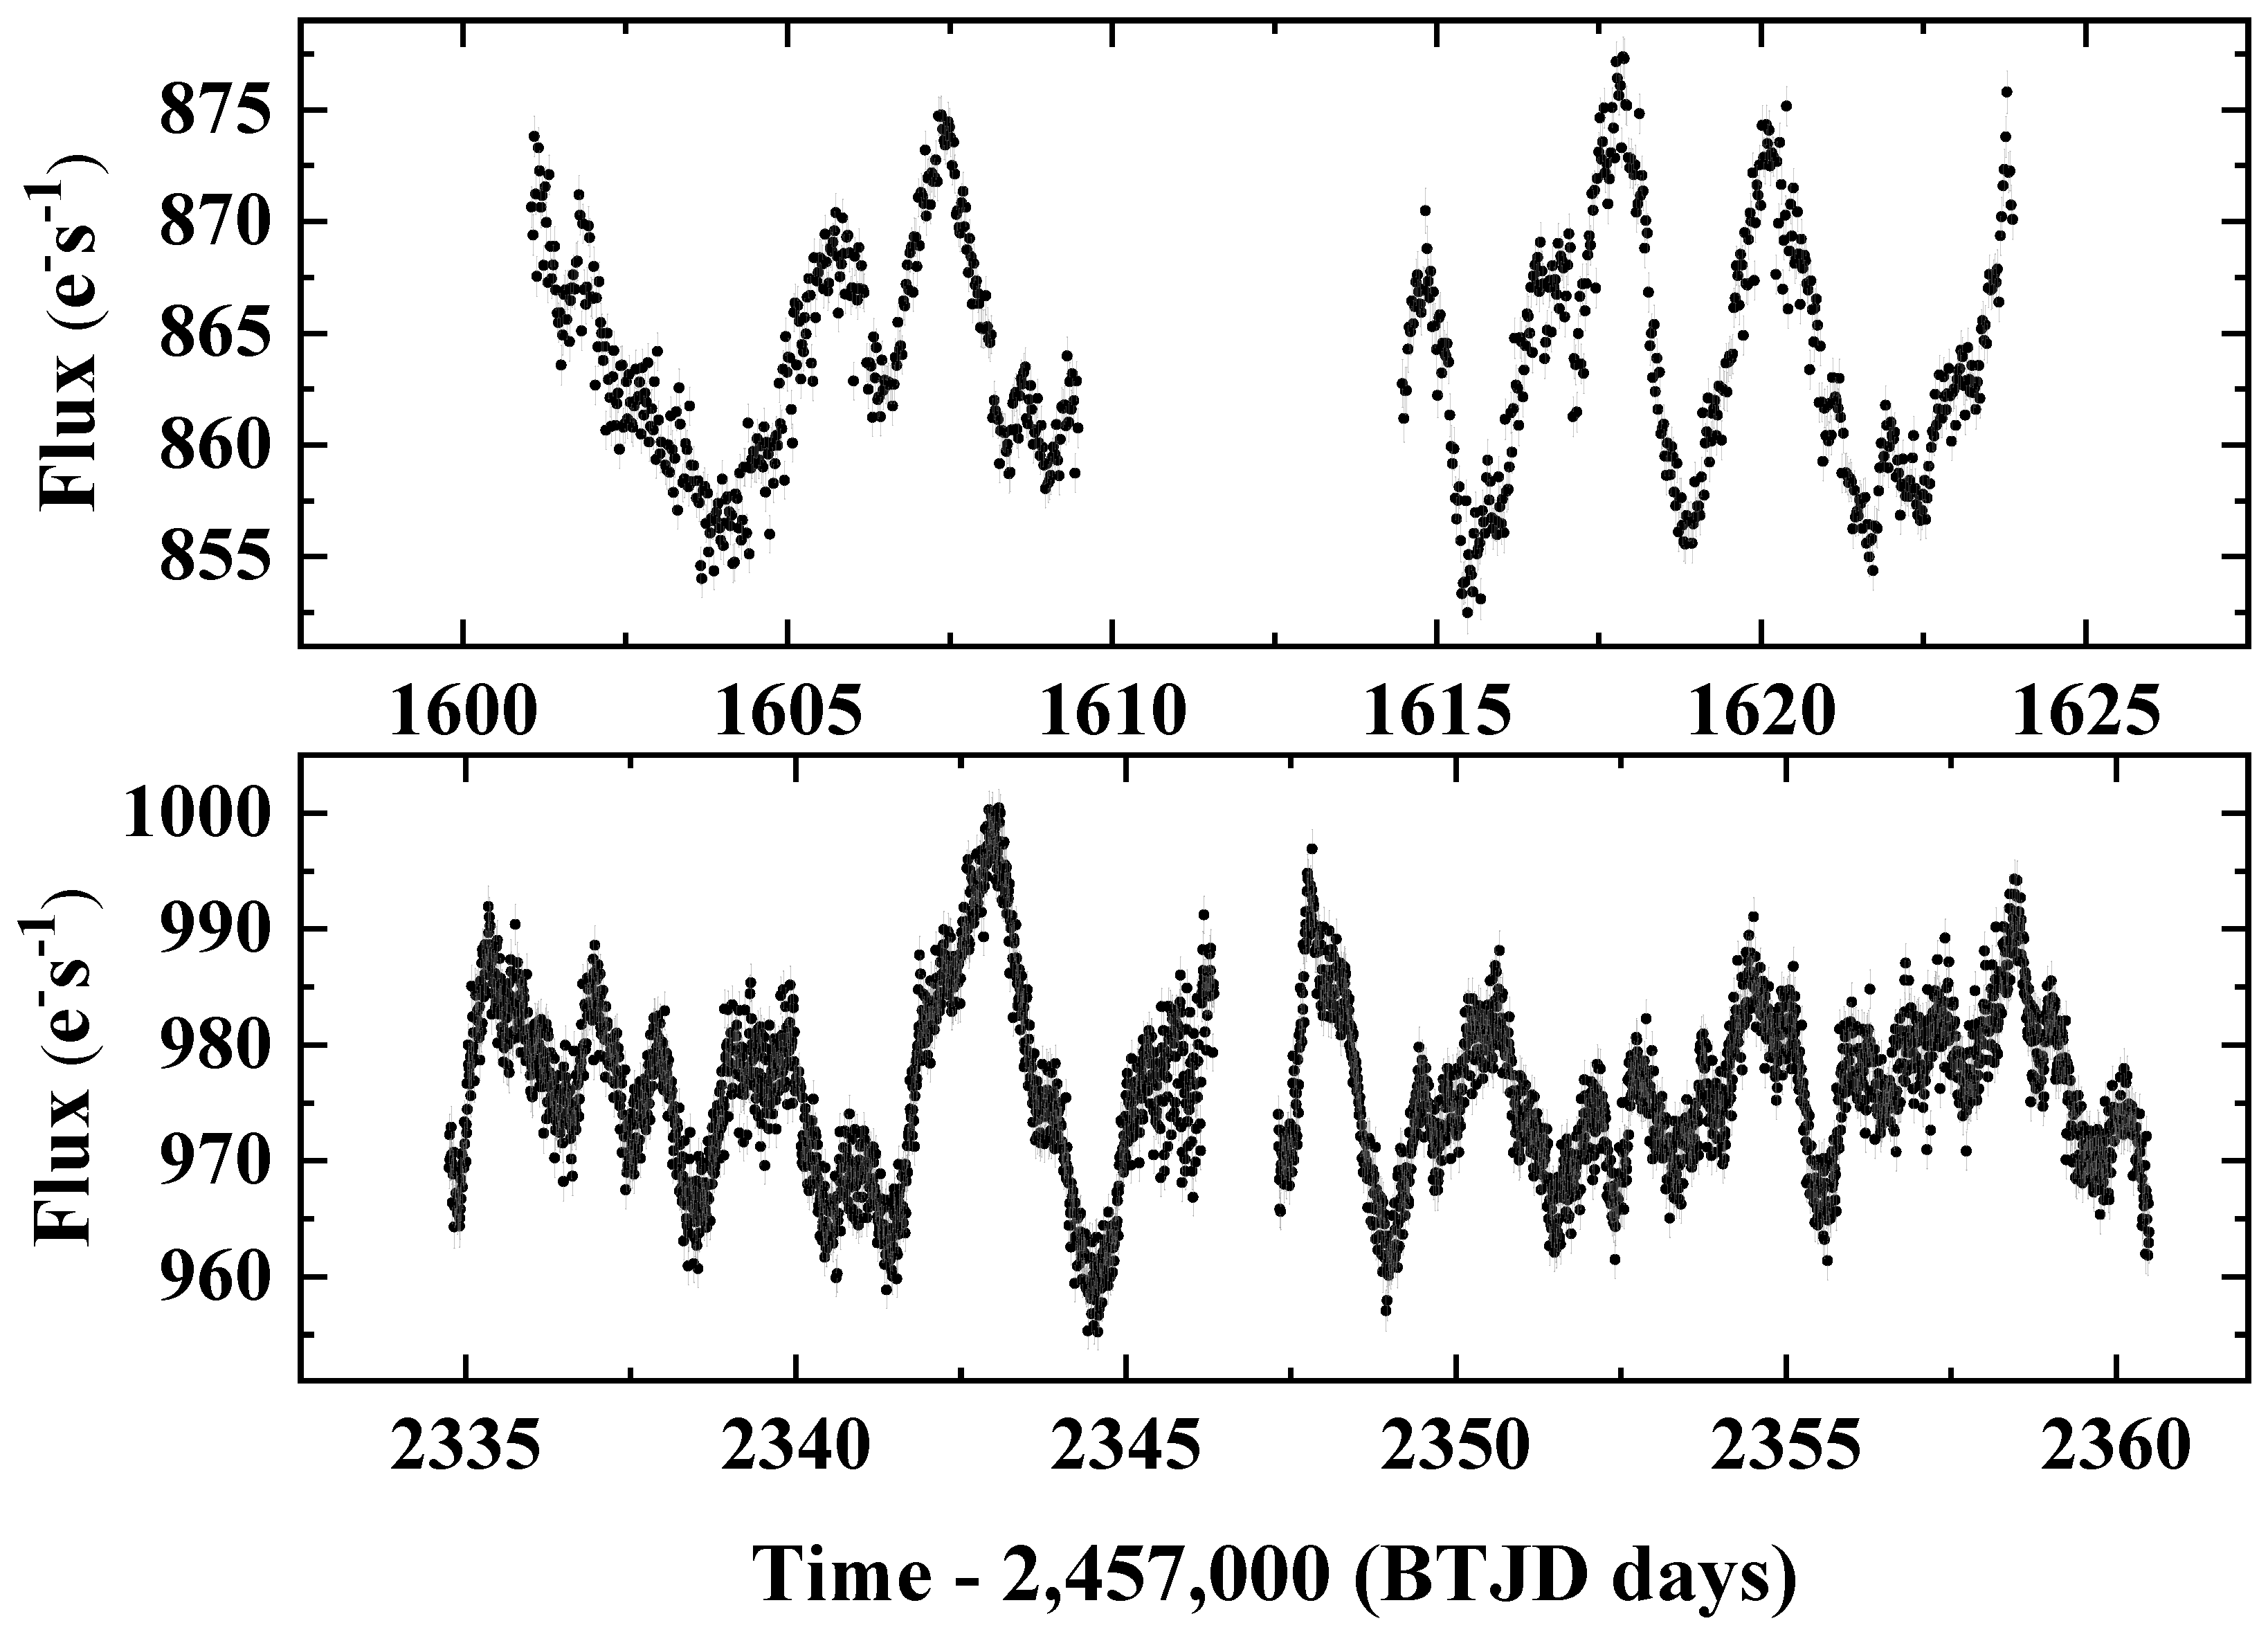
Figure 1. The light curves of PKS 1440-389. The black dots represent the fluxes and the gray curves denote the associated errors. The upper and lower plots, respectively, are for the sector 11 and sector 38 observations.
Universe 10 00242 g001
Figure 2. The results of the LSP analysis for sectors 11 (left) and 38 (right). The black solid line is the LSP power and the blue dashed line is the 99.99 percent confidence level.
Universe 10 00242 g002
Figure 3. The results of the WWZ analysis for sectors 11 and 38. Upper panel: Analysis results of sector 11. Lower panel: Analysis results of sector 38. The black solid line is the WWZ power and the blue dashed line is the 99.99 percent confidence level.
Universe 10 00242 g003
Figure 4. Segment-wise LSP analysis for the light curves of PKS 1440-389. The upper and lower panels depict the analysis results for sector 11 and sector 38, respectively. In every plot, the black curve is the LSP. The blue dashed line shows the 99.99 percent confidence level.
Universe 10 00242 g004
Disclaimer/Publisher’s Note: The statements, opinions and data contained in all publications are solely those of the individual author(s) and contributor(s) and not of MDPI and/or the editor(s). MDPI and/or the editor(s) disclaim responsibility for any injury to people or property resulting from any ideas, methods, instructions or products referred to in the content.