Article

Periodic Behavior of Selected Solar, Geomagnetic and Cosmic Activity Indices during Solar Cycle 24

1
Department of Space Science and Technologies, Faculty of Science, Akdeniz University, Antalya 07058, Turkey
2
Observatoire de la Côte d’Azur, Université de la Côte d’Azur (Emeritus), 77 Chemin des Basses Moulières, 06130 Grasse, France
3
Kandilli Observatory and Earthquake Research Institute, Bogazici University, Istanbul 34684, Turkey
*
Author to whom correspondence should be addressed.
Universe 2024, 10(3), 107; https://doi.org/10.3390/universe10030107
Submission received: 27 October 2023 / Revised: 19 February 2024 / Accepted: 21 February 2024 / Published: 27 February 2024
(This article belongs to the Section Solar System)

Abstract

:
In this study, we performed periodicity analyses of selected daily solar (flare index, coronal index, number of coronal mass ejections), geomagnetic (planetary equivalent range index, disturbance storm time index, interplanetary magnetic field) and cosmic ray indices for the last Solar Cycle 24 (from December 2008 to December 2019). To study the periodic variation of the above-listed datasets, the following analysis methods were applied; multi-taper method, Morlet wavelet, cross-wavelet transform and wavelet coherence analysis. The outcome of our analyses revealed the following. (i) The 25–33 days solar rotation periodicities exist in all datasets without any exception in the MTM power spectra. (ii) Except for the solar rotation periodicity, all periods show data preference, and they appear around the investigated cycle’s maximum phase. (iii) When comparing the phase relations between periodicities in the used datasets, they exhibit a gradual transition from small to large periods. For short-term periodicities, there are no phase relations but a mixed phase, whereas for high periodicities, there are complete phase/antiphase transitions. (iv) All identified flare index periodicities are common to all other datasets examined in this investigation.

1. Introduction

To describe the temporal and periodic changes in solar activity, different solar indices can be used such as sunspot numbers, active regions, solar flare index (FI), 10.7 cm solar radio flux, etc. All these indices show very good correlation to each other and they show 11-year solar cyclic behavior, the so-called solar cycle/Schwabe Cycle, when the long-term variation is taken into account. Due to solar rotation, all these indices show a periodicity of about 27 days without any exception. Periodic variations show some differences as depending on the used datasets, the analysis method and the solar cycle data analyzed. Approximately 155-day solar periodicity was discovered by [1] in the high energy solar flare data of Solar Cycle 21. Subsequently, numerous studies were performed within the various solar activity indicators to investigate the periodicities between 27 days and 11 years, called mid-range periodicities [2,3,4,5,6,7,8,9,10,11,12], and the references therein.
It is well known that solar and geomagnetic activities are strongly related with each other. Earth and its surrounding space environment may be significantly impacted by powerful solar events that occur on the Sun, such as solar flares and coronal mass ejections (CMEs). These impacts may occur in different ways including, for instance, radio blackout, satellite drag and induced currents in electrical systems. As with solar activity, a variety of geomagnetic parameters are used to measure and track the geomagnetic disturbances, including aa [13], K [14], Ap [15] and Dst [16] indices, interplanetary magnetic field (IMF/Scalar B), etc. Numerous studies regarding the connection between solar activity and one or more of the indices indicated in Section 2.1, have already been conducted (see, for instance, [17,18,19,20,21,22]), as well as their periodic variations (and sometimes their co-temporal variations) [12,23,24,25]. Nonetheless, all these studies did not take into account all the indices we selected; moreover, there are still inconsistent outcomes like phase mixing, the absence of certain periodicities in some particular datasets, different cycle-to-cycle variability in the results, etc. This new study, which has the primary goal of comparing the periodic variations observed in the selected solar and geomagnetic-activity parameters, has the merit of analyzing by the same methods the seven daily indices chosen: on the one hand, with an increased resolution, and on the other, strictly over the exact duration of Solar Cycle 24 (from December 2008 to December 2019), which allows a more coherent analysis. Section 2 provides an overview of the data and methods used; Section 3 presents the analyses and results; Section 4 presents our discussions; and Section 5 lists our conclusions.

2. Data and Methods

2.1. The Data

We compared daily FI data with selected daily solar and geomagnetic activity parameters for exact duration of Solar Cycle 24 (from December 2008 to December 2019). The used parameters are as follows:
  • Flare index (FI): Introduced in 1952 by Kleczek as a rough indicator of the overall energy released by a flare. We used FI as a main index since, and solar flares are one of the most energetic solar active events and FI is a measure of the amount of released energy during a flare activity. During a solar flare, protons, electrons and heavy nuclei—all extremely energetic particles—as well as massive amounts of energy, up to 10 32 erg, are released and generated. These may affect the geomagnetic activity and cosmic ray intensities (CRIs, see further item 6) measured on Earth and in the near space environment. Therefore, this index was chosen as one of the solar activity indices to be used in the study. This index is described by the equation FI = it , in which i represents the combination of intensity and area, “called scale of importance”, and t is the duration of the flare in minutes. The value of i varies between 0.5 and 4.0 from a very weak flare to a very strong flare, respectively. The flare index data used in this study are taken from https://www.ngdc.noaa.gov/stp/solar/solarflares.html.
  • Coronal index (CI): CI was first presented by [26] as a solar activity indicator. CI represents the average daily irradiance radiating one steradian from the green coronal line towards the Earth and it is calculated from the Fe XIV 530.3 nm coronal emission line ground-based measurements on the global control stations [27]. The data are downloaded from the web page of Slovak Central Observatory in Hurbanovo http://www.suh.sk/obs/vysl/MCI.htm).
  • The disturbance storm time (Dst) index: [16] proposed the Dst index as a way to measure the amount of magnetospheric currents that result in an axially symmetric disturbance field. This index tracks changes in the magnetic field brought on by ring currents that form during geomagnetic storms in the magnetosphere. The Dst index is derived using information from four sufficiently distant observatories chosen to be away from the equatorial and auroral electrojet zones due to the need for high-quality data.
  • The planetary equivalent range (Ap) index: Changes in the magnetic field’s horizontal component are quantified using the K index. However, the Kp index was developed because the K index does not directly correlate with geomagnetic activity. It is derived from the mean standardized K index of thirteen geomagnetic observatories, spread across latitudes from ±44 to ±60. The purpose of this planetary index is to quantify the magnetic impact of radiation from solar particles. The 24 h average of the 3 hourly Ap index, “called the Ap index”, is employed in this study [15].
  • The average interplanetary magnetic field (IMF)/scalar B: It contains solar magnetic fields that the solar wind brought into planetary space. While the Sun’s open magnetic-field regions known as coronal holes are assumed to be the origin of the fast solar wind, the slow solar wind can come from the boundary of polar coronal holes, low-latitude small coronal holes and active region boundaries [28]. Understanding space weather requires an understanding of the structure and dynamics of the IMF (scalar B) [29]. Note that the Ap, Dst and Scalar B datasets are downloaded from https://omniweb.gsfc.nasa.gov/form/dx1.html.
  • Cosmic ray intensities (CRIs): High-energy particles from space called cosmic rays enter our solar system. Cosmic ray collisions with Earth’s atmosphere can occur at different intensities. Because the flux is influenced by the Earth’s magnetic field, it also varies with latitude. Four times less cosmic rays are produced at the equator than at the poles. The corrected cosmic ray intensity data used in this study are taken from Oulu/Finland neutron monitor station (https://cosmicrays.oulu.fi/#solar). Note that accessed to all these data sources on 11 September 2023.
  • Number of coronal mass ejections (CMEs): CMEs are known as large-scale plasma and magnetic field expulsions from the solar corona. The frequencies of CMEs varies with the 11-year sunspot cycle (Schwabe Cycle) and they can occur associated with solar flares or completely independently. The CME number data used in this study are downloaded from https://cdaw.gsfc.nasa.gov/CME_list. Accessed to the data source on 7 February 2024.

2.2. Methods

To investigate the periodic variations in the datasets used, we first performed the multi-taper method (MTM) and then Morlet wavelet analysis methods. Particularly for time series whose spectrum comprises both broadband and line components, the MTM spectral analysis method offers helpful tools for spectral estimation [30] and signal reconstruction [31]. Ref. [32] provides further information about this technique. Numerous datasets have been effectively analyzed using this approach [12,25,32,33,34,35,36]. Here, three sinusoidal tapers were utilized, and the significance tests were conducted under the presumption that the noise has a red spectrum. When the 95% confidence level is attained, a signal is regarded as having been identified. The Morlet wavelet method [37], which has been employed in numerous solar investigations [12,25,36,38,39], was used to determine the localization of the aforementioned periodicities. We assumed that the noise is also red and the edge effect is represented by the cone of influence (COI) in the Morlet wavelet analysis.
As a final step of the methodology, we applied cross-wavelet transform (XWT) and wavelet coherence (WTC) analysis methods that give a possible relationship (correlation and phase) between the obtained periodicities from two different datasets. These two methods are also part of the bi-wavelet package [40], already used by other authors [36,38,41,42,43] for different purposes. From the analysis, a nonlinear relationship and common periods between the datasets can be inferred, namely X and Y, as well as the phase relationship between the two time series. The phase relations are depicted by arrows that conform to the following convention: pointing right indicates in-phase; pointing left indicates anti-phase; pointing straight up indicates that the second series leads by 90 degrees; and straight down indicates that the first series leads by 90 degrees. The WTC spectrum displays the amount of common power between the two time series as a function of frequency and time by computing the cross-correlation between the two time series [36,44,45,46]. The total FI data were compared with all other indices utilized in this investigation.

3. Analysis and Results

3.1. Morlet Wavelet and MTM Analyses

We begin our analyses with MTM and Morlet wavelet analysis methods of all datasets as described previously. Figure 1 and Figure 2 and Table 1 show the obtained periodicities, their existence and the confidence levels in the used datasets.
In the above plots, black contours describe the meaningful periods in each dataset with 95% confidence; the white solid curve describes the COI for which periods located outside this curve are not acceptable as non-meaningful due to the edge effect. The total number of data points is 4048 and thus the longest meaningful period is about 1000 days in all the wavelet scalograms. Thus, to ensure compatibility between MTM and wavelet analysis, the MTM results are limited to 1024 days. In the results of our analysis, we obtained the following results: (1) In the MTM power spectra, all datasets consistently exhibit the solar rotation periodicity of 25–33 days. Wavelet scalograms of all datasets show the 25–33 days periodicities, particularly at the cycle’s maximum phase (Cycle 24). (2) The 683-day (1.86-year) periodicity is only seen in the Dst index MTM spectrum, while it appears in the wavelet scalogram of FI, Ap and CRI around the maximum phase of the cycle. This period also exists just below the 95% confidence level in the MTM spectrum of Ap, Scalar B and CRI datasets, and is a well-known geomagnetic activity periodicity [47,48,49]. (3) The 512-day periodicity only appears in the CME number data MTM spectrum and in the wavelet scalogram. Note that this periodicity appears in the wavelet scalograms of the FI, Ap index, Dst index and Scalar B. (4). The 370–455-day periodicity is seen in the MTM spectrum of Ap and Scalar B, and it appears in the wavelet scalograms of FI, Ap, Dst and Scalar B during the maximum phase of the cycle. (5) The 292–293-day period is only seen in the MTM spectra of FI and Scalar B and it also appears in the wavelet scalograms of these two datasets around the cycle maximum. (6) The 178–240-day periodicity is seen in all geomagnetic activity indices and the CME number MTM spectra. Thus, we may say that CME events have more of an impact on geomagnetic activity compared to the two other indices (FI and CI) used in this study. Note that it does not appear as a significant periodicity in the wavelet scalogram of the CRI dataset. (7) A periodicity of about 151 days seen in the CME number MTM spectrum indicates a well-known solar flare periodicity called Rieger-type periodicity. It is detected in all of the other datasets including FI. (8) The 120.5-day periodicity is only seen in the MTM spectrum of Scalar B, and it is seen in the wavelet scalogram of the same dataset as a dark red region (below 95% confidence level) during the period 2012–2013. (9) The 52–61-day periodicity is detected in FI and CRI as a significant periodicity. But, it does not exist in the MTM spectra of the other parameters. Thus, we may argue that the origin of this periodicity is the solar flare activity. (10) The 44–45-day periodicity is seen as a meaningful periodicity in the MTM spectrum of CI, Dst, CRI and CME number datasets, and it appears in the wavelet scalograms of the FI, CI, Ap, Dst and CRI datasets during the maximum phase of the cycle. Thus, we may argue that the main source of this periodicity is the eruptive solar events, such as the CME and flares observed on the Sun.

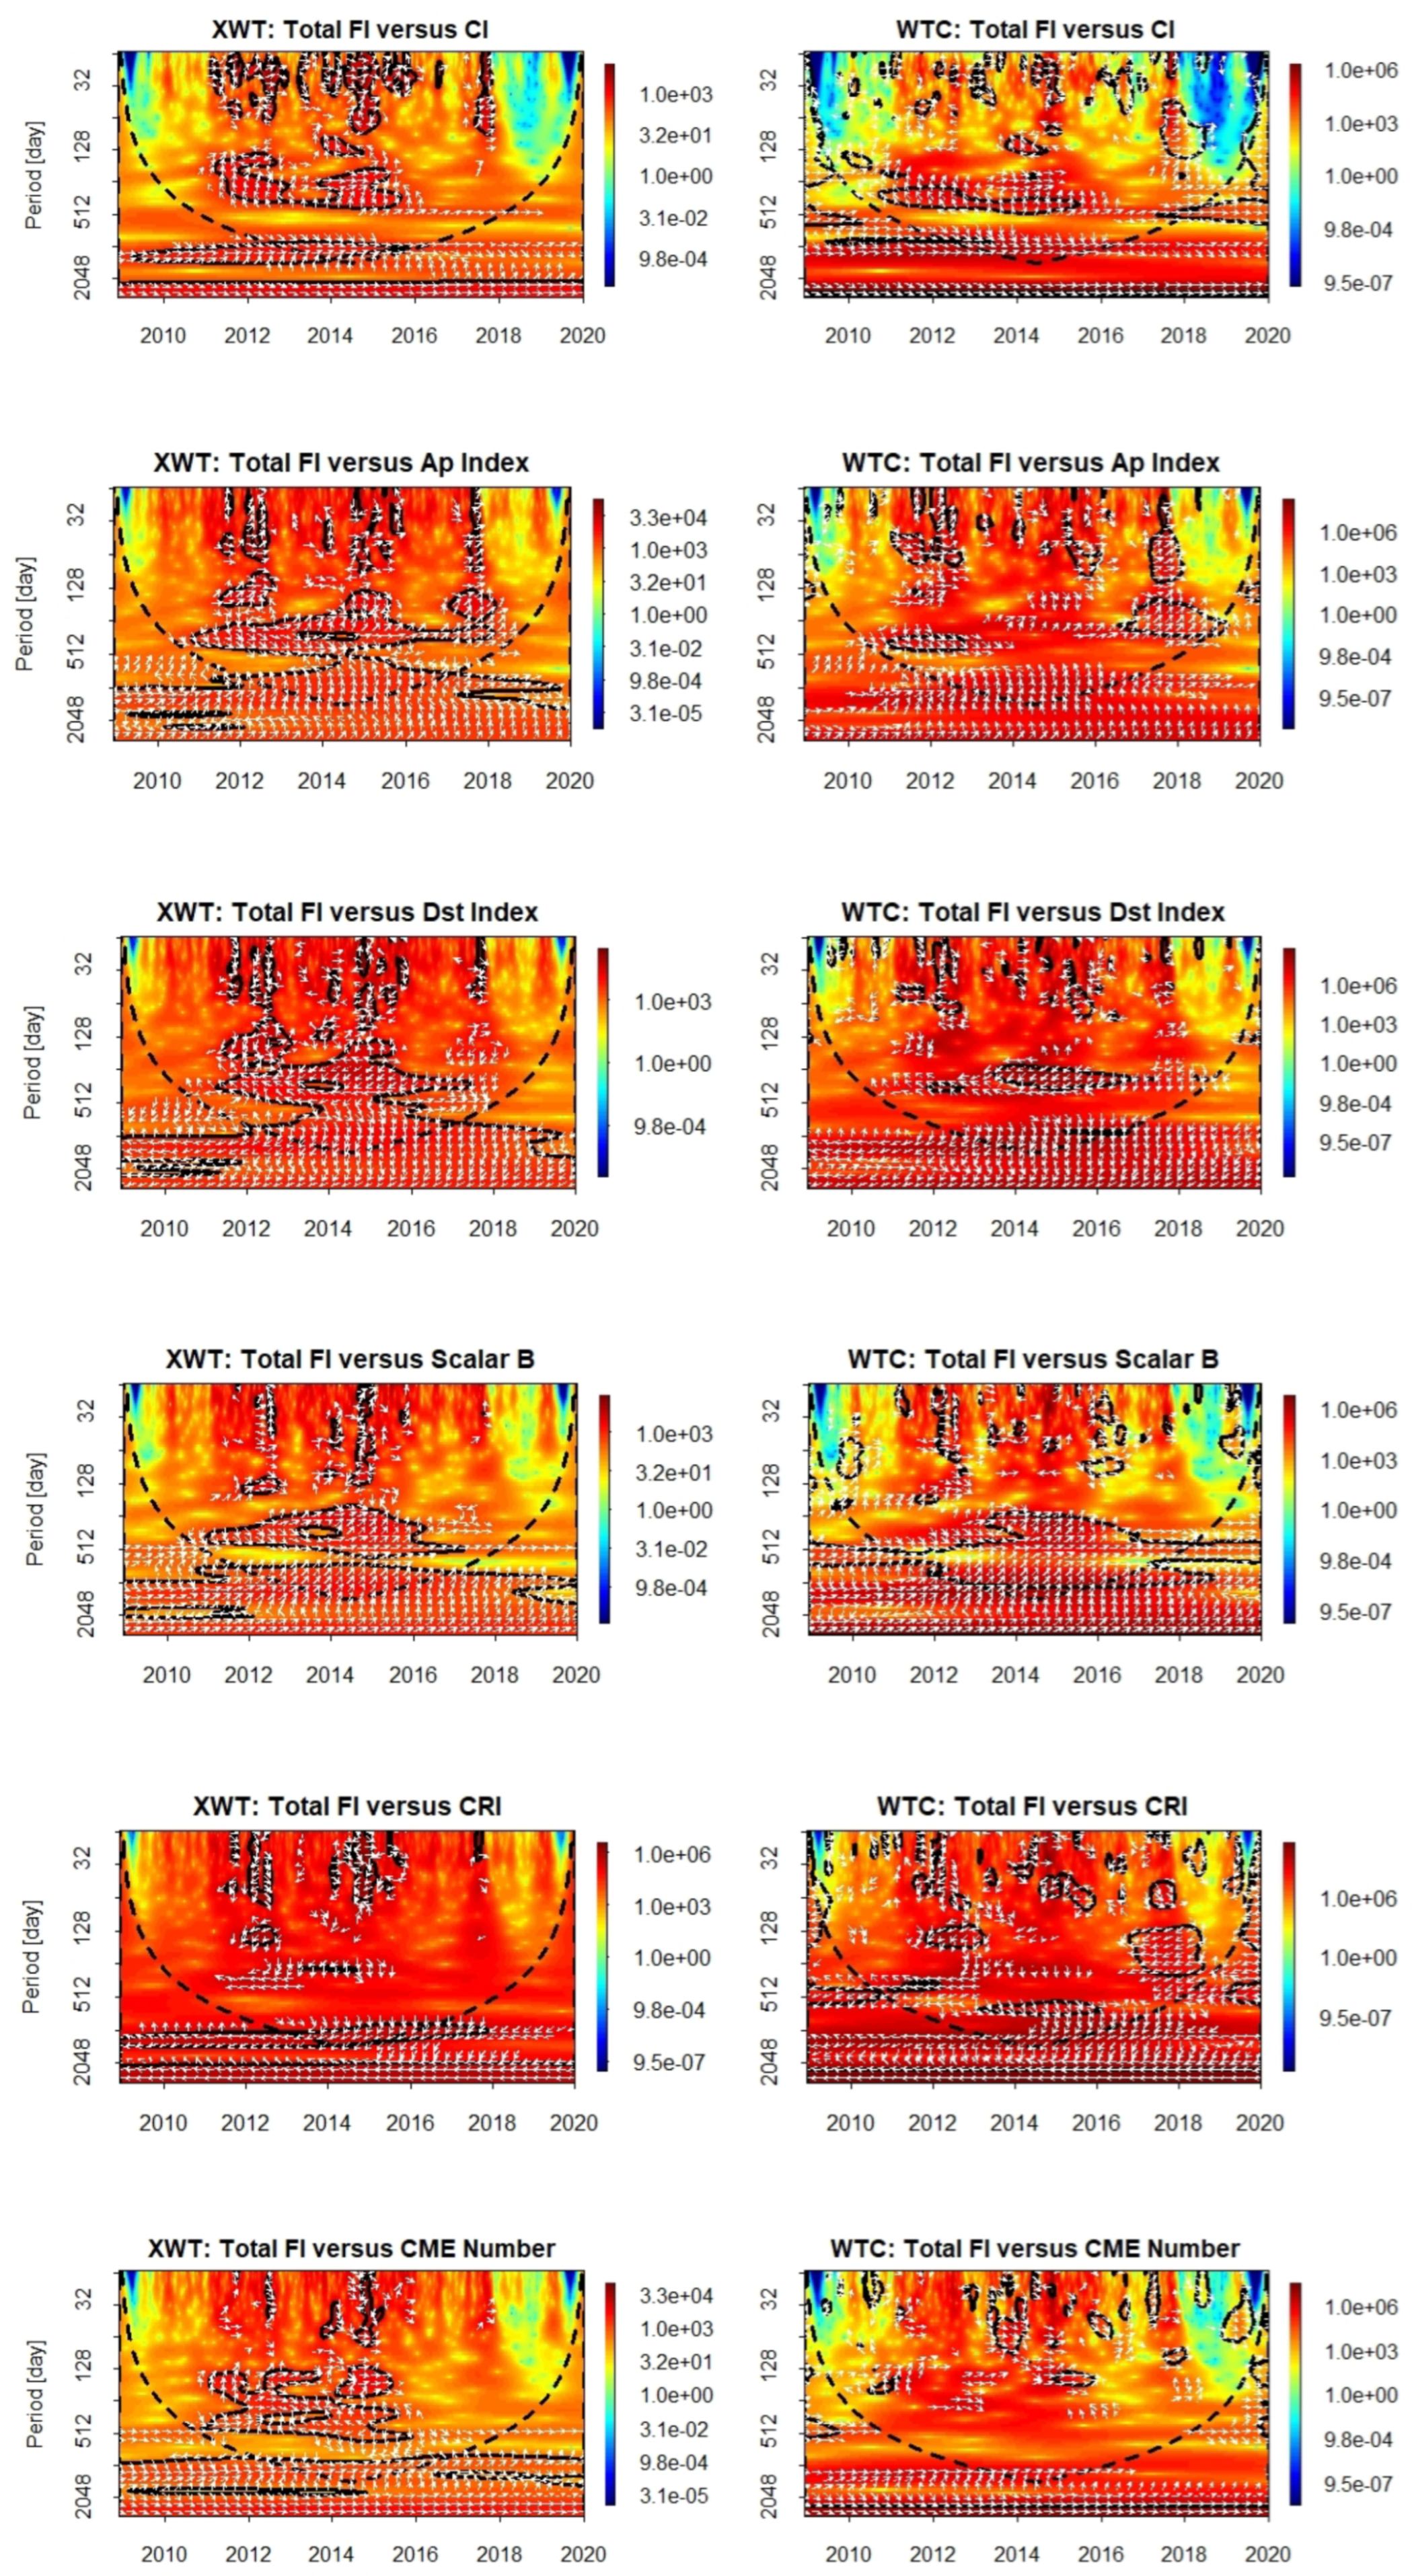
3.2. Cross-Wavelet and Wavelet Coherence Analyses

To investigate the possible phase and correlation relations between the total FI and any other datasets used herein, the cross-wavelet (XWT) and wavelet coherence (CWT) analyses were performed (as can be seen in, e.g., Figure 3).
In these plots, black contours describe the common periods, and white arrows show the phase relation between compared parameters, the black-dashed curve describes the COI that contours located outside of this curve is not acceptable as a meaningful periodicity due to the edge effect. From these figures, the following results can be listed: (i) All periodicities given in Table 1 are common periods between the compared datasets. (ii) Short-term common periods have no phase relationship, the phases being completely mixed. Moving to longer periodicities, the phase relations start to appear: if the compared datasets show a positive/negative correlation, they are getting an in-phase/antiphase with increasing periodicity. (iii) We detected a periodicity interval of about 128–512 days in all MTM and wavelet analysis results except CRI. It appears very prominently in the XWT and WTC plots of FI versus all other parameters compared to the wavelet and MTM results. This result shows that this periodicity is a common periodicity for all datasets, but its confidence level is below 95% in some datasets. As a general result, we therefore assume that FI and other datasets used in this study are related to each other.

4. Discussion

As a result of our analyses, we determined 10 periods from the data used within the scope of this study: 683, 512, 372–455, 292–293, 178–228, 151.7, 120.5, 52–61, 44–45 and 25–33 days. The origin of periods ranging from 150 to 876 days is commonly attributed to magnetic Rosby waves [50,51,52,53]. Thus, we may conclude that the 683-, 512-, 372–455-, 292–293-, 178–228- and 151.7-day periods obtained herein are manifestations of magnetic Rossby waves in the solar flares and other parameters used in this study. [53] found periodicities of about 120.5 and 52–61 days from the strong X-ray solar flares (M and X classes), and concluded that these periods are probably produced by the same mechanism as the Rieger periods or may be harmonics of them. Thus, we may say that these two periodicities are of Rieger type. It is well known that the two remaining periodicities (44–45 and 25–33 days) are due to the solar rotation and its interaction with the surface dynamo of the Sun.
The authors in Ref. [1] discovered the 154-day periodicity in solar hard X-ray and gamma-ray flares which were stronger than X-ray classification (≥M2.5), around the peak of Solar Cycle 21. Later, this periodicity was confirmed by many authors in different solar activity and geomagnetic activity datasets during the different phases of solar cycles [54,55,56,57,58,59]. It is known that the frequency of both numbers of CMEs and flares are strongly related to solar cyclic variation and there is a close relation between them. Here, we found the 151-day Rieger periodicity from the CME number data, which were also extracted in the FI data MTM spectrum with a significance level just below the 95% confidence level. As it exists in the wavelet scalograms of both data, we may say that mainly strong flares are associated with CME events, and therefore this periodicity is below the 95% confidence level.
The authors in Ref. [60] examined the solar Cycle 24 (2009–2020) periodic variations of the hemispheric and total solar FI data independently using the same methods that we used here and periodicities of 1024, 682, 410, 293, 149, 52–62 and 27–33 days from the whole data were found. Here, we used daily data for the exact duration of Cycle 24 (from December 2008 to December 2019) and found 293-, 52–61- and 25–33-day periodicities from the total FI data. The 1024-, 682-, 410- and 149-day periodicities also exist in the power spectrum of the total FI but they are below the 95% confidence level. Thus, we confirm most of their results and further update the cyclic variations of solar FI with daily data for the exact duration of the Solar Cycle 24. The differences between the two analyses may be due to the data length: [60] used data from January 2009 to December 2020, while we used Cycle 24 duration data, from December 2008 to December 2019. Recently, [61] investigated the cyclic behavior of the solar coronal index by using Lomb-Scargle periodogram and wavelet transform for the 1939–2020 time interval and found 27.8- ± 3.2-, 161.61- ± 21.96-day periodicities, as well as 1.01- ± 0.24-, 2.3- ± 0.42-, 3.42- ± 0.24- and 5.44- ± 0.44-year periodicities. Here, we analyzed CI data for only the 24th solar cycle and we found periods of 178–240, 52–61, 44–45 and 25–33 days (see, Table 1). The 27-day solar rotation and 178–240-day periodicities alone match with their results. Possible reasons for the differences may come from the different methods used (Scargle vs. MTM), as well as from the different lengths of data: the 1939–2020 time interval in one case, and Cycle 24 in ours. It is worth noting that FI and CI are both of solar origin and are highly correlated with each other [57]. But, they do not show the same periodic behavior due to the sources; solar FI is a rough measure of released energy in H α (6563 Å), while the CI is the measure of total solar irradiance in the Fe XIV (5303 Å) coronal emission line. Therefore, they are the measure of energy originating from different sources and thus, their periodic behaviors may show some differences.
The authors in Ref. [62] investigated the periodicities of the geomagnetic Ap index and the z component of interplanetary magnetic field (IMF) using the Lomb-Scargle periodogram and Morlet wavelet analysis methods for the time interval from January 2009 to August 2013 (ascending phase of Cycle 24). They found periodicities of ∼26–34 days, which were about 44, 61, 67, 111, 129, 152, 186 and 239 days from the z component of IMF, and 28–32, 41, 45, 53, 59, 123, 131 and 170 days from the Ap index data. Later, during the period 1965–2018, Ref. [49] examined the periodicities of cosmic ray intensity, as well as solar and geomagnetic activity parameters. They used the sunspot number as a solar datum, and the Bz component of IMF, geomagnetic Ap index and cosmic ray intensity as geomagnetic activity parameters. They also used the Lomb–Scargle periodogram and wavelet analysis and found a 28.5-day periodicity for IMF Bz; 25.3 days, 6.1 and 8.7 months, 1.3, 1.7, 2.3, 3.0, 3.6, 4.0 and 5.2 years for Ap index; and 9.5 months, 1.2, 1.7, 3, 3.7 and 5 years for CRI from the Scargle period analysis. Here, we analyzed the average IMF, CRI, Ap and Dst indices and found 25–33-day solar rotation and 5.6-year periodicity for all datasets without any exception. Our results deviate from the findings of [49], especially for the z component of the IMF and CRI datasets. They only found a 28.5-day period for the IMF and a 9.5-month, 1.2-, 1.7-, 3-, 3.7- and 5-year period for CRI. We found additional periods of 372–455, 292–293 and 120.5 days for the average IMF and only three periods of 52–61, 44–45 and 25–33 day for CRI data. Possible reasons for these differences are the different methods used (Lomb-Scargle vs. MTM) for the analysis, differences in datasets and the different lengths (1965–2018 vs. 2009–2020) of the data. When we compare our Morlet wavelet and MTM analyses results, we may conclude that MTM results show very good agreement with the wavelet results, and this supports the accuracy of our findings.
The authors in Ref. [63] compared the interplanetary coronal mass ejection (ICME) with Dst and AE indices using the XWT and WTC analysis methods within Solar Cycle 23. They came to the conclusion that only the annual frequency component of ICMEs is phase-locked with the Dst and AE indices, and that ICMEs modulated the Dst and AE indices during the maximum phase of Solar Cycle 23. Recently, Ref. [12] studied the periodic variations of the monthly FI and Ap, Dst, Scalar B and aa geomagnetic activity indicators using MTM, Morlet wavelet XWT and WTC analysis methods from 1 January 1975 to 31 December 2020. They came to the conclusion that, while all parameters are in-phase and highly correlated for the 11-year solar cycle periodicity, FI and other parameters typically exhibit phase mixing during the small periods (2–8 months). Here, we analyzed daily datasets including/excluding some datasets (CI, CRI, CME number/aa) for only Solar Cycle 24. This way, we increased the time resolution of obtained periodicities using high-resolution data (daily data) limiting the investigated time period on the exact duration of Solar Cycle 24. Thus, our results specify the cyclic variations of selected datasets over the exact Solar Cycle 24 instead of a combination of data coming from four previous solar cycles. We found that the phase relations between the compared datasets’ periodicities are gradually changing from short to long ones: for short periodicities, there are no phase relations and they exhibit strongly mixed phases, whereas for long periodicities, there are phase relations and they are entirely in-phase/anti-phase. From this result, we may say that long-term oscillations are phase-locked, while in the case of short-term oscillations, there is no phase locking. We may conclude that long periods carry their impact at least as far as the Earth, while the short periods are seriously affected by regional dynamics including, for instance, the interplanetary medium, ionosphere and magnetosphere. The WTC analysis is used to find a correlation between the two compared signals. It is most commonly used to find correlated areas that are uncorrelated for most of the time [64]. Thus, this gives information about common periods between the compared datasets. As shown in Figure 3, most of the periodicities observed in solar FI exist in all other indices compared in this study. In other words, all detected FI periodicities are common to all other datasets used in this investigation. From both XWT and WTC analyses, we may further conclude that solar flares are one of the main drivers of geomagnetic activity, especially for the long-term variation, while for the short-term variations, the local dynamics remain more important compared to solar variations.

5. Conclusions

We performed a periodicity analysis of specific daily solar (FI, CI and CME number), geomagnetic (Ap, Dst and Scalar B) and cosmic (CRI) activity indices for the precise duration of the most recent solar cycle (Solar Cycle 24). This investigation was carried out on the examined datasets using the MTM, Morlet wavelet, XWT and WTC analysis techniques. The findings from our analyses are as follows:
  • The 25–33-day solar rotation periodicity exists in all datasets without any exception in the MTM power spectra. This periodicity is seen in wavelet scalograms of all datasets, especially during the maximum phase of the cycle (Cycle 24).
  • Except for the solar rotation periodicity, all periods show data preference, and they appear around the investigated cycle’s maximum phase; the 683-day periodicity is only seen in the Dst index MTM spectrum and in the wavelet scalogram of FI, Ap and CRI. The 512-day periodicity is only detected in the CME number MTM spectrum and in the wavelet scalogram of the CME number, FI, Ap index, Dst index and scalar B wavelet analysis results. The 370–455-day periodicities are seen in the MTM spectrum of Ap and Scalar B, and the wavelet scalograms of FI, Ap, Dst, Scalar B and CME number. The 292–293-day periods are only seen in the MTM spectra and wavelet scalograms of FI and Scalar B. The 178–240-day periodicities are seen in all geomagnetic activity indices and the CME number MTM spectra. It does not appear as a significant periodicity in the wavelet scalogram of CRI dataset. The 151-day Rieger periodicity only appears in the MTM spectrum of the CME number and is seen in the wavelet scalograms of the CME number, FI, Ap index and Dst index as a meaningful periodicity. The 120.5-day periodicity is only seen in the MTM spectrum of Scalar B. The 52–61-day periodicities are detected in FI and CRI as significant periodicities. The 44–45-day periodicities are seen as a meaningful periodicity in the MTM spectra of the CI, Dst, CRI and CME number datasets, and these appear in the wavelet scalograms of the FI, CI, Ap, Dst and CRI.
  • When comparing the phase relations between periodicities in the used datasets, they exhibit a gradual transition from small to large periods. For short-term periodicities, there are no phase relations but a mixed phase, whereas for high periodicities, there is a complete phase/anti-phase transition.
  • All identified flare index periodicities are common to all other datasets examined in this investigation.
Unlike previous studies, where the contributions of different parameters to solar activity and its impact on Earth were either partial (sometimes a single contributor) or involved different time scales, this study includes seven daily indices, analyzed by the same methods over the same ranging time (Cycle 24). It turns out that this study is more informative and of higher resolution, allowing more in-depth comparisons, which further assist our understanding of the Sun’s physical properties and its terrestrial repercussions.

Author Contributions

A.K. prepared a draft manuscript and performed MTM and wavelet analyses by using the publicly available MTM tool and biwavelet package (https://dept.atmos.ucla.edu/tcd/singular-spectrum-analysis-ssa and https://cran.r-project.org/web/packages/biwavelet). J.-P.R. and A.O. read the draft manuscript and amended it carefully. They contributed especially on the physical interpretation of obtained results and the finalizing of manuscript. All authors have read and agreed to the published version of the manuscript.

Funding

This research received no external funding.

Data Availability Statement

As mentioned in the manuscript, all datasets used in this manuscript are publicly available from the corresponding websites; FI data from https://www.ngdc.noaa.gov/stp/solar/solarflares.html, CI data from http://www.suh.sk/obs/vysl/MCI.htm, the Ap, Dst and Scalar B data from https://omniweb.gsfc.nasa.gov/form/dx1.html, CRI data are taken from https://cosmicrays.oulu.fi/#solar, respectively. Accessed to all these data sources on 11 September 2023. Finally the CME data from https://cdaw.gsfc.nasa.gov/CME_list accessed on 7 February 2024.

Acknowledgments

We thank the anonymous reviewers for very useful comments that helped to improve the manuscript seriously.

Conflicts of Interest

The authors declare no conflicts of interest.

References

  1. Rieger, E.; Share, G.H.; Forrest, D.J.; Kanbach, G.; Reppin, C.; Chupp, E.L. A 154-day periodicity in the occurrence of hard solar flares? Nature 1984, 312, 623–625. [Google Scholar] [CrossRef]
  2. Bogart, R.S.; Bai, T. Confirmation of a 152 day periodicity in the occurrence of solar flares inferred from microwave data. ApJL 1985, 299, L51–L55. [Google Scholar] [CrossRef]
  3. Ozguc, A.; Atac, T. Periodic Behaviour of Solar Flare Index during SOLAR-CYCLE-20 and SOLAR-CYCLE-21. Solphys 1989, 123, 357–365. [Google Scholar] [CrossRef]
  4. Bai, T.; Cliver, E.W. A 154 Day Periodicity in the Occurrence Rate of Proton Flares. ApJ 1990, 363, 299. [Google Scholar] [CrossRef]
  5. Carbonell, M.; Ballester, J.L. The periodic behaviour of solar activity—The near 155-day periodicity in sunspot areas. AAP 1992, 255, 350–362. [Google Scholar]
  6. Bai, T. Periodicities in Solar Flare Occurrence: Analysis of Cycles 19–23. ApJ 2003, 591, 406–415. [Google Scholar] [CrossRef]
  7. Joshi, B.; Joshi, A. Intermediate-Term Periodicities in Soft X-ray Flare Index During Solar Cycles 21, 22 and 23. Solphys 2005, 226, 153–161. [Google Scholar] [CrossRef]
  8. Chowdhury, P.; Khan, M.; Ray, P.C. Intermediate-term periodicities in sunspot areas during solar cycles 22 and 23. MNRAS 2009, 392, 1159–1180. [Google Scholar] [CrossRef]
  9. Kilcik, A.; Özgüç, A.; Rozelot, J.P.; Ataç, T. Periodicities in Solar Flare Index for Cycles 21–23 Revisited. Solphys 2010, 264, 255–268. [Google Scholar] [CrossRef]
  10. Chowdhury, P.; Gokhale, M.H.; Singh, J.; Moon, Y.J. Mid-term quasi-periodicities in the CaII-K plage index of the Sun and their implications. APSS 2016, 361, 54. [Google Scholar] [CrossRef]
  11. Courtillot, V.; Lopes, F.; Le Mouël, J.L. On the Prediction of Solar Cycles. Solphys 2021, 296, 21. [Google Scholar] [CrossRef]
  12. Ozguc, A.; Kilcik, A.; Yurchyshyn, V. Temporal and Periodic Variations of the Solar Flare Index During the Last Four Solar Cycles and Their Association with Selected Geomagnetic-Activity Parameters. Solphys 2022, 297, 112. [Google Scholar] [CrossRef]
  13. Mayaud, P.N. The aa indices: A 100-year series characterizing the magnetic activity. JGR 1972, 77, 6870. [Google Scholar] [CrossRef]
  14. Bartels, V.J. Erdmagnetische Aktivität—V. Terr. Magn. Atmos. Electr. (J. Geophys. Res.) 1938, 43, 131. [Google Scholar] [CrossRef]
  15. Bartels, J.; Heck, N.H.; Johnston, H.F. The three-hour-range index measuring geomagnetic activity. JGR 1939, 44, 411. [Google Scholar] [CrossRef]
  16. Sugiura, M. Hourly values of equatorial Dst for the IGY. Ann. Int. Geophys. Yr. 1964, 35, 9. [Google Scholar]
  17. Snyder, C.W.; Neugebauer, M.; Rao, U.R. The Solar Wind Velocity and Its Correlation with Cosmic-Ray Variations and with Solar and Geomagnetic Activity. JGR 1963, 68, 6361. [Google Scholar] [CrossRef]
  18. Echer, E.; Gonzalez, W.D.; Gonzalez, A.L.C.; Prestes, A.; Vieira, L.E.A.; dal Lago, A.; Guarnieri, F.L.; Schuch, N.J. Long-term correlation between solar and geomagnetic activity. J. Atmos. Sol.-Terr. Phys. 2004, 66, 1019–1025. [Google Scholar] [CrossRef]
  19. Verbanac, G.; Mandea, M.; Vršnak, B.; Sentic, S. Evolution of Solar and Geomagnetic Activity Indices, and Their Relationship: 1960–2001. Solphys 2011, 271, 183–195. [Google Scholar] [CrossRef]
  20. Du, Z.L. Bimodal Structure of the Solar Cycle. ApJ 2015, 803, 15. [Google Scholar] [CrossRef]
  21. Kirov, B.; Asenovski, S.; Georgieva, K.; Obridko, V.N.; Maris-Muntean, G. Forecasting the sunspot maximum through an analysis of geomagnetic activity. JASTP 2018, 176, 42–50. [Google Scholar] [CrossRef]
  22. Sarp, V.; Kilcik, A. Solar flare and geomagnetic activity relations. Turk. J. Phys. 2018, 42, 283–292. [Google Scholar] [CrossRef]
  23. Legrand, J.P.; Simon, P.A. Ten Cycles of Solar and Geomagnetic Activity. Solphys 1981, 70, 173–195. [Google Scholar] [CrossRef]
  24. Cadavid, A.C.; Lawrence, J.K.; McDonald, D.P.; Ruzmaikin, A. Independent Global Modes of Solar Magnetic Field Fluctuations. Solphys 2005, 226, 359–376. [Google Scholar] [CrossRef]
  25. Kilcik, A.; Chowdhury, P.; Sarp, V.; Yurchyshyn, V.; Donmez, B.; Rozelot, J.P.; Ozguc, A. Temporal and Periodic Variation of the MCMESI for the Last Two Solar Cycles; Comparison with the Number of Different Class X-ray Solar Flares. Solphys 2020, 295, 159. [Google Scholar] [CrossRef]
  26. Rybansky, M. Coronal Index of Solar Activity. I. Line 5303 A, Year 1971. Bull. Astron. Inst. Czechoslov. 1975, 26, 367. [Google Scholar]
  27. Rybanský, M.; Rušin, V.; Minarovjech, M. Coronal index of solar activity—Solar-terrestrial research. SSRv 2001, 95, 227–234. [Google Scholar] [CrossRef]
  28. Tsurutani, B.T.; Zank, G.P.; Sterken, V.J.; Shibata, K.; Nagai, T.; Mannucci, A.J.; Malaspina, D.M.; Lakhina, G.S.; Kanekal, S.G.; Hosokawa, K.; et al. Space Plasma Physics: A Review. IEEE Trans. Plasma Sci. 2023, 51, 1595–1655. [Google Scholar] [CrossRef]
  29. Owens, M.J.; Forsyth, R.J. The Heliospheric Magnetic Field. Living Rev. Sol. Phys. 2013, 10, 5. [Google Scholar] [CrossRef]
  30. Thomson, D.J. Spectrum Estimation and Harmonic Analysis. IEEE Proc. 1982, 70, 1055–1096. [Google Scholar] [CrossRef]
  31. Waldenand, A.T.; Guttorp, P. (Eds.) Envelope Estimation for Quasi-Periodic Geophysical Signals in Noise: A Multitaper Approach, in Statistics in the Environmental and Earth Sciences; Edward Arnold: London, UK, 1992; pp. 189–219. [Google Scholar]
  32. Ghil, M.; Allen, M.R.; Dettinger, M.D.; Ide, K.; Kondrashov, D.; Mann, M.E.; Robertson, A.W.; Saunders, A.; Tian, Y.; Varadi, F.; et al. Advanced Spectral Methods for Climatic Time Series. Rev. Geophys. 2002, 40, 1003. [Google Scholar] [CrossRef]
  33. Mufti, S.; Shah, G.N. Solar-geomagnetic activity influence on Earth’s climate. J. Atmos. Sol.-Terr. Phys. 2011, 73, 1607–1615. [Google Scholar] [CrossRef]
  34. Fang, K.; Gou, X.; Chen, F.; Liu, C.; Davi, N.; Li, J.; Zhao, Z.; Li, Y. Tree-ring based reconstruction of drought variability (1615–2009) in the Kongtong Mountain area, northern China. Glob. Planet. Chang. 2012, 80, 190–197. [Google Scholar] [CrossRef]
  35. Kilcik, A.; Yurchyshyn, V.; Donmez, B.; Obridko, V.N.; Ozguc, A.; Rozelot, J.P. Temporal and Periodic Variations of Sunspot Counts in Flaring and Non-Flaring Active Regions. Solphys 2018, 293, 63. [Google Scholar] [CrossRef]
  36. Chowdhury, P.; Kilcik, A.; Yurchyshyn, V.; Obridko, V.N.; Rozelot, J.P. Analysis of the Hemispheric Sunspot Number Time Series for the Solar Cycles 18 to 24. Solphys 2019, 294, 142. [Google Scholar] [CrossRef]
  37. Torrence, C.; Compo, G.P. A Practical Guide to Wavelet Analysis. Bull. Am. Meteorol. Soc. 1998, 79, 61–78. [Google Scholar] [CrossRef]
  38. Guedes, M.R.G.; Pereira, E.S.; Cecatto, J.R. Wavelet analysis of CME, X-ray flare, and sunspot series. AAP 2015, 573, A64. [Google Scholar] [CrossRef]
  39. Oloketuyi, J.; Liu, Y.; Zhao, M. The Periodic and Temporal Behaviors of Solar X-Ray Flares in Solar Cycles 23 and 24. ApJ 2019, 874, 20. [Google Scholar] [CrossRef]
  40. Gouhier, T.C.; Grinsted, A.; Simko, V. R Package Biwavelet: Conduct Univariate and Bivariate Wavelet Analyses, Version 0.20.21; 2021. Available online: https://cran.r-project.org/web/packages/biwavelet/biwavelet.pdf (accessed on 11 September 2023).
  41. Poluianov, S.; Traversi, R.; Usoskin, I. Cosmogenic production and climate contributions to nitrate record in the TALDICE Antarctic ice core. J. Atmos. Sol.-Terr. Phys. 2014, 121, 50–58. [Google Scholar] [CrossRef]
  42. Xiang, N.B.; Kong, D.F. What Causes the Inter-solar-cycle Variation of Total Solar Irradiance? AJ 2015, 150, 171. [Google Scholar] [CrossRef]
  43. Thomas, E.; Joseph, I.; Abraham, N.P. Wavelet analysis of annual rainfall over Kerala and sunspot number. New Astron. 2023, 98, 101944. [Google Scholar] [CrossRef]
  44. Maraun, D.; Kurths, J. Cross wavelet analysis: Significance testing and pitfalls. Nonlinear Process. Geophys. 2004, 11, 505–514. [Google Scholar] [CrossRef]
  45. Grinsted, A.; Moore, J.C.; Jevrejeva, S. Application of the cross wavelet transform and wavelet coherence to geophysical time series. Nonlinear Process. Geophys. 2004, 11, 561–566. [Google Scholar] [CrossRef]
  46. Chang, C.; Glover, G.H. Time-frequency dynamics of resting-state brain connectivity measured with fMRI. Neuroimage 2010, 50, 81–98. [Google Scholar] [CrossRef]
  47. Mursula, K.; Zieger, B. The 1.3-Year Variation in Solar Wind Speed and Geomagnetic Activity. Adv. Space Res. 2000, 25, 1939–1942. [Google Scholar] [CrossRef]
  48. Katsavrias, C.; Preka-Papadema, P.; Moussas, X. Wavelet Analysis on Solar Wind Parameters and Geomagnetic Indices. Solphys 2012, 280, 623–640. [Google Scholar] [CrossRef]
  49. Tsichla, M.; Gerontidou, M.; Mavromichalaki, H. Spectral Analysis of Solar and Geomagnetic Parameters in Relation to Cosmic-ray Intensity for the Time Period 1965–2018. Solphys 2019, 294, 15. [Google Scholar] [CrossRef]
  50. Mursula, K.; Zieger, B.; Vilppola, J.H. Mid-term quasi-periodicities in geomagnetic activity during the last 15 solar cycles: Connection to solar dynamo strength To the memory of Karolen I. Paularena (1957–2001). Solphys 2003, 212, 201–207. [Google Scholar] [CrossRef]
  51. Gurgenashvili, E.; Zaqarashvili, T.V.; Kukhianidze, V.; Oliver, R.; Ballester, J.L.; Ramishvili, G.; Shergelashvili, B.; Hanslmeier, A.; Poedts, S. Rieger-type Periodicity during Solar Cycles 14–24: Estimation of Dynamo Magnetic Field Strength in the Solar Interior. ApJ 2016, 826, 55. [Google Scholar] [CrossRef]
  52. Ruždjak, D.; Brajša, R.; Skokić, I.; Sudar, D.; Hanslmeier, A. On the Periodicities in Solar Rotation and Activity Determined from Sunspot-Group Data and Possible Connection with Rossby-like Waves. Solphys 2023, 298, 39. [Google Scholar] [CrossRef]
  53. Korsós, M.B.; Dikpati, M.; Erdélyi, R.; Liu, J.; Zuccarello, F. On the Connection between Rieger-type and Magneto-Rossby Waves Driving the Frequency of the Large Solar Eruptions during Solar Cycles 19–25. ApJ 2023, 944, 180. [Google Scholar] [CrossRef]
  54. Bai, T.; Sturrock, P.A. Evidence for a Fundamental Period of the Sun and Its Relation to the 154 Day Complex of Periodicities. Aapj 1993, 409, 476. [Google Scholar] [CrossRef]
  55. Cane, H.V.; Richardson, I.G.; von Rosenvinge, T.T. Interplanetary magnetic field periodicity of ∼153 days. Grl 1998, 25, 4437–4440. [Google Scholar] [CrossRef]
  56. Knaack, R.; Stenflo, J.O.; Berdyugina, S.V. Evolution and rotation of large-scale photospheric magnetic fields of the Sun during cycles 21–23. Periodicities, north–south asymmetries and r-mode signatures. Aap 2005, 438, 1067–1082. [Google Scholar] [CrossRef]
  57. Singh, Y.P.; Badruddin. Short- and mid-term oscillations of solar, geomagnetic activity and cosmic-ray intensity during the last two solar magnetic cycles. Planss 2017, 138, 1–6. [Google Scholar] [CrossRef]
  58. Oloketuyi, J.; Liu, Y.; Amanambu, A.C.; Zhao, M. Responses and Periodic Variations of Cosmic Ray Intensity and Solar Wind Speed to Sunspot Numbers. Adv. Astron. 2020, 2020, 3527570. [Google Scholar] [CrossRef]
  59. Gurgenashvili, E.; Zaqarashvili, T.V.; Kukhianidze, V.; Reiners, A.; Oliver, R.; Lanza, A.F.; Reinhold, T. Rieger-type periodicity in the total irradiance of the Sun as a star during solar cycles 23–24. Aap 2021, 653, A146. [Google Scholar] [CrossRef]
  60. Ozguc, A.; Kilcik, A.; Sarp, V.; Yesilyaprak, H.; Pektas, R. Periodic Variation of Solar Flare Index for the Last Solar Cycle (Cycle 24). Adv. Astron. 2021, 2021, 5391091. [Google Scholar] [CrossRef]
  61. Tang, R.; Fei, Y.; Li, C.; Liu, W.; Tian, X.; Wan, Z. Periodic Variations of Solar Corona Index during 1939–2020. Universe 2022, 8, 375. [Google Scholar] [CrossRef]
  62. Chowdhury, P.; Choudhary, D.P.; Gosain, S.; Moon, Y.J. Short-term periodicities in interplanetary, geomagnetic and solar phenomena during solar cycle 24. APSS 2015, 356, 7–18. [Google Scholar] [CrossRef]
  63. Katsavrias, C.; Hillaris, A.; Preka-Papadema, P. A wavelet based approach to Solar-Terrestrial Coupling. Adv. Space Res. 2016, 57, 2234–2244. [Google Scholar] [CrossRef]
  64. Garg, A.; Xu, D.; Blaber, A.P. Statistical validation of wavelet transform coherence method to assess the transfer of calf muscle activation to blood pressure during quiet standing. Biomed. Eng. Online 2013, 12, 132. [Google Scholar] [CrossRef]
Figure 1. MTM (left panels) and Morlet wavelet (right panels) analysis results of the FI, CI and CME numbers. The black curve in the wavelet scalograms describes the COI, while the dashed and dotted lines in the MTM spectra show 95% and 99% confidence levels of detected periodicities. Black contours inside the wavelet scalograms show the meaningful periods.
Universe 10 00107 g001
Figure 2. The same as Figure 1, but for the Ap, Dst, ScB and CRI indices used in this study.
Universe 10 00107 g002
Figure 3. XWT and WTC scalograms for FI versus all other indices used in this study. The analyses were performed with red noise approximation.
Universe 10 00107 g003
Table 1. Detected MTM periodicities and their errors, confidence levels and existence in the analyzed datasets.
Dataset/
Period [Day]/
FICIAp Index [nT]Dst Index [nT]Scalar B [nT]CRICME Number
683+>99%
512+>99%
372–455+>95%+>99%
292–293+>95%+>95%
178–240+>95%+>95%+>95%+>99%
151.7+>99%
120.5+>95%
52–61+>95%+>95%
44–45+>95%+>95%+>95%+>95%
25–33+>99%+>99%+>99%+>99%+>99%+>99%+>95%
Disclaimer/Publisher’s Note: The statements, opinions and data contained in all publications are solely those of the individual author(s) and contributor(s) and not of MDPI and/or the editor(s). MDPI and/or the editor(s) disclaim responsibility for any injury to people or property resulting from any ideas, methods, instructions or products referred to in the content.

