Article

The Mother’s Day Solar Storm of 11 May 2024 and Its Effect on Earth’s Radiation Belts

by
Viviane Pierrard
1,2,*,†,
Alexandre Winant
1,2,†,
Edith Botek
1 and
Maximilien Péters de Bonhome
1,2
1
Solar Wind, Space Physics and Solar-Terrestrial Center of Excellence, Royal Belgian Institute for Space Aeronomy (BIRA-IASB), Avenue Circulaire 3, B-1180 Brussels, Belgium
2
Center for Space Radiations (CSR), Earth and Life Institute—Climate Sciences ELI-C, Université Catholique de Louvain (UCLouvain), B-1348 Louvain-la-Neuve, Belgium
*
Author to whom correspondence should be addressed.
These authors contributed equally to this work.
Universe 2024, 10(10), 391; https://doi.org/10.3390/universe10100391
Submission received: 4 September 2024 / Revised: 27 September 2024 / Accepted: 5 October 2024 / Published: 10 October 2024
(This article belongs to the Section Space Science)

Abstract

The month of May 2024 was characterized by solar energetic particles events directed towards the Earth, especially the big event causing a strong terrestrial geomagnetic storm during the night from 10 to 11 May 2024, with auroras observed everywhere in Europe. This was the strongest storm for the last 20 years with a Disturbed Storm Time index Dst < −400 nT. In the present work, we show with observations of GOES, PROBA-V/EPT and MetOP/MEPED that this exceptional event was associated with the injection of energetic protons in the proton radiation belt, with important consequences for the South part of the South Atlantic Anomaly (SAA). In addition, the geomagnetic storm caused by the solar eruption has had tremendous impacts on the electron radiation belts. Indeed, we show that for 0.3 to 1 MeV electrons, the storm led to a long lasting four belts configuration which was not observed before with EPT launched in 2013, until a smaller geomagnetic storm took place at the end of June 2024. Moreover, for the first time since its launch, observations of the EPT show that ultra-relativistic electrons with E > 2 MeV have been injected into the inner belt down to McIlwain parameter L = 2.4, violating the impenetrable barrier previously estimated to be located at L = 2.8.

Graphical Abstract

1. Introduction: The 11 May 2024 Event in the Context of Previous Storms

Throughout the month of May 2024, several active regions rotated across the solar disc. One of them, called NOAA 13664, especially grew in size and magnetic complexity, and gave rise to numerous large flares, including several X-class flares [1]. Associated with the activity around this active region were a number of moderate to large fast Coronal Mass Ejections (CMEs), many of which were Earth directed. Active region NOAA 13664 was the largest sunspot group in more than 10 years. It produced the strongest solar flare so far this solar cycle, and was the most flare productive region in more than 3 decades. It is the source of the coronal mass ejection that led to the strongest geomagnetic storm in two decades. On 8 and 9 May, the Sun produced no less than 28 M- and X-class flares, 20 of them of NOAA 13664. NOAA 13664 now occupies the 4th spot in terms of highest M- and X-class flare production since the start of the GOES measurements in 1976. The sunspot group is obviously the largest of the solar cycle so far (2400 millionths of a solar hemisphere, or 14 times the total surface of the Earth). Due to the quick succession and varying speeds of the CMEs, several of them merged and interacted as they travelled through the interplanetary medium leading to enhanced effects in the Earth’s space environment. These subsequent complex magnetic structures traversing the interplanetary medium increased the geo-effectiveness of the events at Earth.
The characteristics of the solar wind measured by OMNI when it reached 1 AU are illustrated on Figure 1. The arrival time of event at 1 AU with regard to solar wind density, velocity and pressure is 10 May 2024 at 17:07 UT. A clear peak of solar wind density, bulk velocity (top panel), temperature and pressure (second panel) is observed on 11 May 2024. The bulk velocity peak (that reached almost 1000 km/s) and the temperature perturbations are longer in time than the density shock. The pressure combines the density and velocity effects, and determines the position of the magnetopause. The inverted negative peak of the Z component of the Interplanetary Magnetic Field Bz (third panel) showing a southward direction implies a strong answer of the geomagnetic field. The solar event indeed gave rise to the largest geomagnetic storm observed in 20 years in the night of 11 May. This storm has been called “Mother’s Day” event, because the date corresponds to Mother’s Day in many countries around the world.
The geomagnetic activity indices of Bartels (Kp) and Disturbed storm time (Dst in nanoTesla) are illustrated in the bottom panel of Figure 1. The initial phase of the storm started at the arrival of the solar wind perturbation, i.e., on 10 May 2024 at 17:07 UT. At this point in time, a strong sudden commencement is observed in the Dst index. During the main phase, Dst drastically dropped to −412 nT (and a higher resolution minimum SYM-H of 512 nT not shown here) on 11 May 2024 at 02:14. It is the largest geomagnetic storm (lowest value of Dst) since the November 2003 Halloween events. It is only in October-November 2003 and November 2004 that storms of comparable strength are found. The 11 May 2024 storm is the 7th day with the most negative Dst value since the measurements started in 1957 (WDC Kyoto—https://wdc.kugi.kyoto-u.ac.jp/ (accessed on 2 September 2024)). It ranks just behind 20 November 2003 but before other major storms such as on 26 May 1967, 31 March 2001 and 30 October 2003. Only the famous 13–14 March 1989 storm ( 589 nT) and 3 days in the late 1950s have a more negative Dst. As Dst values are only available since 1957, one should not forget there were also other big storms in the past, such as the Carrington event of September 1859, the 4 February 1872 storm, and the 13–15 May 1921 storm. For these events, much stronger individual Dst values of respectively 949 nT, 834 nT [2,3] and 907 nT [4] have been estimated.
The 11 May 2024 storm persisted through the weekend giving rise to auroras at low magnetic latitudes (below 45°) in both hemispheres [5]. The space weather at this time also resulted in strong radio blackouts and solar energetic particle events with radiation-belt enhancements throughout the days following. This big event had strong effects on the terrestrial radiation belts that will be explained in the present work.
Section 2 presents the instruments and data used to measure the fluxes in the radiation belts. Section 3 presents the injection of protons during the event, while Section 4 shows the modifications of the electron fluxes. The new results are discussed in Section 5 and conclusions are presented in the Section 6.

2. Instruments and Data

2.1. PROBA-V/EPT

The Energetic Particle Telescope (EPT) measures the fluxes of high energy particles in the radiation belts. This instrument was developed by the Center for Space Radiation (CSR) at UCLouvain in Belgium, with the collaboration of the Royal Belgian Institute for Space Aeronomy and QinetiQ Space (presently Redwire Space). This instrument was launched on 7 May 2013 onboard the ESA (European Space Agency) satellite PROBA-V. The spacecraft was sent to a sun-synchronous polar Low Earth Orbit (LEO) at an altitude of 820 km, with an inclination of 98.73° and a descending node at 10:30 am local time [6]. The concept of the EPT is based on the Bethe-Block formula giving the relationship between the stopping power of a material and the energy of incident charged particles [7]. The EPT was designed for real-time and contamination-free measurements of charged particle spectra in the space environment and is able to discriminate between electrons, protons, alpha particles and heavier ions while performing direct measurements of their energy spectra [8]. The EPT features two energy sections. The Low Energy Section (LES) only measures lower energy electron fluxes, while the High Energy Section (HES) measures electron, proton and heavier particle fluxes of higher energy. The EPT measures differential flux of electrons above 500 keV in 6 energy channels, and of protons above 9.5 MeV in 10 energy channels.

2.2. SEM-2/MEPED

The Space Environment Monitor 2 (SEM-2) [9] consists of a suite of instruments that monitor the flux of protons and electrons in near-Earth space. One of the two main instruments of the SEM-2 suite is the Medium Energy Proton and Electron Detector (MEPED) which focuses on measuring fluxes of energetic protons and electrons coming directly from the Sun and trapped in the Earth’s geomagnetic field, i.e., forming the radiation belts. The SEM-2 suite was first fitted on the NOAA-15 (National Oceanic and Atmospheric Administration) POES (Polar Orbiting Environmental Satellites) in 1998 and then on all later versions NOAA-16 to -19. In 2006, SEM-2 was also accommodated on the ESA MetOp-A and also on the later versions MetOp-B and MetOp-C. All the satellites on which SEM-2 is fitted on operate on heliosynchronous LEO at an average altitude of 850 km for NOAA/POES and 820 km for MetOp.
The MEPED instrument is composed of two pairs of directional detectors. The first pair is dedicated to the measurement of protons with energies ranging from 30 keV to 200 MeV in 5 differential channels and one integral channel. The second pair of detectors measures the fluxes of electrons of energies between 30 keV to 2500 keV in 3 integral channels. For a given type of particles, the two telescopes are arranged perpendicular to one another and are referred to as the 0° telescope and the 90° telescope. On MetOp, the 0° telescope points directly to the zenith and the 90° telescope points to the antiram direction (i.e., opposite to the velocity vector of the spacecraft). The particular arrangement of the MEPED telescopes allows to characterize both trapped and precipitating particles. Indeed, the 90° telescope mostly measures particles that are trapped in the geomagnetic field whereas the 0° telescope mainly measures particles in the Bounce Loss Cone (BLC) and thus precipitating into the atmosphere.

3. The Effects of the 11 May Storm on the Proton Radiation Belt

3.1. Protons Observed by GOES at Geostationary Orbit

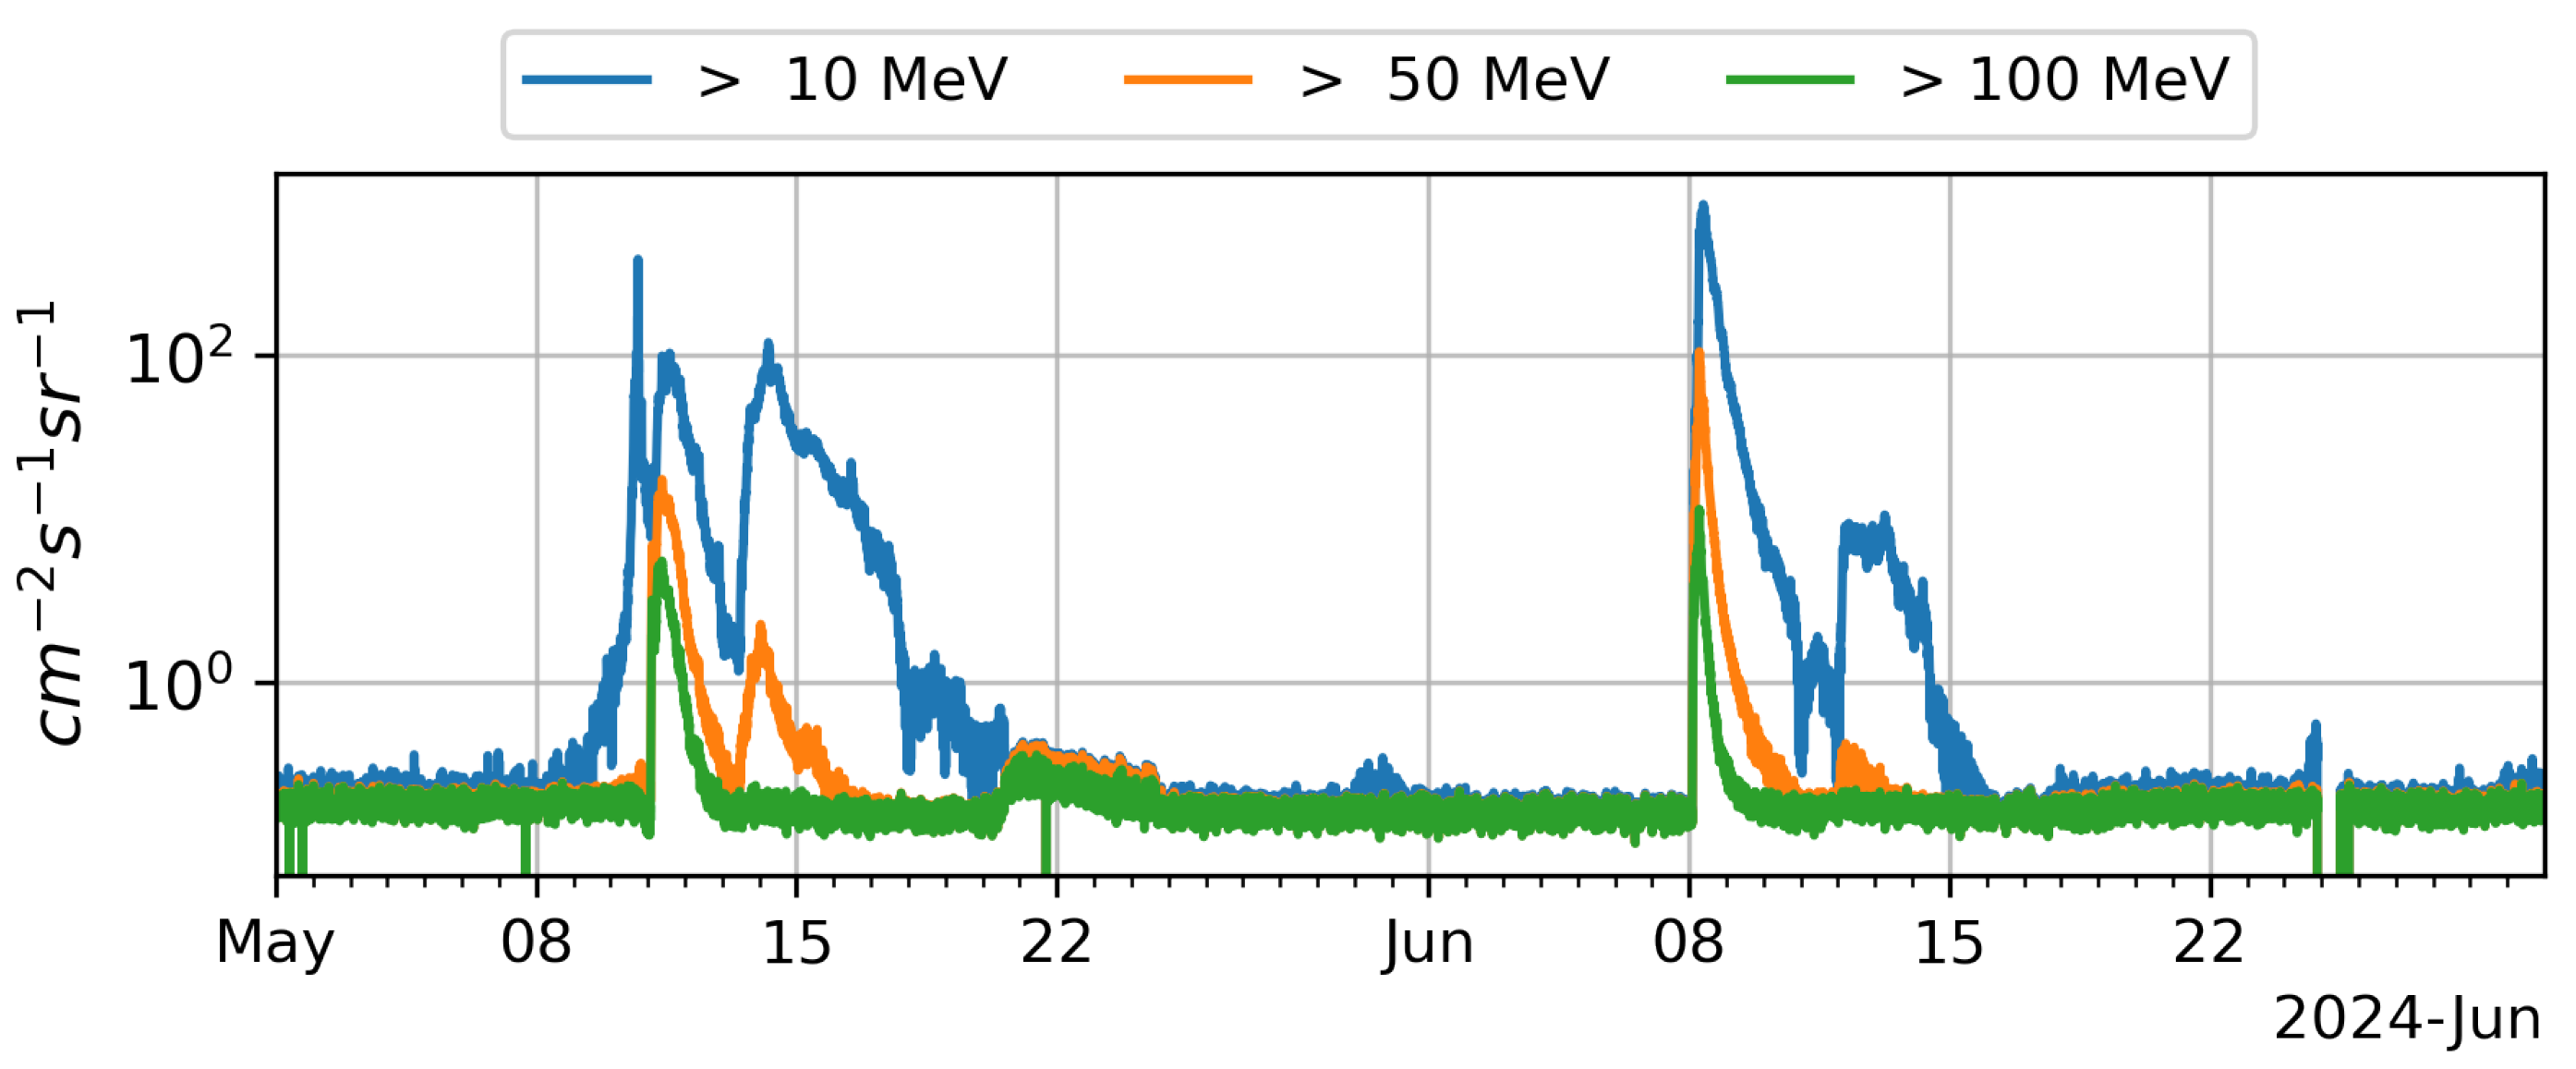
The Geostationary Operational Environmental Satellites (GOES), operated by NOAA, also provide observations of solar proton fluxes at the geostationary orbit [10]. Energetic protons detected by GOES during the event are illustrated on Figure 2. The solar event is associated to the arrival of solar energetic protons: the flux > 10 MeV (in blue) starts increasing on May 8 at 08h00 and reaches on 10 May at 11h00 the threshold of 10 cm 2 s 1 sr 1 , generally used to qualify an eruption as a solar energetic particle (SEP) event. Peak flux for >10 MeV protons is first reached on 10 May at 17h00 (corresponding to the Dst storm), quickly followed by a peak on 11 May at 09h00, visible also for higher energy protons, even for E > 100 MeV for instance (in green).
On 13 May, a second peak of the >10 MeV flux appears above the threshold. An increase is then also visible for >50 MeV, but not for >100 MeV.
Note that after a full solar rotation of 27 days, the sunspot still present at the Sun’s surface was responsible of a new solar energetic particle event appearing on 8 June 2024 together for all energies. Since the protons originate from the same active region, the variation of the proton flux in time is very similar to that of 11 May, with a second peak a few days later for 10 and 50 MeV. It is worth mentioning that the first maximum fluxes reached at all energies are higher during the later event. Nevertheless, this second SEP event did not create a geomagnetic storm, which is not so unusual since only 75% of SEP events are followed by Dst storms < −50 nT [11].

3.2. Proton Injections Observed at LEO

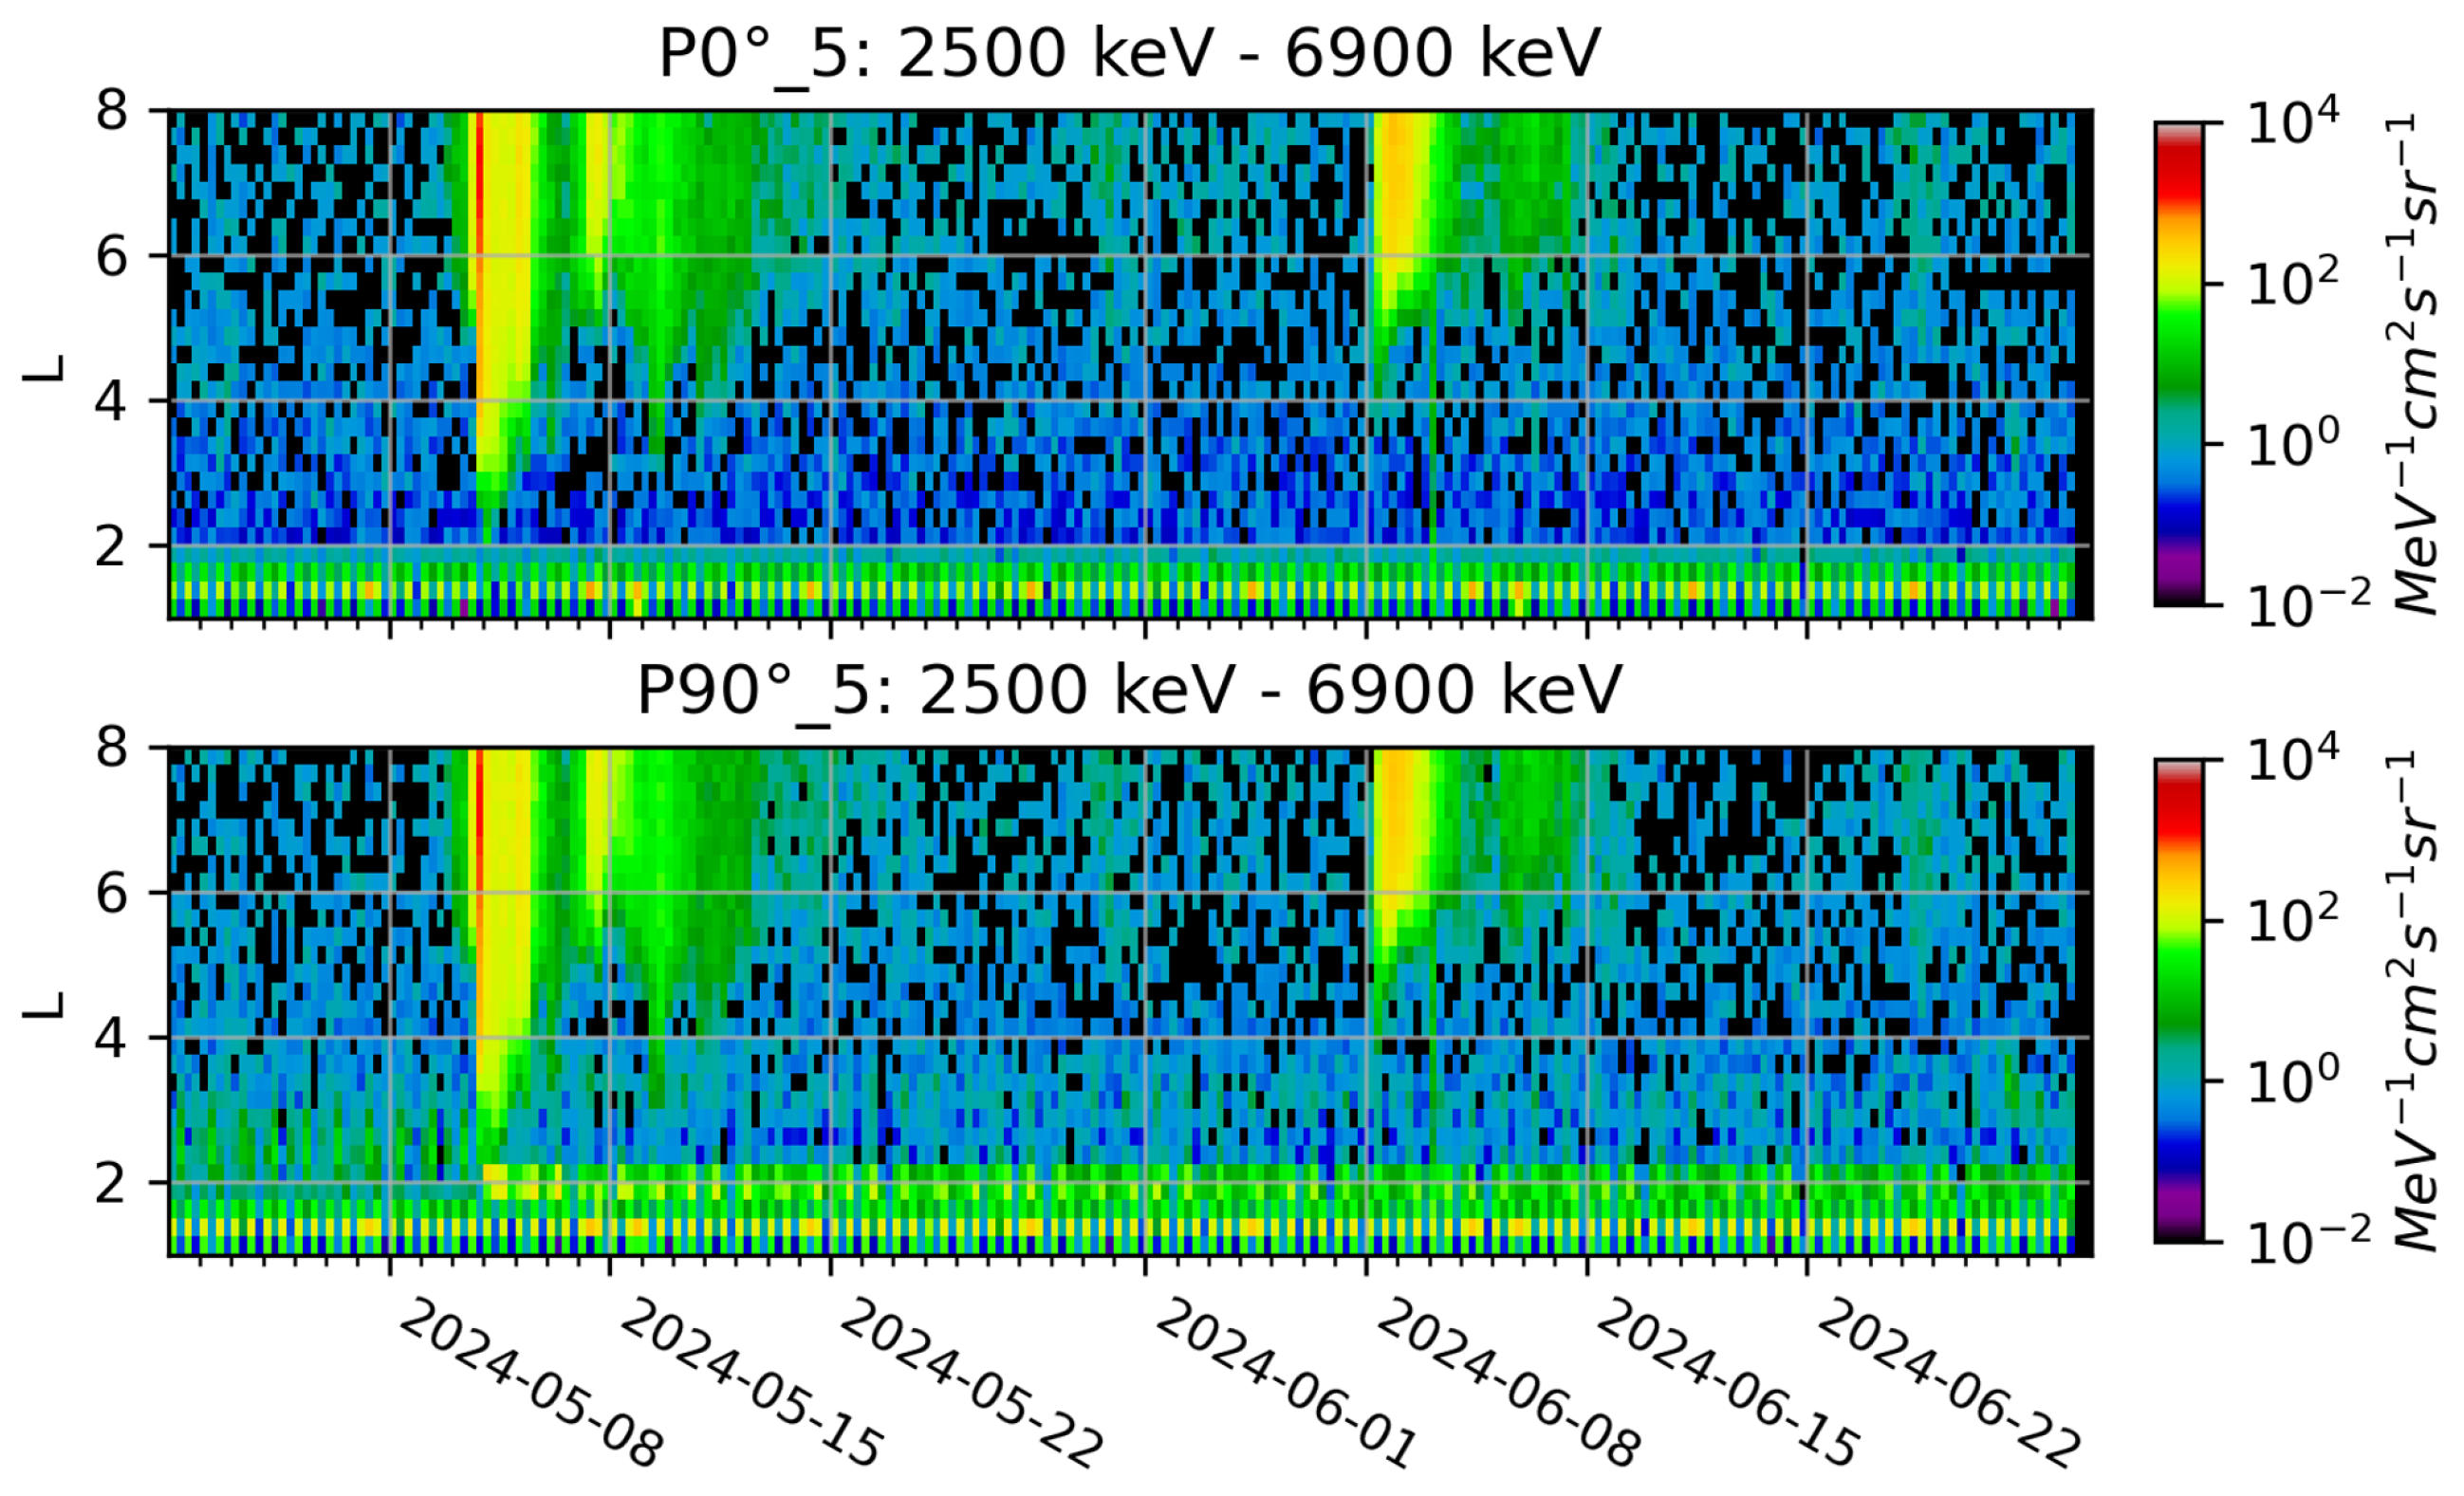
Energetic protons detected by PROBA-V/EPT and MetOp/MEPED on a low polar orbit are illustrated in Figure 3 and Figure 4. Because those two instruments are located on a low Earth orbit, they are able to measure the flux of protons across the entire range of the radiation belts, i.e., at different values of the McIlwain [12] parameter L, as opposed to GOES which perform measurements at a fixed location in the outer belt (L∼6.6).
In Figure 3, the first 5 proton energy channels of EPT are displayed, with increasing energy from the top panel to the bottom one. Proton fluxes are averaged in L and time bins (L bins: 0.25, time bins: 6 h). Similar to Figure 3, Figure 4 presents the differential proton fluxes measured by the 0° and 90° telescopes of MEPED in their highest energy channel (2.5–6.9 MeV). MEPED fluxes have been averaged in the same bins in time and L as for the EPT.
It is important to note that even though EPT and MEPED are both observing particle fluxes at a similar altitude, their observations cannot be directly compared to one another, at least quantitatively. There are two main reasons for this:
1.
The energy ranges of the measured protons are not the same for the first channel of the EPT and the fifth channel of MEPED. It is thus expected that the flux of protons observed by MEPED is higher than those observed by the EPT, since it measures fluxes at lower energy.
2.
The pitch angles of the observed particles differ between the instruments. Indeed, the MEPED 90° telescope can be considered to measure fluxes of trapped particles and the 0° telescope observes the precipitating particles (at least at high latitudes and thus high L values), while EPT measures particle fluxes with a pitch angles between 60° and −60°. Thus, the EPT measures a combination of trapped and precipitating particles.
At high L values, especially around L = 6.6, the variations of the proton flux at various energies in time are very consistent with the observations from GOES. Observations from EPT, providing the dependence in energy of the flux, confirm that lower energy protons (∼10 MeV) are injected first at high L, rapidly followed by the higher energy protons. EPT actually shows that there are already no more double peaked injection for protons with energies > 61 MeV, as confirmed by the >100 MeV measured by GOES integral channels.
At lower energies (∼2 MeV), MEPED observations are similar to those of EPT in the first channel. Nonetheless, the different energy ranges of EPT show the different behaviours depending on the energy. The first peak flux of lower energy protons is much larger than above 10 MeV. Moreover, the increased proton fluxes remain longer (1 more day) than at higher energies.
During the event of 11 May, protons were injected deep into the radiation belt. Proton flux sharply rose, reaching L∼2.5 in all energy channels displayed in Figure 3, and flux increases were also observed up to channel 8 (182–205 MeV).
For protons between 9.5 MeV and 13 MeV, observations of EPT show that protons were injected in the inner belt. This is the first time since the launch of EPT that direct injection of proton in the proton trapped belt is observed [11]. In channel 1 of EPT, the injection of protons in the inner belt appears between L = 1.9 and 2.1 and these protons form an additional inner belt remaining trapped during more than one month, with a flux slightly decreasing with time. This is also confirmed by the observations from the MEPED 90° telescope. Indeed, channel 5 of MEPED (shown in Figure 4) was proven to be free of electron contamination in [13] by simulations with GEANT-4. Even though they cannot be directly compared to one another, the first EPT channel and the fifth MEPED channel are complementary, and clearly show that low energy protons (i.e., 2.5 MeV to 13 MeV) were injected in the inner belt.
In channels 2 to 4, starting on 13 May, protons are also observed at higher L (between L = 2.5 and L = 4), forming an additional temporary belt which remains only for several days. Those observations may actually come from contamination of these proton channels by electrons. Indeed, those additional belts are appearing at the same time and at the same L shells as the electron fluxes appear after the strong geomagnetic storm associated with this event.

3.3. Effects in the South Atlantic Anomaly

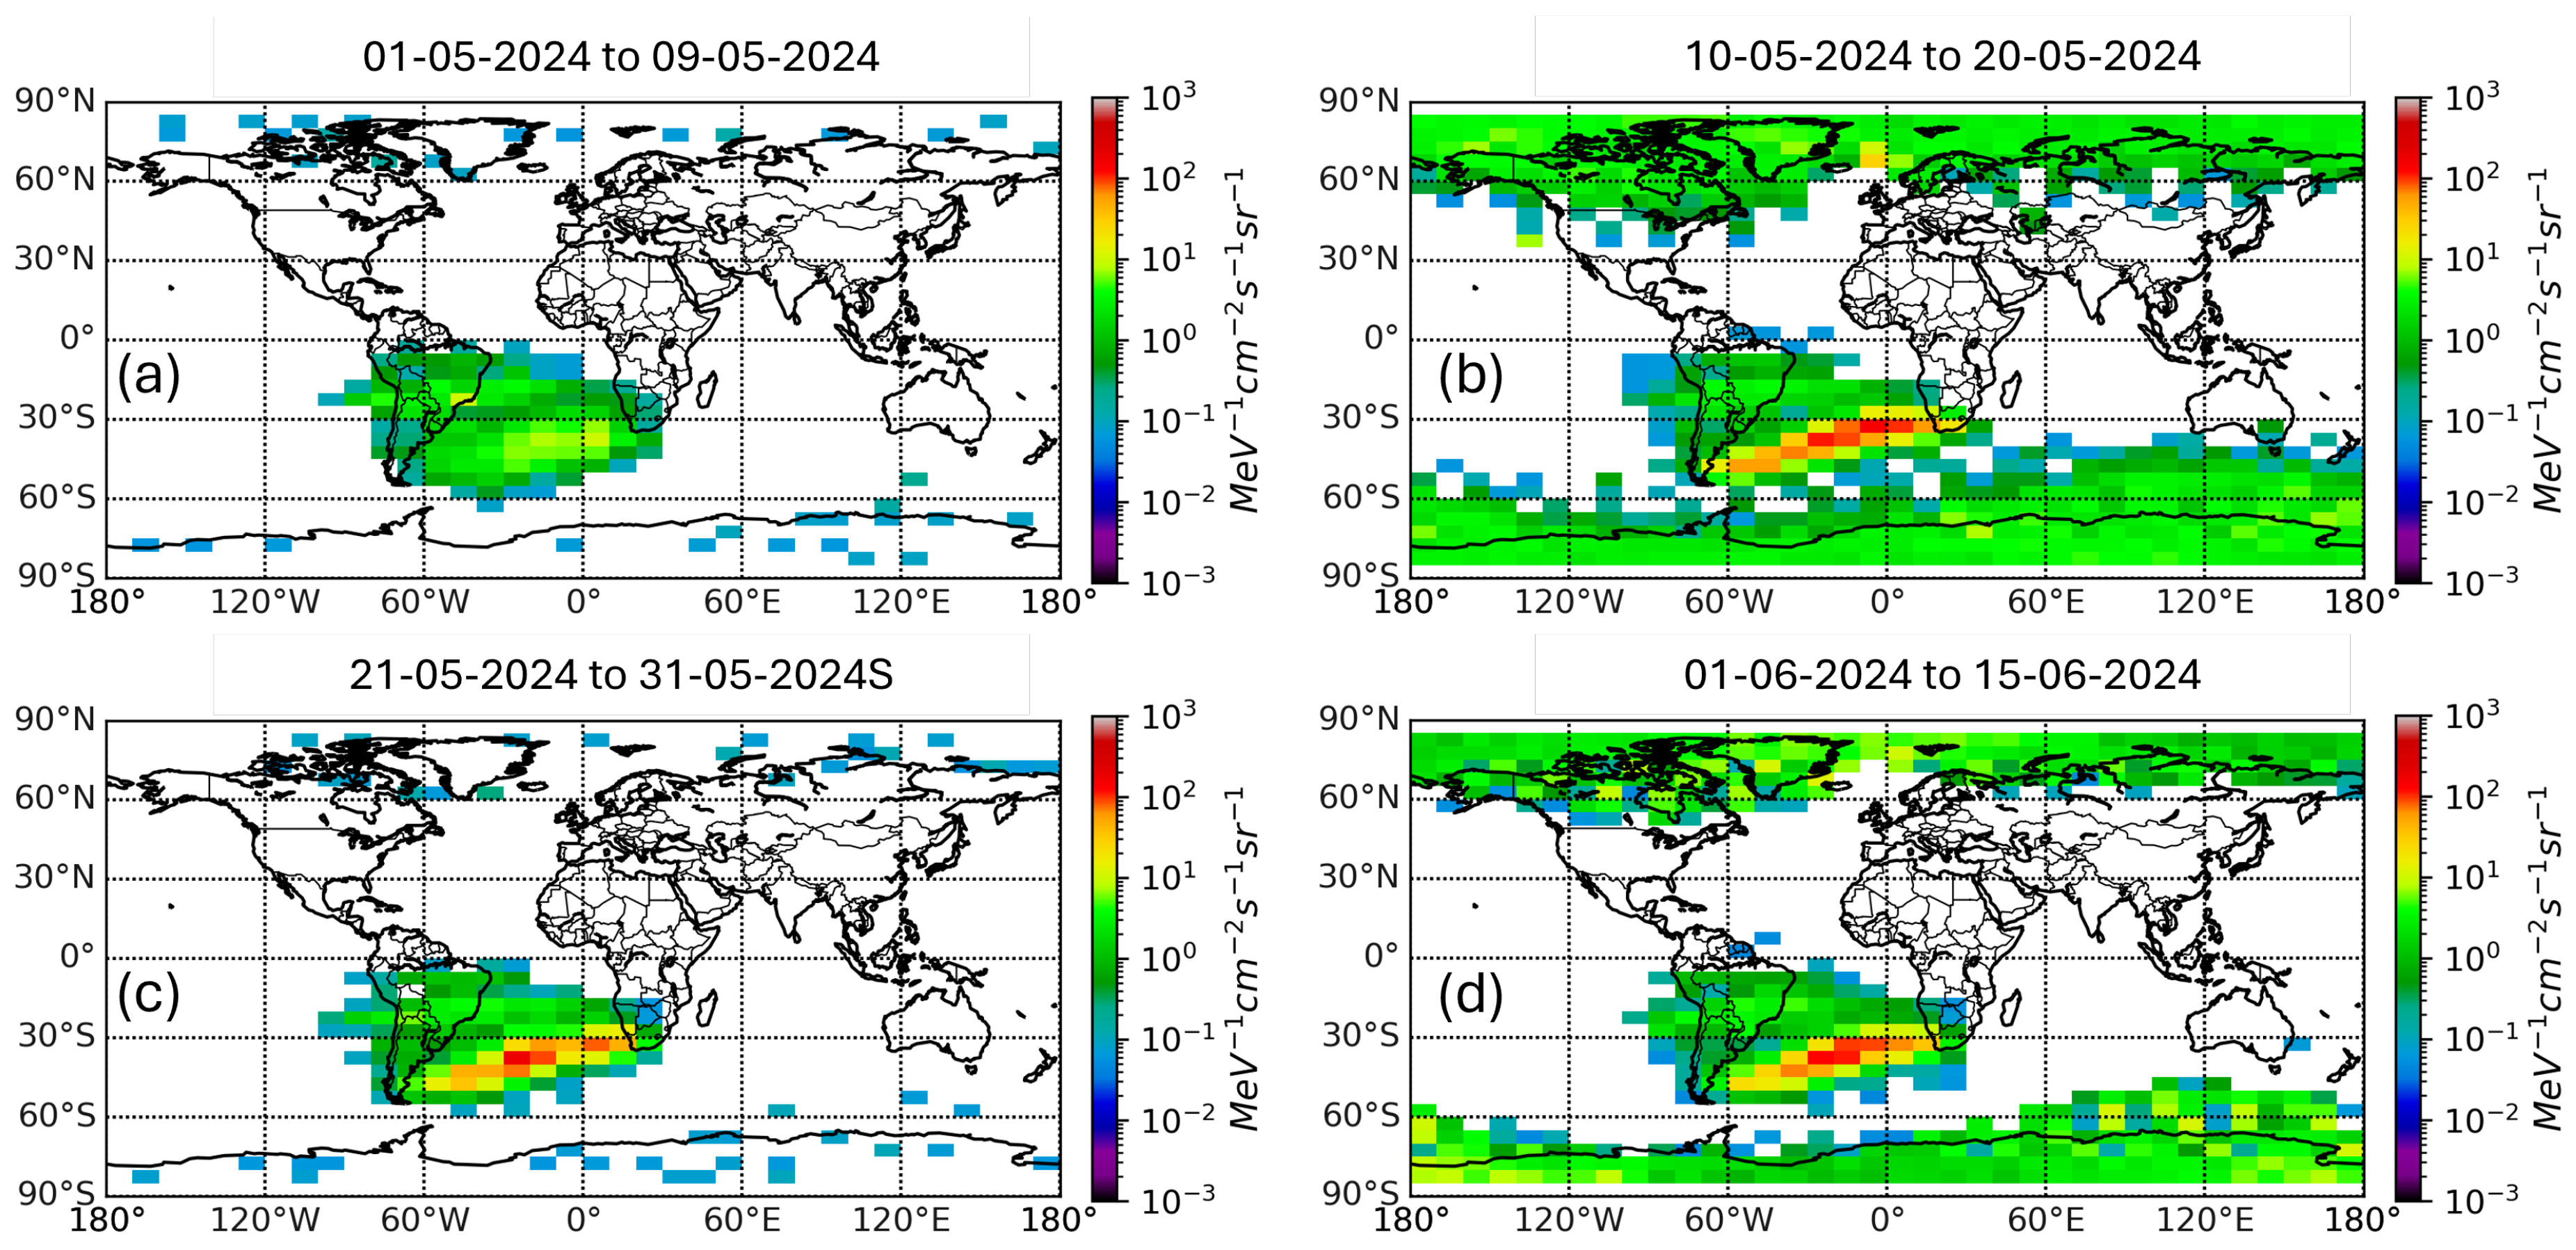
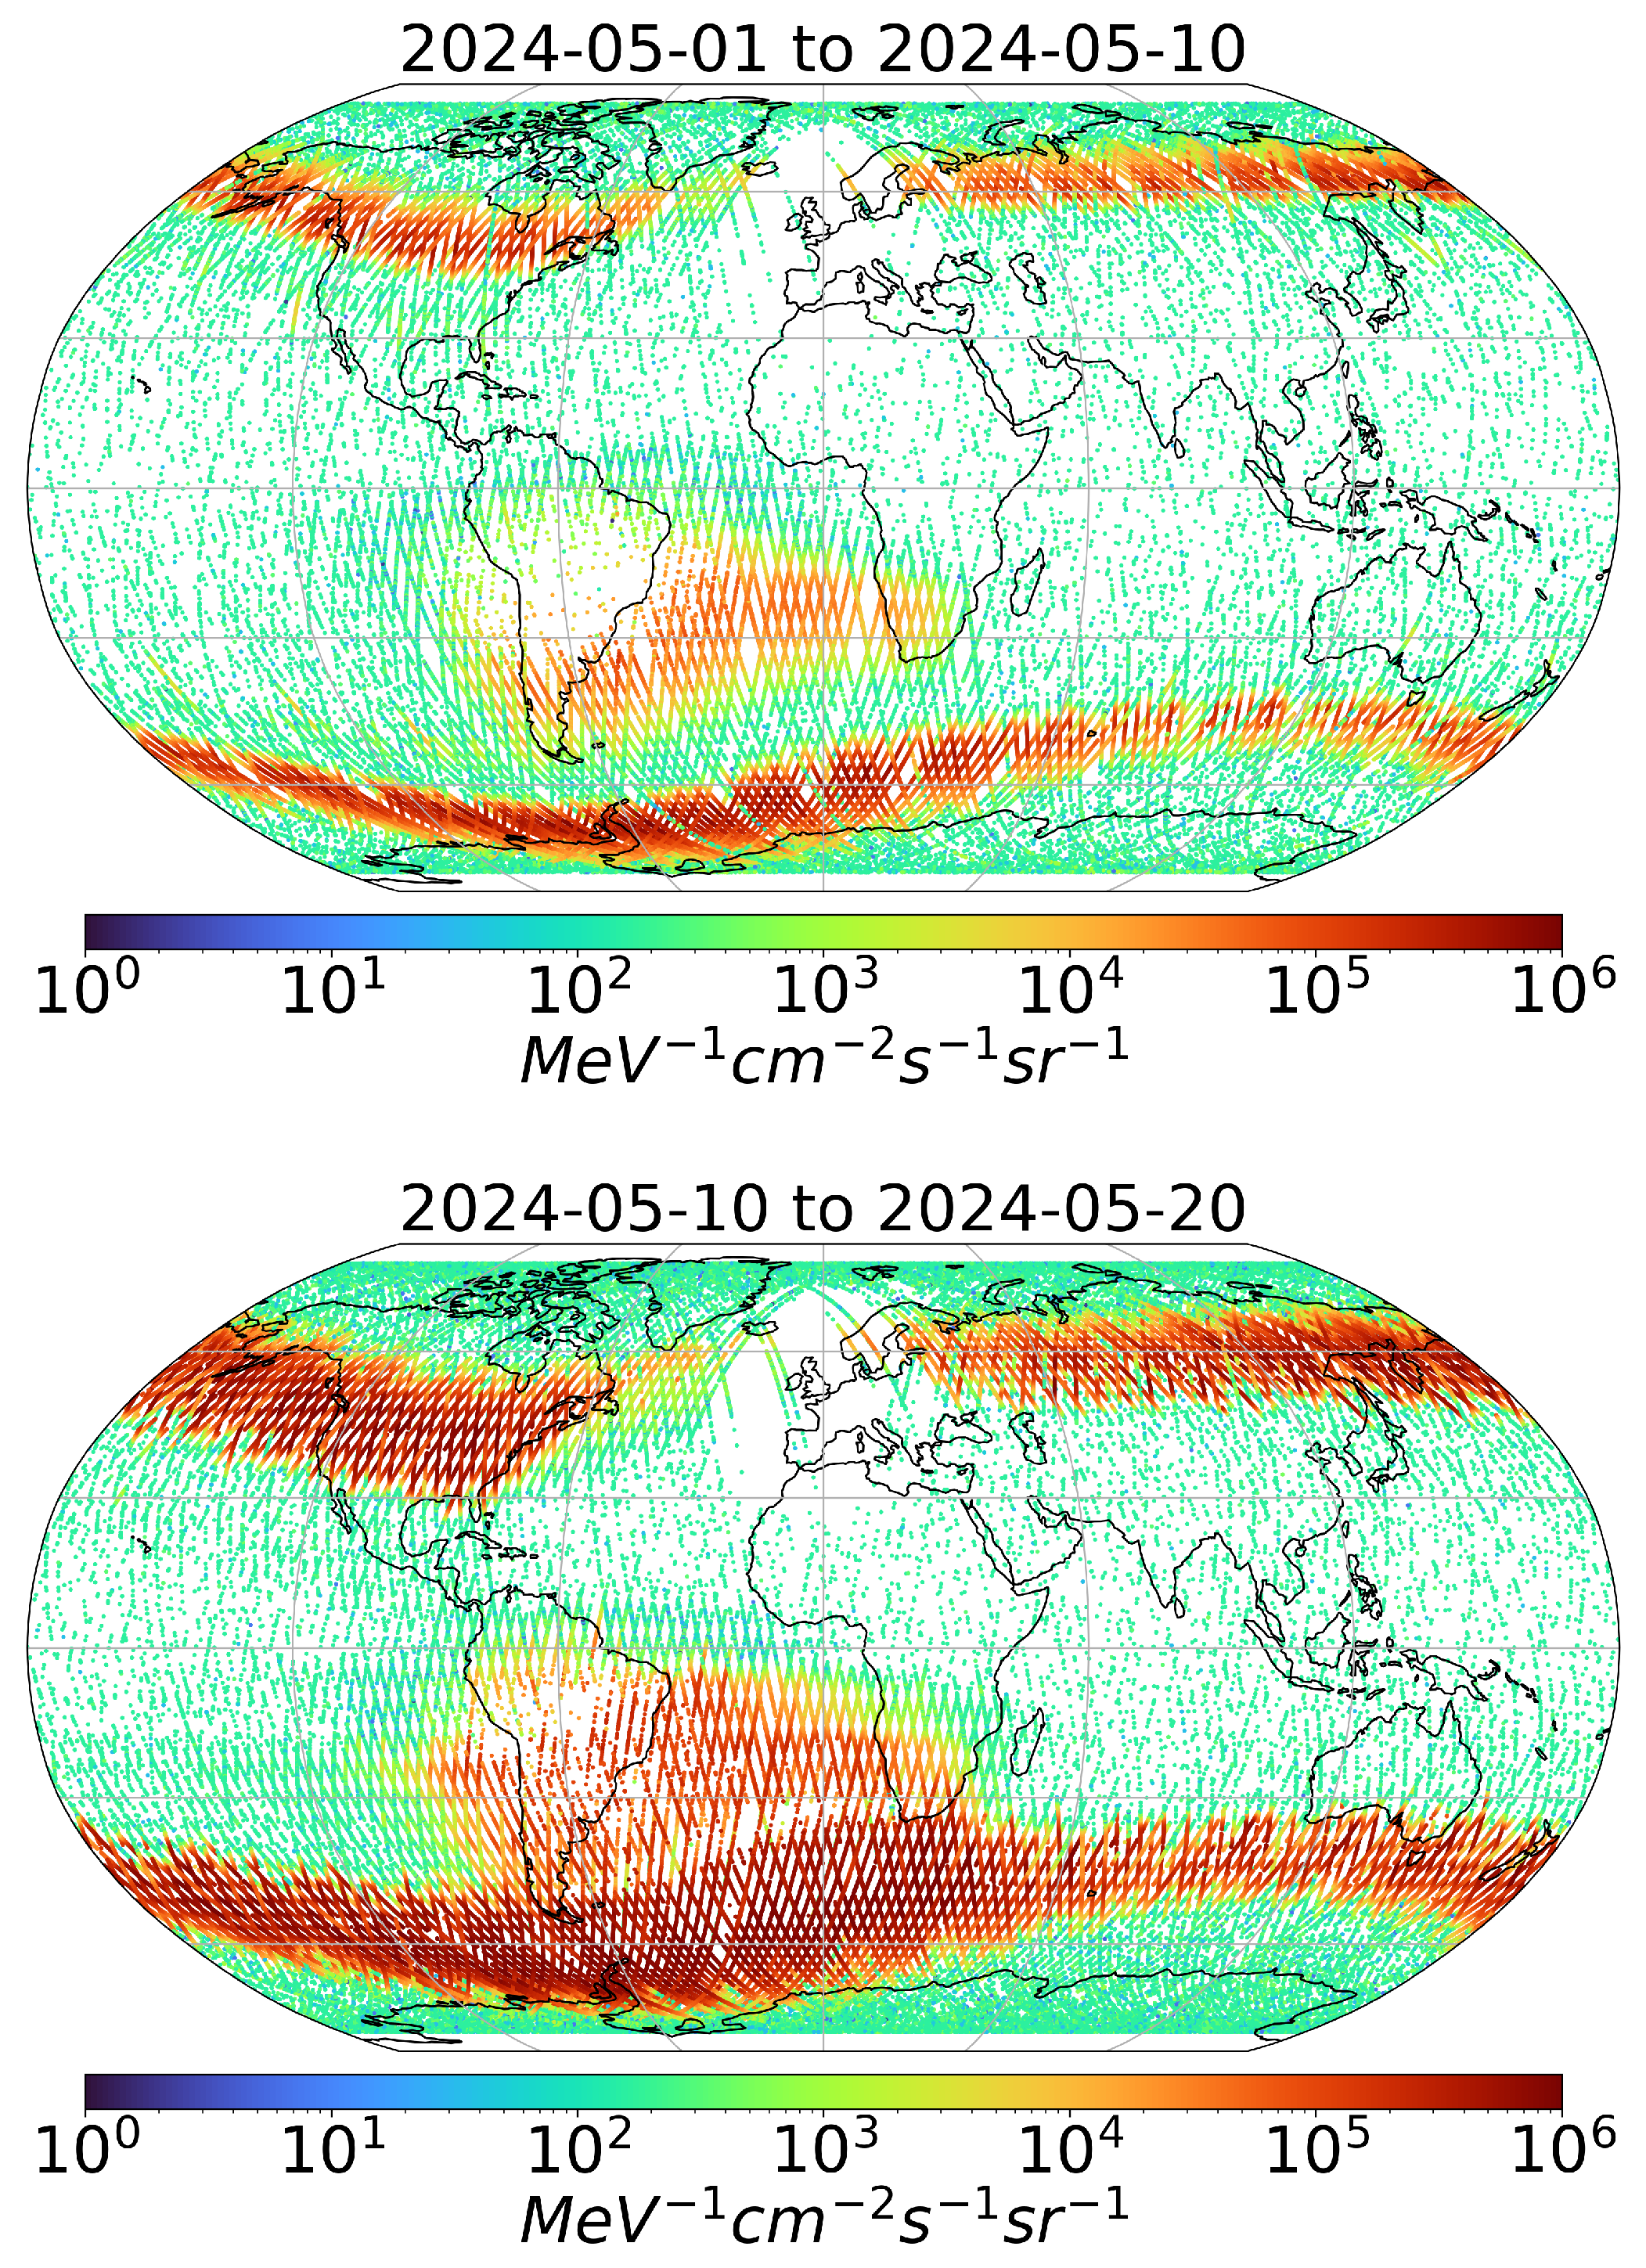
Figure 5 shows the map of 9.5–13 MeV protons observed by the EPT first channel at different characteristic phases of the event described above. At high latitudes (corresponding also to high L), fluxes are observed only in panels (b,d) corresponding to the periods of proton injections in May and June.
Figure 5 also clearly illustrates the South Atlantic Anomaly (SAA), area where the fluxes are always very high above South America and South Atlantic. The SAA is a region where inner radiation belt particles can mirror at lower altitudes, increasing the local particle flux. This is due to the fact that the Earth’s magnetic field is particularly low in the SAA, caused by the tilt of approximately 11° of the Earth’s magnetic axis with respect to the Earth’s rotation axis and the location of the magnetic idealized dipole some 400 km away from the Earth’s center.
EPT observations indicate that protons at this energy are injected in the SAA corresponding to the inner radiation belt at low altitudes. One can see that it is only the southernmost part of the SAA that is filled after this event in the channel 9.5–13 MeV. Such injections were never directly observed by EPT in the past, even if they could explain the different characteristics observed between the south and north part of the SAA noted in [11,14]. This allows us to exclude the effects of electron contamination in this energy range, since the regions filled by the electrons are located at different L values (see Section 4).

3.4. Neutron Monitors Observations

Two main processes responsible for the presence of trapped protons at low L values have been identified: the Cosmic Ray Albedo Neutron Decay (CRAND) and the radial diffusion of injected solar protons [15,16]. While CRAND mainly contributes to the protons flux peaking at L∼1.5 for higher energy, inward diffusion of injected solar protons is the principal source of the main proton belt at lower energies [17]. In this later work, focusing on proton observation between 1998 and 2006, solar proton trapping were shown to mainly take place at L = 2.3, whereas during the event of 11 May 2024, solar protons were directly injected in the secondary protons belt at L = 2, corresponding to the southernmost part of the SAA.
In case of solar energetic particle event like on 11 May and 8 June 2024, protons with enough energy and rigidity can reach the upper atmosphere and interact with neutral atoms to produce neutrons. Earth-bound energetic neutrons are measured by ground neutron monitors (NM). Backscattered neutrons entering the magnetosphere are a possible source of geomagnetic trapped protons and electrons through Beta-decay (Solar Neutron Decay), it is therefore interesting to analyze observations of NM as well.
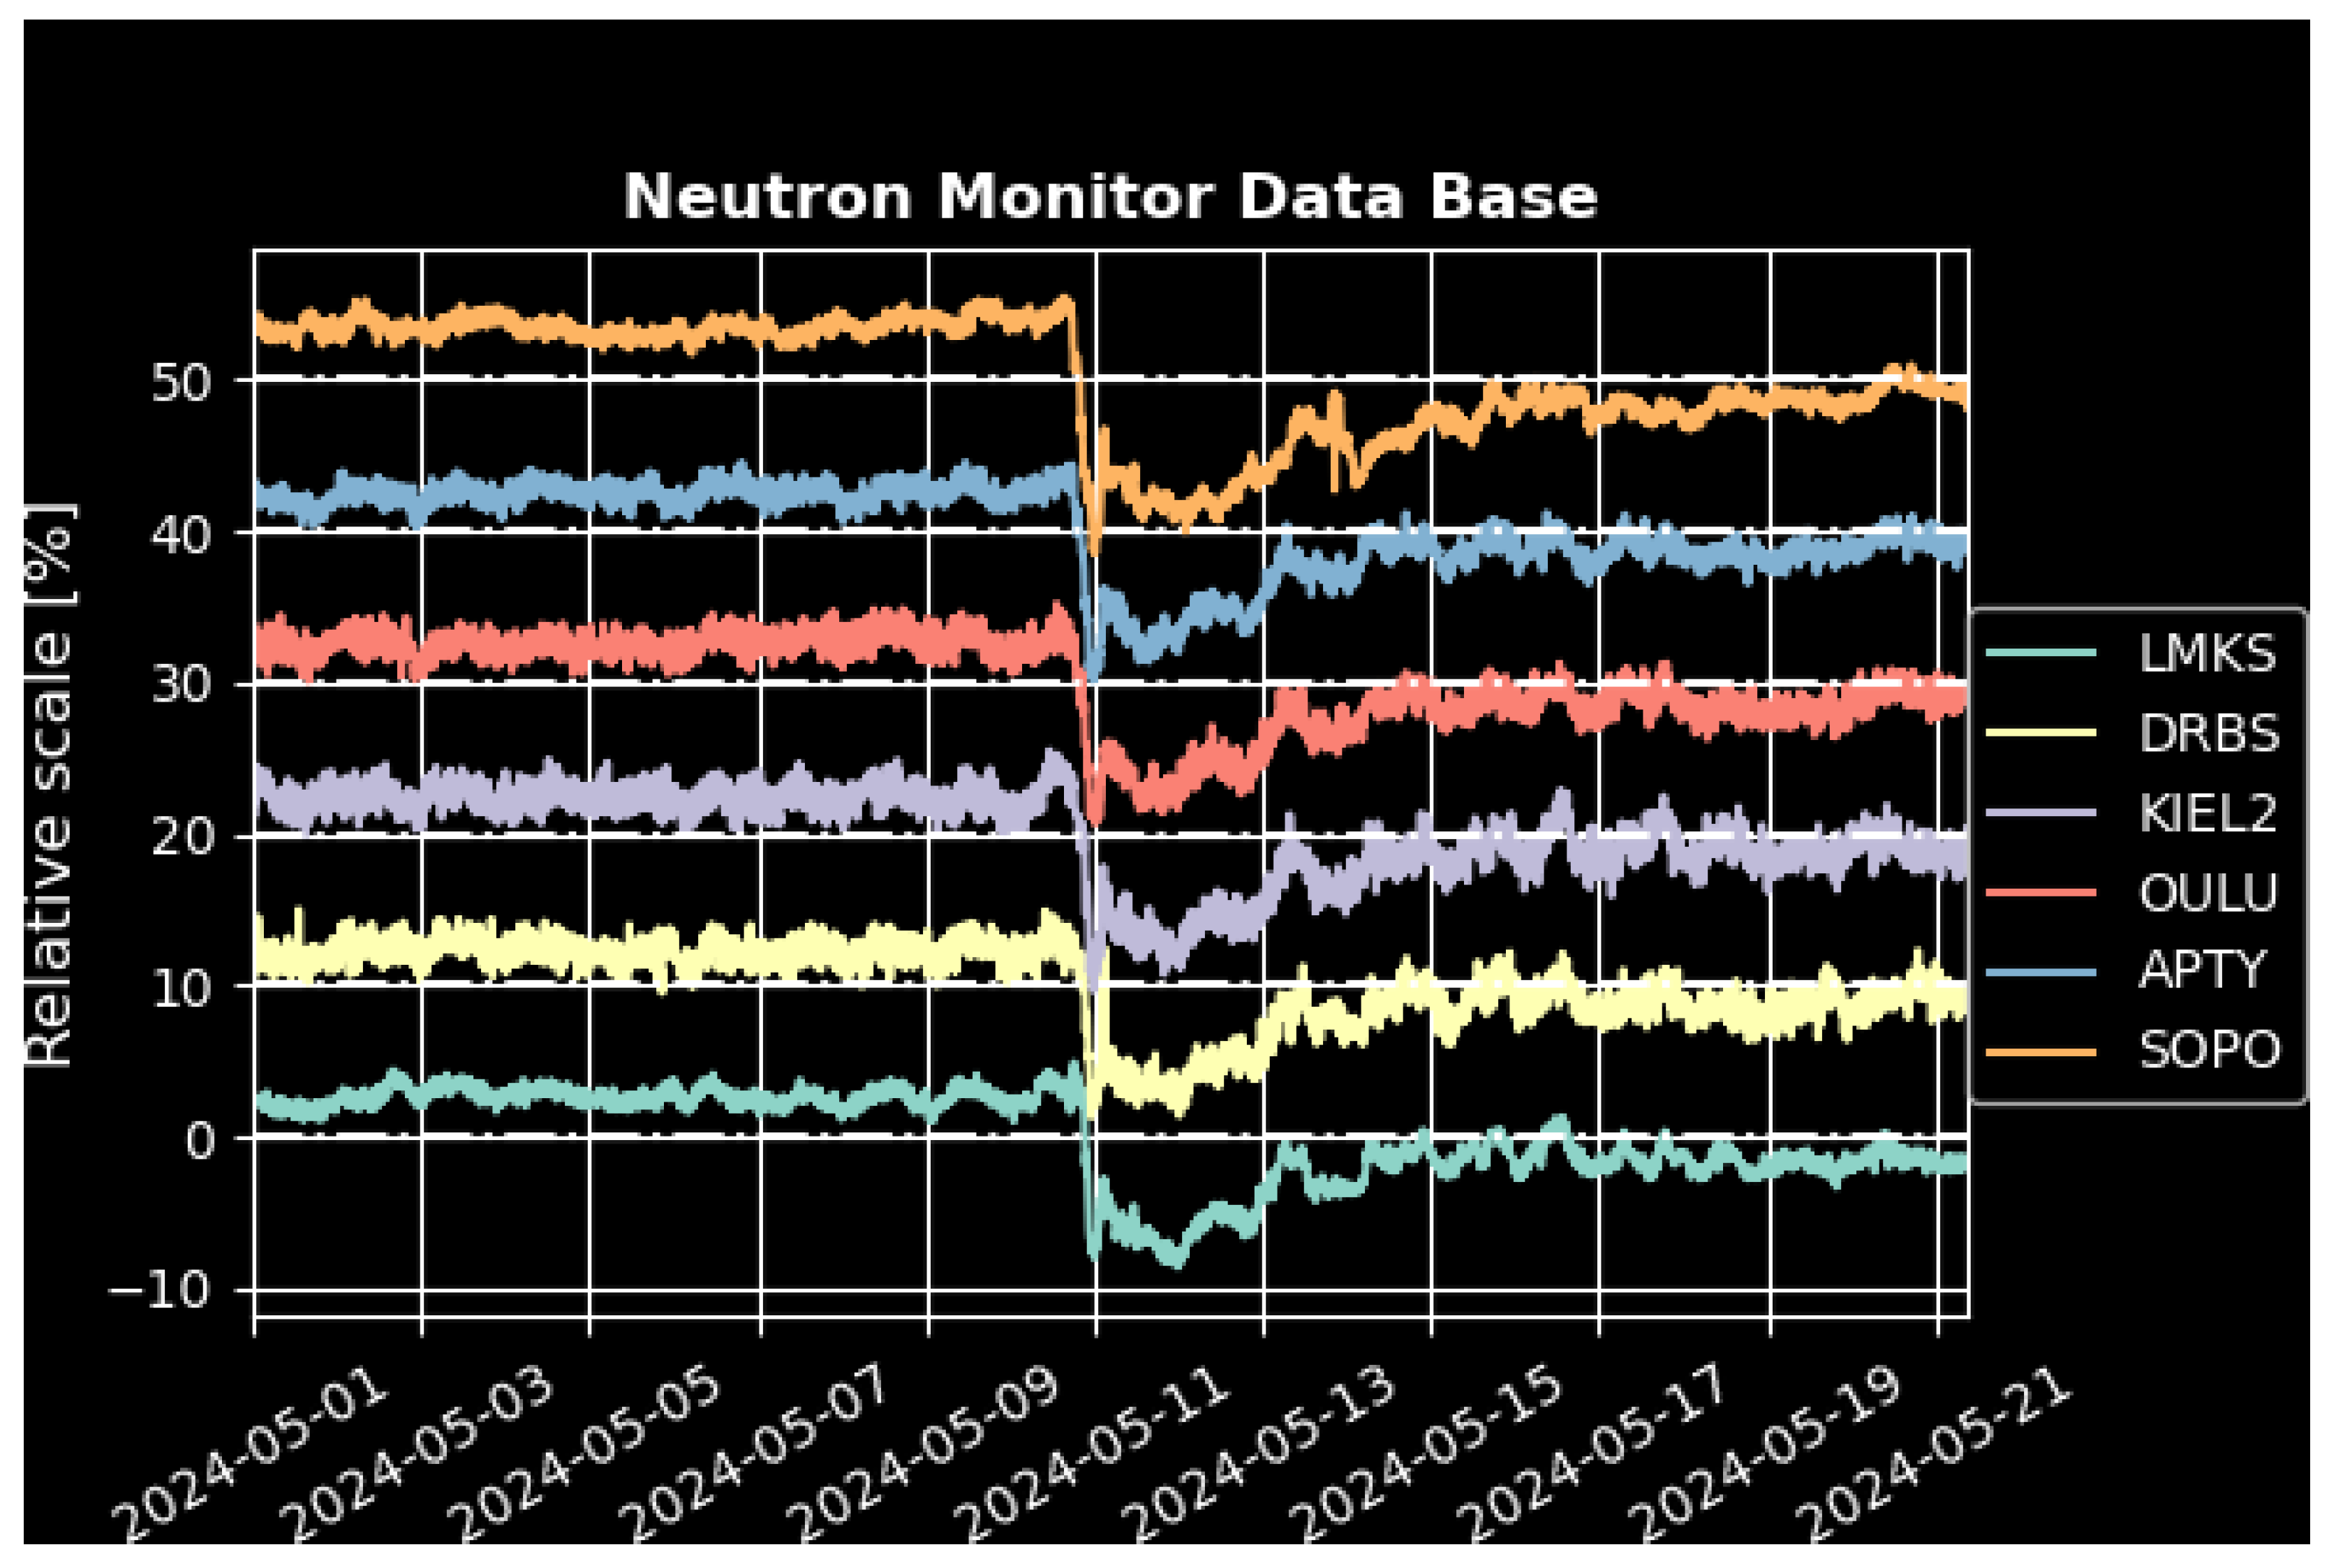
The event of 11 May has been measured by many NM, even at latitudes as low as 49°, as illustrated in Figure 6. The characteristics of the stations where the neutron monitors have measured are summarized in Table 1.
Neutron monitors show a clear disturbance during the geomagnetic storm. Figure 6 shows a drop of neutrons, called a “Forbush decrease” that started in the evening of 10 May. It is the result of the arrival of the energetic particles of the CME at the Earth. During the storm, more solar particles were injected in the atmosphere, but less Galactic cosmic rays, because the solar particles create a stronger magnetic shield against the cosmic ray particles originating from outside our solar system. That is why the number of detected neutrons decreases during the storm. It is quite unusual that this effect is observed even at low latitudes (such as in the Dourbes station in Belgium).
The small bump in the neutron count, which happens just after the decrease, right during the geomagnetic storm of 10–11 May, is a Ground Level Enhancement (GLE). It is only the second GLE so far during this solar cycle and number 74 since the measurements started back in the 1940s (Oulu, https://gle.oulu.fi (accessed on 2 September 2024)). It is associated with the arrival of proton fluxes with energy higher than 100 MeV (see Figure 2). This GLE 74 is not particularly strong, but observed due to the Forbush decrease. After the event, the level of neutrons remains lower than before the storm even after one month. Note that nothing special was visible on 8 June 2024 in the neutron monitor measurements at the arrival of the second SEP event.

4. Effects on the Electron Radiation Belts

4.1. Observations of New Electron Belts by EPT

Solar Proton Albedo Neutron Decay (SPAND) can also produce electrons in the slot region during GLEs, but only at L > 2 because the lower energy of SEP’s compared to cosmic rays limits their access to smaller L’s [15]. For lower L, CRAND effect makes a small but continuous contribution to the electrons in the inner belt and slot region.
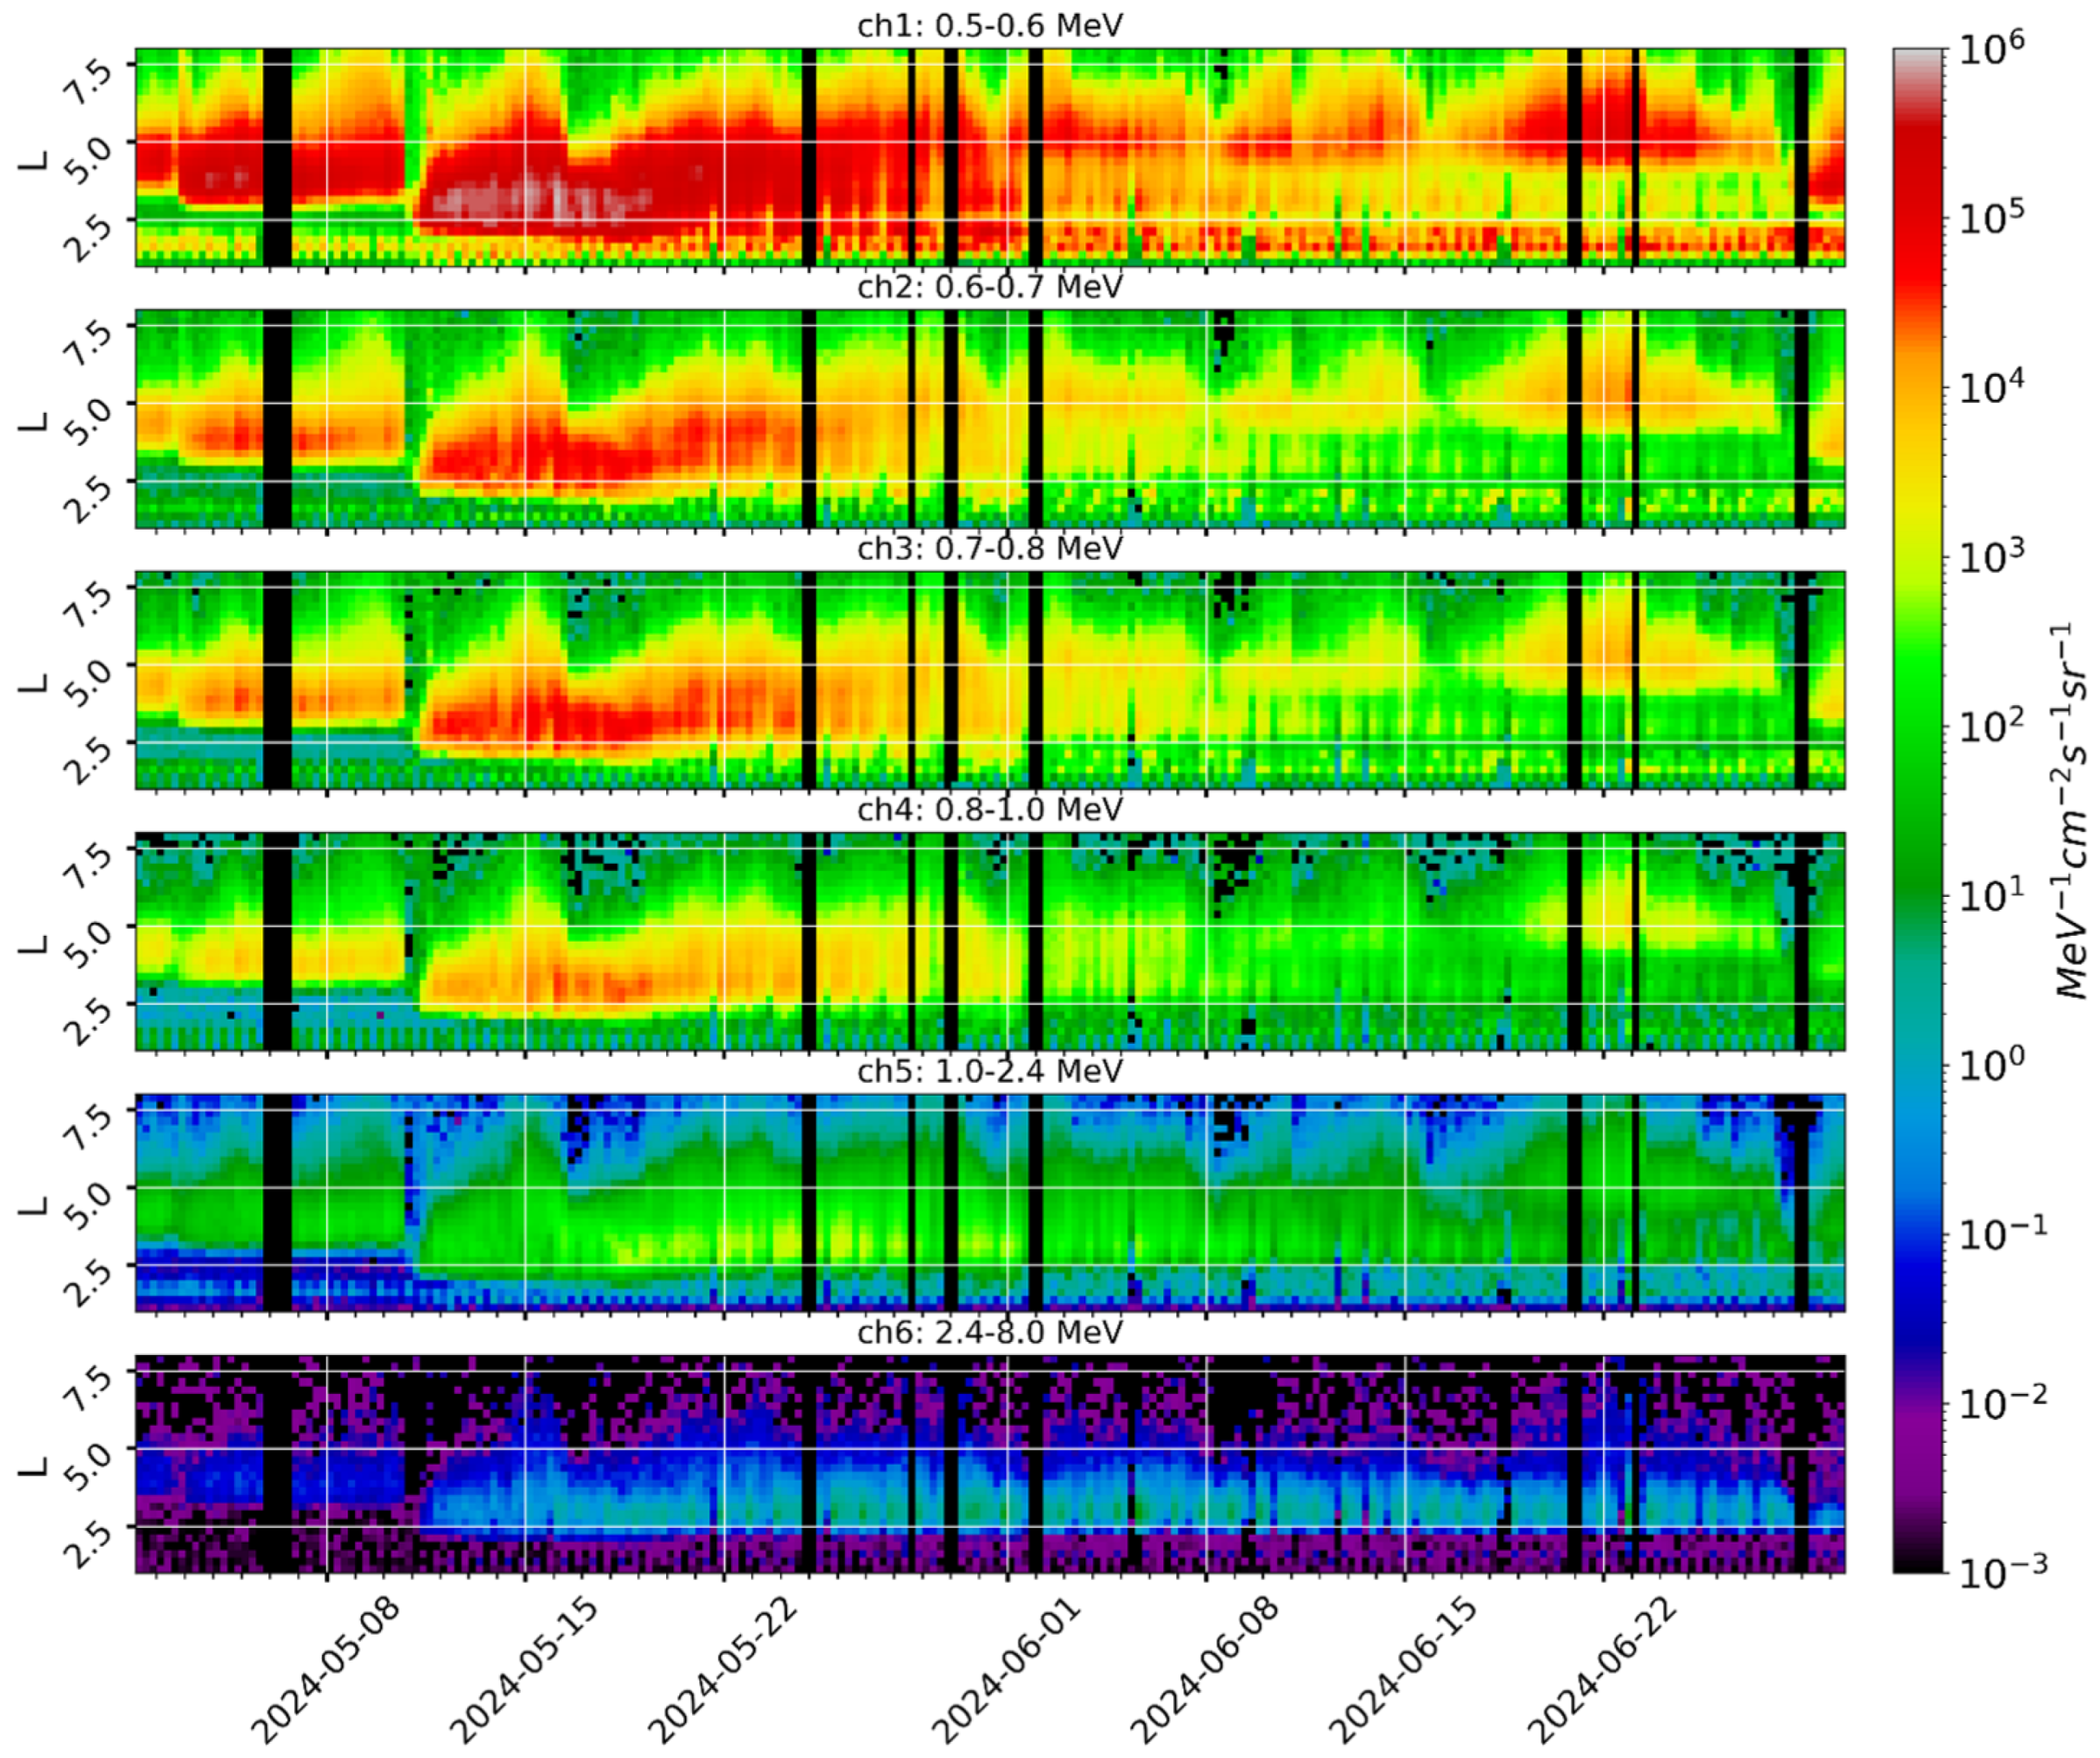
Figure 7 shows the temporal evolution of the EPT electron differential fluxes averaged on 6 h and 0.25 L bins from 1 May to 30 June 2024. Each panel corresponds to an energy channel of the EPT, increasing in energy as panels are located lower on the figure.
Previous studies have shown that geomagnetic storms have a strong impact on the radiation belts, especially the outer electron belt (e.g., [18]). For most storms, the perturbations are relatively short lived and follow the same pattern, as also observed during this superstorm. At low altitudes corresponding to the EPT orbit, the main phase of the storm (i.e., when the Dst decreases) causes a sudden drop in the electron flux at high L values called a dropout event [19]. Droupout events are rapid erosions of the outer edge down to lower L values. The minimum L values reached by the dropout depends on the intensity of the storm, especially the minimum value of the Dst. After Dst has reached its minimum value, electrons are injected in the outer belt at L values lower than the one reached by the dropout. Finally during the recovery phase (i.e., when the Dst increases back to normal levels), the electrons that were injected are slowly lost with lifetimes that depend on L [20] and the slot region between the inner and outer belt is progressively reformed.
In EPT observations as displayed in Figure 7, the extreme geomagnetic storm of 11 May is clearly apparent in all energy channels, even for electrons with an energy between 2.4 MeV to 8.0 MeV, which are generally less influenced by geomagnetic activity than for the lower energy channels. Indeed, as it was already discussed above, the storm of 11 May was much more extreme than most other storms that were observed in the last decades. The dropout was so intense that it led to the complete depletion of electrons in the outer belt. Following the dropout, the geomagnetic storm was so intense that the slot region was completely filled by energetic electrons, even for 2.4 MeV electrons, and they even penetrated the inner belt. Ultimately, the short term effects of the 11 May storm were quite similar to the other geomagnetic storms apart from its intensity.
The major differences between this extreme event and other smaller ones arise during the recovery period of the storm. In the present case, the recovery phase of the Dst lasted until 22 May (see Figure 1). It is worth mentioning that during this recovery period, two smaller geomagnetic storms took place, causing a longer dropout at high L values in the outer belt on 16 May.
There are also major differences in the penetration depth of electrons injected in the inner belt. They still depend on the energy and Dst as shown by [19]. The penetration limits established in that paper from previous storms still correspond quite well when considering the very strong Dst registered in May 2024. The loss of electrons at specific L values after the storm is very specific for this event, leading to several belts. This will be analysed in more detail in the next subsection.
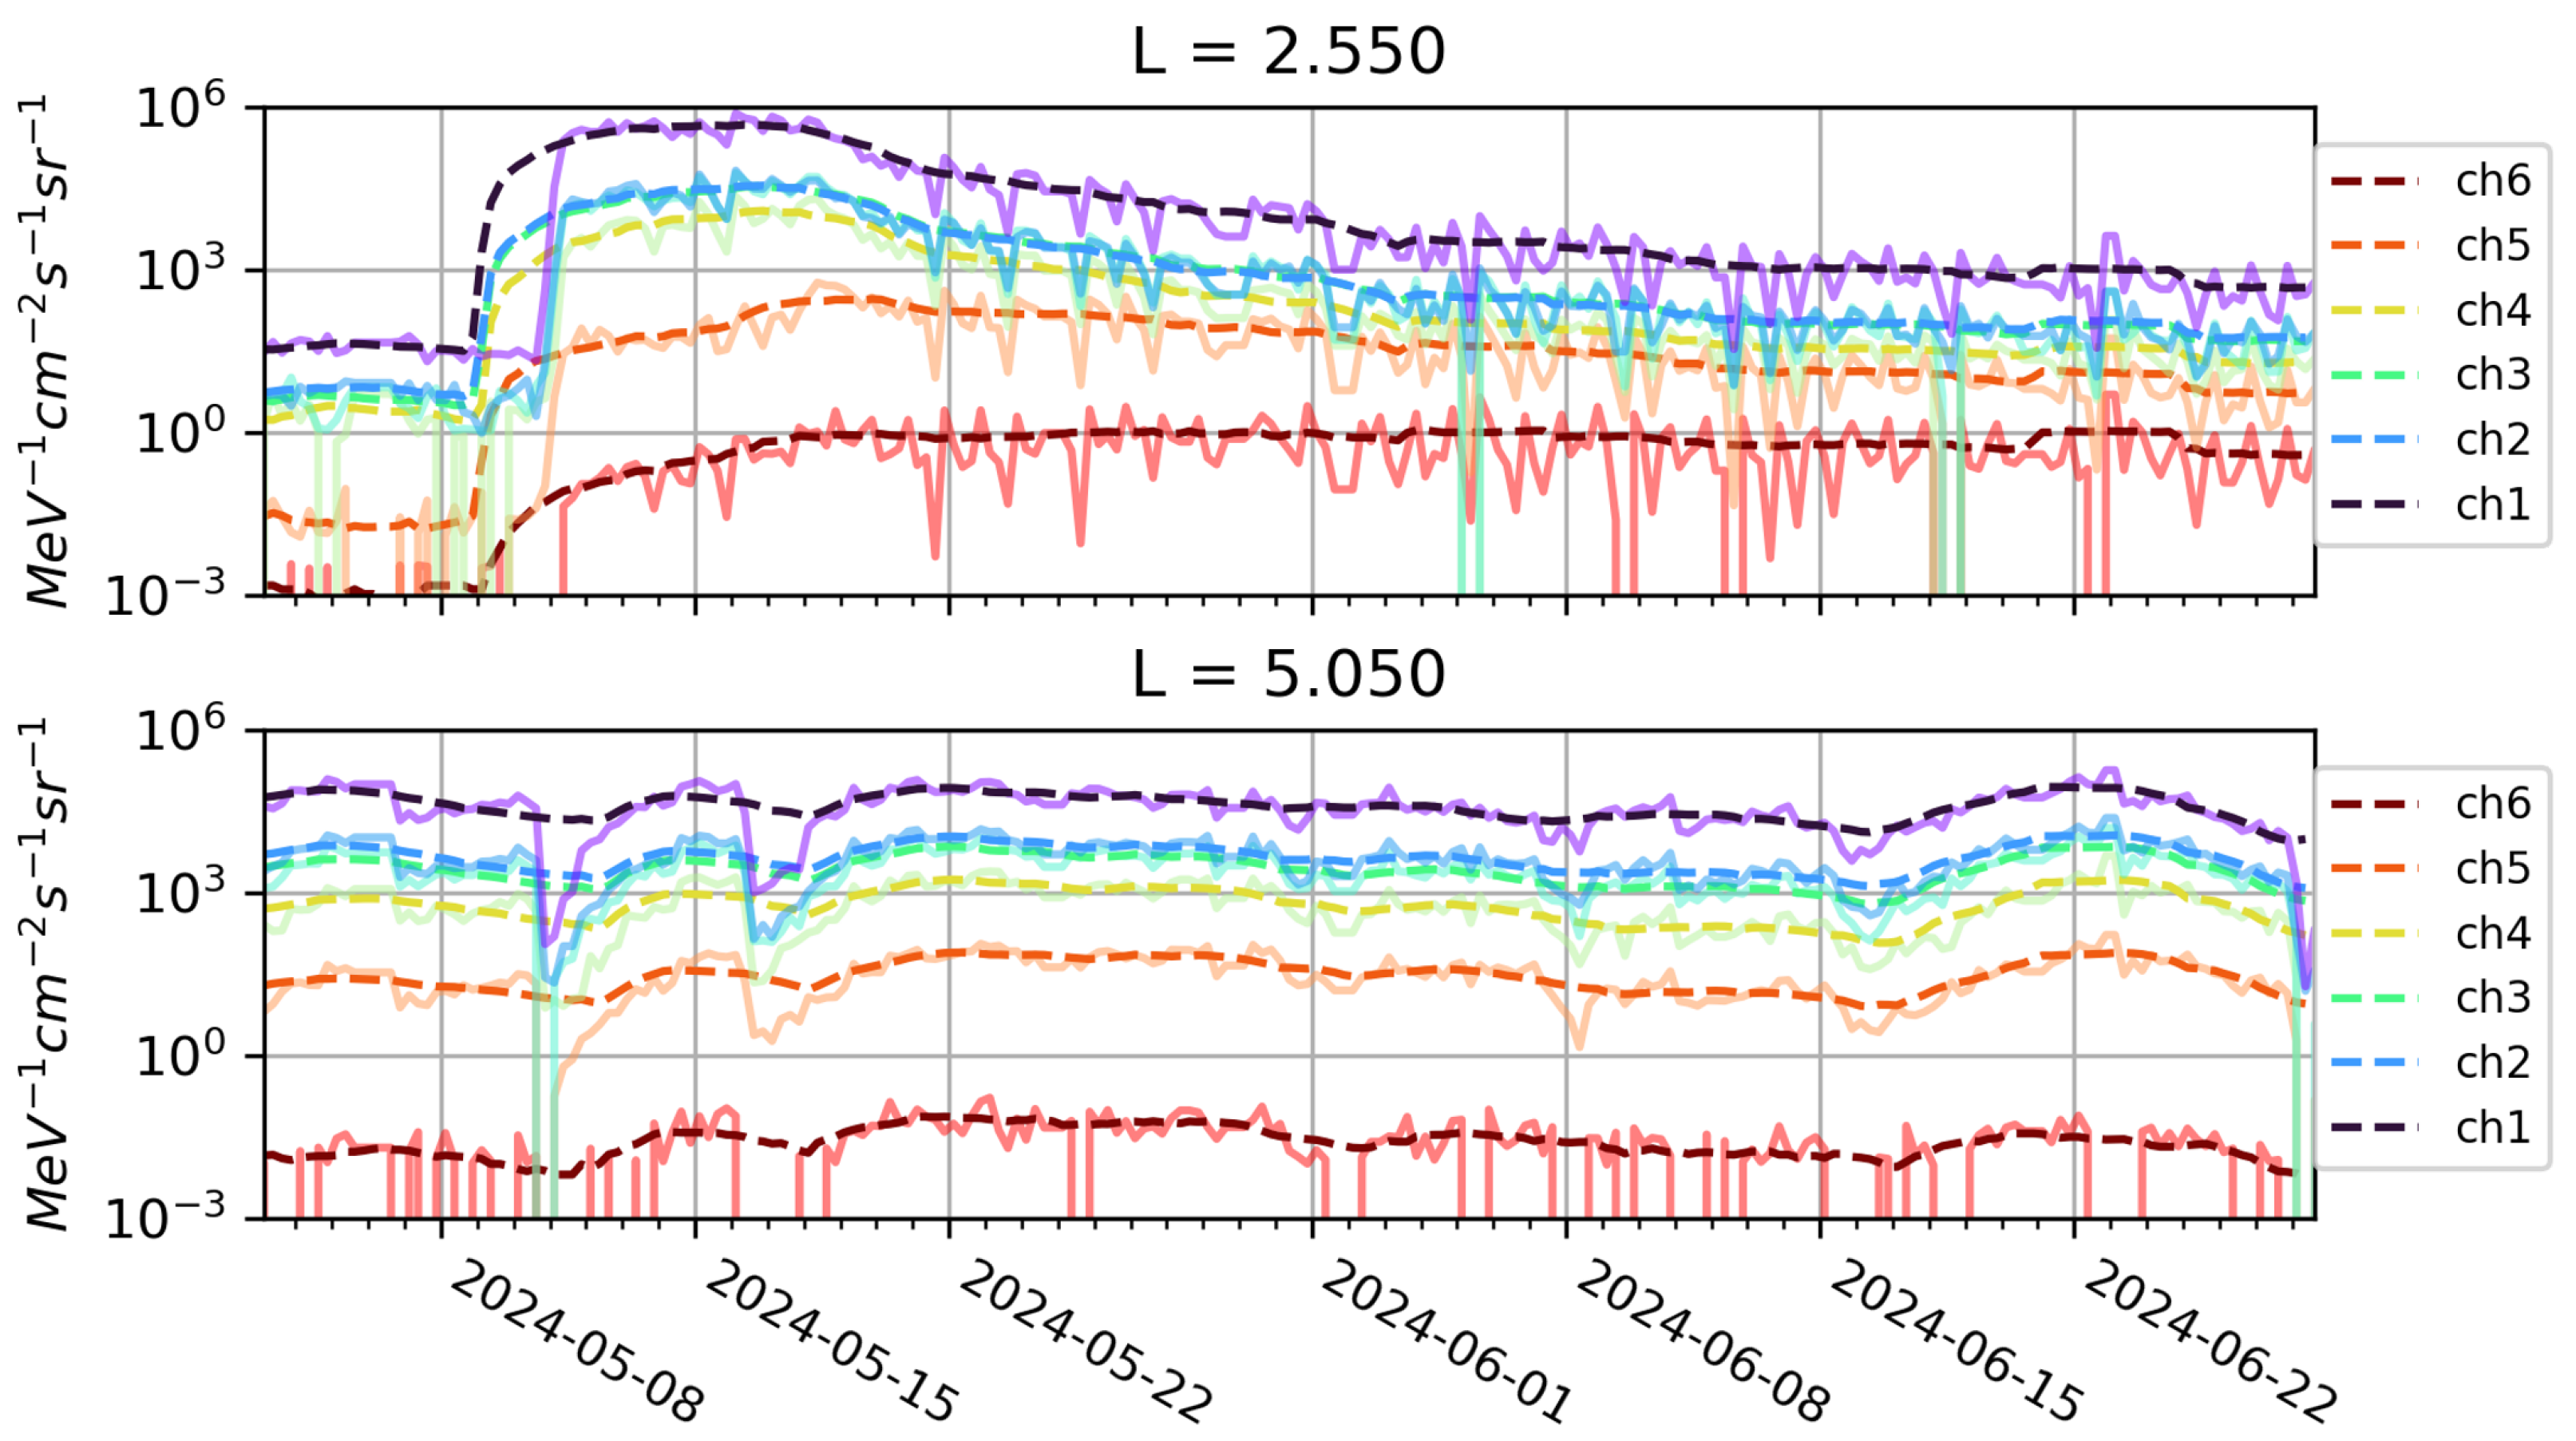
Because the storm of 11 May caused long term perturbations in the radiation belts, electron fluxes of the EPT were smoothed by applying a sliding average with a window of 4 days (i.e., 16 steps of 6 h). The resulting smoothed time series are only capturing the long term variations of the electron fluxes at various L values and in all energy channels of the EPT, which are shown in Figure 8. In the figure, the plain lines correspond to the 6 h averaged flux of electrons (as shown in Figure 7) while the dashed lines are the result of the smoothing procedure. Note that the L values displayed in the figure are actually the middle value of a bin in L with a width of 0.1 instead of the 0.25 shown in the previous figure. As expected from the smoothed time series, at high L values, dropout events (mainly at high L values) are effectively removed (see bottom panel of Figure 8).
At lower L values, where the flux is low before the storm, dropouts do not occur but instead, injections of electrons become more visible. In this case, the smoothed time series are able to capture the rise of the flux because it persists in time. Nonetheless, as can be seen in the top panel of Figure 8, the rise in the smoothed fluxes begins two days before the actual one. This issue is inevitable with the sliding averages, but it can be ignored here since its main objective is to capture the long term changes in the belt, which is well achieved.

4.2. EPT Profiles Showing Several Belts

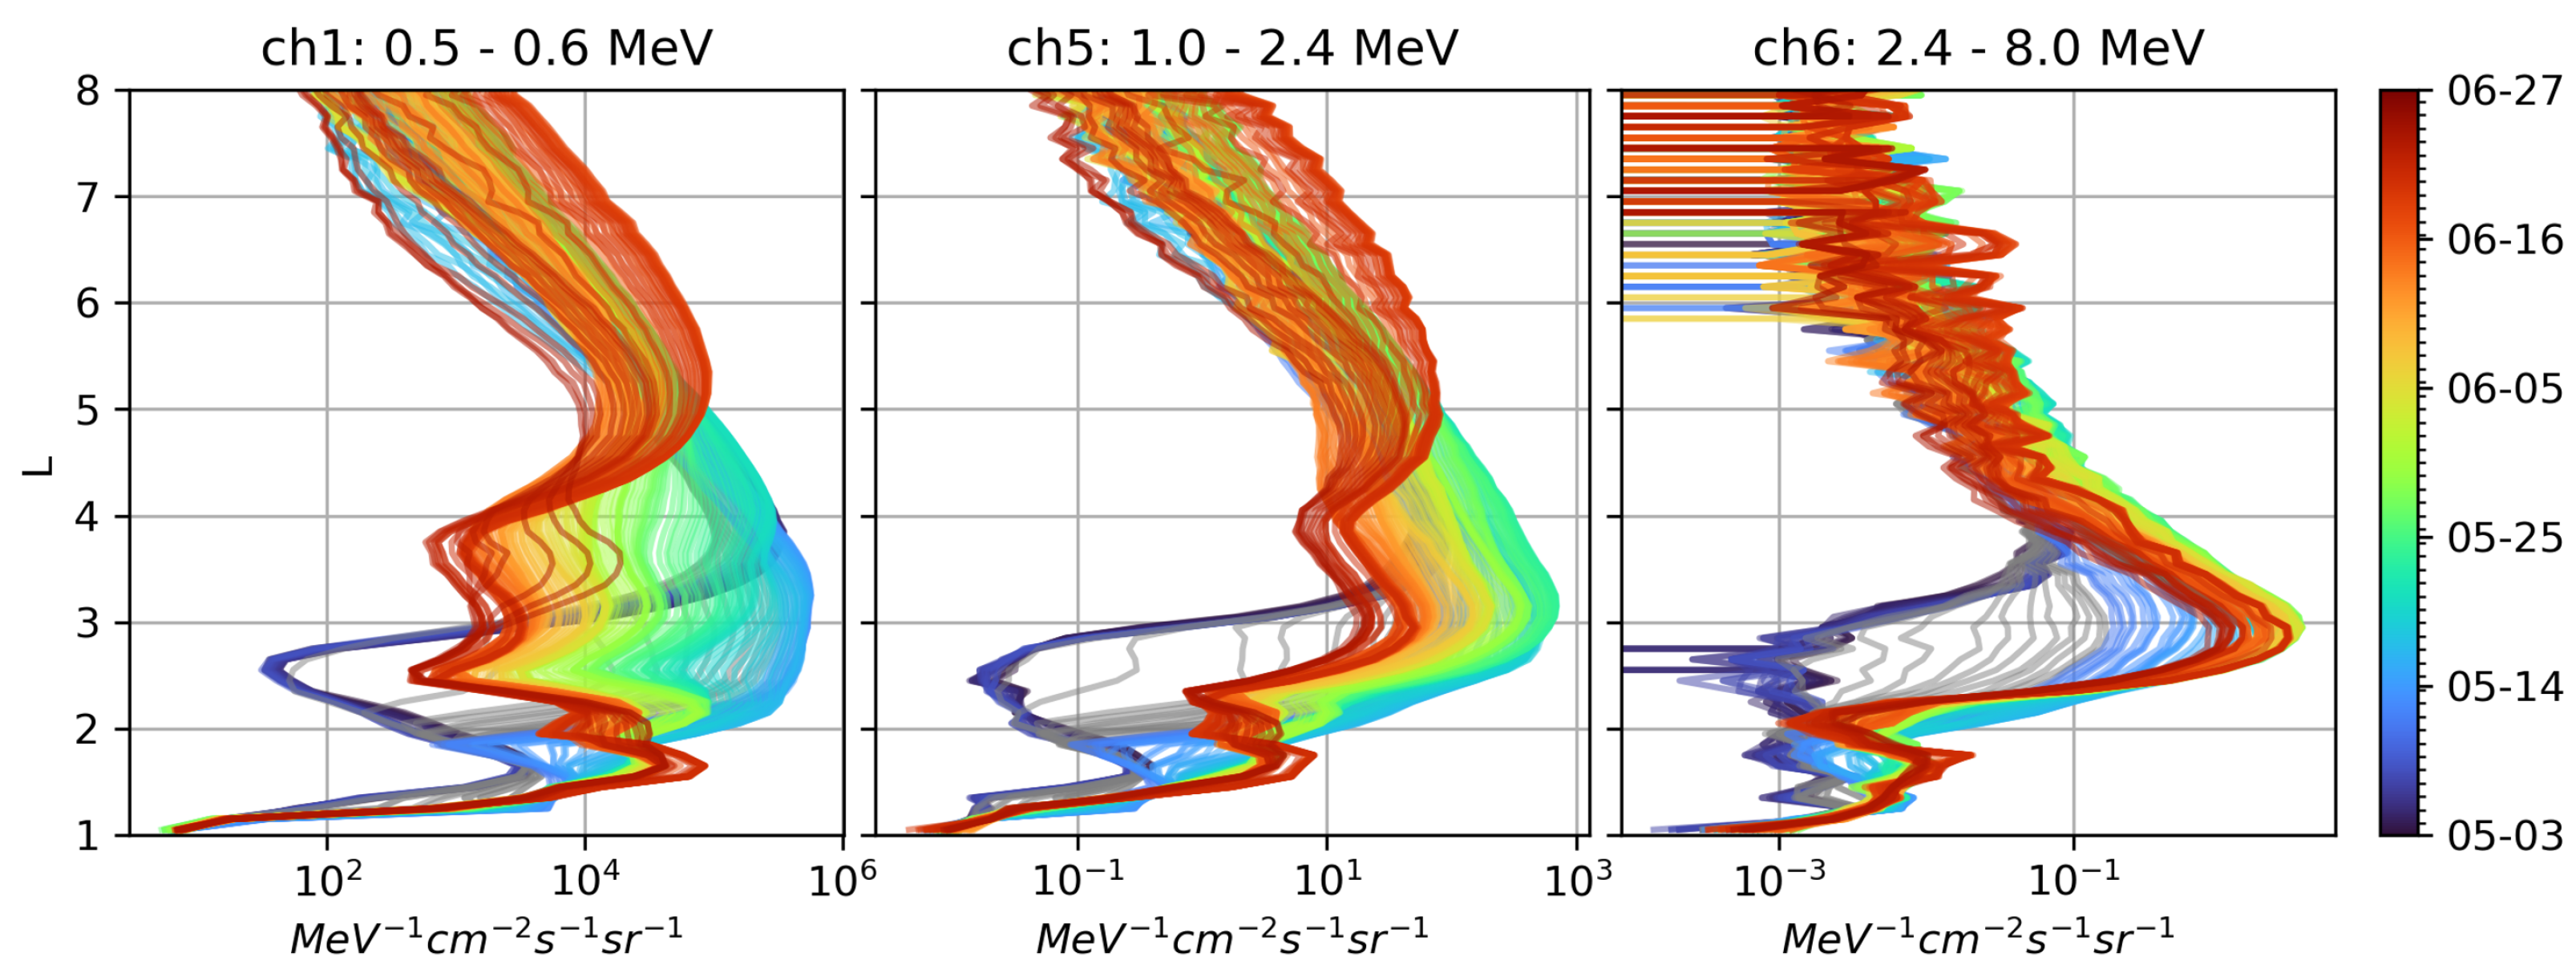
At all L, the long term variations of the flux in the first four channels of the EPT are similar (with channels 2 and 3 almost indistinguishable). This is why only channel 1, 5 and 6 are displayed in Figure 9. This figure shows the evolution of the smoothed electron fluxes across all the radiation belts from 3 May to 27 June for three energy channels. In this case, the temporal evolution is displayed by the color of each line. It is important to note that even after applying the sliding averaged on the electron fluxes, the time elapsed between two consecutive profiles remains 6 h. Thus, in all panels of the figure, the dark blue profiles correspond to the pre-storm conditions. In channel 1 and 5, the outer and inner belt are clearly defined during this quiet period, with flux peaking at L∼3.8 and L∼1.6 respectively, with a minimum of the slot at L∼2.6. In channel 6, the outer belt fluxes during quiet conditions also reach their maximum slightly under L = 4, but the inner belt is not clearly defined as fluxes are very faint.
Figure 9 shows that after the storm, the fluxes of electrons are first injected at L∼2.5 in the heart of the slot region in all energy channels. This is displayed by the grayed profiles in the figure. Although they correspond to the period when the smoothed fluxes preemptively rise compared to the 6 h averaged fluxes, and should not be considered to analyse the temporal evolution of the electron fluxes, the moving average has no influence on the L values. Thus, knowing that those profiles are not accurate in time, they can still be trusted to show where the electrons are injected at first in the belts.
Even though electron fluxes start to rise up at L∼2.5 (see light blue lines), low energy electron fluxes quickly rise up between L = 2 and L = 4, while above L = 4 the flux remains fairly constant. It is also apparent from Figure 9 that the injection of the electrons inside the inner belt is delayed relative to that occurring in the slot region. Indeed, in channel 1 and 5, the flux in the inner radiation belt does not reach its maximum before mid-June (see red lines).
Even in channel 6 (right panel), fluxes inside of the inner radiation belts have increased after the storm of 11 May. Since the launch of the EPT, this is the first time that an injection inside the inner belt of ultra-relativistic electrons with energies > 2.4 MeV have been observed. In addition, the flux in the outer belt reaches a maximum value at L∼2.8 corresponding to the so-called impenetrable barrier to ultra-relativistic electrons proposed by [21]. The fact that this barrier might not truly be impenetrable was suggested by [22] and seems to be supported by the observations of the EPT.
For 500 keV electrons (left panel), after reaching their maximum in mid-May, electron fluxes gradually start to decrease below L = 4. Towards the end of May (yellow green profiles), while the slot region is reforming at L∼2.5, fluxes around L = 3 are being depleted at a slower rate. In addition, at L∼3.8, the decrease of the flux is also slower. This results in the gradual formation of a new electron belt located between the slot and L = 4, with a peak at L = 3. This new structure is also present in channel 2, 3 and 4 of the EPT. However, as energy increases, it is less and less prominent and completely disappears for electrons with an energy ≥ 1 MeV (also see Figure 7).
A small geomagnetic storm took place on the 15 June, which led to a dropout for which penetration was limited to L = 5. Following the dropout, fluxes of electrons rose between L = 5 and L = 7 in all energy channels except channel 6. This smaller event had no influence on the additional belts in such a way that the double peaked profiles above the slot remained in the four first channels of the EPT. For ∼1 MeV electrons however, the injection at high L values from the smaller storm led to the formation of the same structure above the slot. In channel 6, while a faint dropout took place at high L, no increase in electron flux is observed. This leads the outer belt of electrons with energies > 2.4 MeV free of an additional belt.
Below the slot region, the storm of 11 May also had some important impact on the inner radiation belt. As already mentioned, injections of electrons at L = 1.7 were observed but an additional peak in the electron flux at L = 2.2 is gradually formed after the superstorm. This new behaviour is observed in all the channels of the EPT, except for the highest energies.
Then, the perturbations caused by the superstorm of 11 May led to the formation of 4 distinct sub-belts for electrons with an energy < 2.4 MeV, due to the interplay between the injection of electrons at low L and mainly to high loss rates of electrons at very specific L: L = 3.8, L = 2.5 and L = 2 for E < 2.4 MeV. While electrons with energy > 2.4 MeV were injected in the inner belt, a complex structure as discovered for the lower energies was not observed, because loss is only observed at L = 2, creating thus only one slot there.

4.3. Observations of Trapped Electrons by MEPED

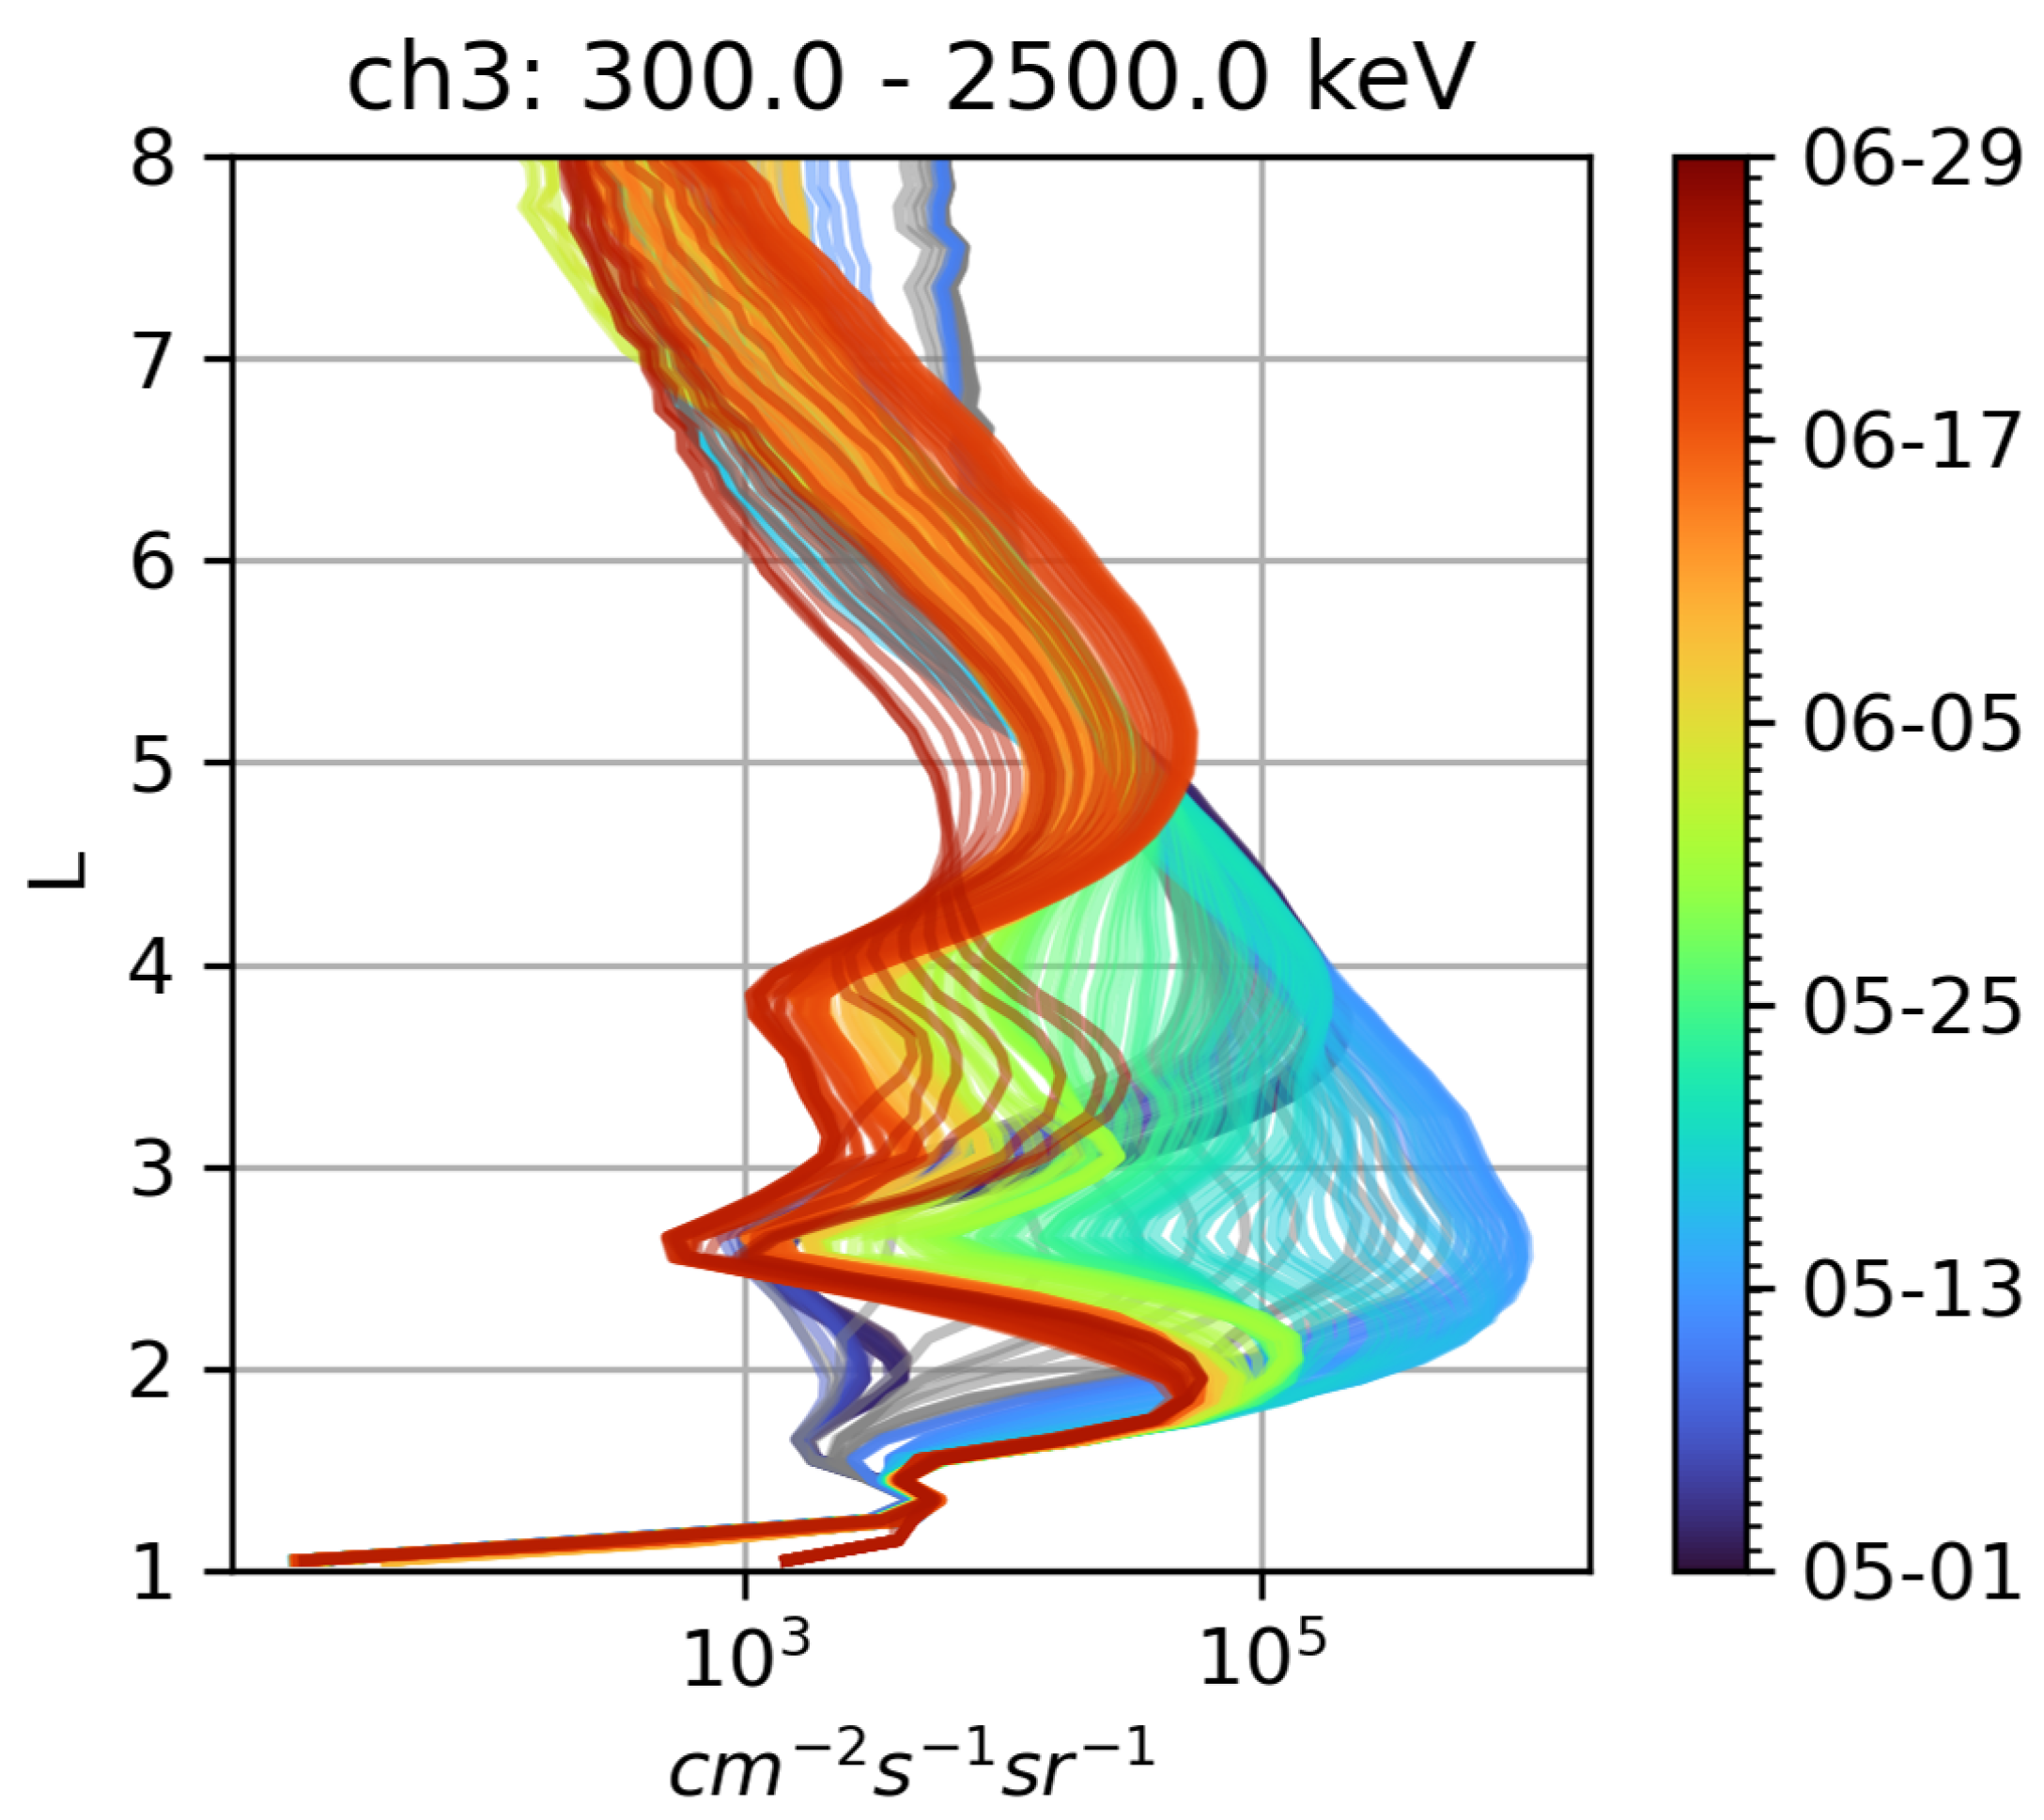
The MEPED 90° telescope has also observed electrons fluxes at LEO during the 11 May storm. The time evolution of the flux in time and L for electrons with energy higher than 300 keV is displayed in Figure 10. The MEPED electron profiles evolved in time very similarly to those observed by the EPT at 500 keV. In this case, electrons during the main phase of the storm are also injected in the slot at L = 2.5. In the outer belt, the formation of a secondary belt is also taking place during the recovery phase after the storm. However, the slot appears first at L = 2.6 (see yellow line), and then at L = 3.9 (in fact first L = 4.2 and slightly decreasing with time) and L = 1.5 creating thus additional belts with maximum fluxes at L = 5, L = 3.5 and L = 2 (see red lines) one month later at different positions than for EPT due to the different energy range. This is not so surprising when considering that at 300 keV, the electron inner belt peaked already around L = 2 before the storm, as can be seen in Figure 10 in dark blue, see also Figure 2 of [23] using observations from the MAGEIS spectrometer on board the NASA Van Allen Probes.
The formation of 4 belts is simultaneously observed independently by 2 different instruments on different satellites: MEPED 90° for the trapped electrons and EPT at 820 km of altitude for different energy ranges mainly during the month of June 2024 and more than one month after the superstorm.

4.4. Electron Maps

Figure 11 illustrates maps of the electron fluxes measured by EPT Ch 1 (500–600 keV) averaged during 10 days before (upper panel) and after the storm (bottom panel). The SAA is well visible and has a shape quite different than for the protons. Figure 11 shows that the fluxes are higher after the storm than before, at all L values of the SAA, but also and mainly in the bands of latitudes corresponding to the outer belt. These bands are observed to be much wider after the storm, because the fluxes reach much lower latitudes during the storm due to the magnetic field perturbation. In the north hemisphere, the fluxes are always low in the counterpart of the SAA, as observed previously [6].
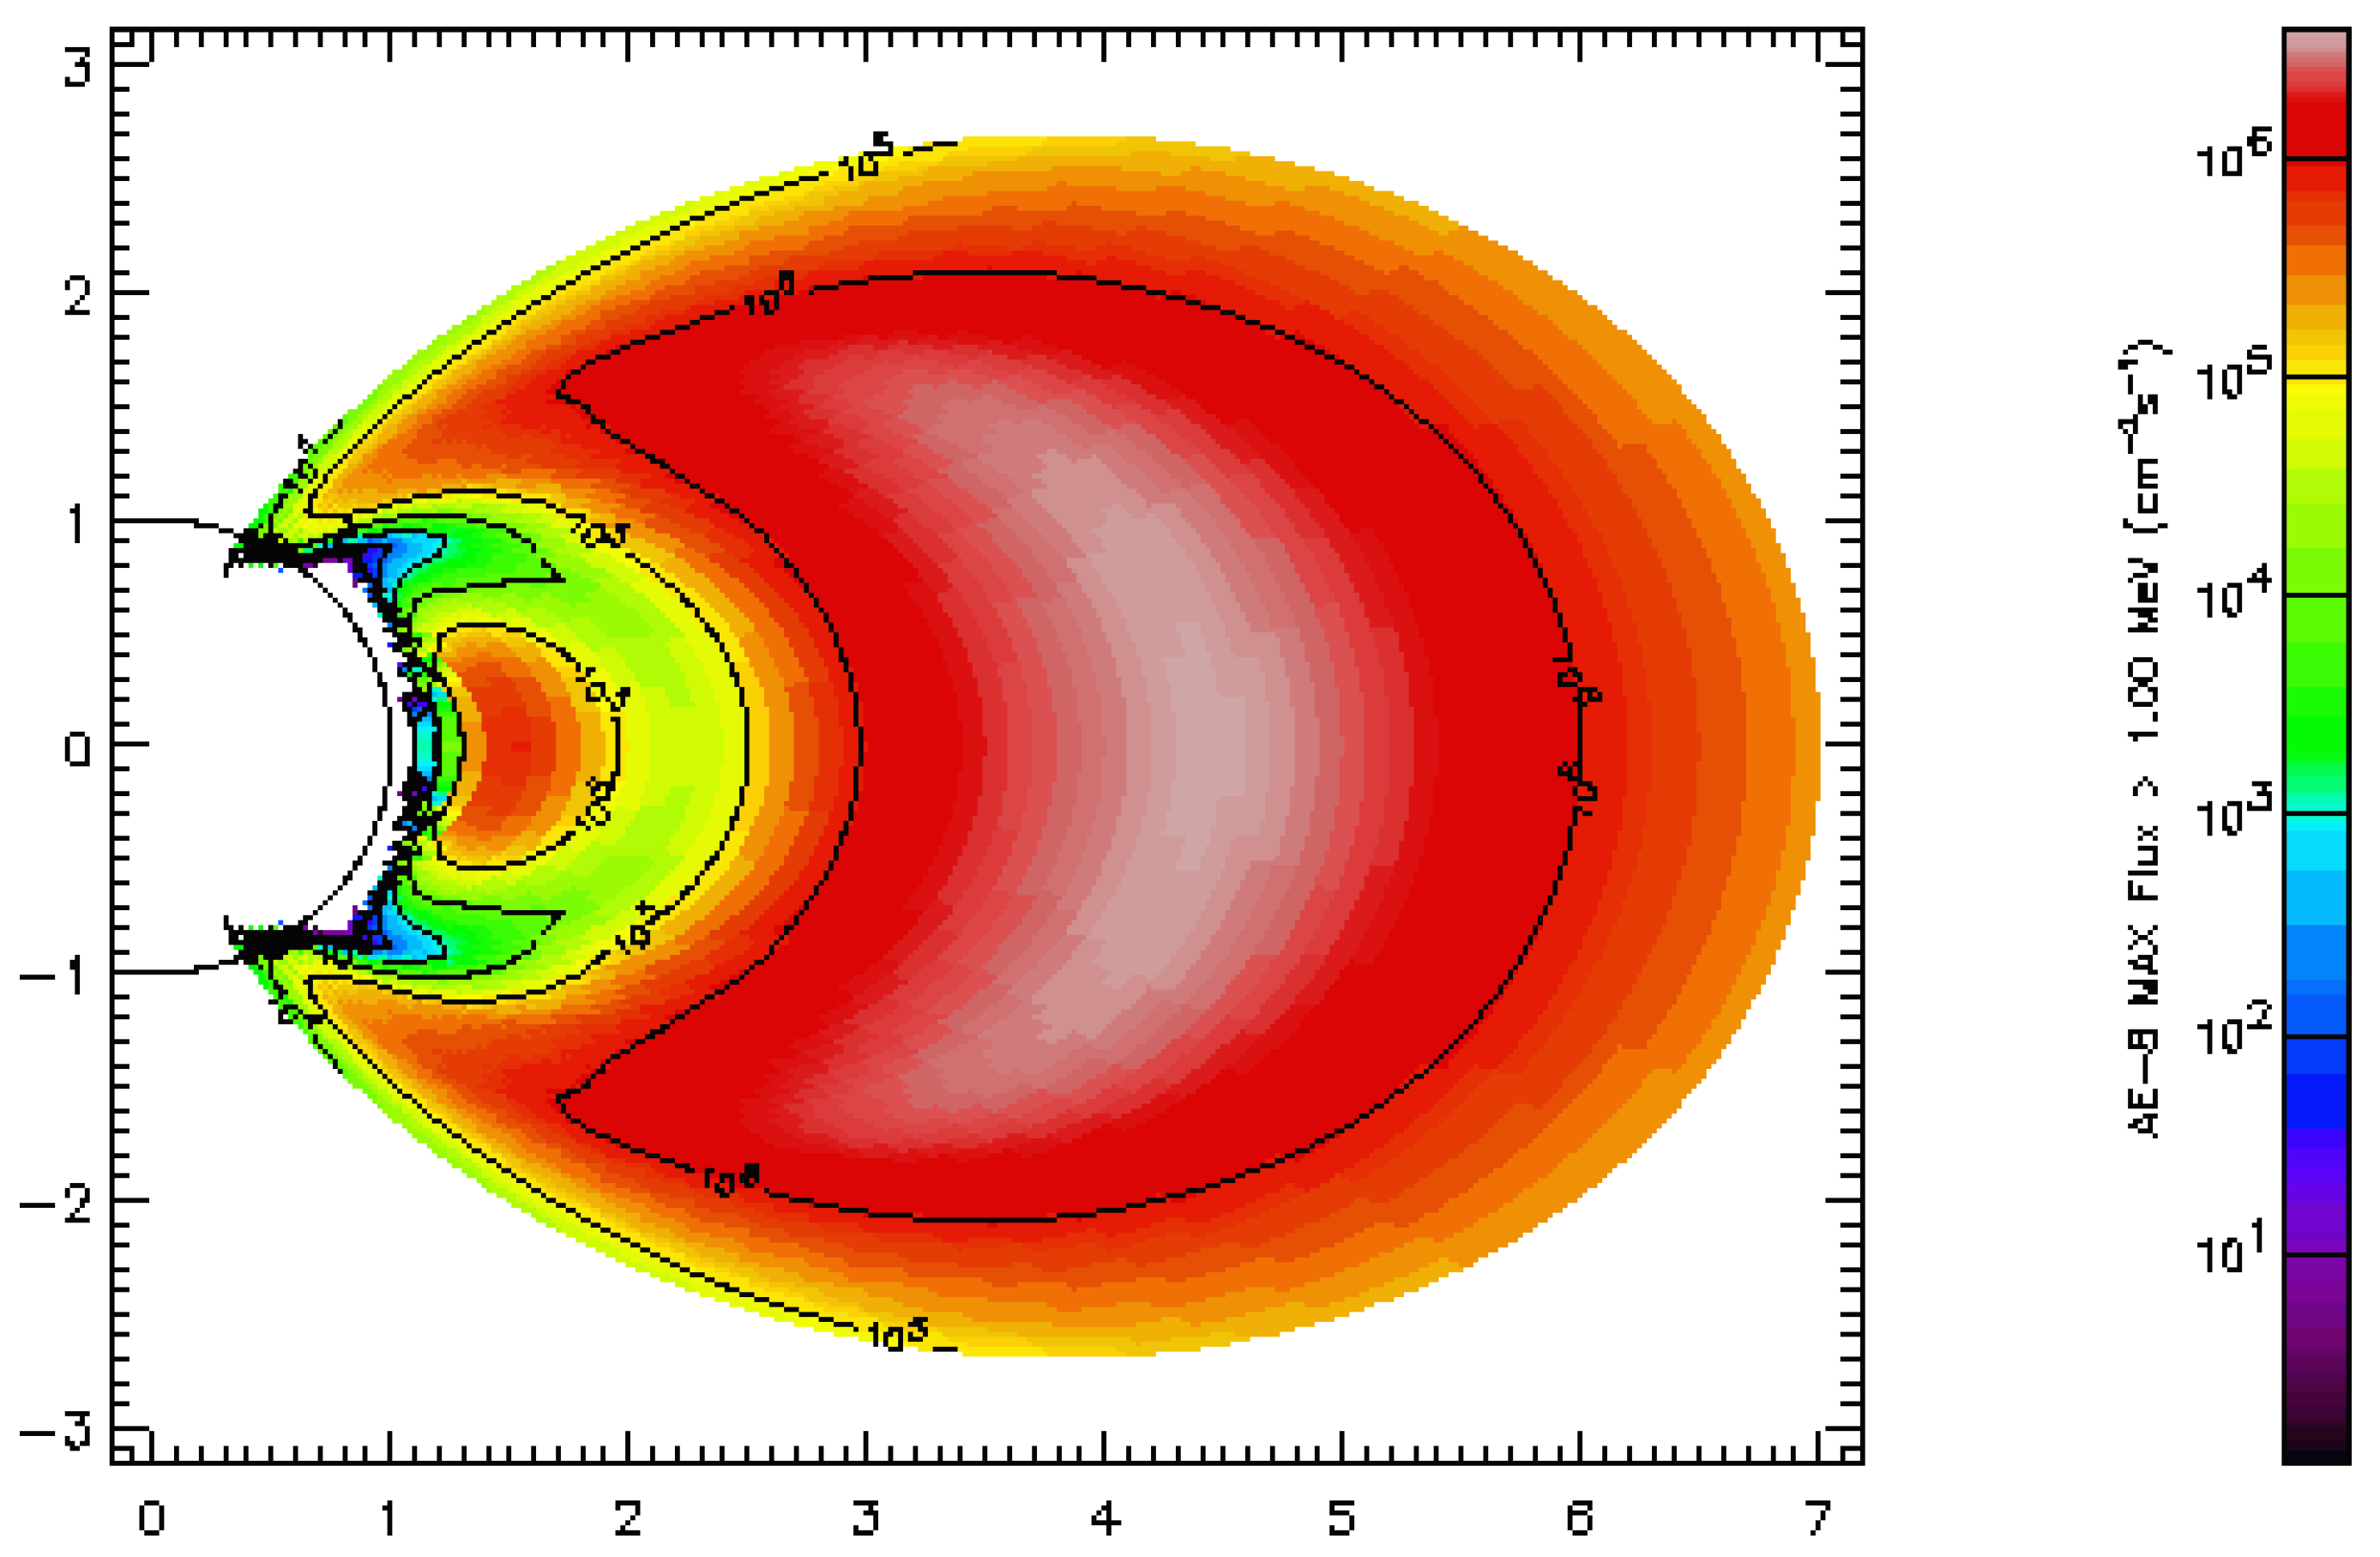
Figure 12 shows the inner and outer electron belts obtained with the NASA AE8 model [24] for energies > 1 MeV during maximum solar activity. AE8 consists of maps that contain omnidirectional, integral electron fluxes in the energy range 0.04 MeV to 7 MeV in the Earth’s radiation belt. The maps are based on data from more than 20 satellites from the early sixties to the mid-seventies, averaged without considering time variations except minimum and maximum solar activity. The model is accessible on SPENVIS (www.spenvis.oma.be (accessed on 30 September 2023)) and is useful to compare with our observations. The McIlwain parameter L corresponds to the radial distance in the equatorial plane and shows thus a slot located between L = 2 and 2.7 for this energy range. The boundaries between inner and outer belts are sligthly variable with the energy in this model.
From the observations, it appears that such maps can correspond to what was observed during quiet periods (before the storm).

5. Discussion about Multiple Electron Belts

The EPT and MEPED measurements show that the formation of the 4 electron belts is due to a process in 3 steps:
(1)
Before the storm (see dark blue line in Figure 9), there are 2 belts. For energy between 500 keV and 2.4 MeV, the maximum of the inner belt appears at L = 1.6, and the outer belt at L = 3.8 with slot at L = 2.7. For lower energy, the maximum in the inner belt is higher (L = 2).
(2)
During the storm (at minimum of Dst, see light blue line), electrons are injected down to low L, with a maximum of electron flux at lower L for lower energies. Pierrard et al. (2020) [19] (see their Figure 10) predicted an injection at L = 2.2 for E = 500–600 keV and L = 2.6 for E = 1–2.8 MeV at the moment of the Dst minimum for the strongest storms, by extrapolation of observations of less intense storms. These predicted depths of penetration correspond quite well to the observations, and are lower than for common storms. This shows that the radial diffusion leading to the electron injection depends on the energy and is in good agreement with predictions.
(3)
Due to these exceptional depths of penetration of electrons injected in the inner belt during the Dst = −412 nT geomagnetic storm, the loss mechanisms reforming the slot appears to be highly dependent on L, especially for low energies (see yellow and red lines). Loss is especially efficient at L = 2 (for all energies > 500 keV), L = 2.5 (for all energies between 500 keV and 2.8 MeV) and L = 4.1 to 3.8 slightly decreasing with time for all energies. For E < 500 keV, a loss at L = 1.5 replaces that appearing at L = 2 for higher energies, leading to a maximum of flux at L = 2 for low energy (as shown by MEPED observations).
Generally, such low orbits are not filled and that is why this exceptional storm allows us to better observe the characteristics of the loss mechanisms. While the dropouts are associated with magnetopause shadowing, the gradual decrease of electron fluxes have been shown to be associated to plasmaspheric hiss [25]. Fokker-Planck simulations using diffusion coefficients determined from plasmaspheric density [26] have reproduced the inner edge of the outer belt. Other waves can also influence the radiation belts, and especially chorus waves appearing mainly outside the plasmasphere where the background density is much lower [27]. The position of the plasmapause, which is very dynamic with time [28], is thus crucial for the loss of particles from the radiation belts. During quiet time, it is located around L = 4, but it goes closer to Earth during geomagnetic storms and substorms. The plasmasphere gradually refills during several days after the storms and the plasmaspause then comes back to larger distances.
Cunningham et al. (2020) [29] demonstrated with EPT observations that enhanced fluxes can be precipitated in the drift loss cone for energies below 800 keV at low L-shell L = [1.4, 1.8] due to the very low-frequency transmitter in the Northwest Cape of Australia (NWC). Comparing periods when the NWC transmitter is on versus when it is off, they showed significant enhancements in flux that are attributable to the transmitter and occur at the energy-dependent L-shells predicted by the resonance condition for ducted at L < 1.55 and non-ducted at L > 1.65 NWC waves. Human activity can thus explain population gradually transitioning from “permanently trapped” to “quasi-trapped” and possibly the belts observed by EPT and MEPED.
Multiple belts structure have been observed before this event in different energy ranges, both sub-relativistic [30] and ultra-relativistic [31]. However, in both of those cases, the formation of the reported three-belt structure occurred when substorm activity led to the formation of a third belt above a remaining belt. A similar scenario is also observed for the 1–2.4 MeV electrons in the end of June.
Definitely, the formation of different belts results from the interplay between the sources and losses of the particles, due to the energisation and the diffusion by interactions with different wave-particle interactions that depend on the energy, the position of the particles and the geomagnetic conditions.

6. Conclusions

The mother’s day solar storm of 11 May led to strong injection of energetic particles in the radiation belts, together with a geomagnetic storm of exceptional magnitude. Following those events, the particle populations of the radiation belts were greatly disturbed providing us with some rare observations of the dynamics of the belts under such extreme forcing.
During the period of observation presented in this work (May and June 2024), different instruments observed two separate energetic proton events: The first event occurred on 11 May 2024 and injected protons in the trapped proton belt, for the first time since the launch of EPT, while the second took place on the 8 of June, which puts them 27 days apart corresponding to a rotation of the Sun on itself. The temporal evolution of the flux at L = 6.6 is similar for the two events, with a double peak for both >10 MeV and >50 MeV protons while at higher energies only one peak is observed. Those two characteristics indicate that the two proton injections that were observed during the period of interest originate from the same solar active region. The discrepancies between the two events can be associated to the strong difference on the geo-effectiveness of the two events (see Figure 1). Indeed, the first event was associated with the strongest geomagnetic storm observed in two decades, while during the second SEP event no storm was observed. The much deeper penetration of protons in the trapped belt during the 11 May event can be explained by the large sudden commencement (SC) of the geomagnetic storm leading to the rapid compression of the magnetosphere which in turn can cause a pulse in the electric field, accelerating and injecting particles to lower L values [32]. The inner radiation belt is known to be more stable in time than the outer belt, with a strong response to solar cycle [11].
The geomagnetic storm of 11 May caused extreme electron flux variation in both the inner and outer belt, but also led to the formation of complex belt structures several weeks after the storm. One important feature shown in Figure 9 is that the injection of electrons following the storm initially takes place at lower L for low energy. Observations from MEPED > 300 keV electrons also confirms that injection at those low energies takes place at low L due to the extremely low Dst value. Rapidly after the injections, the electron profiles are modified by losses appearing at very specific L that are different as a function of energy (see for instance Figure 7 and Figure 9). This suggests that the acceleration mechanisms for electrons between 300 keV and several MeV, and even more the losses are extremely dependent on energy.
Those gradual losses lead to the formation of multiple belts depending on the energy. For 300 keV to 800 keV electrons, two distinct belts are formed above the main slot and two in the inner belts. In the highest energy range of the EPT, ultra-relativistic electrons are directly injected in the inner belt, violating the impenetrable barrier observed by the Van Allen Probes [21], or at least decreasing its limits to L = 2.4.

Author Contributions

Conceptualization, V.P. and A.W.; methodology, V.P.; software, A.W.; validation, V.P., A.W. and E.B.; formal analysis, A.W.; investigation, V.P. and A.W.; resources, V.P.; data curation, A.W.; writing—original draft preparation, V.P.; writing—review and editing, A.W., E.B. and M.P.d.B.; visualization, V.P., A.W. and M.P.d.B.; supervision, V.P.; project administration, V.P.; funding acquisition, V.P. All authors have read and agreed to the published version of the manuscript.

Funding

The project 21GRD02 BIOSPHERE has received funding from the European Partnership on Metrology, co-financed by the European Union’s Horizon Europe Research and Innovation Programme and by the Participating States, and from Horizon 2020 PITHIA-NRF project with Grant Agreement 101007599.

Data Availability Statement

The data presented in this study are available in a repository at DOI reference number 10.5281/zenodo.13626553. These data were derived from the following resources available in the public domain: PROBA-V/EPT data are publicly available on the Space Situational Awareness website of ESA https://swe.ssa.esa.int/space-radiation (accessed on 2 September 2024). POES data are available on https://satdat.ngdc.noaa.gov/sem/poes/data (accessed on 2 September 2024). GOES on https://www.swpc.noaa.gov/products/goes-proton-flux (accessed on 14 August 2024) and OMNI on https://omniweb.gsfc.nasa.gov/html/ow_data.html (accessed on 1 August 2024).

Acknowledgments

The project 21GRD02 BIOSPHERE has received funding from the European Partnership on Metrology, co-financed by the European Union’s Horizon Europe Research and Innovation Programme and by the Participating States. The authors acknowledge the Horizon 2020 PITHIA-NRF project with Grant Agreement 101007599. All authors are grateful to the PROBA-V/EPT teams, at B.USOC and ESA/Redu for their involvement in the data acquisition process, to the members of CSR for data validation, and to Belgian Science Policy-Space Research and Applications (BELSPO) for support in data exploitation. The results presented in this document rely on data provided by the Community Coordinated Modeling Center at Goddard Space Flight Center through their integrated Space Weather Analysis (iSWA) system’s HAPI server (https://iswa.gsfc.nasa.gov/IswaSystemWebApp/hapi (accessed on 2 September 2024)). The CCMC is a multi-agency partnership between NASA, AFMC, AFOSR, AFRL, AFWA, NOAA, NSF and ONR. These data were accessed via the University of Colorado’s Space Weather Technology, Research, and Education Center’s (https://colorado.edu/spaceweather (accessed on 2 September 2024)) Space Weather Data Portal (https://lasp.colorado.edu/space-weather-portal). We acknowledge the NMDB database (www.nmdb.eu) founded under the European Union’s FP7 programme (contract no. 213 007), and the PIs of individual neutron monitors, including at: Oulu (Sodankyla Geophysical Observatory of the University of Oulu, Finland), Thule (University of Delaware Department of Physics and Astronomy and the Bartol Research Institute, USA), South Pole (University of Wisconsin, River Falls, USA), Terre Adelie (Observatoire de Paris and the French Polar Institute IPEV, France), Apatity (Russia), Lomnicky (Slovakia), Kiel (Germany) and Dourbes (Belgium).

Conflicts of Interest

The authors declare no conflicts of interest.

References

  1. Kruparova, O.; Krupar, V.; Szabo, A.; Lario, D.; Nieves-Chinchilla, T.; Martinez Oliveros, J.C. Unveiling the Interplanetary Solar Radio Bursts of the 2024 Mother’s Day Solar Storm. Astrophys. J. Lett. 2024, 970, L13. [Google Scholar] [CrossRef]
  2. Hayakawa, H.; Cliver, E.W.; Clette, F.; Ebihara, Y.; Toriumi, S.; Ermolli, I.; Chatzistergos, T.; Hattori, K.; Knipp, D.J.; Blake, S.P.; et al. The Extreme Space Weather Event of 1872 February: Sunspots, Magnetic Disturbance, and Auroral Displays. Astrophys. J. 2023, 959, 23. [Google Scholar] [CrossRef]
  3. Hayakawa, H.; Bechet, S.; Clette, F.; Hudson, H.S.; Maehara, H.; Namekata, K.; Notsu, Y. Magnitude estimates for the Carrington flare in 1859 September: As seen from the original records. Astrophys. J. Lett. 2023, 954, L3. [Google Scholar] [CrossRef]
  4. Love, J.J.; Hayakawa, H.; Cliver, E.W. Intensity and impact of the New York Railroad superstorm of May 1921. Space Weather 2019, 17, 1281–1292. [Google Scholar] [CrossRef]
  5. Karan, D.K.; Martinis, C.R.; Daniell, R.; Eastes, R.W.; Wang, W.; McClintock, W.E.; Michell, R.G.; England, S.L. GOLD observations ofthe merging of the Southern Crest of the equatorial ionization anomaly and aurora during the 10 and 11 May 2024 Mother’s Day super geomagnetic storm. Geophys. Res. Lett. 2024, 51, e2024GL110632. [Google Scholar] [CrossRef]
  6. Pierrard, V.; Lopez Rosson, G.; Borremans, K.; Lemaire, J.; Maes, J.; Bonnewijn, S.; Van Ransbeeck, E.; Neefs, E.; Cyamukungu, M.; Benck, S.; et al. The Energetic Particle Telescope: First results. Space Sci. Rev. 2014, 184, 87–106. [Google Scholar] [CrossRef]
  7. Cyamukungu, M.; Grégoire, G. The Energetic Particle Telescope (EPT) concept and performances. In Proceedings of the Solar Physics and Space Weather Instrumentation IV. International Society for Optics and Photonics, San Diego, CA, USA, 21–24 August 2011. [Google Scholar]
  8. Cyamukungu, M.; Benck, S.; Borisov, S.; Grégoire, G.; Cabrera, J.; Bonnet, J.L. The Energetic Particle Telescope (EPT) on board PROBA-V: Description of a new science-class instrument for particle detection in space. IEEE Trans. Nucl. Sci. 2014, 61, 3667–3681. [Google Scholar] [CrossRef]
  9. Evans, D.; Greer, M. Polar Orbiting Environmental Satellite Space Environment Monitor; NOAA National Geophysical Data Center: Boulder, CO, USA, 2000.
  10. Hu, S.; Semones, E. Calibration of the GOES 6—16 High-energy proton detectors based on modelling of ground level enhancement energy spectra. J. Space Weather Space Clim. 2022, 12, 15. [Google Scholar] [CrossRef]
  11. Pierrard, V.; Benck, S.; Botek, E.; Borisov, S.; Winant, A. Proton flux variations during Solar Energetic Particle Events, minimum and maximum solar activity, and splitting of the proton belt in the South Atlantic Anomaly. J. Geophys. Res. Space Phys. 2023, 128, e2022JA031202. [Google Scholar] [CrossRef]
  12. McIlwain, C.E. Magnetic coordinates. Space Sci. Rev. 1966, 5, 585–598. [Google Scholar] [CrossRef]
  13. Yando, K.; Millan, R.M.; Green, J.C.; Evans, D.S. A Monte Carlo simulation of the NOAA POES medium energy proton and electron detector instrument. J. Geophys. Res. Space Phys. 2011, 116, A10231. [Google Scholar] [CrossRef]
  14. Lopez Rosson, G.; Pierrard, V. Analysis of proton and electron spectra observed by EPT/PROBA-V in the South Atlantic Anomaly. Adv. Space Res. 2017, 60, 796–805. [Google Scholar] [CrossRef]
  15. Selesnick, R.; Baker, D.; Jaynes, A.; Li, X.; Kanekal, S.; Hudson, M.; Kress, B. Observations of the inner radiation belt: CRAND and trapped solar protons. J. Geophys. Res. Space Phys. 2014, 119, 6541–6552. [Google Scholar] [CrossRef]
  16. Selesnick, R.; Looper, M.; Mewaldt, R. A theoretical model of the inner proton radiation belt. Space Weather 2007, 5, S04003. [Google Scholar] [CrossRef]
  17. Selesnick, R.; Hudson, M.; Kress, B. Injection and loss of inner radiation belt protons during solar proton events and magnetic storms. J. Geophys. Res. Space Phys. 2010, 115, A08211. [Google Scholar] [CrossRef]
  18. Pierrard, V.; Lopez Rosson, G. The effects of the big storm events in the first half of 2015 on the radiation belts observed by EPT/PROBA-V. Ann. Geophys. 2016, 34, 75–84. [Google Scholar] [CrossRef]
  19. Pierrard, V.; Botek, E.; Ripoll, J.F.; Cunningham, G. Electron dropout events and flux enhancements associated with geomagnetic storms observed by PROBA-V/EPT from 2013 to 2019. J. Geophys. Res. Space Phys. 2020, 125, e2020JA028487. [Google Scholar] [CrossRef]
  20. Benck, S.; Mazzino, L.; Cyamukungu, M.; Cabrera, J.; Pierrard, V. Low altitude energetic electron lifetimes after enhanced magnetic activity as deduced from SAC-C and DEMETER data. Ann. Geophys. 2010, 28, 849–859. [Google Scholar] [CrossRef]
  21. Baker, D.; Jaynes, A.; Hoxie, V.; Thorne, R.; Foster, J.; Li, X.; Fennell, J.; Wygant, J.; Kanekal, S.; Erickson, P.; et al. An impenetrable barrier to ultrarelativistic electrons in the Van Allen radiation belts. Nature 2014, 515, 531–534. [Google Scholar] [CrossRef]
  22. Ozeke, L.G.; Mann, I.R.; Murphy, K.R.; Degeling, A.W.; Claudepierre, S.G.; Spence, H.E. Explaining the apparent impenetrable barrier to ultra-relativistic electrons in the outer Van Allen belt. Nat. Commun. 2018, 9, 1844. [Google Scholar] [CrossRef]
  23. Reeves, G.D.; Friedel, R.H.; Larsen, B.A.; Skoug, R.M.; Funsten, H.O.; Claudepierre, S.G.; Fennell, J.F.; Turner, D.L.; Denton, M.H.; Spence, H.E.; et al. Energy-dependent dynamics of keV to MeV electrons in the inner zone, outer zone, and slot regions. J. Geophys. Res. Space Phys. 2016, 121, 397–412. [Google Scholar] [CrossRef]
  24. Vette, J.I. The AE-8 Trapped Electron Model Environment; NSSDC/WDC-A-R&S 91-24; National Aeronautics and Space Administration, Goddard Space Flight Center: Greenbelt, MD, USA, 1991.
  25. Pierrard, V.; Ripoll, J.F.; Cunningham, G.; Botek, E.; Santolik, O.; Thaller, S.; Kurth, W.S.; Cosmides, M. Observations and simulations of dropout events and flux enhancements in October 2013: Comparing MEO equatorial with LEO polar orbit. J. Geophys. Res. Space Phys. 2021, 126, e2020JA028850. [Google Scholar] [CrossRef]
  26. Ripoll, J.F.; Thaller, S.; Hartley, D.; Cunningham, G.S.; Pierrard, V.; Kurth, W.S.; Kletzing, C.A.; Wygant, J.R. Statistics and empirical models of the plasmasphere boundaries from the Van Allen Probes for radiation belt physics. Geophys. Res. Lett. 2022, 49, e2022GL101402. [Google Scholar] [CrossRef]
  27. Dahmen, N.; Sicard, A.; Brunet, A.; Santolik, O.; Pierrard, V.; Botek, E.; Darrouzet, F.; Katsavrias, C. FARWEST: Efficient computation of wave-particle interactions for a dynamic description of the electron radiation belt diffusion. J. Geophys. Res. Space Phys. 2022, 127, e2022JA030518. [Google Scholar] [CrossRef]
  28. Pierrard, V.; Botek, E.; Darrouzet, F. Improving Predictions of the 3-Dimensional Dynamic Model of the Plasmasphere. Front. Astron. Space Sci. 2021, 8, 681401. [Google Scholar] [CrossRef]
  29. Cunningham, G.; Botek, E.; Pierrard, V.; Cully, C.; Ripoll, J.F. Observation of High-Energy Electrons Precipitated by NWC Transmitter from PROBA-V Low-Earth Orbit Satellite. Geophys. Res. Lett. 2020, 47, e2020GL089077. [Google Scholar] [CrossRef]
  30. Chen, J.L.; Zou, H.; Hao, Y.X.; Ye, Y.G.; Miyoshi, Y.; Matsuoka, A.; Shinohara, I.; Teramoto, M.; Xu, S.G. A sub-relativistic electron three-belt event in the Earth’s radiation belts: Observation and explanation. J. Geophys. Res. Space Phys. 2024, 129, e2023JA032213. [Google Scholar] [CrossRef]
  31. Baker, D.; Kanekal, S.; Hoxie, V.; Henderson, M.; Li, X.; Spence, H.E.; Elkington, S.; Friedel, R.; Goldstein, J.; Hudson, M.; et al. A long-lived relativistic electron storage ring embedded in Earth’s outer Van Allen belt. Science 2013, 340, 186–190. [Google Scholar] [CrossRef]
  32. Lazutin, L.; Kuznetsov, S.; Podorol’skii, A. Dynamics of the radiation belt formed by solar protons during magnetic storms. Geomagn. Aeron. 2007, 47, 175–184. [Google Scholar] [CrossRef]
Figure 1. Parameters of the solar wind at 1 AU and geomagnetic indices from OMNI from 1 May to 30 June 2024. Top panel: solar wind density (blue) and solar wind speed (red). Second panel: solar wind pressure (blue) and solar wind temperature (red). Third panel: Southward component of the interplanetary magnetic field B z . Bottom panel: Dst index (blue) and Kp index multiplied by 10 (red).
Universe 10 00391 g001
Figure 2. GOES observations of proton fluxes with energy >10 MeV (blue), >50 MeV (orange) and >100 MeV (green) at the geostationary orbit from 1 May 2024 to 30 June 2024.
Universe 10 00391 g002
Figure 3. Proton differential fluxes observed by PROBA-V/EPT from 1 May to 30 June 2024 as a function of the McIlwain parameter L (vertical axis) and time (horizontal axis) in the first 5 EPT proton energy channels. Fluxes are averaged in bins which are 6 h long in time and 0.25 in L. From top to bottom, the energy of each channel increases and they all share the same colorbar.
Universe 10 00391 g003
Figure 4. Proton differential fluxes observed by MEPED from 1 May to 30 June 2024 as a function of the McIlwain parameter L (vertical axis) and time (horizontal axis) in 5th proton energy channel of MEPED. Fluxes are averaged in bins which are 6 h long in time and 0.25 in L. Top panel: 0° telescope, Bottom panel: 90° telescope.
Universe 10 00391 g004
Figure 5. Proton fluxes observed in the first EPT proton channel averaged in longitude and latitude bins during four different periods covering most of the period considered in previous figures. The averaging bins here have a width of 10° in longitude and 5° in latitude. Each panel corresponds to a different period: (a) quiet conditions from 1 May to 9 May, (b) storm time and beginning of the recovery from 10 May to 20 May, (c) recovery period from 21 May to 31 May, (d) second proton injection from 1 June to 15 June.
Universe 10 00391 g005
Figure 6. Observations of neutron monitors at different stations specified in Table 1, located at all latitudes like Dourbes (Belgium, 50° lat) and SOPO (South Pole latitude 90 °). The perturbation during the night of 10 to 11 May 2024 is well visible. The neutron decrease during the storm (Forbush decrease) is immediately followed by a Ground Level Enhancement.
Universe 10 00391 g006
Figure 7. Electron differential fluxes observed from 1 May to 30 June 2024 as a function of the McIlwain parameter L (vertical axis) and time (horizontal axis) in the 6 EPT electron energy channels. Fluxes are averaged in bins which are 6 h long in time and 0.25 in L. From top to bottom, the energy of the channels increases and they all share the same color bar.
Universe 10 00391 g007
Figure 8. EPT electron differential fluxes (in MeV 1 cm 2 s 1 sr 1 ) as a function of time from 1 May to 30 June 2024 for all energy channels. Each panel shows the EPT flux at different L values. Plain lines correspond to the fluxes displayed in Figure 7 and the dashed lines with similar color code correspond to the associated smoothed fluxes by sliding averages with a 4 days width.
Universe 10 00391 g008
Figure 9. EPT smoothed electron differential fluxes as a function of L and time (color bar) in 3 different energy channels from 3 May to 27 June 2024. Grayed profiles correspond to the period between 8 and 10 May where the smoothed fluxes significantly deviate from the 6 h averaged fluxes.
Universe 10 00391 g009
Figure 10. Same as Figure 10 for MEPED 90° telescope for >300 keV integral electron flux.
Universe 10 00391 g010
Figure 11. Map of electron flux in Channel 1 (500–600 keV) observed from 1 to 10 May 2024 (before the storm, top panel) and from 11 to 20 May 2024 (after the storm, bottom panel). One can see the South Atlantic Anomaly (high fluxes) and its counterpart in the Northern hemisphere (lower fluxes), as well as the penetration of the outer belt at high latitudes.
Universe 10 00391 g011
Figure 12. Distribution of electrons above 1 MeV as a function of the radial distance in Earth’s radii given by the NASA AE8-MAX model obtained using spenvis.oma.be. Inner and outer belts (in red), as well as the slot (in green), are well visible.
Universe 10 00391 g012
Table 1. Characteristics of the ground-based neutron monitor stations whose data are shown in Figure 6: Full name, short name, altitude, Cutoff Rigidity Rc, latitude and longitude.
Full NameShort NameAlt (m)Rc (GV)Coordinates (Lat, Longitude) in Degree
LomnickyLMKS26343.8449.2000, 20.2200
DourbesDRBS2253.1850.0971, 4.59003
KielKIEL542.3654.3399, 10.1199
OuluOULU150.8165.0544, 25.4681
ApatityAPTY1810.6567.5704, 33.3935
South PoleSOPO28200.1−90.000, 0.00000
Disclaimer/Publisher’s Note: The statements, opinions and data contained in all publications are solely those of the individual author(s) and contributor(s) and not of MDPI and/or the editor(s). MDPI and/or the editor(s) disclaim responsibility for any injury to people or property resulting from any ideas, methods, instructions or products referred to in the content.