Article

Identification of N-Oxide-Containing Aromatic Heterocycles as Pharmacophores for Rumen Fermentation Modifiers

by
Carla Bonifacino
1,2,
Gonzalo Rodríguez
1,3,
Analía Pérez-Ruchel
2,
José Luis Repetto
4,
Hugo Cerecetto
1,3,
Cecilia Cajarville
2,* and
Mercedes González
1,*
1
Grupo de Química Medicinal, Laboratorio de Química Orgánica Medicinal, Instituto de Química Biológica, Facultad de Ciencias, Universidad de la República, Iguá 4225, Montevideo 11400, Uruguay
2
Departamento de Nutrición, Instituto de Producción Animal, Facultad de Veterinaria, Universidad de la República, Ruta 1 km 42,500, San José 80100, Uruguay
3
Área de Radiofarmacia, Centro de Investigaciones Nucleares, Facultad de Ciencias, Universidad de la República, Mataojo 2055, Montevideo 11400, Uruguay
4
Departamento de Bovinos, Instituto de Produccción Animal, Facultad de Veterinaria, Universidad de la República, Ruta 1 km 42,500, San José 80100, Uruguay
*
Authors to whom correspondence should be addressed.
Metabolites 2019, 9(4), 62; https://doi.org/10.3390/metabo9040062
Submission received: 31 January 2019 / Revised: 5 March 2019 / Accepted: 8 March 2019 / Published: 2 April 2019

Abstract

:
Different strategies have been used to mitigate greenhouse gas emissions from domesticated ruminants, including the removal of protozoa (defaunation). The objective of the present work was to analyze the potential of different N-oxide-containing aromatic heterocycles with known antiprotozoal activity as rumen-gas-abating agents. Nineteen pure compounds, belonging to seven different N-oxide chemotypes from our chemo-library were studied together with monensin in an in vitro rumen simulation assay. Fermentation profiles, i.e., gas production, pH, and short carboxylic acid concentrations, were compared to an untreated control at 96 h post inoculation. In our study, we investigated whole-ruminal fluid, with and without compound treatments, by NMR spectroscopy focusing on concentrations of the metabolites acetate, propionate, butyrate, and lactate. From data analysis, three of the compounds from different N-oxide chemotypes, including quinoxaline dioxide, benzofuroxan, and methylfuroxan, were able to diminish the production of gases such as monensin with similar gas production lag times for each of them. Additionally, unlike monensin, one methylfuroxan did not decrease the rumen pH during the analyzed incubation time, shifting rumen fermentation to increase the molar concentrations of propionate and butyrate. These facts suggest interesting alternatives as feed supplements to control gas emissions from dairy ruminants.

1. Introduction

Ruminants, during enteric fermentation, degrade plant polysaccharides to acetate (Ac), propionate (Prop), butyrate (But), CO2, and CH4 via the anaerobic microorganism community in the rumen [1]. The eructated greenhouse gases CO2, CH4, and H2S contribute to global warming [2,3]. Particularly, eructated CH4 represents an energy loss to the animals, which can be between 2% and 15% of their gross energy intake [4,5]. The principal methanogens in cattle, belonging to the domain Archaea and the phylum Euryarchaeota, use H2 and CO2 to generate CH4. Methanogens have symbiotic relationships with rumen microorganisms, especially with ruminal protozoa, which involve interspecies hydrogen transfer. Protozoa from the genera Entodinium, Polyplastron, Epidinium, and Ophryoscolex have been described to have symbiotic relationships with methanogens [6]. Protozoa compete with amylolytic bacteria for starch, which is fermented into Ac by protozoa while mostly into Prop by amylolytic bacteria. Protozoa are important ruminal H2 producers, and the produced H2, another rumen gas, is mostly converted into CH4 by methanogens situated inside the protozoa or on their external surface. Different gas abatement strategies, usually affecting ruminal microorganisms, have been used with varying success. Some of these gas-mitigating strategies have involved feed-supplementation with lipids, antibiotics, plants or natural products, electron acceptors, and defaunation agents as rumen modifiers [6,7]. Increasing the lipid content of feed is thought to decrease methanogenesis through the inhibition of protozoa, increased production of Prop (hydrogen sink compound), biohydrogenation of unsaturated fatty acids, or toxic effect on cellulolytic bacteria and protozoa [8]. Among antibiotics, the most relevant one is the ionophore monensin (Mon), which is marketed in the USA to increase feed efficiency and weight gain, increase milk production, and decrease milk fat. However, it is banned by the European Union to control antibiotic resistance [6]. Monensin inhibits the growth of gram-negative bacteria and protozoa, which causes a shift towards Prop production in the rumen. In addition, Mon decreases the incidence of subclinical ruminal acidosis by inhibiting the gram-positive bacteria and ciliate protozoa that contribute to lactate (Lac) production [7]. The main natural products, as pure forms or from plants, that have demonstrated the effect of reducing gas, i.e., CH4, emissions are essential oils, saponins, and tannins [9]. However, other extracts or isolated natural products have been studied with different results [10,11,12]. Supplementation with nitrates has been also used [7]. The nitrate anion replaces CO2 as an electron acceptor and together with H2 would produce NH4+ instead of CH4 acting an alternative H2 sink in the rumen. The main disadvantage of using a supplementation of nitrates is its great number of secondary effects. Finally, defaunation is the removal of protozoa from the rumen, which inhibits the transfer of H2 in the symbiotic relationships between microorganisms and affects the CH4 production. For this purpose, different chemical entities have been used, i.e., CuSO4, surface-active chemicals, ionophores, triazine, lipids, saponins, and tannins. For almost 20 years, our research group has been working on the development and biological evaluation of different N-oxide-containing aromatic heterocycles [13,14,15,16,17,18]. Among the most relevant biological activities, we have found anti-protozoa activity in phenazine dioxide [19], quinoxaline dioxide [20], indazole N-oxide [21], benzofuroxan [22,23], benzimidazole dioxide [24], and furoxan derivatives [23,25]. We and others have found that this biological activity could be related to the ability of N-oxide moieties as electron acceptors [23,26,27,28,29,30,31,32]. Additionally, some of these N-oxides have been studied for their use as substrates for bovine rumen fluid biotransformation [33]; phenazine dioxides, quinoxaline dioxides, indazole N-oxides, and benzofuroxans are transformed to reduced products, while assayed furoxan is not biotransformed under the studied conditions.
Taking the above facts into account and with the lack of studies about the use of N-oxides as rumen fermentation modifiers, the purpose of this work was to study the effects of compounds belonging to seven N-oxide chemotypes on in vitro rumen fermentation.

2. Results

2.1. Effect of the Studied Compounds on the Total Gas Production

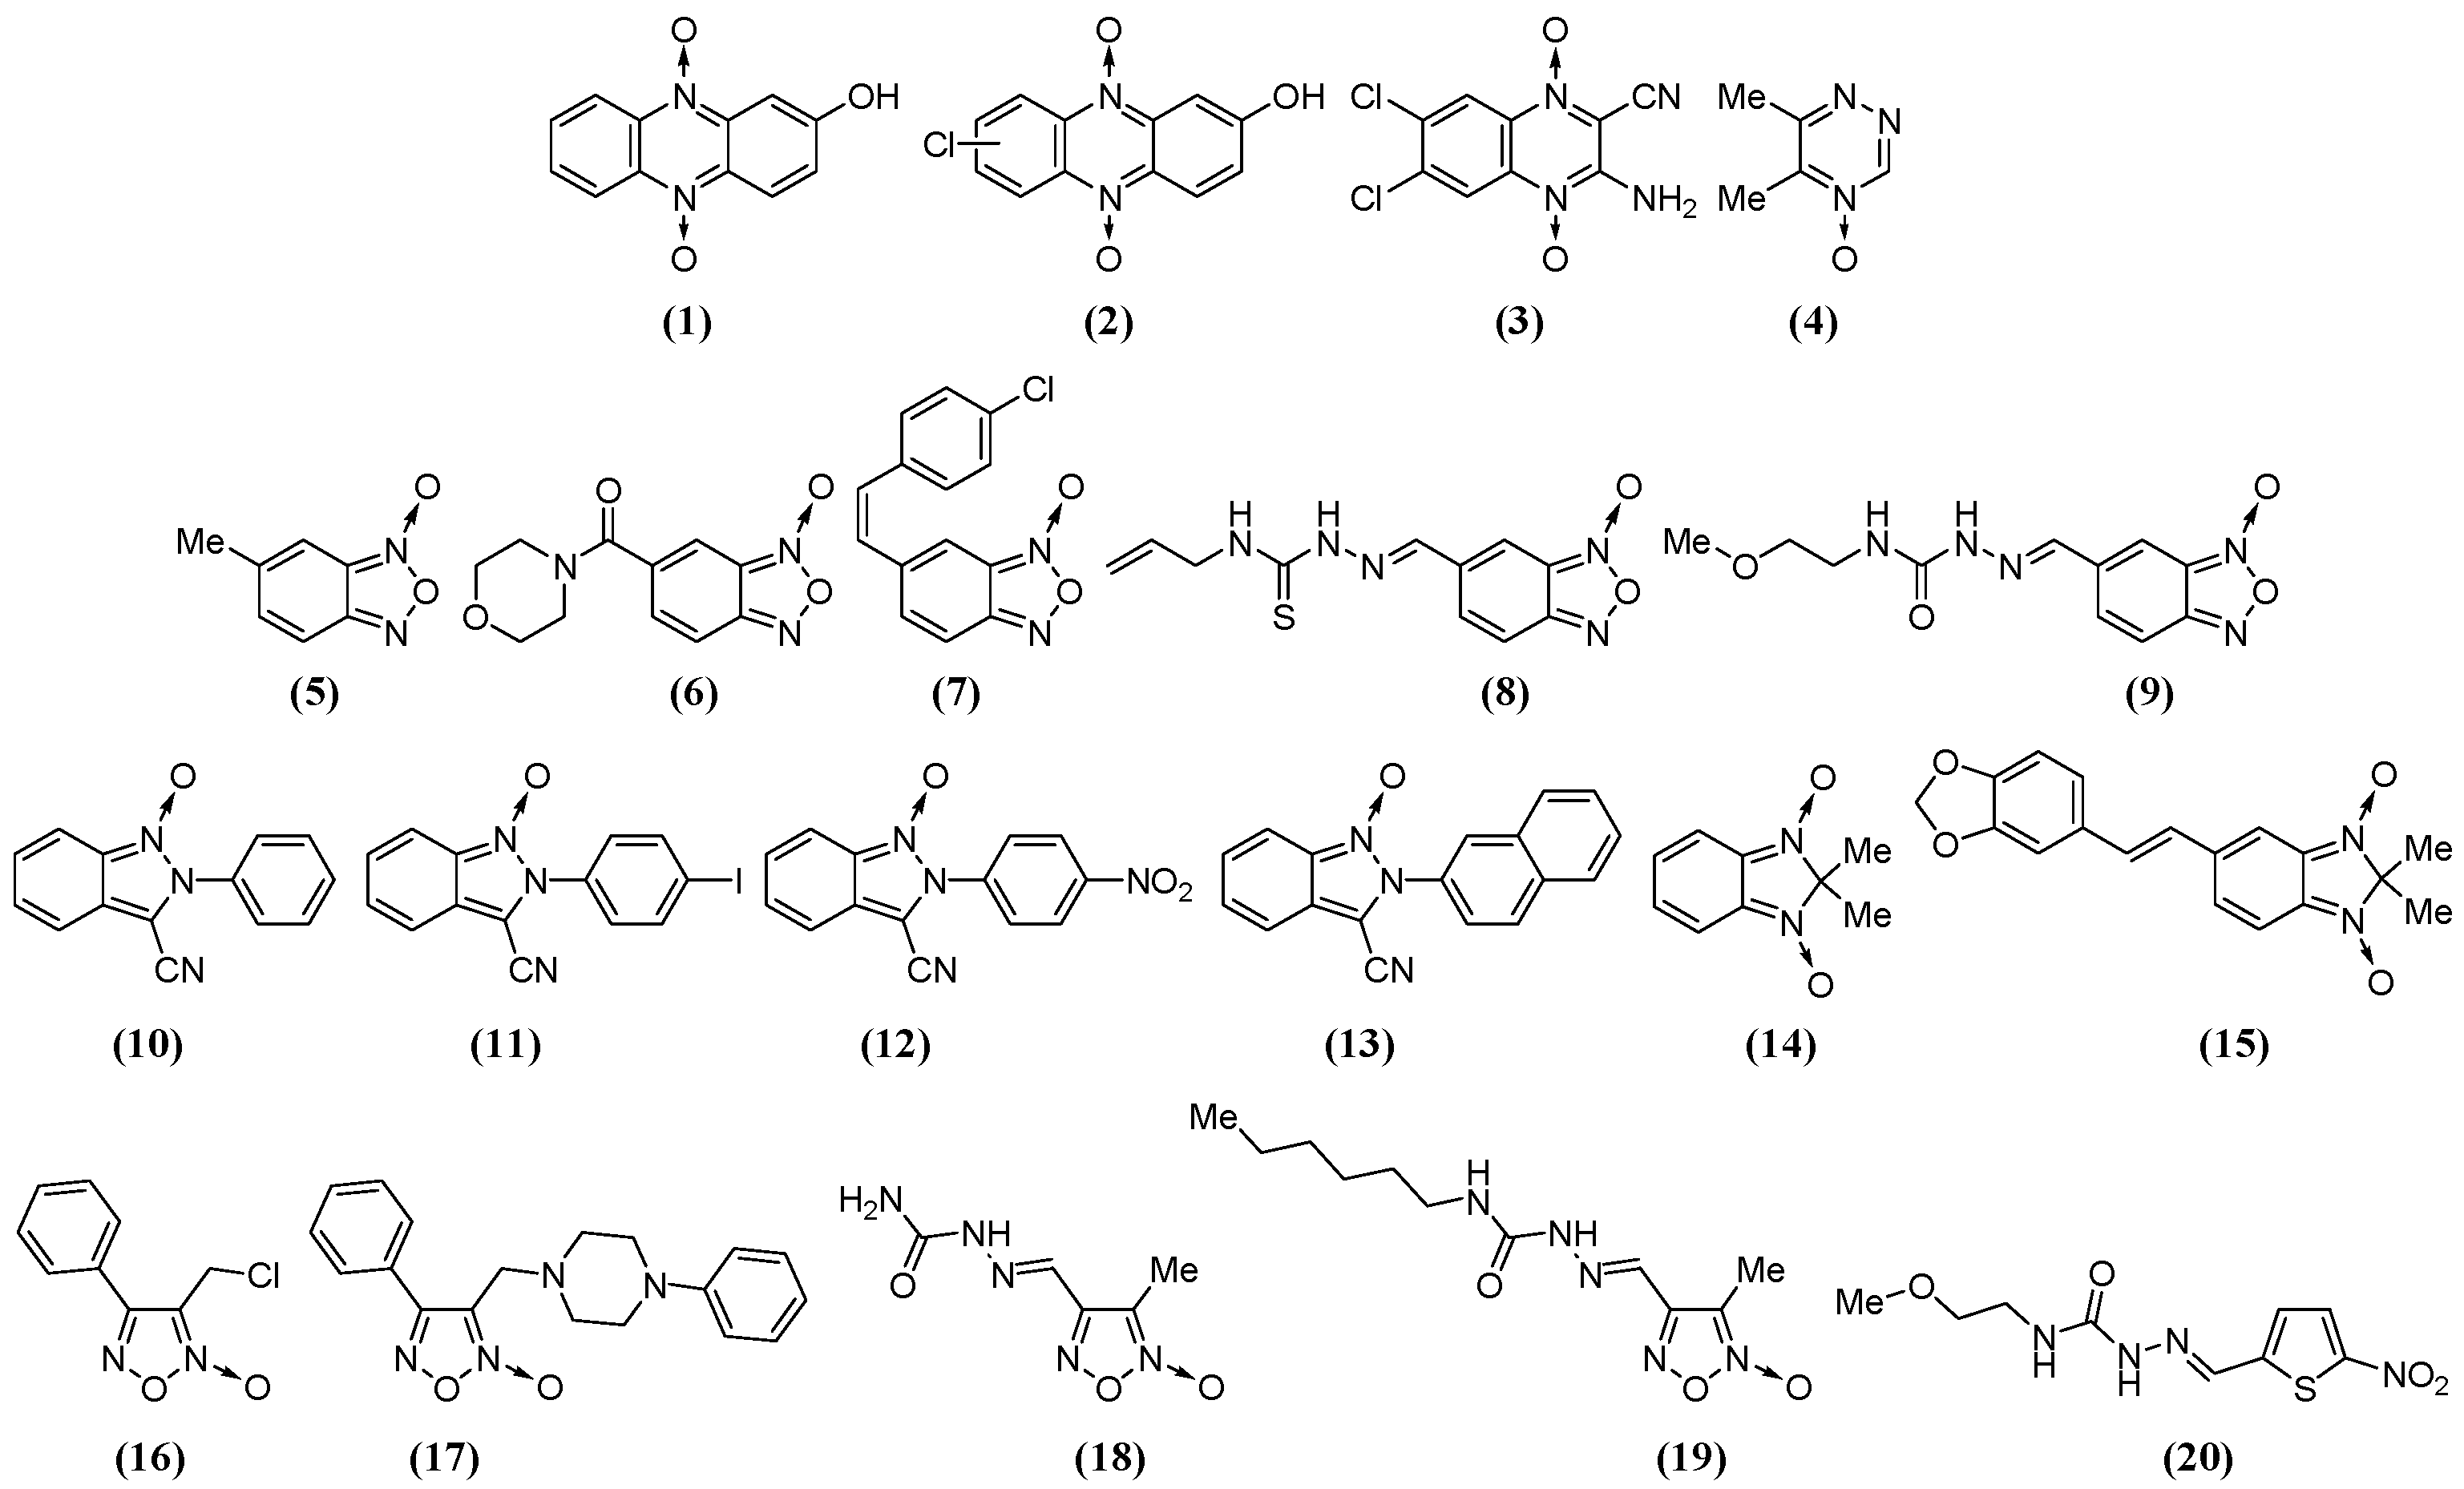
In order to identify new pharmacophores for rumen fermentation modifiers, we selected compounds from our chemo-library belonging to different N-oxide chemotypes (Figure 1). The selected compounds are shown in Figure 2. After checking their integrity and purity, some of them were synthesized, and for that we followed previously described procedures [17,18,19,21,22,23,24]. The antibiotic ionophore Mon was used in the studies as the positive control. A control without N-oxide moiety was also included, i.e., compound 20, which is structurally related to benzofuroxan 9 porting the same lateral chain.
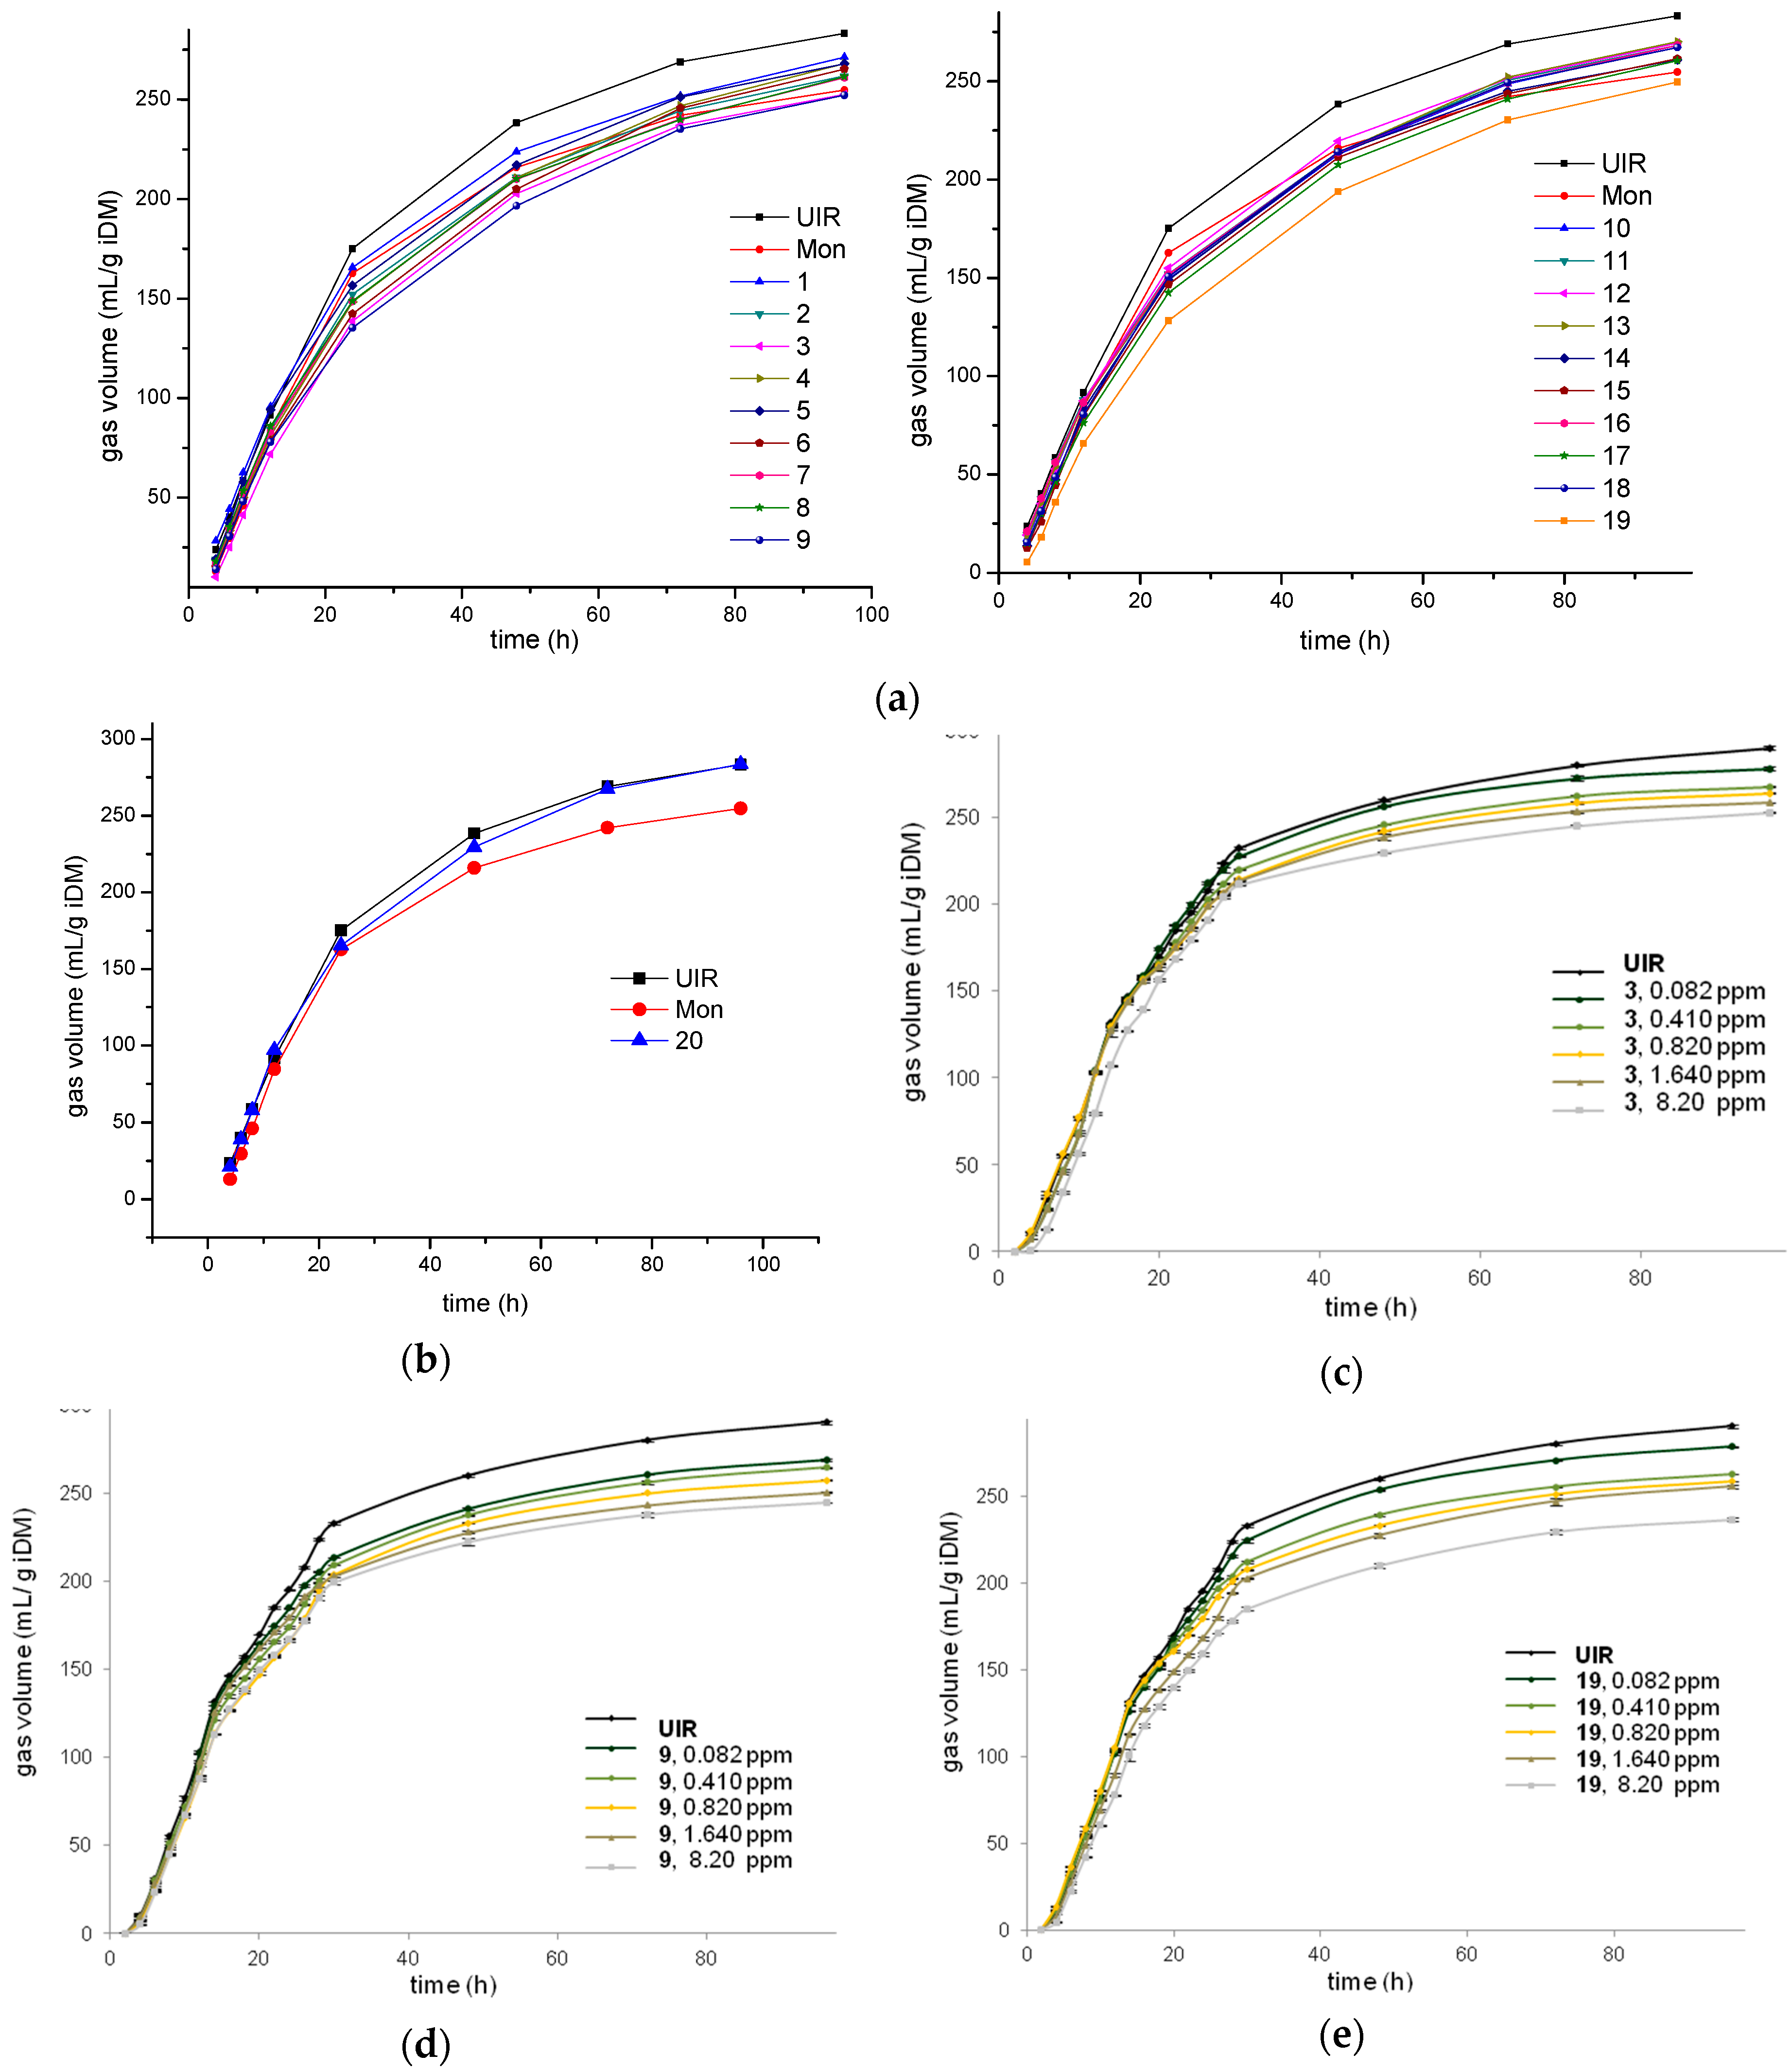
The dynamics of the total gas production after the independent inoculation of the nineteen studied N-oxides and the controls, i.e., the non-N-oxide compound 20 (Figure 2) and the antibiotic ionophore Mon, at 0.82 ppm [34], are shown in Figure 3a. At the end of the experiment, 96 h after inoculation, Mon significantly diminished gas production and increased the lag time, i.e., 254.9 mL/g iDM (mL of gas per gram of incubated dry matter) and 3.1 h, respectively, compared to the untreated incubated rumen (UIR, p < 0.05). In this study, UIR was the highest gas producer and had the lowest lag time, 287.3 mL/g iDM and 2.1 h, respectively. Among the N-oxides, quinoxaline dioxide 3, benzofuroxan 9, and methylfuroxan 19 were the most interesting ones in this assay. Specifically, at the end of the experiment, they significantly decreased the total gas produced (p < 0.05, with respect to UIR). For example the “a” values, defined by McDonald [35] as the total gas produced at the time t (according to the model: V = a × (1 − e[kd × (t − lag)]), see Materials and Methods Section), were 261.1 mL/g iDM for 3, 262.5 mL/g iDM for 9, and 260.7 mL/g iDM for 19. Additionally, N-oxides 3 and 19 displayed similar (p < 0.05) lag times compared to that of Mon, 2.9 and 3.4 h, respectively, while benzofuroxan 9 had a similar lag time compared to UIR, i.e., 1.9 h. The constant gas production rates, kd (according to McDonald model [35]), for these N-oxides were significantly different (p < 0.05) from that of Mon and UIR, i.e., 0.035 h−1 for 3, 0.032 h−1 for 9 and 19, 0.046 h−1 for Mon, and 0.041 h−1 for UIR.
The rest of the studied N-oxides also affected the gas production, which was smaller than the UIR production; however, in all cases, they generated more gas than Mon (p < 0.05). The non-N-oxide control, which was structurally related to benzofuroxan 9 (Figure 2) with the same lateral chain, compound 20, displayed a behavior not significantly different from that of UIR (Figure 3b).
Gas production dose–response studies were performed for the N-oxides with the lowest gas production rates (kd), i.e., 3, 9, and 19 (Figure 3c–e), using 0.082, 0.41, 0.82, 1.64, and 8.20 ppm concentrations. The N-oxides linearly decreased gas production with the dose increments. For example, benzofuroxan 9 decreased gas production “a”, with respect to the control, from 9.7% at 0.082 ppm to 17.4% at 8.20 ppm. Similarly, methylfuroxan 19 decreased “a” from 9.9% to 18.3% at the ranged doses. For these three N-oxides, the degradation rates and the lag times were not modified with changes in dose.

2.2. Effect of the Studied Compounds on Rumen pH

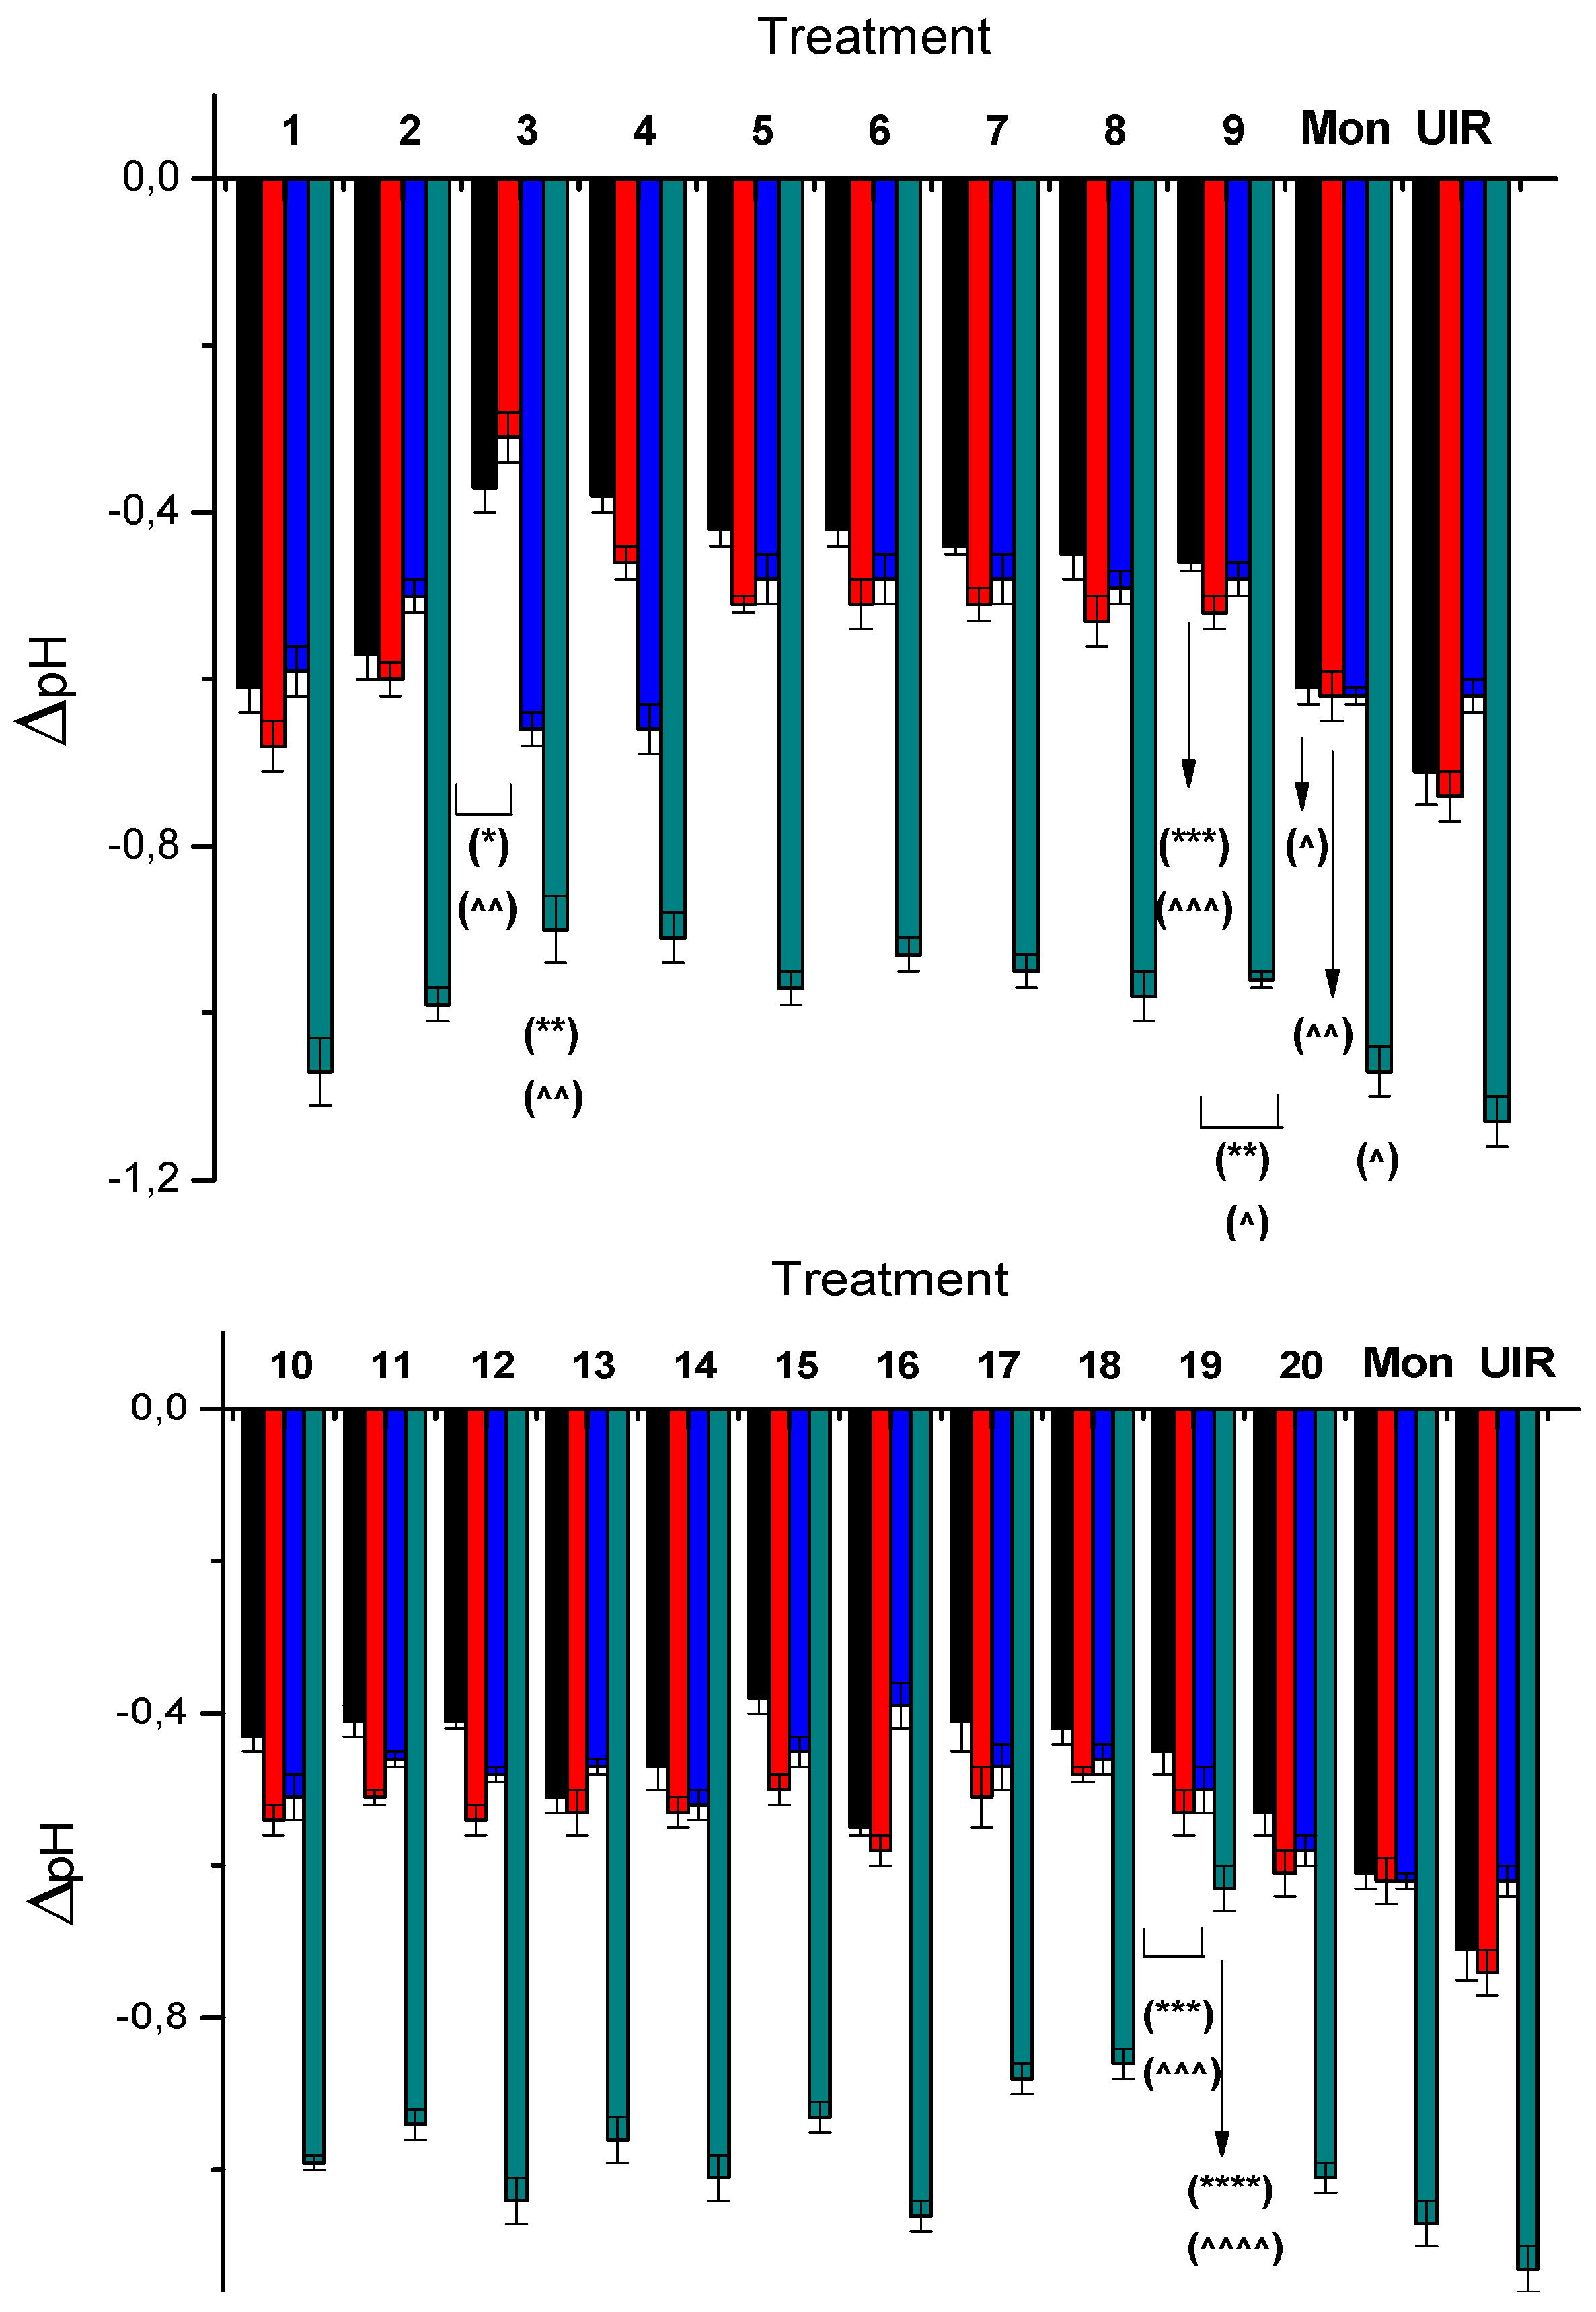
Under fermentation conditions, the pH of UIR was maintained near 6.6 without significant variations at the first analyzed times (4, 6, and 12 h). The UIR pH fell to 6.1 at the end of the assay (for complete information about values of pH at the different analyzed times see Supplementary Materials, Table S1). The positive control Mon was able to modify this profile at 4, 6, and 96 h post incubation with lower modifications in the pHs (see variations of ΔpH in Figure 4). On the other hand, some N-oxide derivatives were able to maintain the change of the rumen pH, ΔpH (Figure 4), lower than both values for Mon and UIR at 4 h post inoculation, i.e., quinoxaline dioxide 3, triazine 4-oxide 4, the benzofuroxans (59), indazole 1-oxides 1012, benzimidazole dioxide 15, and furoxans 1719. Quinoxaline dioxide 3 maintained the rumen pH above 6.6 until 6 h post inoculation with a ΔpH significantly lower than both values for Mon and UIR; however, 3 together with triazine 4-oxide 4 produced a lower pH than Mon and UIR after 12 h of incubation, with values (Table S1) decreasing to 6.3. Furoxan 16 was able to maintain the pH nearly constant between 6 and 12 h after inoculation, reaching a pH value of up to 6.7. However, the stability studies showed that it was biotransformed by the rumen; therefore, the chemical identity of the species responsible for the changes in pH was not guaranteed. At the end of the assay, 96 h after inoculation, the pH fell below 6.2 in all of the studied cases, including Mon and UIR, except for methylfuroxan 19. It was able to maintain the pH at 6.4. Additionally, methylfuroxan 19 was able to produce changes in the pH significantly lower than the corresponding changes for both Mon and UIR at all the studied times (Figure 4).

2.3. Effect of the Studied Compounds on the Rumen Short-chain Fatty Acid (SCFA) Composition. Whole Ruminal Fluid 1H NMR-Metabolic Profile

Several techniques have been described for determining rumen SCFA composition. One of the most relevant is gas chromatography (GC) [36]. Apart from the requirement equipment, GC involves sample processing, like chemical pre-treatment (with perchloric acid), centrifugation, or filtration, and studied SCFA standard reagents. The use of structural spectroscopy techniques, like NMR, which allow for the unambiguous identification of metabolites has been poorly described [37]. In this work, we performed the analysis of whole-ruminal fluid without pre-treatment by 1H NMR spectroscopy focusing our efforts on the analysis of Ace, Prop, But, and Lac concentrations.
The effect of the studied compounds on the rumen SCFA concentration at 0 to 96 h of incubation was studied. These metabolites show characteristic signals in the 1H NMR spectrum (Supplementary Materials, Figure S1). The decrease in pH in UIR at the end of the assays was not due to the formation of Lac, as evidenced by the absence of the corresponding 1H NMR signal for this SCFA (doublet at 1.316 ppm [38], Figure S1a). The lower pH may have been due to 29.6 mM of Ac, which is the SCFA with the lowest pKa (4.76 at 25 °C) among the studied acids. Similarly, at 96 h, Mon-treated rumen fluid did not show Lac, while the concentration of acetate ([Ac]) was lower (p < 0.05), i.e., 23.7 mM, compared to UIR; the concentration of propionate ([Prop]), the SCFA with the highest pKa (4.87 at 25 °C), was higher (p < 0.08), i.e., 15.4 mM, compared to that of UIR, i.e., 13.8 mM (Figure S1a). The mild acidosis at 12 h post inoculation produced by quinoxaline dioxide 3 could have been the result of the higher concentration of Ac (p < 0.05), i.e., 25.4 mM, compared to that of UIR, i.e., 22.0 mM, because [Prop] and the concentration of butyrate ([But]) were not significantly different between 3 and UIR and due to the absence of Lac (Figure S1b). On the other hand, methylfuroxan 19, with an adequate pH value at the end of the assay (Table S1), had the highest [But] and was the SCFA with the intermediate pKa (4.83 at 25 °C), i.e., 11.4 mM. The [But] was significantly different (p < 0.05) from those of UIR and Mon, i.e., 8.3 mM and 8.5 mM, respectively. Methylfuroxan 19 also had the highest [Prop], i.e., 15.8 mM, which was significantly different (p < 0.052) from that of UIR (Figure S1a). The [Ac] at this time, i.e., 30.4 mM, was not significantly different from that of UIR.
For the N-oxides with the lowest kd, i.e., 3, 9, and 19, when the effect on the rumen SCFA concentrations was analyzed, compared to UIR, Mon, and 20 (Table 1), it should be highlighted: (i) Methylfuroxan 19 displayed lower [Ac]/[Prop] and [Ac]/[But] ratios than those of UIR at the end of the assays (p < 0.05); (ii) Additionally, methylfuroxan 19 had the lowest [Ac]/[But] ratio, and it was significantly different (p < 0.05) from that of Mon; (iii) The N-oxides 3 and 9, such as Mon, also significantly decreased (p < 0.05) the [Ac]/[But] ratio at 96 h post inoculation compared to UIR; (iv) Mon rumen SCFA behavior was very different from that of the selected N-oxides. It significantly decreased the [Ac]/[Prop] ratio during the assays; (v) On the other hand, the nitrothiophene derivative 20, which was initially proposed as the negative control, displayed a behavior similar to UIR.

3. Discussion

Among the N-oxides, three different compounds, i.e., 3, 9, and 19, had the highest gas inhibition effects in the in vitro study, which were close to 10% during all of the treatments and at the same dose as Mon, compared to UIR. Therefore, these compounds could be interesting tools for gas mitigation. Ruminant gas production of CO2, CH4, and H2S represents nearly 80% of greenhouse gas emissions from the livestock sector, 90% of which results from rumen microbial methanogenesis and represents a loss of energy for animal production. Consequently, many studies have been conducted to increase feed efficiency through the manipulation of rumen fermentation. In this sense, we previously observed [39,40] that gas emissions from grazing animals could be reduced by up to 14% by improving pasture quality. The herein studied compounds could be used as an alternative strategy and could be combined with high-quality pastures to reduce these emissions. According to our studies on steer rumen aliquots, quinoxaline dioxide 3 decreased kd by 15% with respect to UIR and with a concomitant increase in the lag time of 38%. Quinoxaline dioxides, such as carbadox, olaquindox, and mequindox [41,42], have been used to prevent bacterial infections and to improve animal growth due to their actions against gram-positive and gram-negative bacteria. However, currently they are banned due to health concerns over their (and their metabolites’) toxic effect of oxidative stress [43]. Nevertheless, quinoxaline dioxide 3 is structurally unrelated to these commercial agents because it is a hypoxic-selective cytotoxin [44], ensuring its action at the anaerobic-rumen level and not on the oxygenated tissues of the livestock. On the other hand, benzofuroxan 9 decreased kd by 22% with respect to UIR without changes in the lag time. Derivative 9 is structurally different from the rest of the studied benzofuroxans (58, Figure 2), without relevant activities as rumen modifiers, in its benzo-substituent. This substituent is similar to that present in the commercial quinoxaline carbadox, which led us to think that its rumen-modifying activity could be due to this moiety. For that reason, we included compound 20 from our chemo-library, which has this group, in the assays (Figure 2). However, the biological behavior of nitrothiophene 20 confirmed that this moiety by itself is not responsible for the evaluated bioactivities. Finally, methylfuroxan 19 decreased kd by 22%, with respect to UIR, with a concomitant increase in the lag time of 62%. It was the best of the studied N-oxides as it decreased gas production by nearly 18% at a 8.20 ppm dose (Figure 3e). Comparing derivative 19 to the rest of the furoxans, it is the most lipophilic one due to the hexyl-moiety attached at the semicarbazone group. This could result in a better interaction with the biotarget. Additionally, we previously found furoxans, and specifically melthylfuroxans, were not mutagenic [25,45,46]—a relevant feature when considering methylfuroxan 19 as potential agent to be supplied to production animals.
Normally, the rumen environment has a pH of 6.5. Subacute acidosis has been defined by rumen pH values lower than 5.5–5.8 for several hours a day [47] and acute acidosis by pH values below 5.2 [48]. Ruminal acidosis, initiated by bacteria that produce Lac, results in diarrhea, the production of endotoxins, and cardiovascular and respiratory collapse. Animals respond to this metabolic disorder by reducing their dry matter intake, which reduces milk yield [49]. All of our studied N-oxides were able to maintain, at each time-point, the pH changes in the incubated rumen lower than the changes for untreated incubated rumen (UIR). During the incubations, and according to the 1H NMR experiments, Lac was not observed in any of the cases. At the end of the assays, all the studied compounds, except methylfuroxan 19, reached a pH of approximately 6.1, similar to those of UIR and Mon. However, derivative 19 maintained the pH at 6.4 showing the significantly smallest ΔpH at 96 h post inoculation. This could be the result of 19 increasing the molar concentration of Prop, like Mon, i.e., 15.8 mM and 15.4 mM, respectively, and the molar concentration of But, unlike Mon, i.e., 11.4 mM and 8.5 mM, respectively. These results indicate that methylfuroxan 19, which also modified the gas production profile, is a promising fermentation modifier.
The NMR study of metabolites of the whole ruminal fluid performed herein highlights the relevance of this robust methodological alternative where it is not necessary to process samples or use standards, allowing unequivocal evidence of the chemical entities present in the studied biosystem [37] with shorter analysis times than other traditional methods (acquisition time + processing time: lower than 15 min).
Based on the data obtained from the present study, it could be concluded that some N-oxides positively affected the fermentation characteristics. However, methylfuroxan 19 seems to be the most promising among the other identified N-oxides in terms of the expected behavior, gas inhibition effects, and controlled pH. Meanwhile, comprehensive in vivo studies with animal hosts need to be undertaken to evaluate the sustainability of 19 supplementation on rumen fermentation modification without detrimental effects on the animal as a whole.

4. Materials and Methods

4.1. Studied Compounds

The studied compounds (Figure 2) were obtained from our chemo-library after checking their integrity and purity. In some cases, we needed to resynthesize them, and for that process, we followed previously described procedures [17,18,19,21,22,23,24]. Mon was used as the positive control.

4.2. Experimental Design

Two experiments were developed. First, all of the compounds were assayed at a fixed dose of 0.82 ppm and were compared with Mon used at the same dose [34]. For this purpose, the compounds were incubated in hermetically sealed bottles to study fermentation as described below. The gas produced for different incubation times was measured in three bottles per compound (replicates). Additionally, two bottles per compound and time (replicates) at incubation times of 0, 4, 6, and 12 h were prepared, simultaneously incubated, and opened to determine the pH and the SCFA content. The entire trial was repeated twice (repetitions).
Second, for the most relevant N-oxides (with the lowest gas production rates (kd)), a dose–response assay was performed at 0.082, 0.41, 0.82, 1.64, and 8.20 ppm and compared with Mon at the same doses, using the same replications and runs as in the first assay.

4.3. In Vitro Rumen Assays

Rumen fluid was collected from cannulated steer (Hereford x Holstein male, 440 ± 2 kg body weight), fed a 73% forage (fresh pasture, Lolium multiflorum) and 27% concentrate (corn grain and sunflower meal) diet at an intake level of 2.4% of the body weight. Animals had free access to water and were handled according to a procedure approved by the Bioethics Committee of the Veterinary Faculty (Universidad de la República, Montevideo, Uruguay). The rumen fluid was collected from steer approximately 1–2 h after the beginning of the main meal, and it was then filtered through two layers of cheesecloth into a 1 L two-layer, pre-warmed (39 °C) vessel with no remaining air space and purged with deoxygenated CO2. The vessels were sealed and transported to the laboratory within 30 min.
The in vitro gas production protocol was carried out as described by Cajarville et al. [50]. Briefly, the rumen fluid (10 mL) was dispensed into pre-warmed 125 mL bottles containing the substrate (0.5 g of a mixture of corn, 0.165 g, and alfalfa, 0.335 g, ground through a 1 mm sieve) and the milieu (40.5 mL). The milieu (purged with deoxygenated CO2) was prepared by mixing 38 mL of a basal solution (free of N), 2 mL of a bicarbonate buffer, and 0.5 mL of a reducing agent [51]. All ingredients were mixed under a stream of CO2, which flowed into the bottles prior to sealing with butyl rubber stoppers and aluminum crimp seals. Each studied compound dissolved in dimethylsulfoxide (DMSO, 0.5 mL) was dispensed into 1 mL calibrated syringes. Assays only with DMSO (0.5 mL) were included as the UIR. A control without DMSO was also included in the studies to confirm that this amount of DMSO did not affect the systems under study. The mixtures were incubated for 96 h at 39 °C, and each treatment had five replicates, performed in two different runs (Supplementary Materials, Figure S2).
Gas readings were manually taken at 4, 6, 8, 12, 24, 48, 72, and 96 h post-inoculation using a hypodermic syringe (0.8 mm) connected to a digital manometer (SperScientific, 840065, Scottsdale, AZ, USA). After each reading, the gas was vented from the bottle with the syringe. The measured pressure (in psi) was converted into volume (mL), using a calibration equation obtained previously under similar conditions, by connecting the manometer to a three-way stopcock with a syringe to measure gas volume (in mL) and a needle to insert it into the bottles. Readings were corrected for blanks using bottles with buffered rumen fluid without substrate (three per run). The cumulated gas for each incubation time until 96 h was expressed as mL/mass (g) of incubated dry matter (iDM) and fitted to the model proposed by McDonald [35]: V = a × (1 − e[kd × (t − lag)]), where “V” (mL/g iDM) is the gas produced at time t, “a” (mL/g iDM) is the total gas produced, “kd” (h−1) is the constant gas production rate, “t” (h) is the time of fermentation, and “lag” (h) is the lag time of gas production.
Measurement of pH. At 0, 4, 6, 12, and 96 h time points for the measurement of gas production, some replicate-bottles were opened, and an aliquot of the milieu was taken to immediately measure the pH using a portable digital pH-meter (EV-05991-36, Cole Parmer, Vernon Hills, IL, USA). The probe was calibrated following manufacturer standard protocol. The probe reading was also confirmed with respective standard buffer solutions (pH range: 5.0–8.0) before each measurement to ensure accuracy. The pH changes were expressed as ΔpH defined as pHinitial − pHstudied time in each checkpoint.
Stability of the N-oxides under the rumen incubation conditions. All of the studied compounds were incubated under the conditions indicated above for 96 h. Afterwards, the organic compounds were extracted with ethyl acetate, evaporated, and chromatographically analyzed.

4.4. NMR Analysis and Data Processing

Firstly, the procedure was validated. Accuracy and precision: 96.8% and 1.2%, respectively, for [Ac]; 98.5% and 0.9%, respectively, for [Prop]; 98.9% and 2.6%, respectively, for [But]. Concentration linearity, between 100 to 1 mM, was checked for each metabolite to yield linear standard plots (r2 > 0.99).
At 0, 4, 6, 12, and 96 h time points for the measurement of gas production, an aliquot (0.5 mL) was taken from the replicate-bottles to determine the SCFA concentrations. For the NMR spectroscopic studies, each aliquot was centrifuged at 3000× g for 10 min. Before measuring, 0.01 mL of dimethylformamide, as internal standard, and 0.09 mL of D2O were added to 0.5 mL of the supernatant in 5 mm NMR (Aldrich, St. Louis, MI, USA) sample tubes. One-dimensional 1H NMR spectra, 1H-1H homonuclear, and inverse-detected 1H-13C correlation experiments were recorded on a Bruker DPX-400 spectrometer at 22.16 °C, operating at a proton NMR frequency of 400.13 MHz. D2O was used as the internal lock. Each 1H NMR spectrum consisted of 64 scans requiring 10 min and 26 s acquisition time with the following parameters: 0.16 Hz/point, pulse width (PW) = 30° (11.3 ms), and relaxation delay (RD) = 1.5 ms. A pre-saturation sequence was used to suppress the residual H2O signal with low power selective irradiation at the H2O frequency during the recycle delay. FIDs were Fourier transformed with LB = 0.3 Hz. The resulting spectra were manually phased, baseline corrected, and referenced to internal standard, using Mestre Nova software version 6.0. The chemical displacements used to identify the respective SCFA were previously confirmed by adding each analyzed metabolite to the studied supernatant, as well as by a control solution with 4 mg mL−1 of each SCFA in a phosphate buffer, pH = 7.4, using one-dimensional 1H NMR spectra, 1H-1H homonuclear and inverse-detected 1H-13C correlation experiments. The chemical shifts (δ, ppm) and multiplicity of the SCFA are But, 0.881, triplet; Prop, 1.042, triplet; Lac, 1.316, doublet; Ace, 1.904, singlet. Two controls were used: one with fresh milieu with the corresponding concentration of DMSO used in the samples, and another with UIR. The 1H NMR spectra were automatically reduced to ASCII files. Spectral intensities were scaled to internal standard and reduced to integrated regions of equal width (0.04) corresponding to the region of δ 0.0–10.0 by AMIX software. The region of δ 4.85–4.95 ppm was excluded from the analysis because of the residual signal of H2O [38,52,53,54,55].
Statistical Analysis. The data were analyzed using SAS (SAS Institute Inc., Cary, NC, USA, 2000). The cumulated gas during the incubation times was measured and fitted to the exponential model described, proposed by non-linear regression. The parameters obtained by this regression (a, kd, and lag), pH, and NMR were compared between compounds using PROC GLM of the SAS package, including the treatment and run in the model. Unless otherwise stated, the means were compared using a Tukey test.

Supplementary Materials

The following are available online at https://www.mdpi.com/2218-1989/9/4/62/s1, Figure S1: The selected region of the whole-rumen 1H NMR without (a, left, t = 96 h; b, left, t = 12 h) and with treatment (a, center, Mon, t = 96 h; a, right, furoxan 19, t = 96 h; b, left, quinoxaline dioxide 3, t = 12 h). The structures of SCFA are shown as a guide (a, left); the signals used for quantifications are marked with full arrows, and those used for identifications are marked with dotted arrows, Figure S2: Schematic experimental protocol. This protocol was applied for compounds 120, Mon, and untreated incubated rumen (UIR). The dose-response (gas production) studies were performed similarly (run 1–2 and replicates 1–3) for N-oxides 3, 9, and 19, compound 20, Mon, and UIR, Table S1: Values of pH, during time, in the different rumen-treatments. In green are highlighted some relevant time-points (see text).

Author Contributions

Conceptualization, J.L.R., H.C., C.C. and M.G.; methodology, H.C., C.C. and M.G.; formal analysis, C.B., G.R. and A.P.-R.; investigation, C.B. and G.R.; writing—original draft preparation, H.C. and M.G.; writing—review and editing, A.P.-R., J.L.R., H.C., C.C. and M.G.

Funding

This research was funded by Agencia Nacional de Investigación e Innovación (ANII, Uruguay), grant number FSA 2013-12990. C.B. and G.R. thank ANII (Uruguay) for their scholarships.

Conflicts of Interest

The authors declare no conflict of interest. The funders had no role in the design of the study; in the collection, analyses, or interpretation of data; in the writing of the manuscript; or in the decision to publish the results.

References

  1. Miller, T.L. Ecology of methane production and hydrogen sinks in the rumen. In Ruminant Physiology: Digestion, Metabolism, Growth and Reproduction, Proceedings of the 8th International Symposium of Ruminant Physiology; Von Engelhardt, W., Leonhard-Marek, S., Breves, G., Giesecke, D., Eds.; Ferdinand Enke Verlag: Stuttgart, Germany, 1995; pp. 317–331. [Google Scholar]
  2. United Nations Framework Convention on Climate Change. Greenhouse Gas Inventory Data; United Nations: Bonn, Germany, 2006; Available online: unfccc.int (accessed on 6 December 2018).
  3. Sarker, N.C.; Keomanivong, F.; Borhan, M.; Rahman, S.; Swanson, K. In vitro evaluation of nano zinc oxide (nZnO) on mitigation of gaseous emissions. J. Anim. Sci. Technol. 2018, 60, 27. [Google Scholar] [CrossRef] [PubMed]
  4. Bhatta, R.; Saravanan, M.; Baruah, L.; Sampath, K.; Prasad, C.S. Effect of plant secondary compounds on in vitro methane, ammonia production and ruminal protozoa population. J. Appl. Microbiol. 2013, 115, 455–465. [Google Scholar] [CrossRef] [Green Version]
  5. Flachowsky, G.; Lebzien, P. Effects of phytogenic substances on rumen fermentation and methane emissions: A proposal for a research process. Anim. Feed. Sci. Technol. 2012, 176, 70–77. [Google Scholar] [CrossRef]
  6. Hook, S.E.; Wright, A.-D.W.; McBride, B.W. Methanogens: Methane producers of the rumen and mitigation strategies. Archaea 2010, 2010, 945785. [Google Scholar] [CrossRef]
  7. Llonch, P.; Haskell, M.J.; Dewhurst, R.J.; Turner, S.P. Current available strategies to mitigate greenhouse gas emissions in livestock systems: An animal welfare perspective. Animal 2017, 11, 274–284. [Google Scholar] [CrossRef]
  8. Martin, C.; Morgavi, D.P.; Doreau, M. Methane mitigation in ruminants: From microbe to the farm scale. Animal 2010, 4, 351–365. [Google Scholar] [CrossRef]
  9. Bodas, R.; Prieto, N.; García-González, R.; Andrés, S.; Giráldez, F.J.; López, S. Manipulation of rumen fermentation and methane production with plant secondary metabolites. Anim. Feed Sci. Technol. 2012, 176, 78–93. [Google Scholar] [CrossRef] [Green Version]
  10. Abad, P.; Arroyo-Manzanares, N.; Gil, L.; García-Campaña, A.M. Use of onion extract as a dairy cattle feed supplement: Monitoring propyl propane thiosulfonate as a marker of its effect on milk attributes. J. Agric. Food Chem. 2017, 65, 793–799. [Google Scholar] [CrossRef]
  11. Jafari, S.; Meng, G.Y.; Rajion, M.A.; Jahromi, M.F.; Ebrahimi, M. Manipulation of rumen microbial fermentation by polyphenol rich solvent fractions from Papaya leaf to reduce green-house gas methane and biohydrogenation of C18 PUFA. J. Agric. Food Chem. 2016, 64, 4522–4530. [Google Scholar] [CrossRef]
  12. Santana, A.; Ríos, J.A.; González, M.; Cerecetto, H.; Cajarville, C.; Repetto, J.L. Use of ethanol extracts of Schinus longifolius (Molle) and Eucalyptus grandis (Eucalipto) to modulate the in vitro fermentation and protein degradation estimated by the concentration of ammonia N. Veterinaria (Montevideo) 2012, 48, 15–19. [Google Scholar]
  13. Cabrera, M.; Mastandrea, I.; Otero, G.; Cerecetto, H.; González, M. In vivo phase II-enzymes inducers, as potential chemopreventive agents, based on the chalcone and furoxan skeletons. Bioorg. Med. Chem. 2016, 24, 1665–1674. [Google Scholar] [CrossRef]
  14. Fernández, S.; Berchesi, A.; Tejeria, E.; Sanz, I.; Cerecetto, H.; González, M.; Lavaggi, M.L.; Rey, A. Preparation and biological evaluation of (99m)Tc-labelled phenazine dioxides as potential tracers for hypoxia imaging. Curr. Radiopharm. 2015, 8, 56–61. [Google Scholar] [CrossRef] [PubMed]
  15. Dos Santos, J.L.; Lanaro, C.; Chelucci, R.C.; Gambero, S.; Bosquesi, P.L.; Reis, J.S.; Lima, L.M.; Cerecetto, H.; González, M.; Costa, F.F.; Chung, M.C. Design, synthesis, and pharmacological evaluation of novel hybrid compounds to treat sickle cell disease symptoms. Part II: Furoxan derivatives. J. Med. Chem. 2012, 55, 7583–7592. [Google Scholar] [CrossRef]
  16. Hernández, P.; Cabrera, M.; Lavaggi, M.L.; Celano, L.; Tiscornia, I.; Rodrigues da Costa, T.; Thomson, L.; Bollati-Fogolín, M.; Miranda, A.L.; Lima, L.M.; et al. Discovery of new orally effective analgesic and anti-inflammatory hybrid furoxanyl N-acylhydrazone derivatives. Bioorg. Med. Chem. 2012, 20, 2158–2171. [Google Scholar] [CrossRef]
  17. Cerecetto, H.; Dias, E.; Di Maio, R.; González, M.; Pacce, S.; Saenz, P.; Seoane, G.; Suescun, L.; Mombrú, A.; Fernández, G.; et al. Synthesis and herbicidal activity of N-oxide derivatives. J. Agric. Food Chem. 2000, 48, 2995–3002. [Google Scholar] [CrossRef] [PubMed]
  18. Monge, A.; López de Ceráin, A.; Ezpeleta, O.; Cerecetto, H.; Dias, E.; Di Maio, R.; González, M.; Onetto, S.; Seoane, G.; Suescun, L.; et al. Synthesis and biological evaluation of 1,2,5-oxadiazole N-oxide derivatives as hypoxia-selective cytotoxins. Pharmazie 1998, 53, 758–764. [Google Scholar] [PubMed]
  19. Lavaggi, M.L.; Aguirre, G.; Boiani, L.; Orelli, L.; García, B.; Cerecetto, H.; González, M. Pyrimido [1,2-a]quinoxaline 6-oxide and phenazine 5,10-dioxide derivatives and related compounds as growth inhibitors of Trypanosoma cruzi. Eur. J. Med. Chem. 2008, 43, 1737–1741. [Google Scholar] [CrossRef]
  20. Benitez, D.; Cabrera, M.; Hernández, P.; Boiani, L.; Lavaggi, M.L.; Di Maio, R.; Yaluff, G.; Serna, E.; Torres, S.; Ferreira, M.E.; et al. 3-Trifluoromethylquinoxaline N,N′-dioxides as anti-trypanosomatid agents. Identification of optimal anti-T. cruzi agents and mechanism of action studies. J. Med. Chem. 2011, 54, 3624–3636. [Google Scholar] [CrossRef] [PubMed]
  21. Gerpe, A.; Aguirre, G.; Boiani, L.; Cerecetto, H.; González, M.; Olea-Azar, C.; Rigol, C.; Maya, J.D.; Morello, A.; Piro, O.E.; et al. Indazole N-oxide derivatives as antiprotozoal agents: Synthesis, biological evaluation and mechanism of action studies. Bioorg. Med. Chem. 2006, 14, 3467–3480. [Google Scholar] [CrossRef]
  22. Castro, D.; Boiani, L.; Benitez, D.; Hernández, P.; Merlino, A.; Gil, C.; Olea-Azar, C.; González, M.; Cerecetto, H.; Porcal, W. Anti-trypanosomatid benzofuroxans and deoxygenated analogues: Synthesis using polymer-supported triphenylphosphine, biological evaluation and mechanism of action studies. Eur. J. Med. Chem. 2009, 44, 5055–5065. [Google Scholar] [CrossRef] [Green Version]
  23. Cerecetto, H.; Di Maio, R.; González, M.; Risso, M.; Saenz, P.; Seoane, G.; Denicola, A.; Peluffo, G.; Quijano, C.; Olea-Azar, C. 1,2,5-Oxadiazole N-oxide derivatives and related compounds as potential antitrypanosomal drugs: Structure-activity relationships. J. Med. Chem. 1999, 42, 1941–1950. [Google Scholar] [CrossRef]
  24. Boiani, M.; Boiani, L.; Denicola, A.; Torres de Ortiz, S.; Serna, E.; Vera de Bilbao, N.; Sanabria, L.; Yaluff, G.; Nakayama, H.; Rojas de Arias, A.; et al. 2H-benzimidazole 1,3-dioxide derivatives: A new family of water-soluble anti-trypanosomatid agents. J. Med. Chem. 2006, 49, 3215–3224. [Google Scholar] [CrossRef]
  25. Hernández, P.; Rojas, R.; Gilman, R.H.; Sauvain, M.; Lima, L.M.; Barreiro, E.J.; González, M.; Cerecetto, H. Hybrid furoxanyl N-acylhydrazone derivatives as hits for the development of neglected diseases drug candidates. Eur. J. Med. Chem. 2013, 59, 64–74. [Google Scholar] [CrossRef]
  26. Yadav, P.; Marshall, A.J.; Reynisson, J.; Denny, W.A.; Hay, M.P.; Anderson, R.F. Fragmentation of the quinoxaline N-oxide bond to the ˙OH radical upon one-electron bioreduction. Chem. Commun. (Camb.) 2014, 50, 13729–13731. [Google Scholar] [CrossRef]
  27. Torres, E.; Moreno-Viguri, E.; Galiano, S.; Devarapally, G.; Crawford, P.W.; Azqueta, A.; Varela, J.; Birriel, E.; Di Maio, R.; Cerecetto, H.; et al. Novel quinoxaline 1,4-di-N-oxide derivatives as new potential antichagasic agents. Eur. J. Med. Chem. 2013, 66, 324–334. [Google Scholar] [CrossRef] [PubMed]
  28. Reybier, K.; Nguyen, T.H.; Ibrahim, H.; Perio, P.; Montrose, A.; Fabre, P.L.; Nepveu, F. Electrochemical behavior of indolone-N-oxides: Relationship to structure and antiplasmodial activity. Bioelectrochemistry 2012, 88, 57–64. [Google Scholar] [CrossRef] [PubMed]
  29. Lavaggi, M.L.; Nieves, M.; Cabrera, M.; Olea-Azar, C.; López de Ceráin, A.; Monge, A.; Cerecetto, H.; González, M. Structural modifications on the phenazine N,N′-dioxide-scaffold looking for new selective hypoxic cytotoxins. Eur. J. Med. Chem. 2010, 45, 5362–5369. [Google Scholar] [CrossRef] [PubMed]
  30. Olea-Azar, C.; Rigol, C.; Mendizábal, F.; Briones, R.; Cerecetto, H.; Di Maio, R.; Risso, M.; González, M.; Porcal, W. Electrochemical and microsomal production of free radicals from 1,2,5-oxadiazole N-oxide as potential antiprotozoal drugs. Spectrochim. Acta A Mol. Biomol. Spectrosc. 2003, 59, 69–74. [Google Scholar] [CrossRef]
  31. Tocher, J.H.; Edwards, D.I. Electrochemical studies of tirapazamine: Generation of the one-electron reduction product. Free Radic. Res. 1994, 21, 277–283. [Google Scholar] [CrossRef]
  32. Lorenzen, J.; Steinwachs, S.; Unden, G. DMSO respiration by the anaerobic rumen bacterium Wolinella succinogenes. Arch. Microbiol. 1994, 162, 277–281. [Google Scholar] [CrossRef]
  33. Cerecetto, V.; Diaz-Viraqué, F.; Irazoqui, I.; Rodríguez, A.; Cajarville, C.; Repetto, J.L.; Lavaggi, M.L.; González, M.; Cerecetto, H. Anaerobic biotransformation of N-oxide containing aromatic heterocycles by bovine ruminal fluid. Rev. Virtual Quim. 2013, 5, 1134–1144. [Google Scholar] [CrossRef]
  34. García, V.; Catalá-Gregori, P.; Madrid, J.; Hernández, F.; Megías, M.D.; Andrade-Montemayor, H.M. Potential of carvacrol to modify in vitro rumen fermentation as compared with monensin. Animal 2007, 1, 675–680. [Google Scholar] [CrossRef]
  35. McDonald, J. A revised model for the estimation of protein degradability in the rumen. J. Agric. Sci. 1981, 96, 251–252. [Google Scholar] [CrossRef]
  36. Filípek, J.; Dvořák, R. Determination of the volatile fatty acid content in the rumen liquid: Comparison of gas chromatography and capillary isotachophoresis. Acta Vet. Brno 2009, 78, 627–633. [Google Scholar] [CrossRef]
  37. Attaelmannan, M.A.; Dahl, A.A.; Reid, R.S. Analysis of volatile fatty acids in rumen fluid by proton NMR spectroscopy. Can. J. Anim. Sci. 1999, 79, 401–404. [Google Scholar] [CrossRef] [Green Version]
  38. Benítez, D.; Casanova, G.; Cabrera, G.; Galanti, N.; Cerecetto, H.; González, M. Initial studies on mechanism of action and cell death of active N-oxide-containing heterocycles in Trypanosoma cruzi epimastigotes in vitro. Parasitology 2014, 141, 682–696. [Google Scholar] [CrossRef]
  39. Fraga, M.; Fernández, S.; Cajarville, C.; Martínez, M.; Abin-Carriquiry, J.A.; Zunino, P. In vitro modulation of rumen microbiota and fermentation by native microorganisms isolated from the rumen of a fed-exclusively-on-pasture bovine. Ann. Microbiol. 2015, 65, 2355–2362. [Google Scholar] [CrossRef]
  40. Dini, Y.; Gere, J.; Cajarville, C.; Ciganda, V. Using highly nutritious pastures to mitigate enteric methane emissions from cattle grazing systems in South America. Anim. Prod. Sci. 2017, 58, 2329–2334. [Google Scholar] [CrossRef]
  41. Xu, F.; Cheng, G.; Hao, H.; Wang, Y.; Wang, X.; Chen, D.; Peng, D.; Liu, Z.; Yuan, Z.; Dai, M. Mechanisms of antibacterial action of quinoxaline 1,4-di-N-oxides against Clostridium perfringens and Brachyspira hyodysenteriae. Front. Microbiol. 2016, 7, 1948. [Google Scholar] [CrossRef] [PubMed]
  42. Looft, T.; Allen, H.K.; Casey, T.A.; Alt, D.P.; Stanton, T.B. Carbadox has both temporary and lasting effects on the swine gut microbiota. Front. Microbiol. 2014, 5, 276. [Google Scholar] [CrossRef]
  43. Wang, X.; Martínez, M.A.; Cheng, G.; Liu, Z.; Huang, L.; Dai, M.; Chen, D.; Martínez-Larrañaga, M.R.; Anadón, A.; Yuan, Z. The critical role of oxidative stress in the toxicity and metabolism of quinoxaline 1,4-di-N-oxides in vitro and in vivo. Drug Metab. Rev. 2016, 48, 159–182. [Google Scholar] [CrossRef]
  44. Monge, A.; Palop, J.A.; López de Ceráin, A.; Senador, V.; Martínez, F.J.; Sainz, Y.; Narro, S.; García, E.; de Miguel, C.; González, M.; et al. Hypoxia-selective agents derived from quinoxaline 1,4-di-N-oxides. J. Med. Chem. 1995, 38, 1786–1792. [Google Scholar] [CrossRef] [PubMed]
  45. Gabay, M.; Cabrera, M.; Di Maio, R.; Paez, J.A.; Campillo, N.; Lavaggi, M.L.; Cerecetto, H.; González, M. Mutagenicity of N-oxide containing heterocycles and related compounds: Experimental and theoretical studies. Curr. Top. Med. Chem. 2014, 14, 1374–1387. [Google Scholar] [CrossRef] [PubMed]
  46. Cabrera, M.; López, G.V.; Gómez, L.E.; Breijo, M.; Pintos, C.; Botti, H.; Raymondo, S.; Vettorazzi, A.; López de Ceráin, A.; Monge, A.; et al. Genetic toxicology and preliminary in vivo studies of nitric oxide donor tocopherol analogs as potential new class of antiatherogenic agents. Drug Chem. Toxicol. 2011, 34, 285–293. [Google Scholar] [CrossRef] [PubMed] [Green Version]
  47. Humer, E.; Aschenbach, J.R.; Neubauer, V.; Kröger, I.; Khiaosa-Ard, R.; Baumgartner, W.; Zebeli, Q. Signals for identifying cows at risk of subacute ruminal acidosis in dairy veterinary practice. J. Anim. Physiol. Anim. Nutr. (Berl.) 2018, 102, 380–392. [Google Scholar] [CrossRef]
  48. Cooper, R.J.; Klopfenstein, T.J.; Stock, R.A.; Milton, C.T.; Herold, D.W.; Parrott, J.C. Effects of imposed feed intake variation on acidosis and performance of finishing steers. J. Anim. Sci. 1999, 77, 1093–1099. [Google Scholar] [CrossRef] [PubMed]
  49. Russell, J.B. The importance of pH in the regulation of ruminal acetate to propionate ratio and methane production. J. Dairy Sci. 1998, 81, 3222–3230. [Google Scholar] [CrossRef]
  50. Cajarville, C.; Britos, A.; Errandonea, N.; Gutiérrez, L.; Cozzolino, D.; Repetto, J.L. Diurnal changes in water-soluble carbohydrate concentration in lucerne and tall fescue in autumn and the effects on in vitro fermentation. N. Zeal. J. Agric. Res. 2015, 58, 281–291. [Google Scholar] [CrossRef]
  51. Williams, B.; Bosch, M.; Boer, H.; Verstegen, M.; Tamminga, S. An in vitro batch culture method to assess potential fermentability of feed ingredients for monogastric diets. Anim. Feed Sci. Technol. 2005, 123–124, 445–462. [Google Scholar] [CrossRef]
  52. Varela, J.; Serna, E.; Torres, S.; Yaluff, G.; Vera de Bilbao, N.I.; Miño, P.; Chiriboga, X.; Cerecetto, H.; González, M. In vivo anti-Trypanosoma cruzi activity of hydro-ethanolic extract and isolated active principles from Aristeguietia glutinosa and mechanism of action studies. Molecules 2014, 19, 8488–8502. [Google Scholar] [CrossRef] [PubMed]
  53. Couto, M.; Sánchez, C.; Dávila, B.; Machín, V.; Varela, J.; Álvarez, G.; Cabrera, M.; Celano, L.; Aguirre-López, B.; Cabrera, N.; et al. 3-H-[1,2]Dithiole as a new anti-Trypanosoma cruzi chemotype: Biological and mechanism of action studies. Molecules 2015, 20, 14595–14610. [Google Scholar] [CrossRef] [PubMed]
  54. Varela, J.; Birriel, E.; Nargoli, J.; Faral-Tello, P.; Robello, C.; Coqueiro, A.; Choi, Y.H.; Cerecetto, H.; González, M. Identification of new anti-Trypanosoma cruzi agents in some Uruguayan plants by NMR-based metabolomic profiling. Arch. Nat. Med. Chem. 2017, ANMC-105. [Google Scholar] [CrossRef]
  55. O’Callaghan, T.F.; Vázquez-Fresno, R.; Serra-Cayuela, A.; Dong, E.; Mandal, R.; Hennessy, D.; McAuliffe, S.; Dillon, P.; Wishart, D.S.; Stanton, C.; et al. Pasture feeding changes the bovine rumen and milk metabolome. Metabolites 2018, 8, 27. [Google Scholar] [CrossRef]
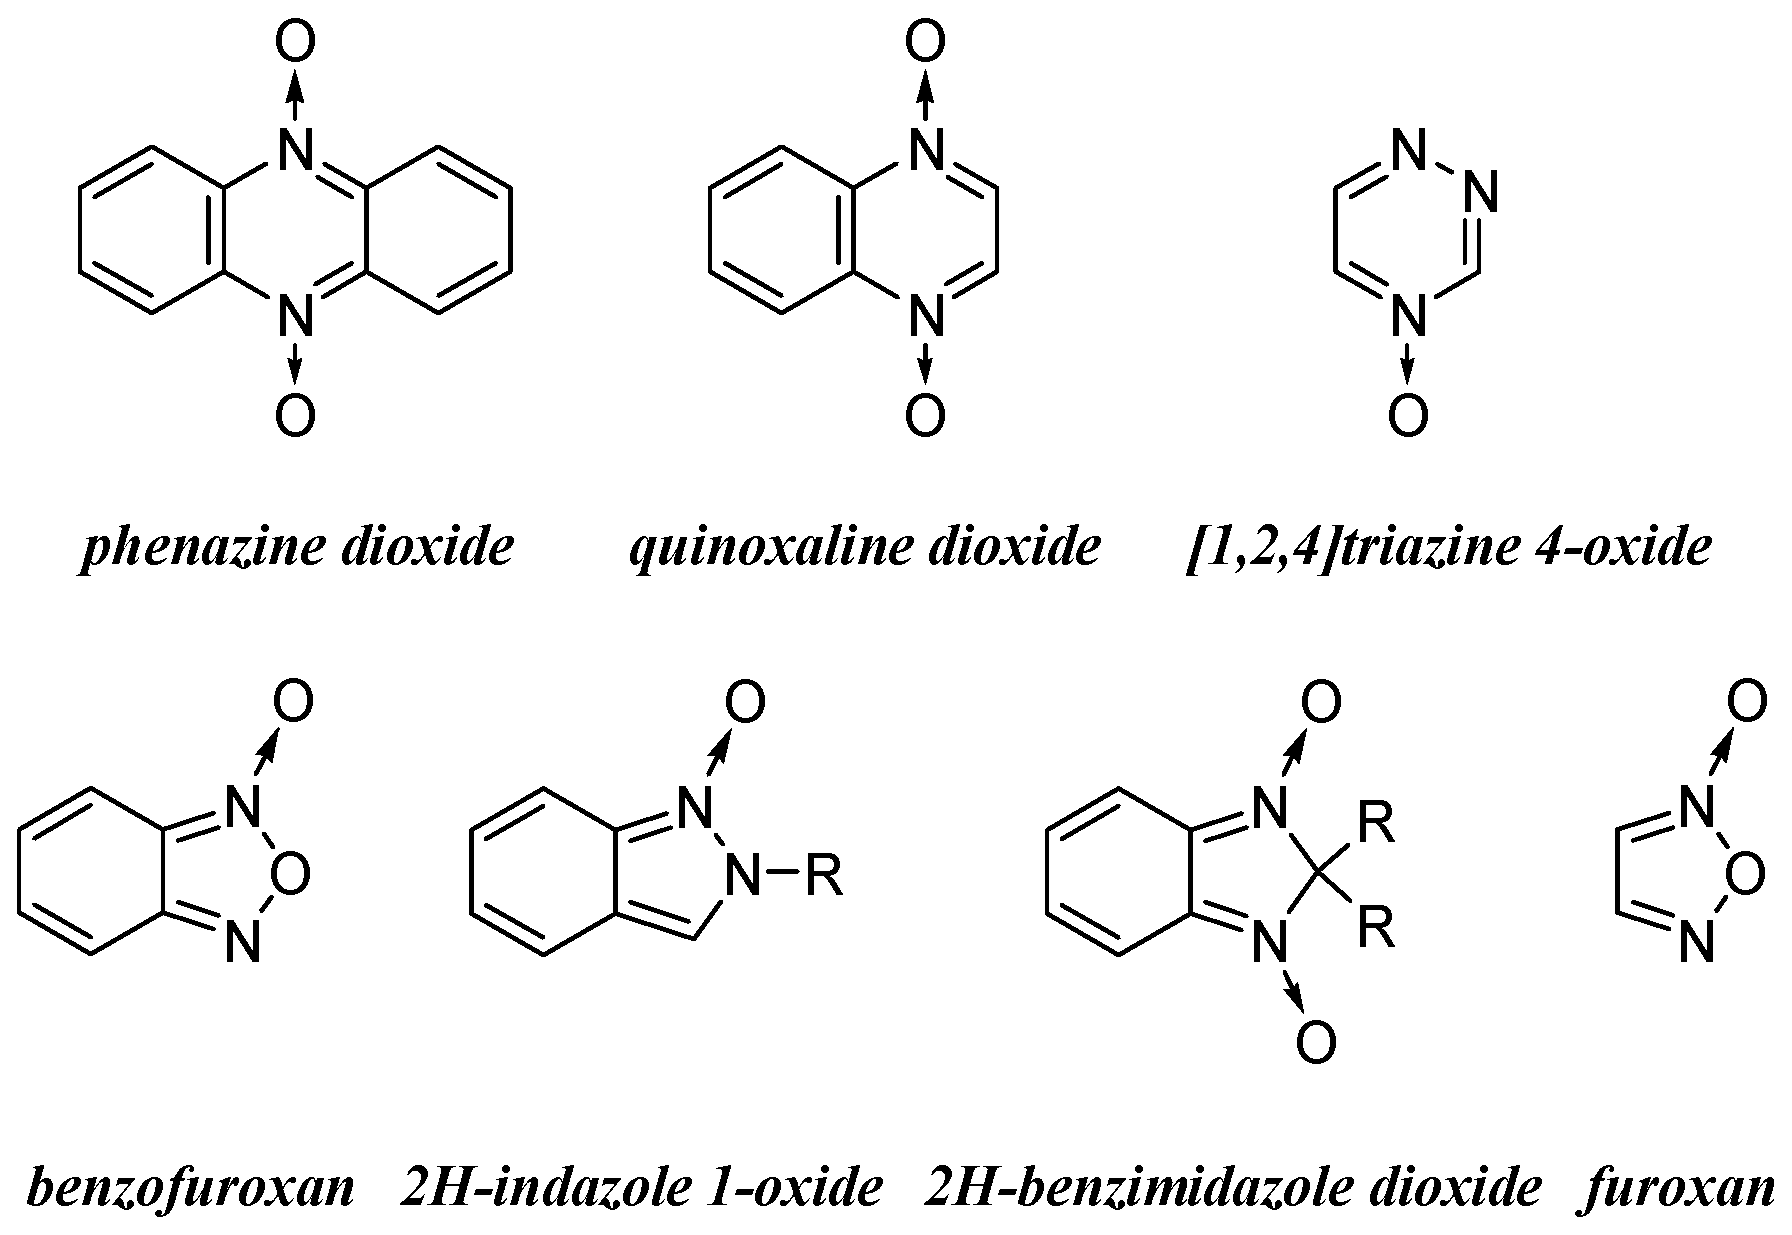
Figure 1. The N-oxide chemotypes selected for the study.
Metabolites 09 00062 g001
Figure 2. The N-oxides and nitrothiophene from our chemo-library studied herein as rumen fermentation modifiers.
Metabolites 09 00062 g002
Figure 3. The rumen dynamics of total gas production with or without the studied N-oxides at 0.82 ppm (a; left: phenazine dioxide, quinoxaline dioxide, triazine 4-oxide, and benzofuroxan derivatives; right: indazole 1-oxide, benzimidazole dioxide, and furoxan derivatives). The error bars were omitted in order to simplify the presentation. The behavior of the selected negative control 20 at 0.82 ppm (b), the dose–response curves of gas production for quinoxaline dioxide 3 (c), benzofuroxan 9 (d) and furoxan 19 (e).
Metabolites 09 00062 g003
Figure 4. The variation in rumen pH, expressed as ΔpH = pHinitial − pHstudied time at each checkpoint, with time of the different treatments for the studied compounds at 0.82 ppm (black: 4 h; red: 6 h; blue: 12 h; green: 96 h). (*) p = 0.04 with respect to Mon; (**) p = 0.03 with respect to Mon; (***) p = 0.008 with respect to Mon; (****) p = 0.001 with respect to Mon; (^) p = 0.04 with respect to UIR; (^^) p = 0.008 with respect to UIR; (^^^) p = 0.004 with respect to UIR; (^^^^) p = 0.001 with respect to UIR.
Metabolites 09 00062 g004
Table 1. Effect of the different compounds on the rumen SCFA concentration ratios.
Ratios[Ac]/[Prop] 1,2[Ac]/[But] 1
Time Post Inoculation12 h96 h12 h96 h
32.25 (***),(#),(&)2.07 (***),(&)3.41 (****),(^),(####),(&),(++)2.79 (^^^^),(&),(++)
92.58 (****),(^),(&&),(++++)2.05 (***),(&)4.03 (^^^^),(&&&&),(++++)2.78 (^^^^),(&),(++)
192.02 (^),(+)1.92 (^^),(++)3.19 (****)c2.67 (*),(^^^^),(++)
Mon1.94 (^^),(++)1.54 (^^^),(+++)4.01 (^^^^),(++++)2.81 (^^),(+)
202.152.163.143.26
UIR2.212.153.283.56
1 (*) p = 0.04 with respect to Mon; (***) p = 0.008 with respect to Mon; (****) p = 0.001 with respect to Mon; (^) p = 0.04 with respect to UIR; (^^) p = 0.03 with respect to UIR; (^^^) p = 0.004 with respect to UIR; (^^^^) p = 0.001 with respect to UIR; (#) p = 0.03 with respect to 9; (####) p = 0.0009 with respect to 9; (&) p = 0.04 with respect to 19; (&&) p = 0.005 with respect to 19; (&&&&) p < 0.001 with respect to 19; (+) p = 0.04 with respect to 20; (++) p = 0.03 with respect to 20; (+++) p = 0.009 with respect to 20; (++++) p < 0.001 with respect to 20. 2 [Ac]12 (mM): 25.4 ± 0.3, for 3-treatment, 28.2 ± 0.3 for 9-treatment, 25.3 ± 0.3 for 19-treatment, 21.3 ± 0.3 for Mon-treatment, 22.6 ± 0.3 for 20-treatment, 22.0 ± 0.3 for UIR; [Ac]96 (mM): 34.6 ± 0. ± 0.4 for 3-treatment, 32.2 ± 0.4 for 9-treatment, 30.4 ± 0.4 for 19-treatment, 23.7 ± 0.3 for Mon-treatment, 27.7 ± 0.4 for 20-treatment, 29.6 ± 0.4 for UIR; [Prop]12 (mM): 11.3 ± 0.1 for 3-treatment, 10.9 ± 0.1 for 9-treatment, 12.5 ± 0.1 for 19-treatment, 11.0 ± 0.1 for Mon-treatment, 10.5 ± 0.1 for 20-treatment, 9.95± 0.09 for UIR; [Prop]96 (mM): 16.7 ± 0.2 for 3-treatment, 15.7 ± 0.1 for 9-treatment, 15.8 ± 0.1 for 19-treatment, 15.4 ± 0.1 for Mon-treatment, 12.8 ± 0.1 for 20-treatment, 13.8 ± 0.1 for UIR; [But]12 (mM): 7.45 ± 0.19 for 3-treatment, 7.0 ± 0.2 for 9-treatment, 7.9 ± 0.2 for 19-treatment, 5.3 ± 0.1 for Mon-treatment, 7.2 ± 0.2 for 20-treatment, 6.7 ± 0.2 for UIR; [But]96 (mM): 12.4 ± 0.3 for 3-treatment, 11.6 ± 0.3 for 9-treatment, 11.4 ± 0.3 for 19-treatment, 8.5 ± 0.2 for Mon-treatment, 8.5 ± 0.2 for 20-treatment, 8.3 ± 0.2 for UIR.