Peak Detection Method Evaluation for Ion Mobility Spectrometry by Using Machine Learning Approaches

Abstract
:1. Introduction

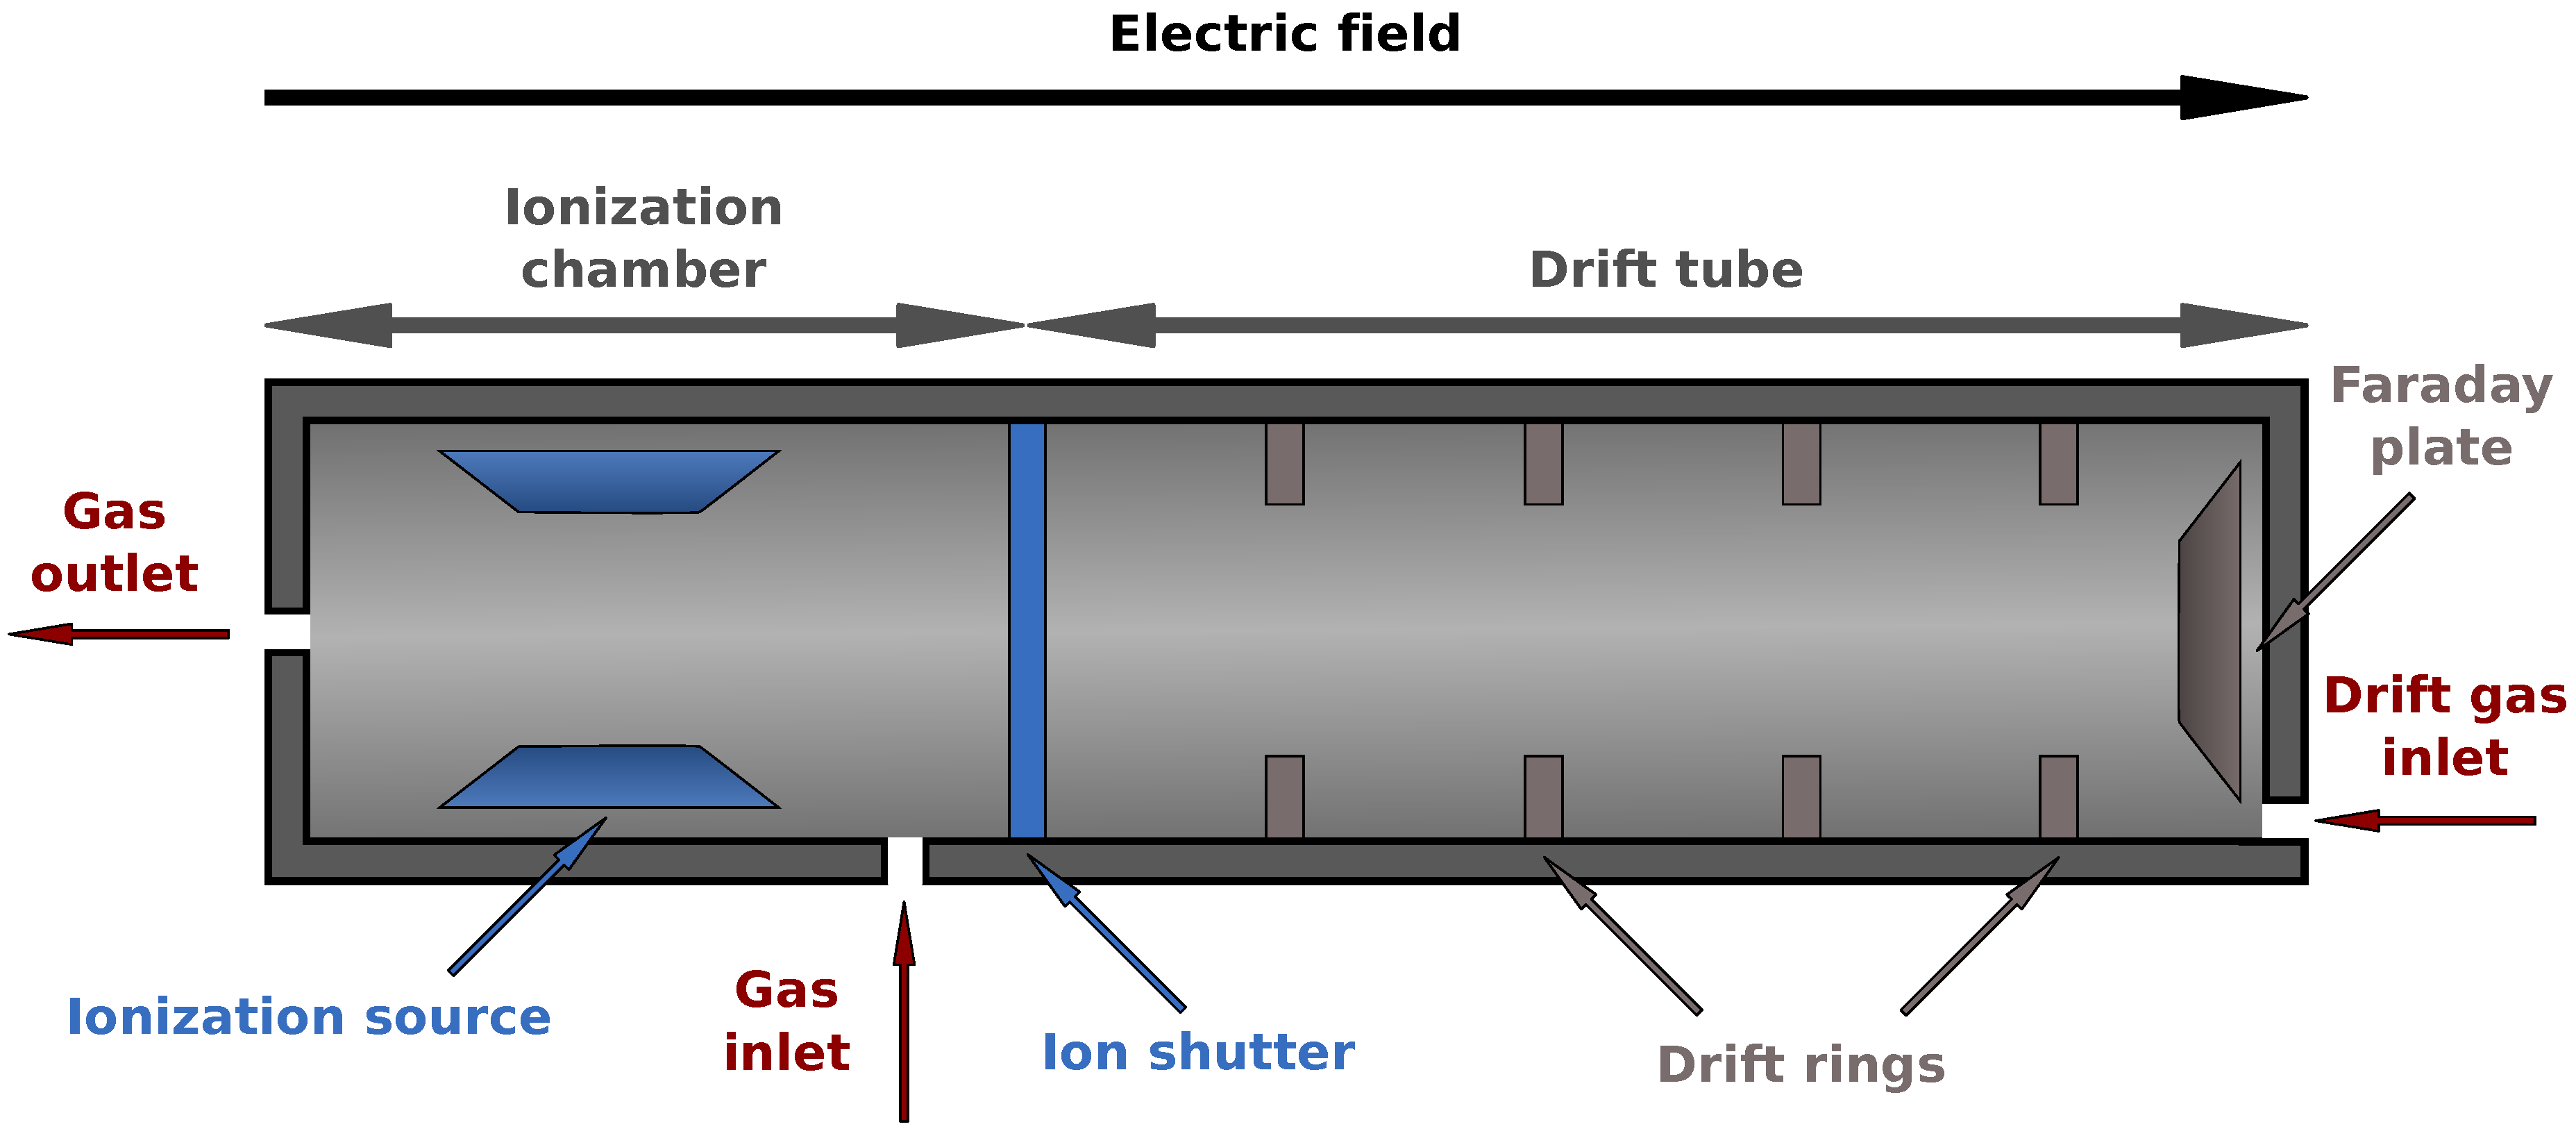
2. Preliminaries
2.1. MCC/IMS Devices
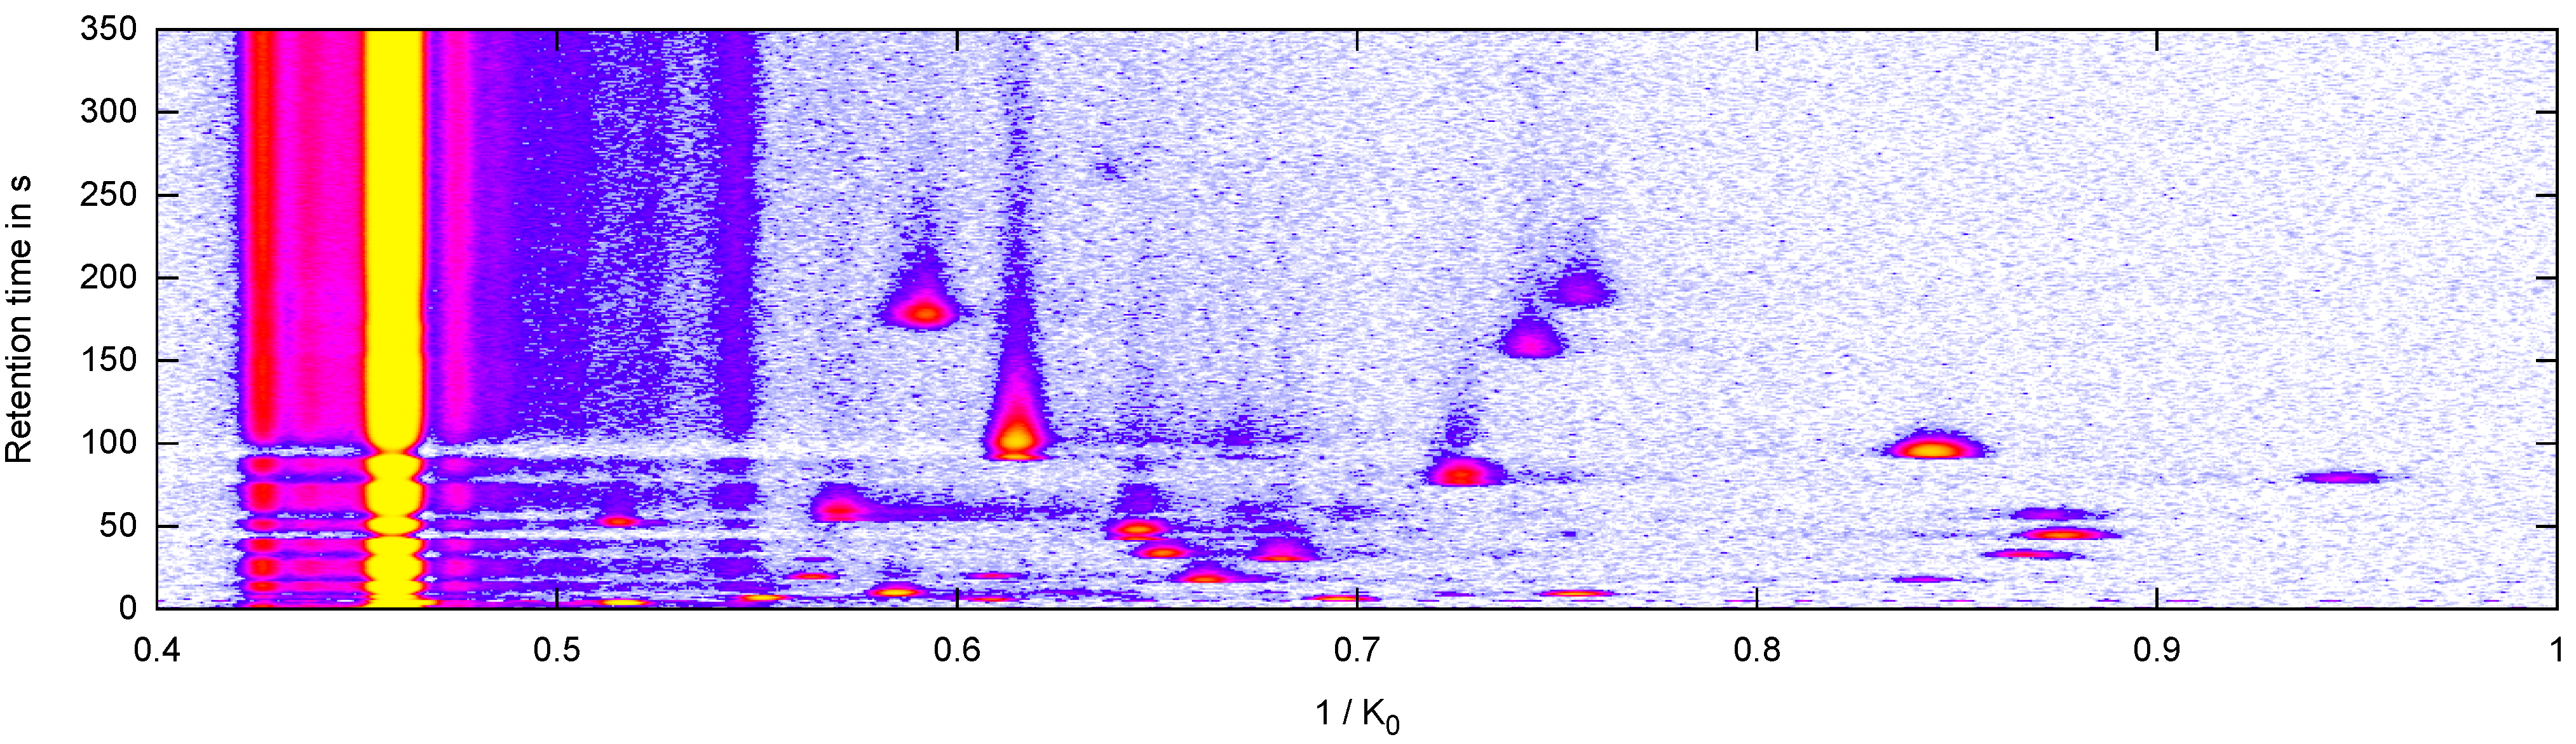
2.2. Data: Measurement and Peak Description
2.3. Homogenizing and Filtering a Set of Measurements
- Drift gas flow: 100 ± 5 mL/min
- Sample gas flow: 100 ± 5 mL/min
- Carrier gas flow: 150 ± 5 mL/min
- MCC temperature: 40 ± 2 °C
- Drift gas: the same value for all measurements in the set
- Polarity: the same value for all measurements in the set
2.4. Preprocessing an MCC/IMS Measurement
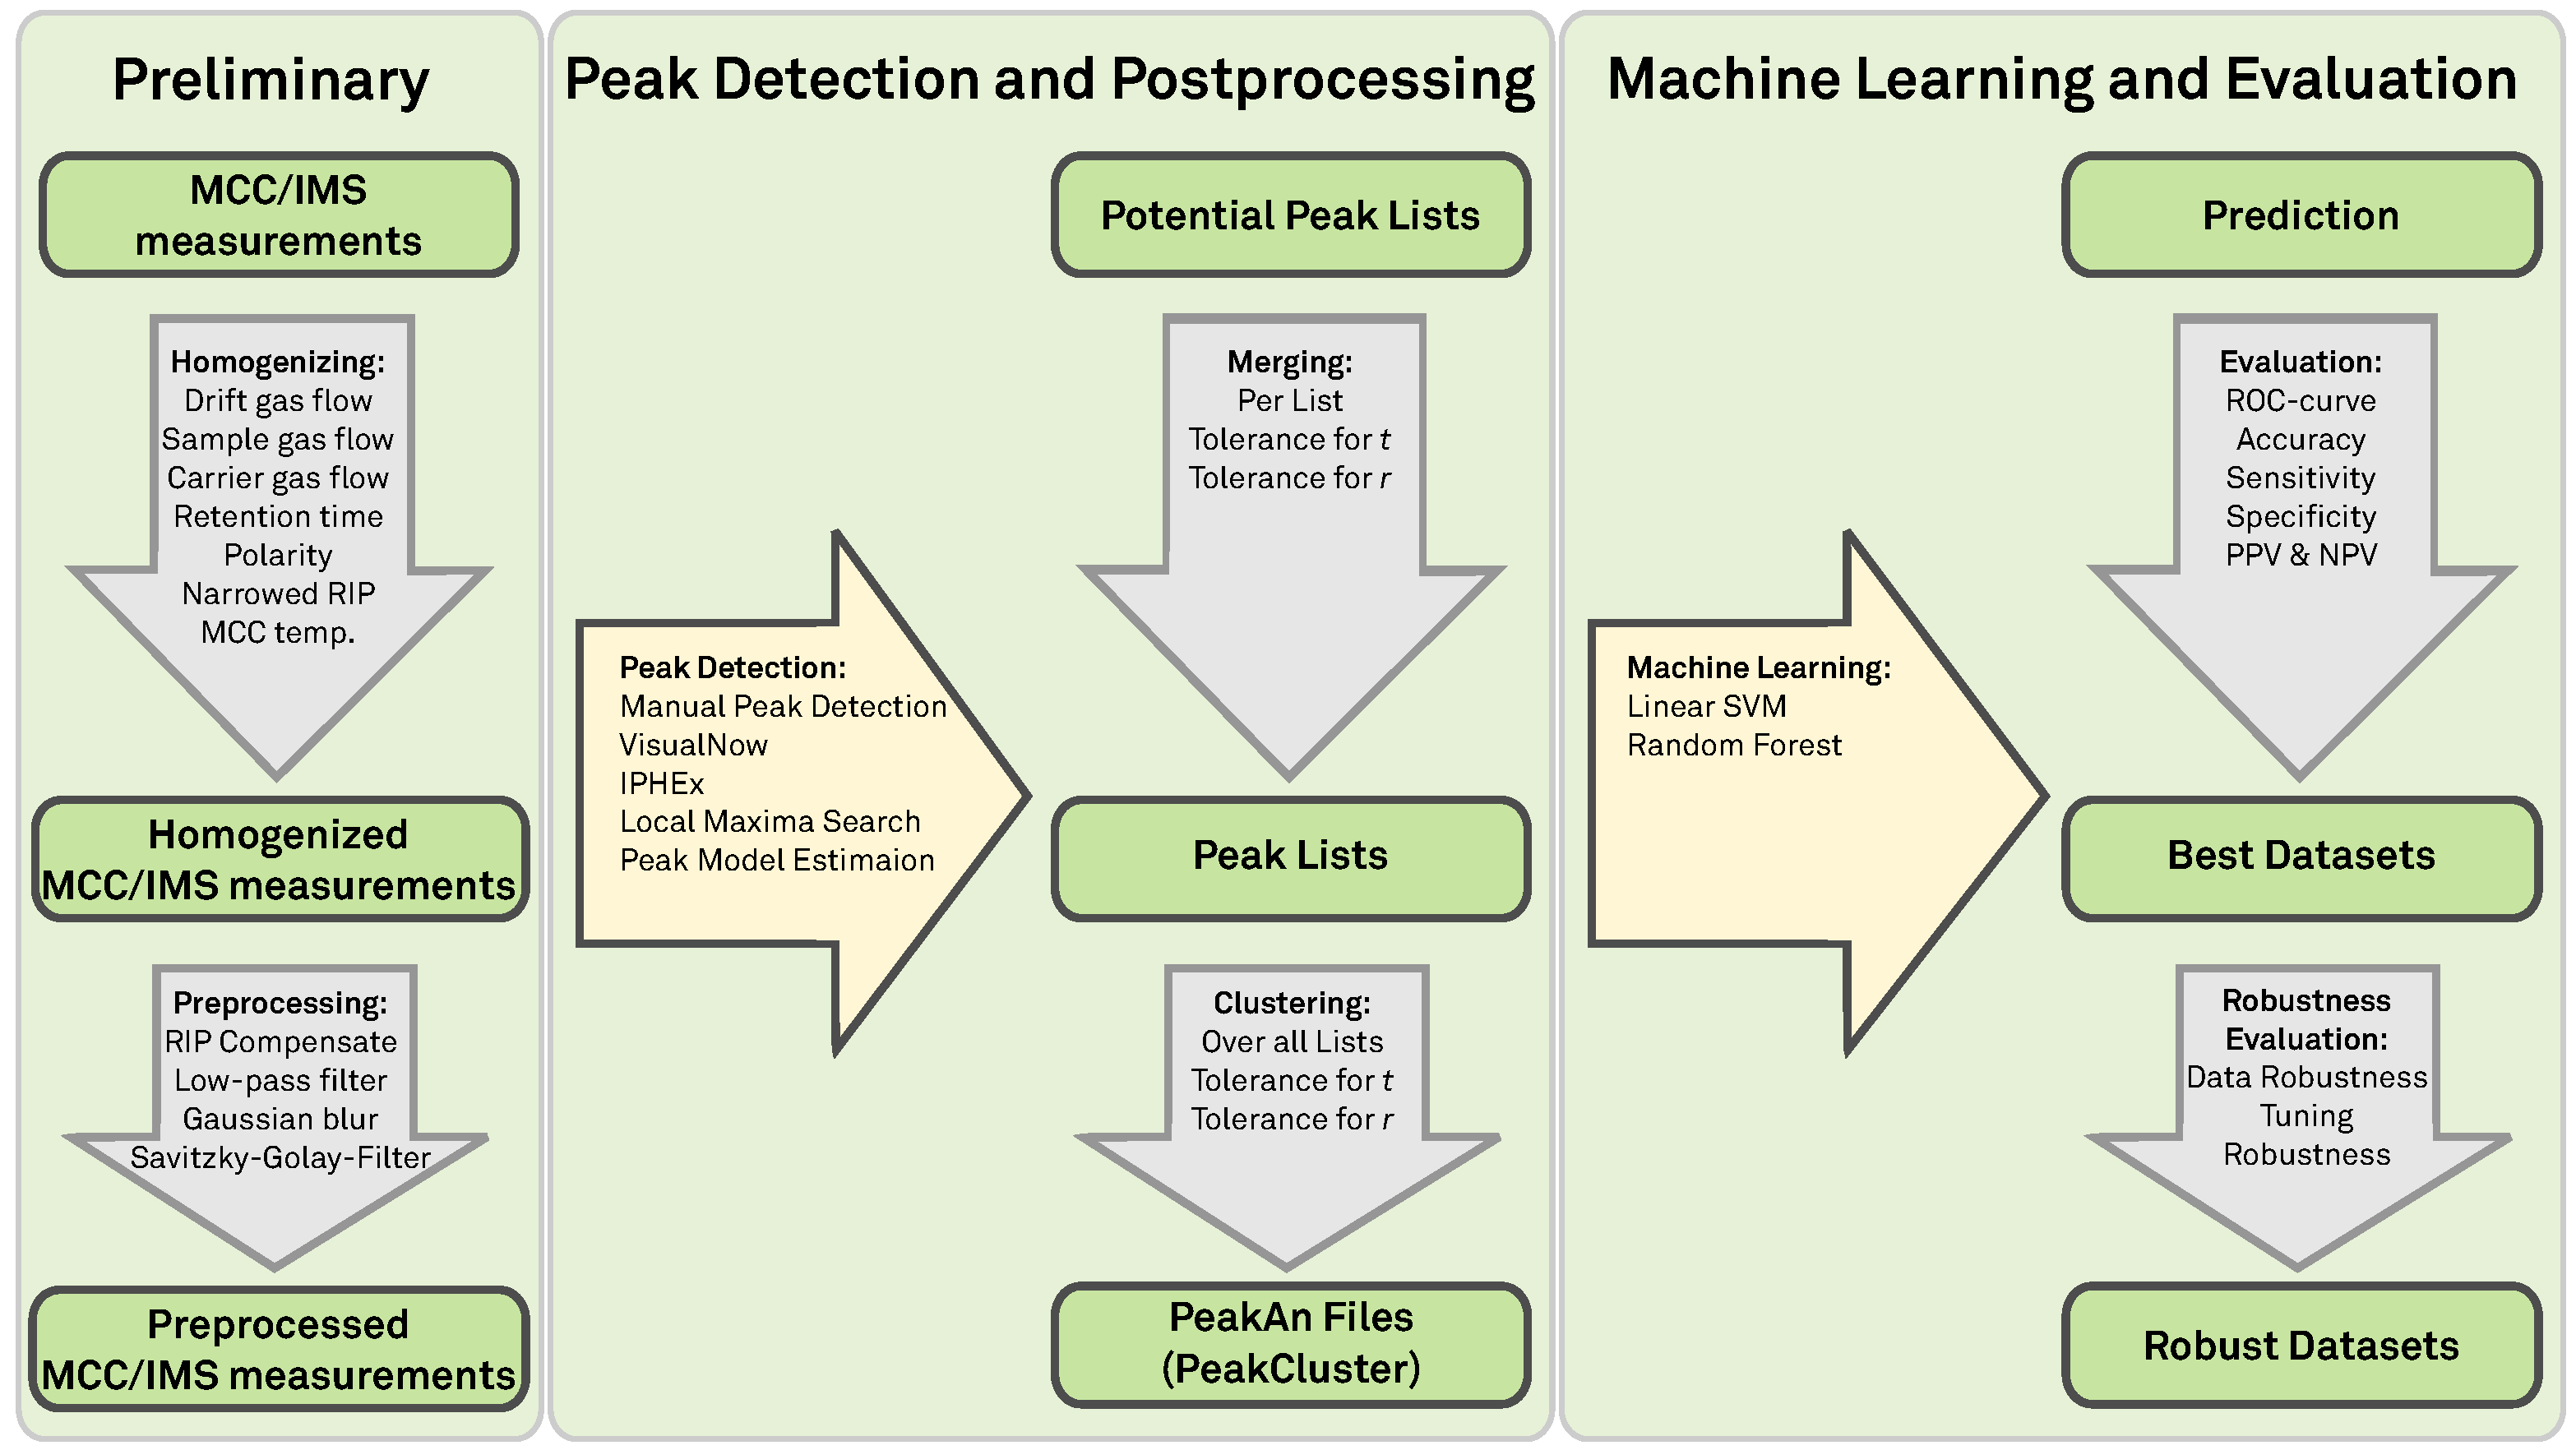
3. Methods
3.1. Peak Detection Methods
3.1.1. Manual Peak Detection in VisualNow
3.1.2. Automated Local Maxima Search
3.1.3. Automated Peak Detection in VisualNow
3.1.4. Automated Peak Detection in IPHEx
3.1.5. Peak Model Estimation
3.1.6. Postprocessing
3.2. Evaluation Methods
3.2.1. Peak Position Comparison
3.2.2. Machine Learning and Evaluation
4. Results and Discussion

| # Peaks | # Peak Clusters | |
|---|---|---|
| Manual VisualNow | 1661 | 41 |
| Local Maxima Search | 1477 | 69 |
| Automatic VisualNow | 4292 | 88 |
| Automatic IPHEX | 5697 | 420 |
| Peak Model Estimation | 1358 | 69 |
| Manual | LMS | VisualNow | IPHEx | PME | |
|---|---|---|---|---|---|
| Manual | 1661 | 911 | 1522 | 1184 | 791 |
| Local Maxima | 868 | 1477 | 1096 | 1074 | 1128 |
| VisualNow | 2667 | 2233 | 4292 | 2341 | 2082 |
| IPHEx | 1112 | 1009 | 1157 | 5697 | 912 |
| PME | 737 | 1086 | 983 | 926 | 1358 |
4.1. Peak Position Comparision
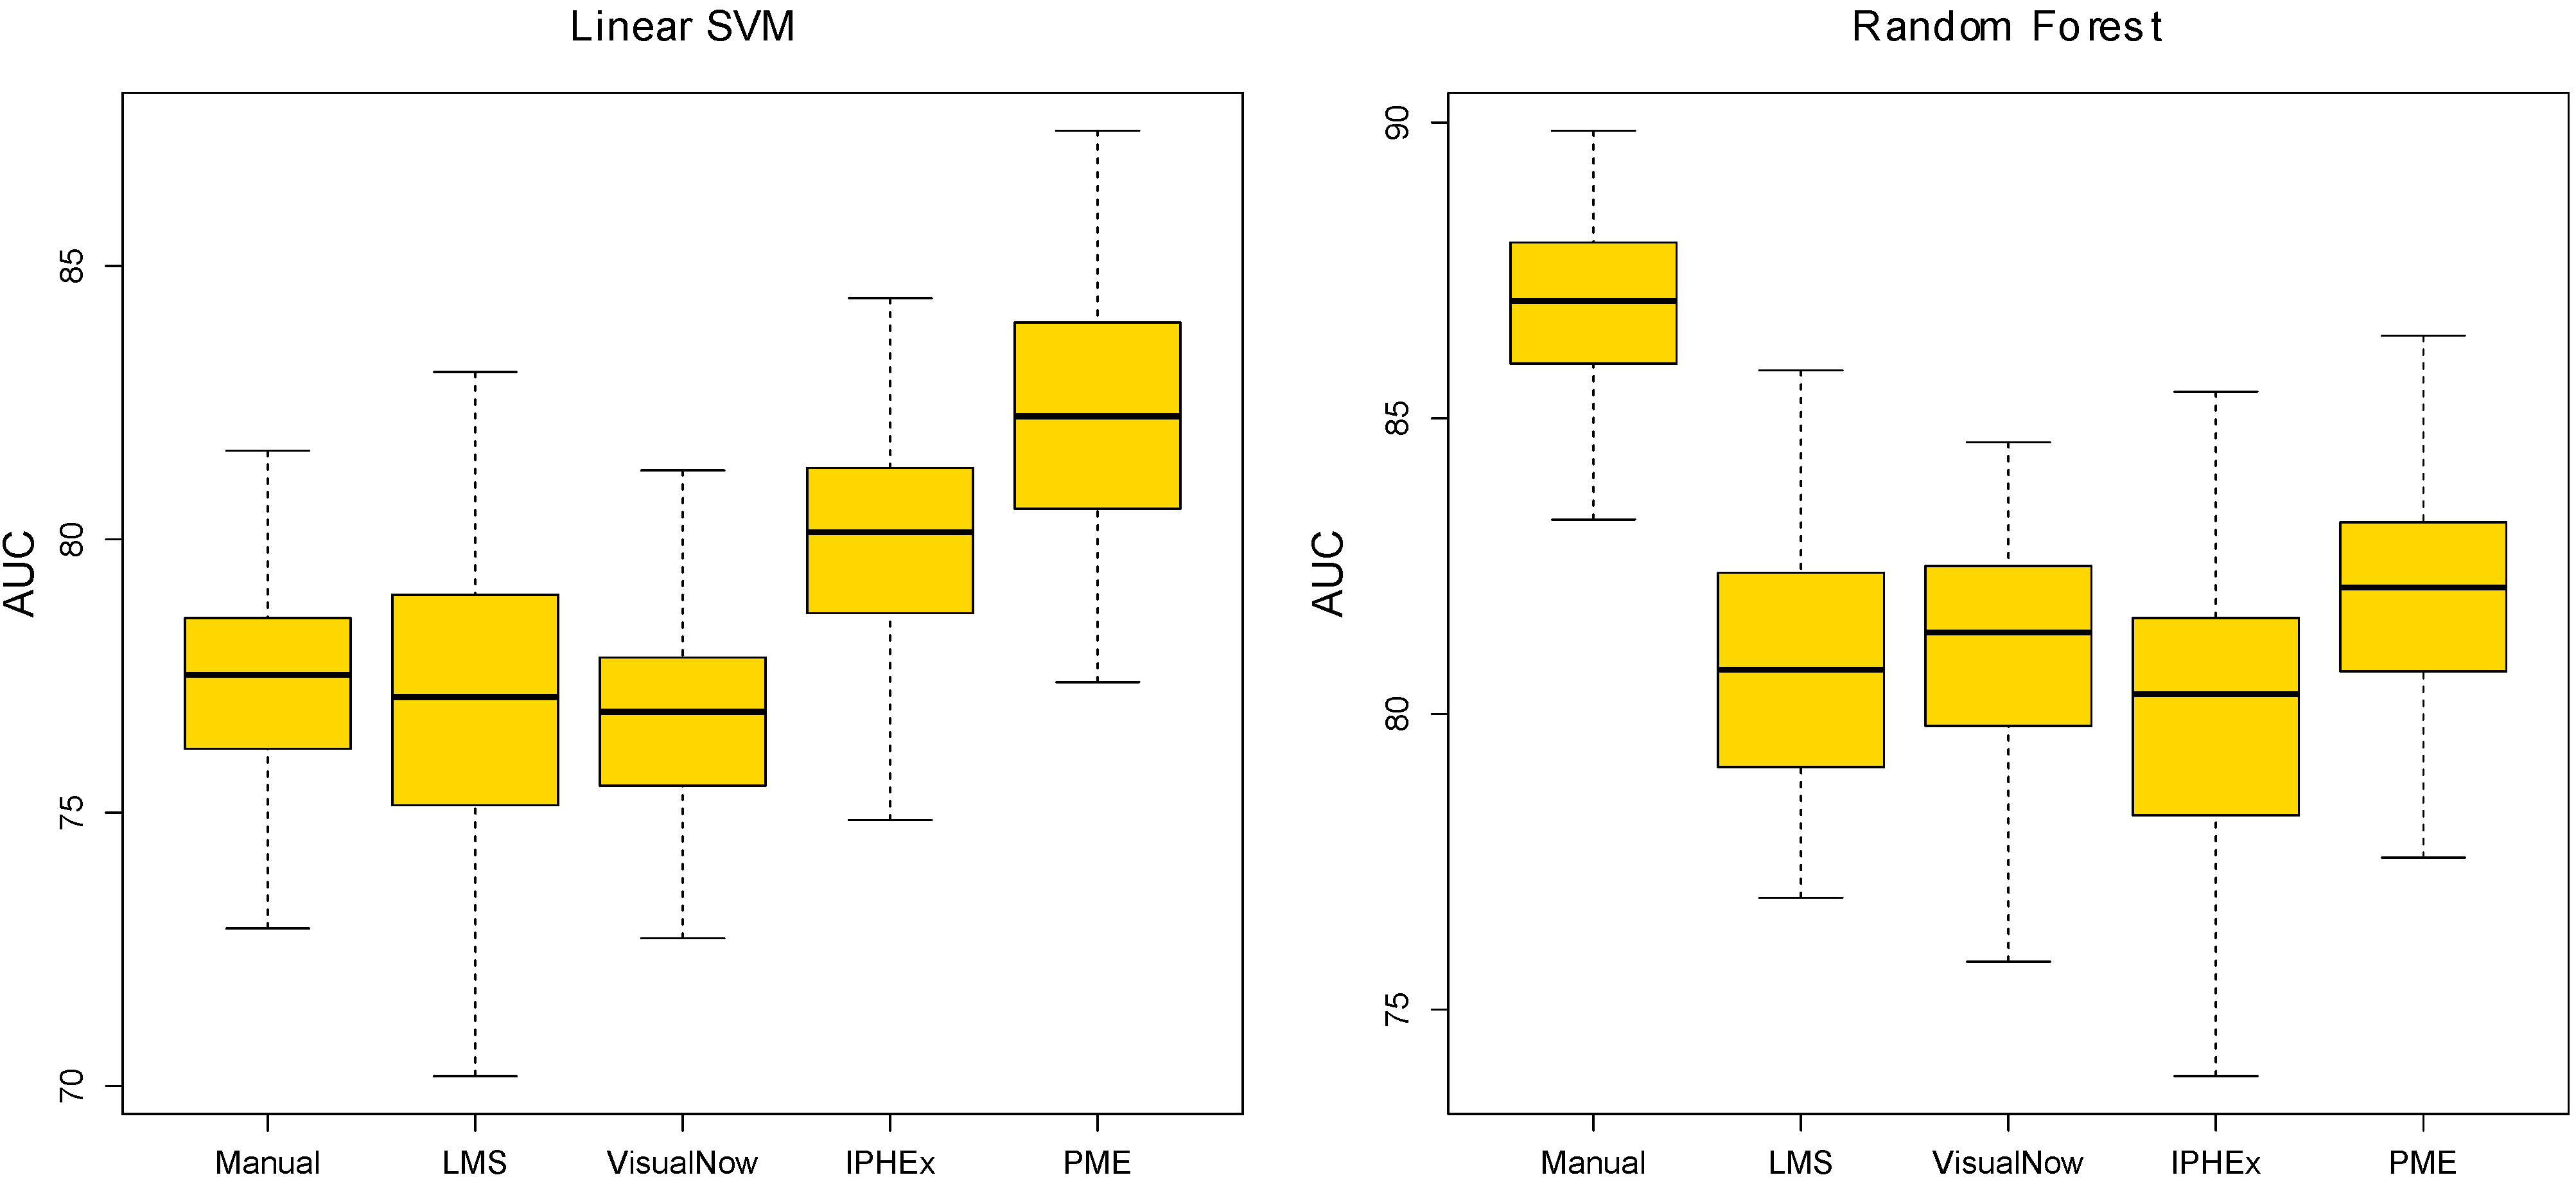
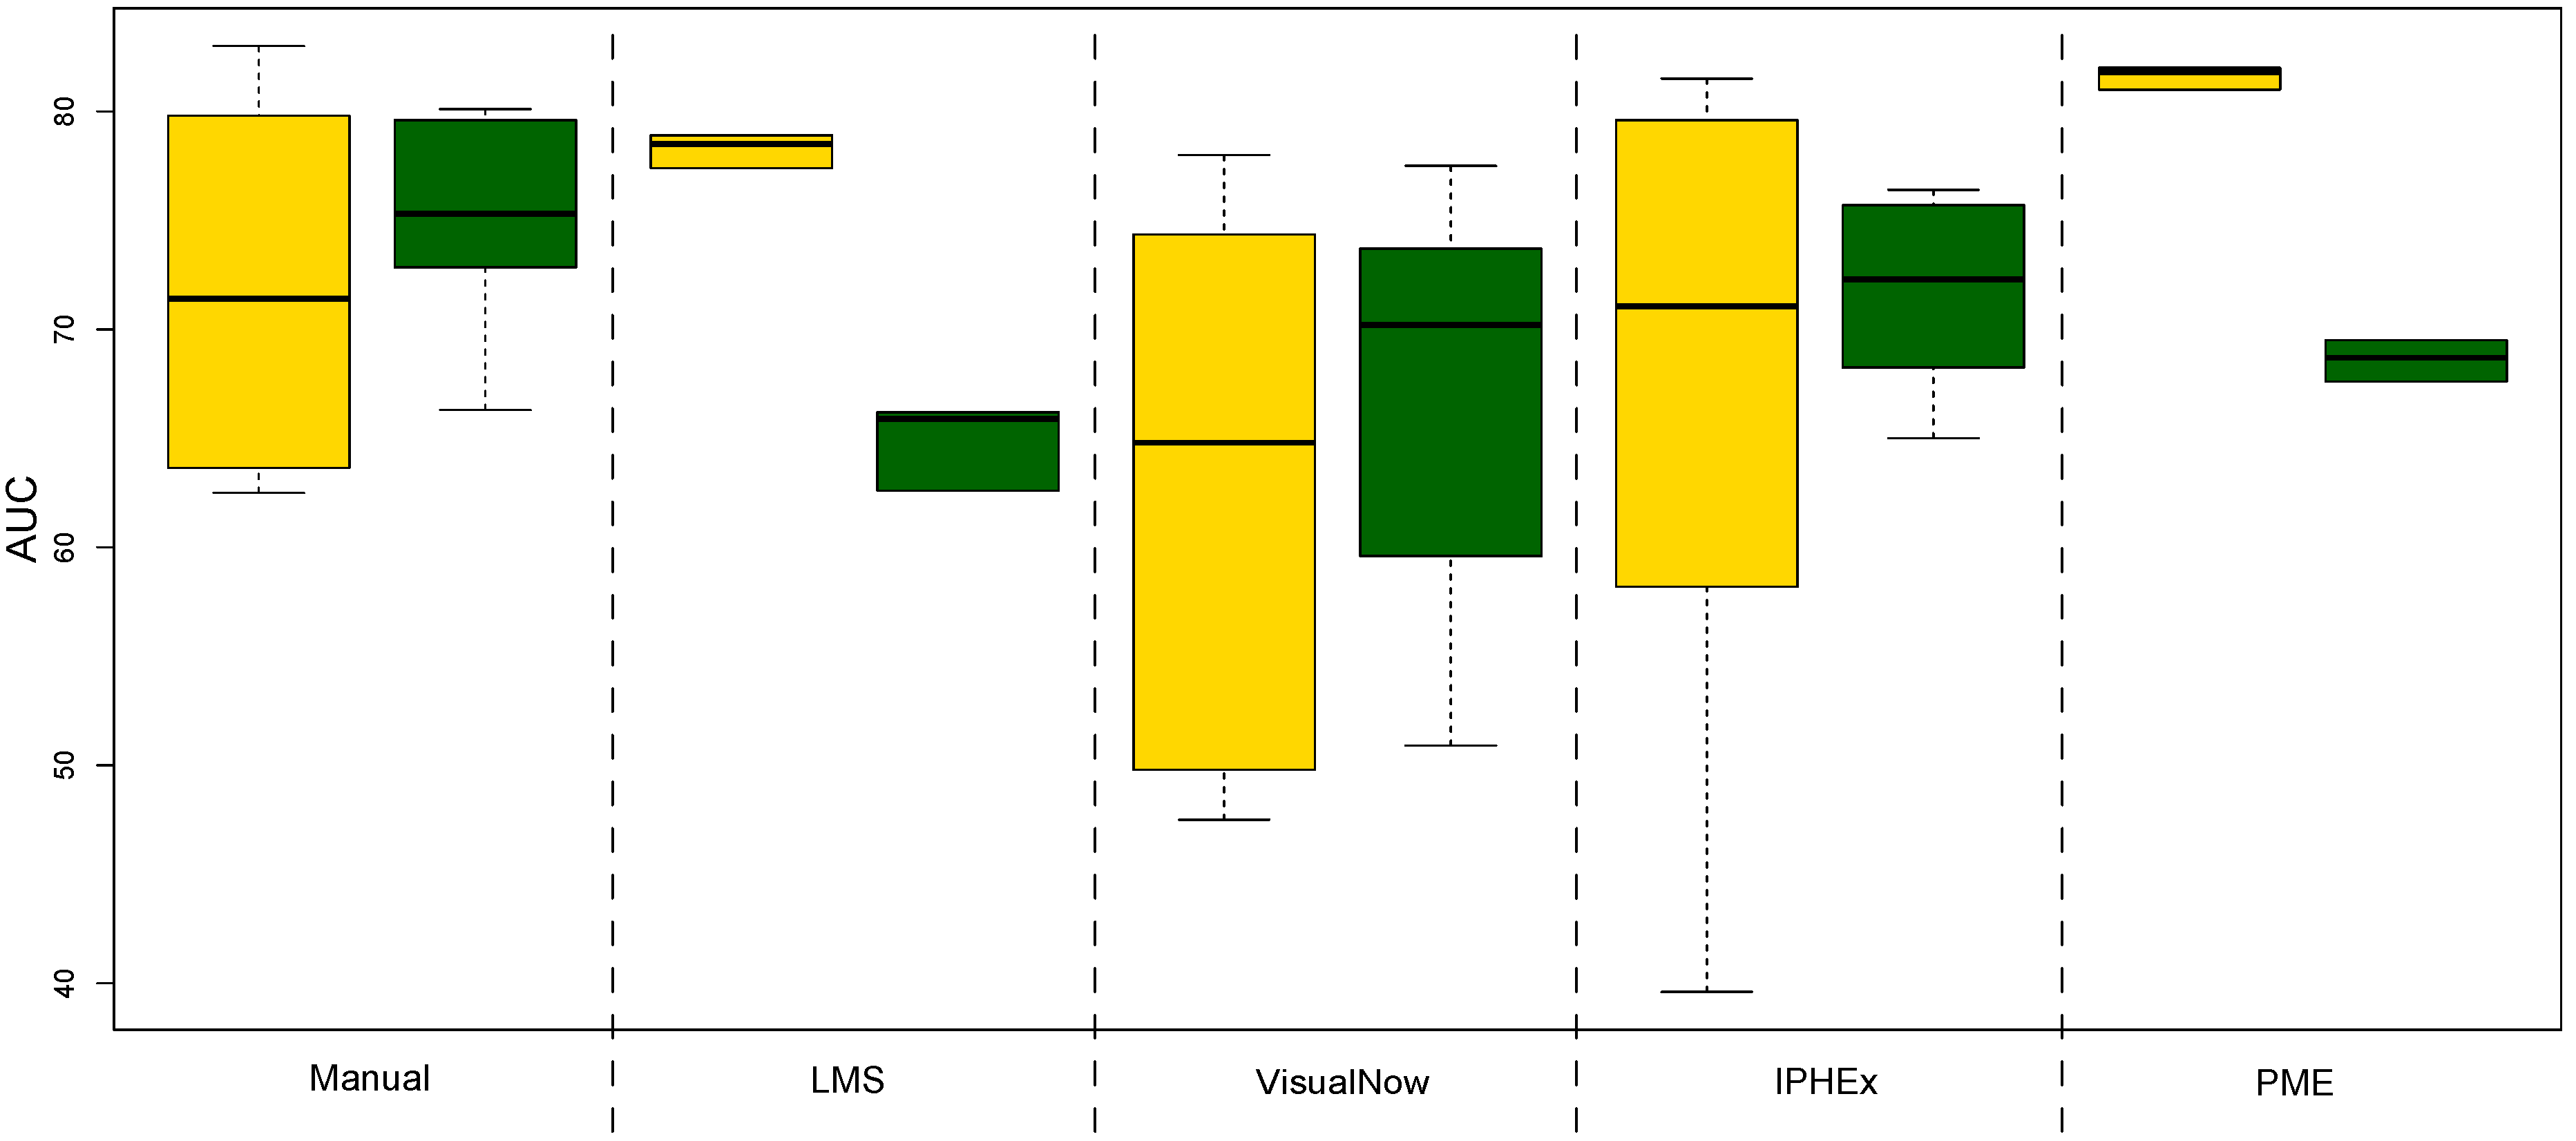
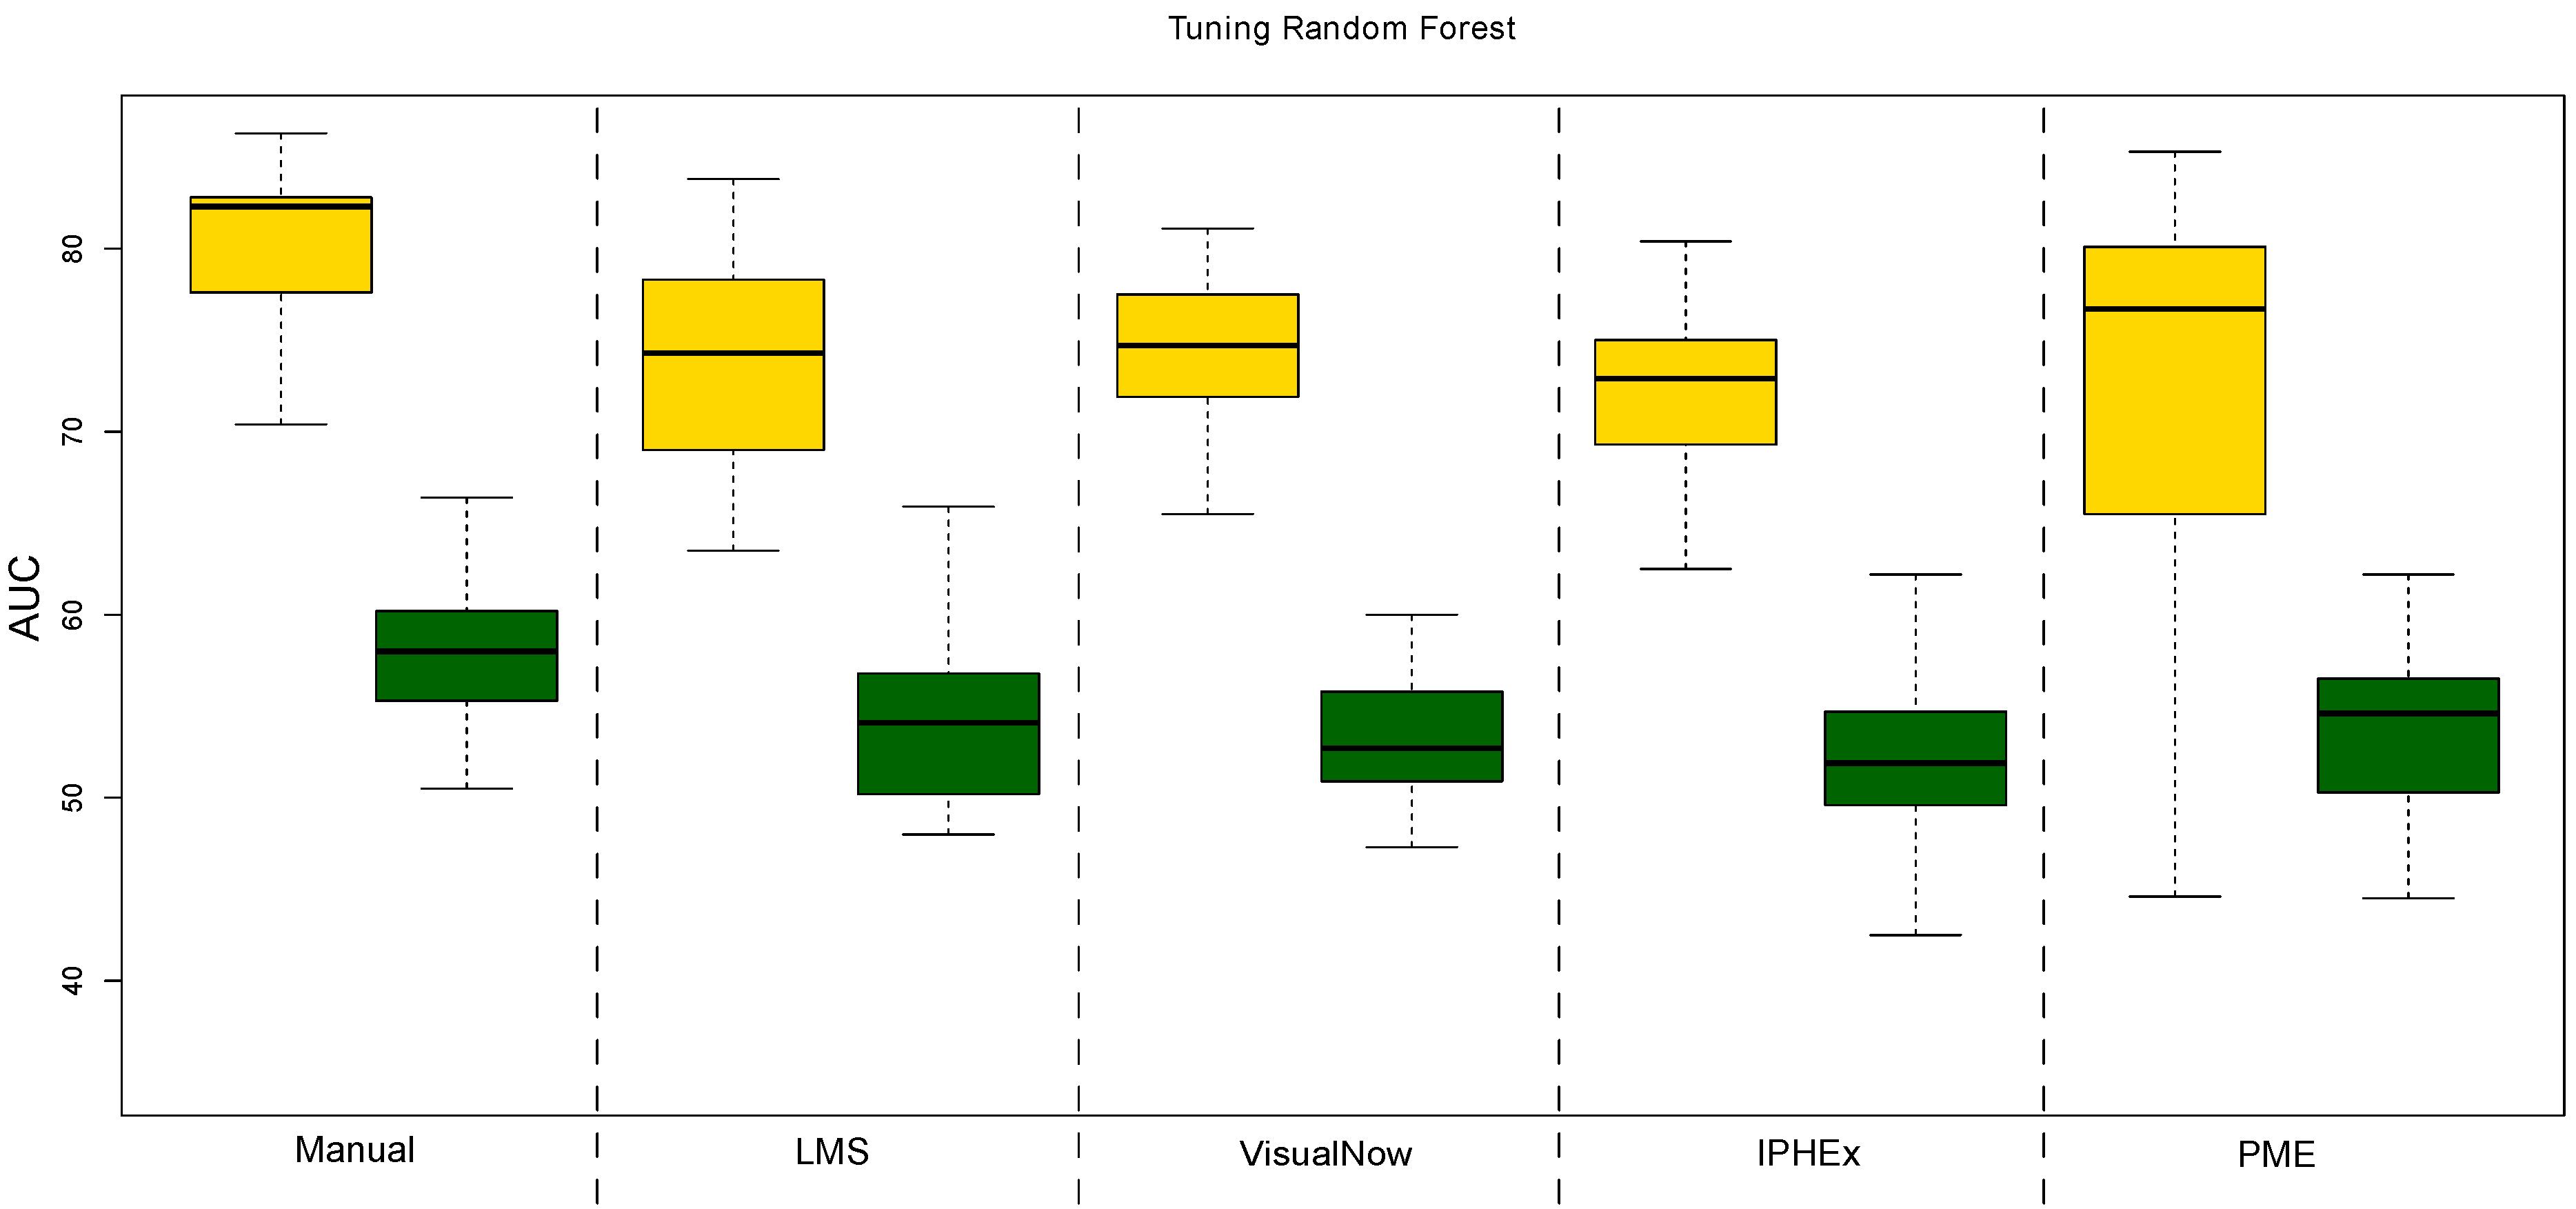
4.2. Evaluation by using Statistical Learning
| AUC | ACC | Sensitivity | Specificity | PPV | NPV | |
|---|---|---|---|---|---|---|
| Manual VisualNow | 77.4 | 70.9 | 69.7 | 72.4 | 75.7 | 65.9 |
| Local Maxima Search | 77 | 67.8 | 70.6 | 64.4 | 71 | 64 |
| Automatic VisualNow | 76.6 | 68.3 | 66.8 | 70.1 | 73.4 | 63.1 |
| Automatic IPHEx | 79.8 | 73 | 70.5 | 76 | 78.4 | 67.6 |
| Peak Model Estimation | 82.2 | 72.2 | 77.2 | 66.1 | 73.7 | 70.1 |
| AUC | ACC | Sensitivity | Specificity | PPV | NPV | |
|---|---|---|---|---|---|---|
| Manual VisualNow | 86.9 | 76.3 | 78.7 | 73.4 | 78.5 | 73.6 |
| Local Maxima Search | 80.8 | 70.5 | 75 | 64.9 | 72.5 | 67.8 |
| Automatic VisualNow | 81.1 | 71.9 | 75.6 | 67.3 | 74.1 | 69.1 |
| Automatic IPHEx | 80 | 68.9 | 72.8 | 64 | 71.4 | 65.6 |
| Peak Model Estimation | 81.9 | 74.2 | 81.6 | 65 | 74.2 | 74.1 |


5. Conclusions
Acknowledgements
References
- Westhoff, M.; Litterst, P.; Maddula, S.; Bödeker, B.; Baumbach, J.I. Statistical and bioinformatical methods to differentiate chronic obstructive pulmonary disease (COPD) including lung cancer from healthy control by breath analysis using ion mobility spectrometry. Int. J. Ion Mobil. Spectrom. 2011, 14, 1–11. [Google Scholar] [CrossRef]
- Baumbach, J.I.; Westhoff, M. Ion mobility spectrometry to detect lung cancer and airway infections. Spectrosc. Eur. 2006, 18, 22–27. [Google Scholar]
- Perl, T.; Juenger, M.; Vautz, W.; Nolte, J.; Kuhns, M.; Zepelin, B.; Quintel, M. Detection of characteristic metabolites of Aspergillus fumigatus and Candida species using ion mobility spectrometry-metabolic profiling by volatile organic compounds. Mycoses 2011, 54, 828–837. [Google Scholar] [CrossRef]
- Ruzsanyi, V.; Mochalski, P.; Schmid, A.; Wiesenhofer, H.; Klieber, M.; Hinterhuber, H.; Amann, A. Ion mobility spectrometry for detection of skin volatiles. J. Chromatogr. B 2012, 911, 84–92. [Google Scholar] [CrossRef]
- Ruzsanyi, V.; Baumbach, J.I.; Sielemann, S.; Litterst, P.; Westhoff, M.; Freitag, L. Detection of human metabolites using multi-capillary columns coupled to ion mobility spectrometers. J. Chromatogr. A 2005, 1084, 145–151. [Google Scholar] [CrossRef]
- Baumbach, J.I. Ion mobility spectrometry coupled with multi-capillary columns for metabolic profiling of human breath. J. Breath Res. 2009, 3, 1–16. [Google Scholar]
- B & S Analytik GmbH. Available online: http://www.bs-analytik.de/ (accessed on 15 March 2013).
- Purkhart, R.; Hillmann, A.; Graupner, R.; Becher, G. Detection of characteristic clusters in IMS-Spectrograms of exhaled air polluted with environmental contaminants. Int. J. Ion Mobil. Spectrom. 2012, 15, 1–6. [Google Scholar] [CrossRef]
- Bödeker, B.; Vautz, W.; Baumbach, J.I. Peak finding and referencing in MCC/IMS-data. Int. J. Ion Mobil. Spectrom. 2008, 11, 83–87. [Google Scholar] [CrossRef]
- Bunkowski, A. MCC-IMS data analysis using automated spectra processing and explorative visualisation methods. PhD thesis, University Bielefeld, Bielefeld, Germany, 2011. [Google Scholar]
- Kopczynski, D.; Baumbach, J.I.; Rahmann, S. Peak Modeling for Ion Mobility Spectrometry Measurements. In Proceedings of 20th European Signal Processing Conference, Bucharest, Romania, 27–31 August 2012.
- Vogtland, D.; Baumbach, J.I. Breit-Wigner-function and IMS-signals. Int. J. Ion Mobil. Spectrom. 2009, 12, 109–114. [Google Scholar] [CrossRef]
- Bader, S. Identification and Quantification of Peaks in Spectrometric Data. PhD thesis, TU Dortmund, Dortmund, Germany, 2008. [Google Scholar]
- Nixon, M.; Aguado, A.S. Feature Extraction & Image Processing, 2nd ed.; Academic Press: Waltham, MA, USA, 2008. [Google Scholar]
- Savitzky, A.; Golay, M. Smoothing and differentiation of data by simplified least squares procedures. Anal. Chem. 1964, 36, 1627–1639. [Google Scholar] [CrossRef]
- Hastie, T.; Tibshirani, R.; Friedman, J. The Elements of Statistical Learning: Data Mining, Inference, and Prediction; Springer: Berlin/Heidelberg, Germany, 2009. [Google Scholar]
- Bader, S.; Urfer, W.; Baumbach, J.I. Reduction of ion mobility spectrometry data by clustering characteristic peak structures. J. Chemom. 2007, 20, 128–135. [Google Scholar] [CrossRef]
- Vincent, L.; Soille, P. Watersheds in digital spaces: An efficient algorithm based on immersion simulations. IEEE Trans. Pattern Anal. Mach. Intell. 1991, 13, 583–598. [Google Scholar] [CrossRef]
- Fong, S.S.; Rearden, P.; Kanchagar, C.; Sassetti, C.; Trevejo, J.; Brereton, R.G. Automated peak detection and matching algorithm for gas chromatography-differential mobility spectrometry. Anal. Chem. 2011, 83, 1537–1546. [Google Scholar] [CrossRef]
- Boser, B.; Guyon, I.; Vapnik, V. A training algorithm for optimal margin classifiers. In Proceedings of the Fifth Annual Workshop on Computational Learning Theory, Pittsburgh, USA, 27–29 July 1992; pp. 144–152.
- Dimitriadou, E.; Hornik, K.; Leisch, F.; Meyer, D.; Weingessel, A. e1071: Misc Functions of the Department of Statistics (e1071), TU Wien; TU Wien: Vienna, Austria, 2010. [Google Scholar]
- Liaw, A.; Wiener, M. Classification and regression by randomforest. R News 2002, 2, 18–22. [Google Scholar]
- Robin, X.; Turck, N.; Hainard, A.; Tiberti, N.; Lisacek, F.; Sanchez, J.; M., M. pROC: An open-source package for R and S+ to analyze and compare ROC curves. BMC Bioinforma. 2011, 12, 77. [Google Scholar] [CrossRef]
- Ion Mobility Spectroscopy Analysis with Restricted Resources Home Page. Available online: http://www.rahmannlab.de/research/ims (accessed on 15 March 2013).
- Collaborative Research Center SFB 876 -Providing Information by Resource-Constrained Data Analysis. Available online: http://sfb876.tu-dortmund.de (accessed on 15 March 2013).
Appendix
© 2013 by the authors; licensee MDPI, Basel, Switzerland. This article is an open access article distributed under the terms and conditions of the Creative Commons Attribution license (http://creativecommons.org/licenses/by/3.0/).
Share and Cite
Hauschild, A.-C.; Kopczynski, D.; D'Addario, M.; Baumbach, J.I.; Rahmann, S.; Baumbach, J. Peak Detection Method Evaluation for Ion Mobility Spectrometry by Using Machine Learning Approaches. Metabolites 2013, 3, 277-293. https://doi.org/10.3390/metabo3020277
Hauschild A-C, Kopczynski D, D'Addario M, Baumbach JI, Rahmann S, Baumbach J. Peak Detection Method Evaluation for Ion Mobility Spectrometry by Using Machine Learning Approaches. Metabolites. 2013; 3(2):277-293. https://doi.org/10.3390/metabo3020277
Chicago/Turabian StyleHauschild, Anne-Christin, Dominik Kopczynski, Marianna D'Addario, Jörg Ingo Baumbach, Sven Rahmann, and Jan Baumbach. 2013. "Peak Detection Method Evaluation for Ion Mobility Spectrometry by Using Machine Learning Approaches" Metabolites 3, no. 2: 277-293. https://doi.org/10.3390/metabo3020277
APA StyleHauschild, A.-C., Kopczynski, D., D'Addario, M., Baumbach, J. I., Rahmann, S., & Baumbach, J. (2013). Peak Detection Method Evaluation for Ion Mobility Spectrometry by Using Machine Learning Approaches. Metabolites, 3(2), 277-293. https://doi.org/10.3390/metabo3020277